


What To Include in an AI Reporting Example Template
A strong AI reporting example should show how artificial intelligence transforms raw datasets into clear, visual insights you can actually use.
The sections below break down what a complete AI-powered report looks like and how each part supports better decision-making, smoother workflows, and more data-driven business processes.
1. Performance Summary
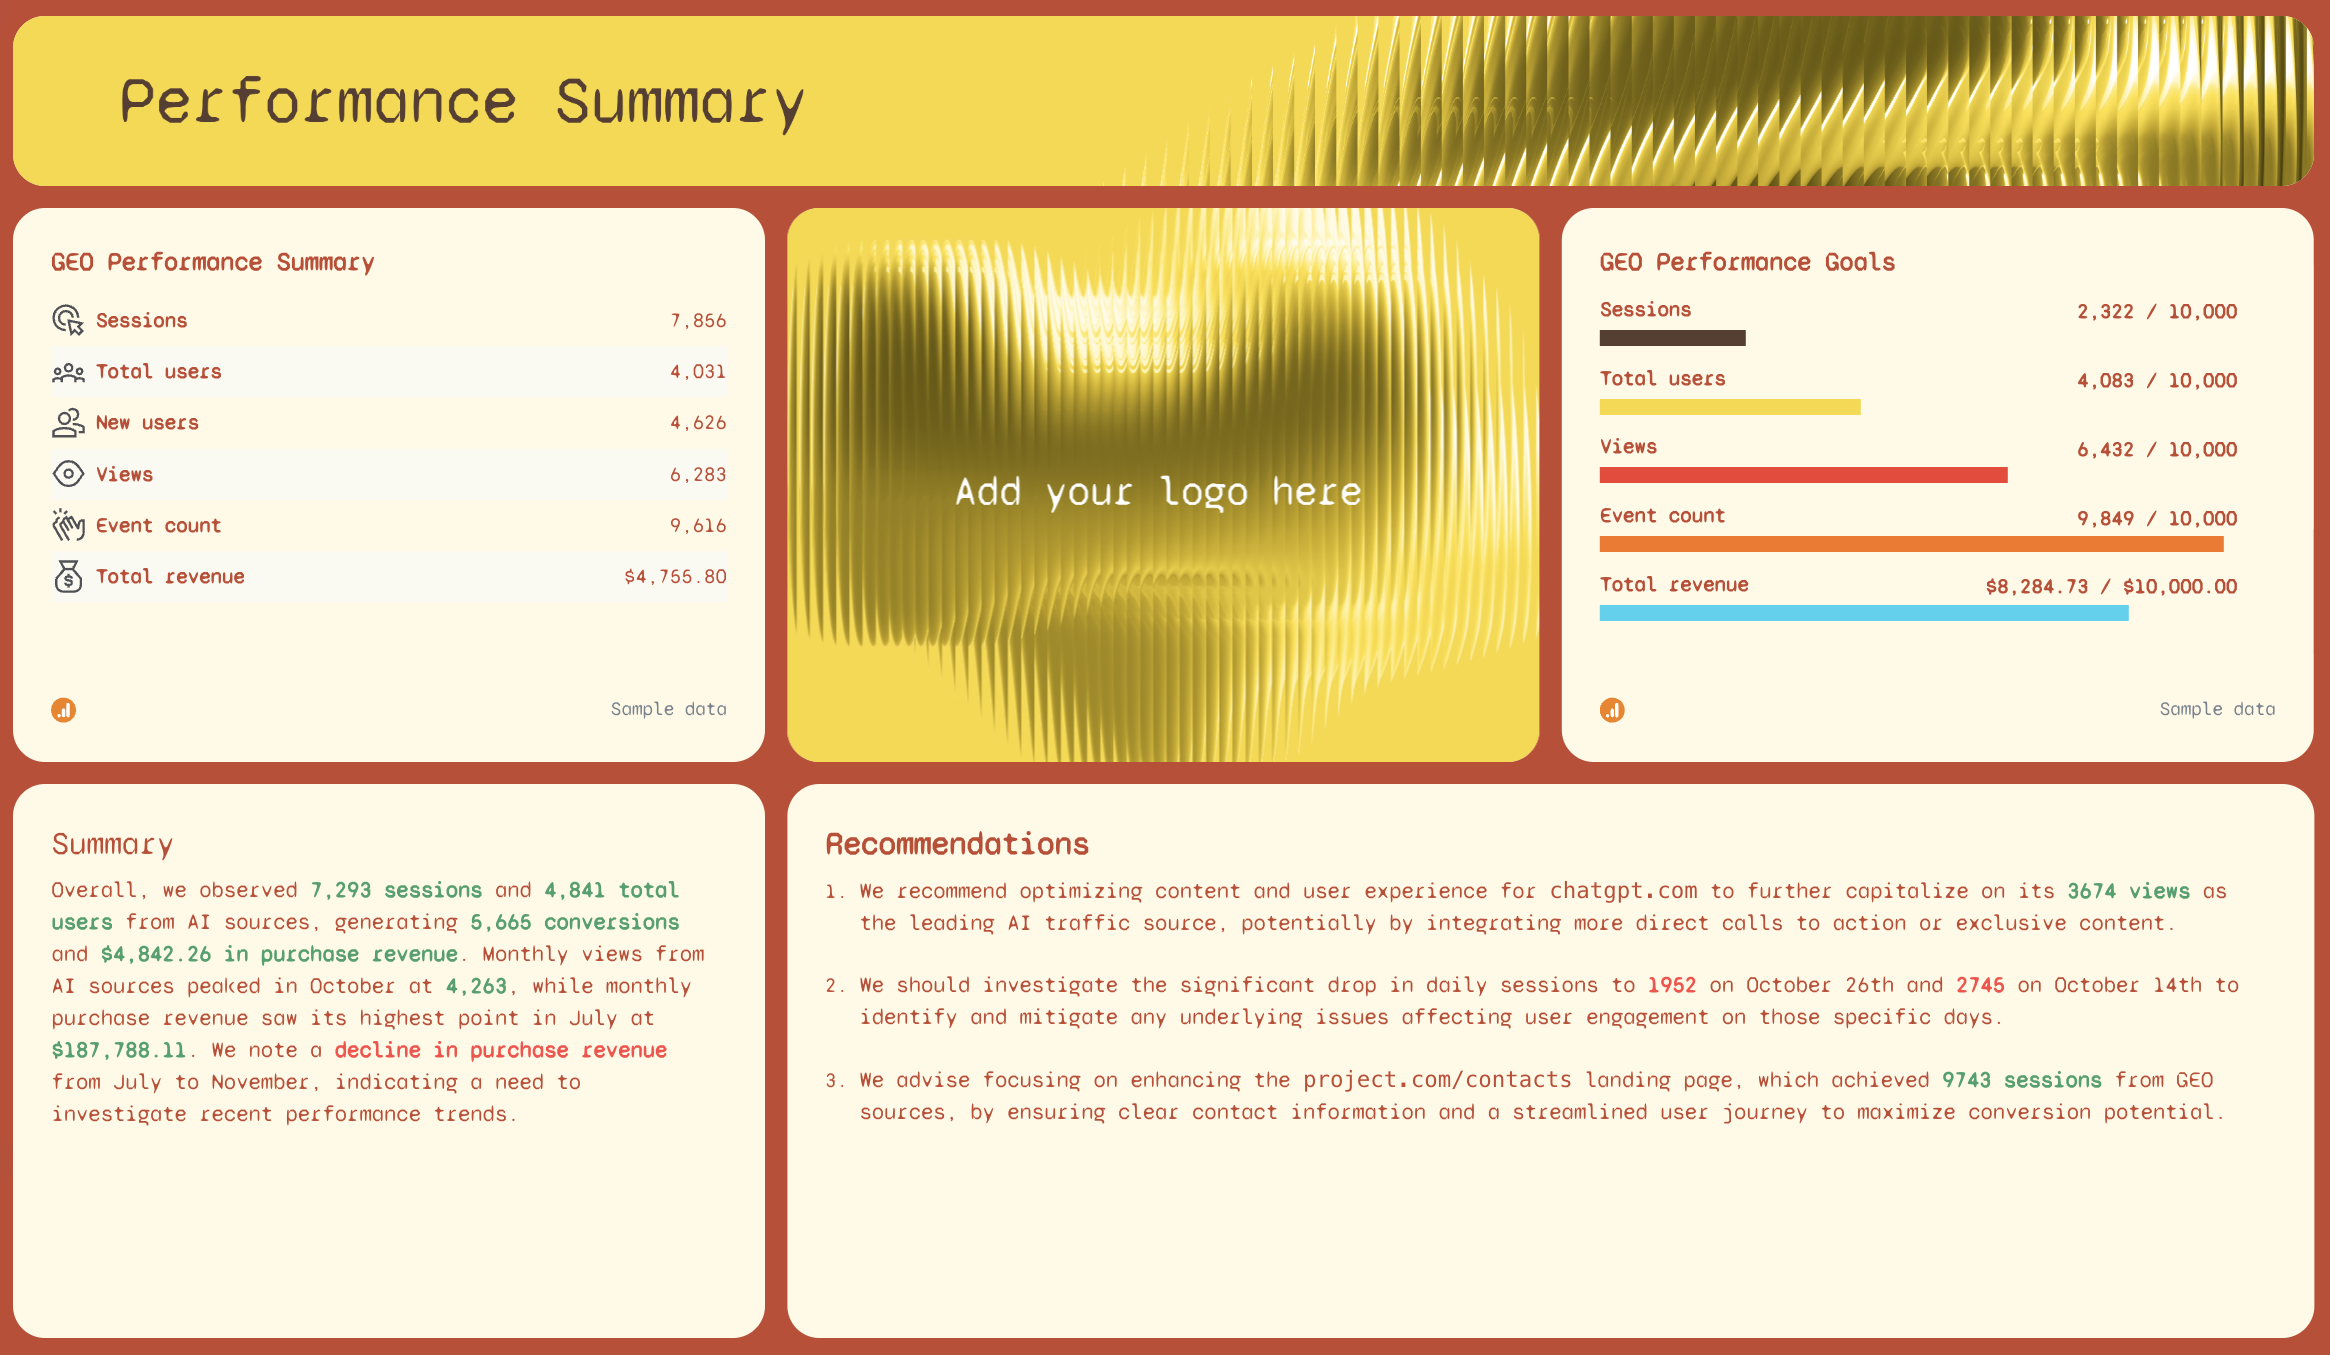
Start with a high-level snapshot of your key metrics so readers instantly understand how things are trending. This section works like an AI-powered executive overview: sessions, users, new users, views, event counts, and revenue are all displayed in one place for quick interpretation.
Alongside the KPI list, include your performance goals or targets for context. These help stakeholders understand where you’re tracking ahead and where you might need to optimize.
Add AI-generated summaries and recommendations to turn complex data points into actionable insights. This eliminates repetitive tasks and gives your team high-quality outputs without heavy manual work.
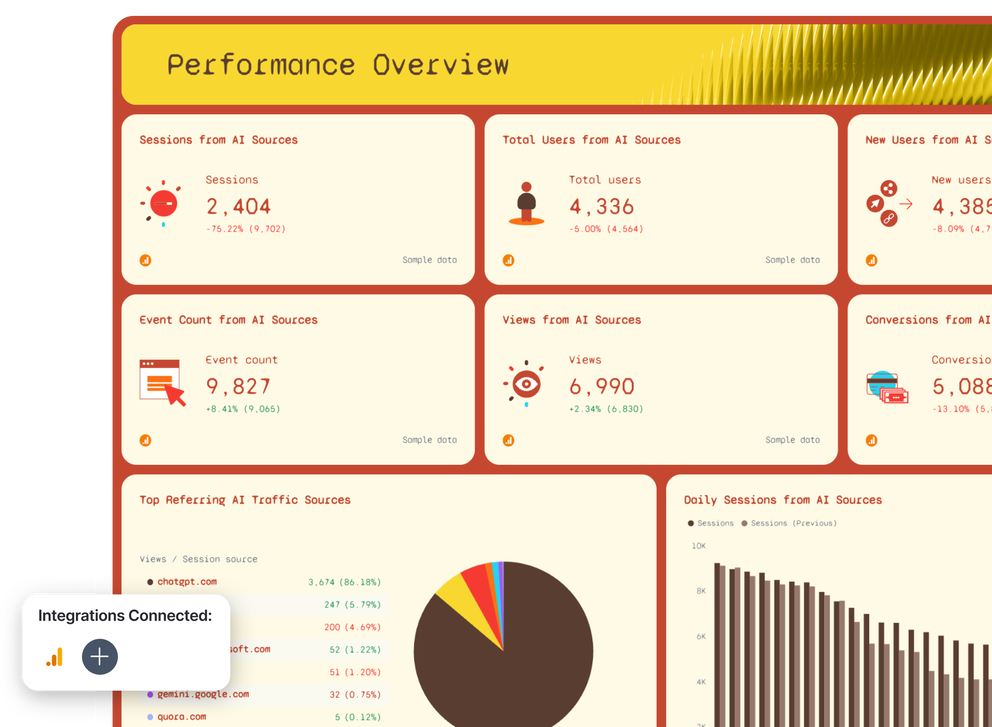
2. Performance Overview
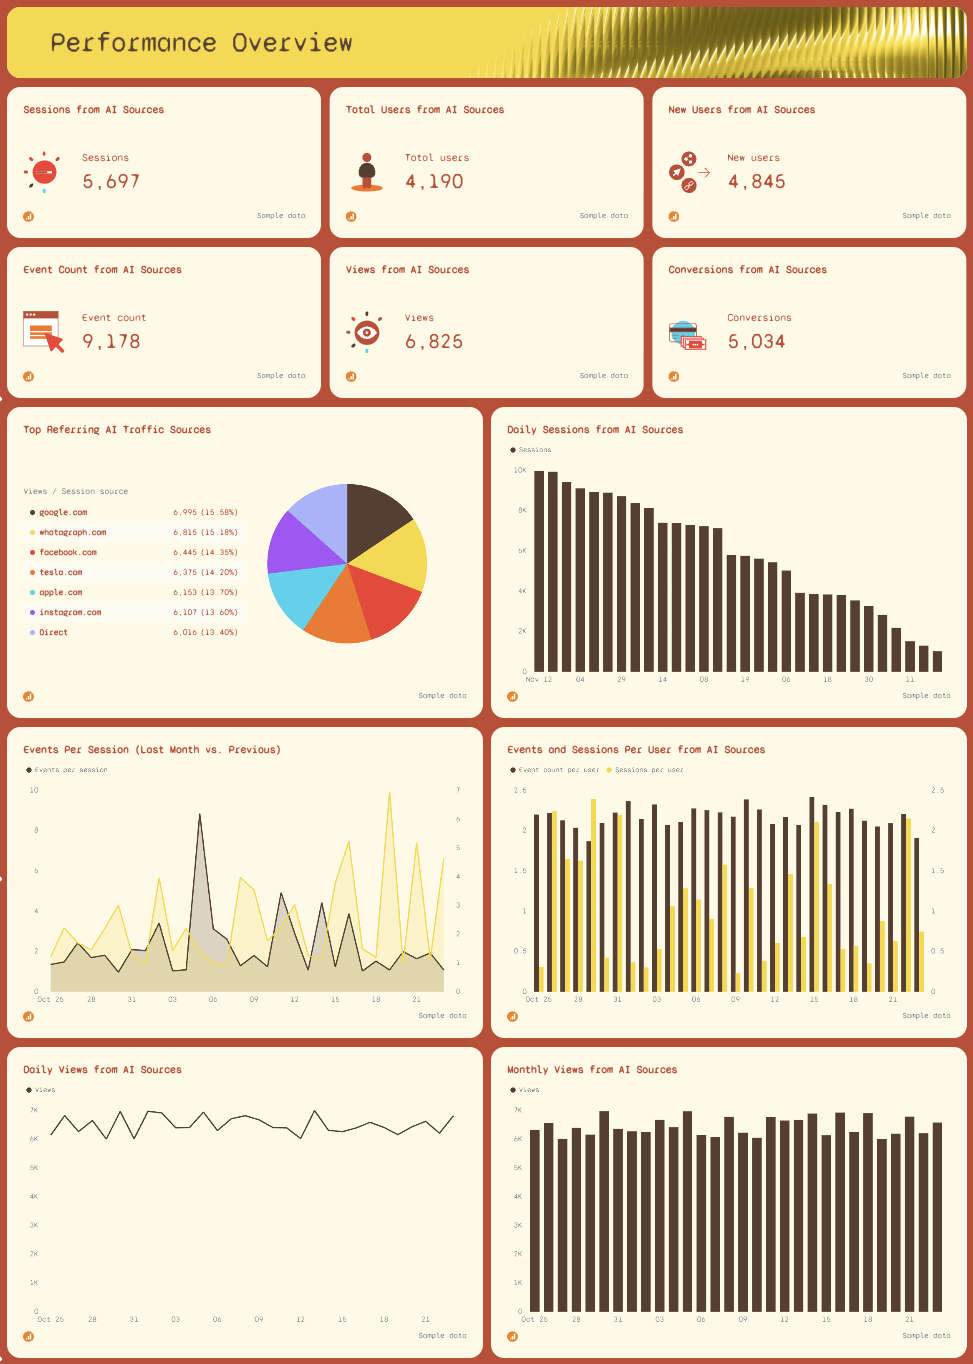
This page breaks down the functions and trends behind your numbers. Each card visualizes essential KPIs, sessions, users, conversions, and views, updated in real time so you always know what’s happening right now.
Use charts, graphs, and dashboards to show changes across the month. The report also includes a visual breakdown of top referring AI traffic sources like ChatGPT, Google, Perplexity, and other AI systems.
These insights help you identify initiatives that are working and pinpoint where machine learning–driven traffic might be growing.
Trend charts, such as daily sessions, monthly views, or events per session, give teams a clear look at how metrics fluctuate over time and support more informed decisions.
3. eCommerce Overview
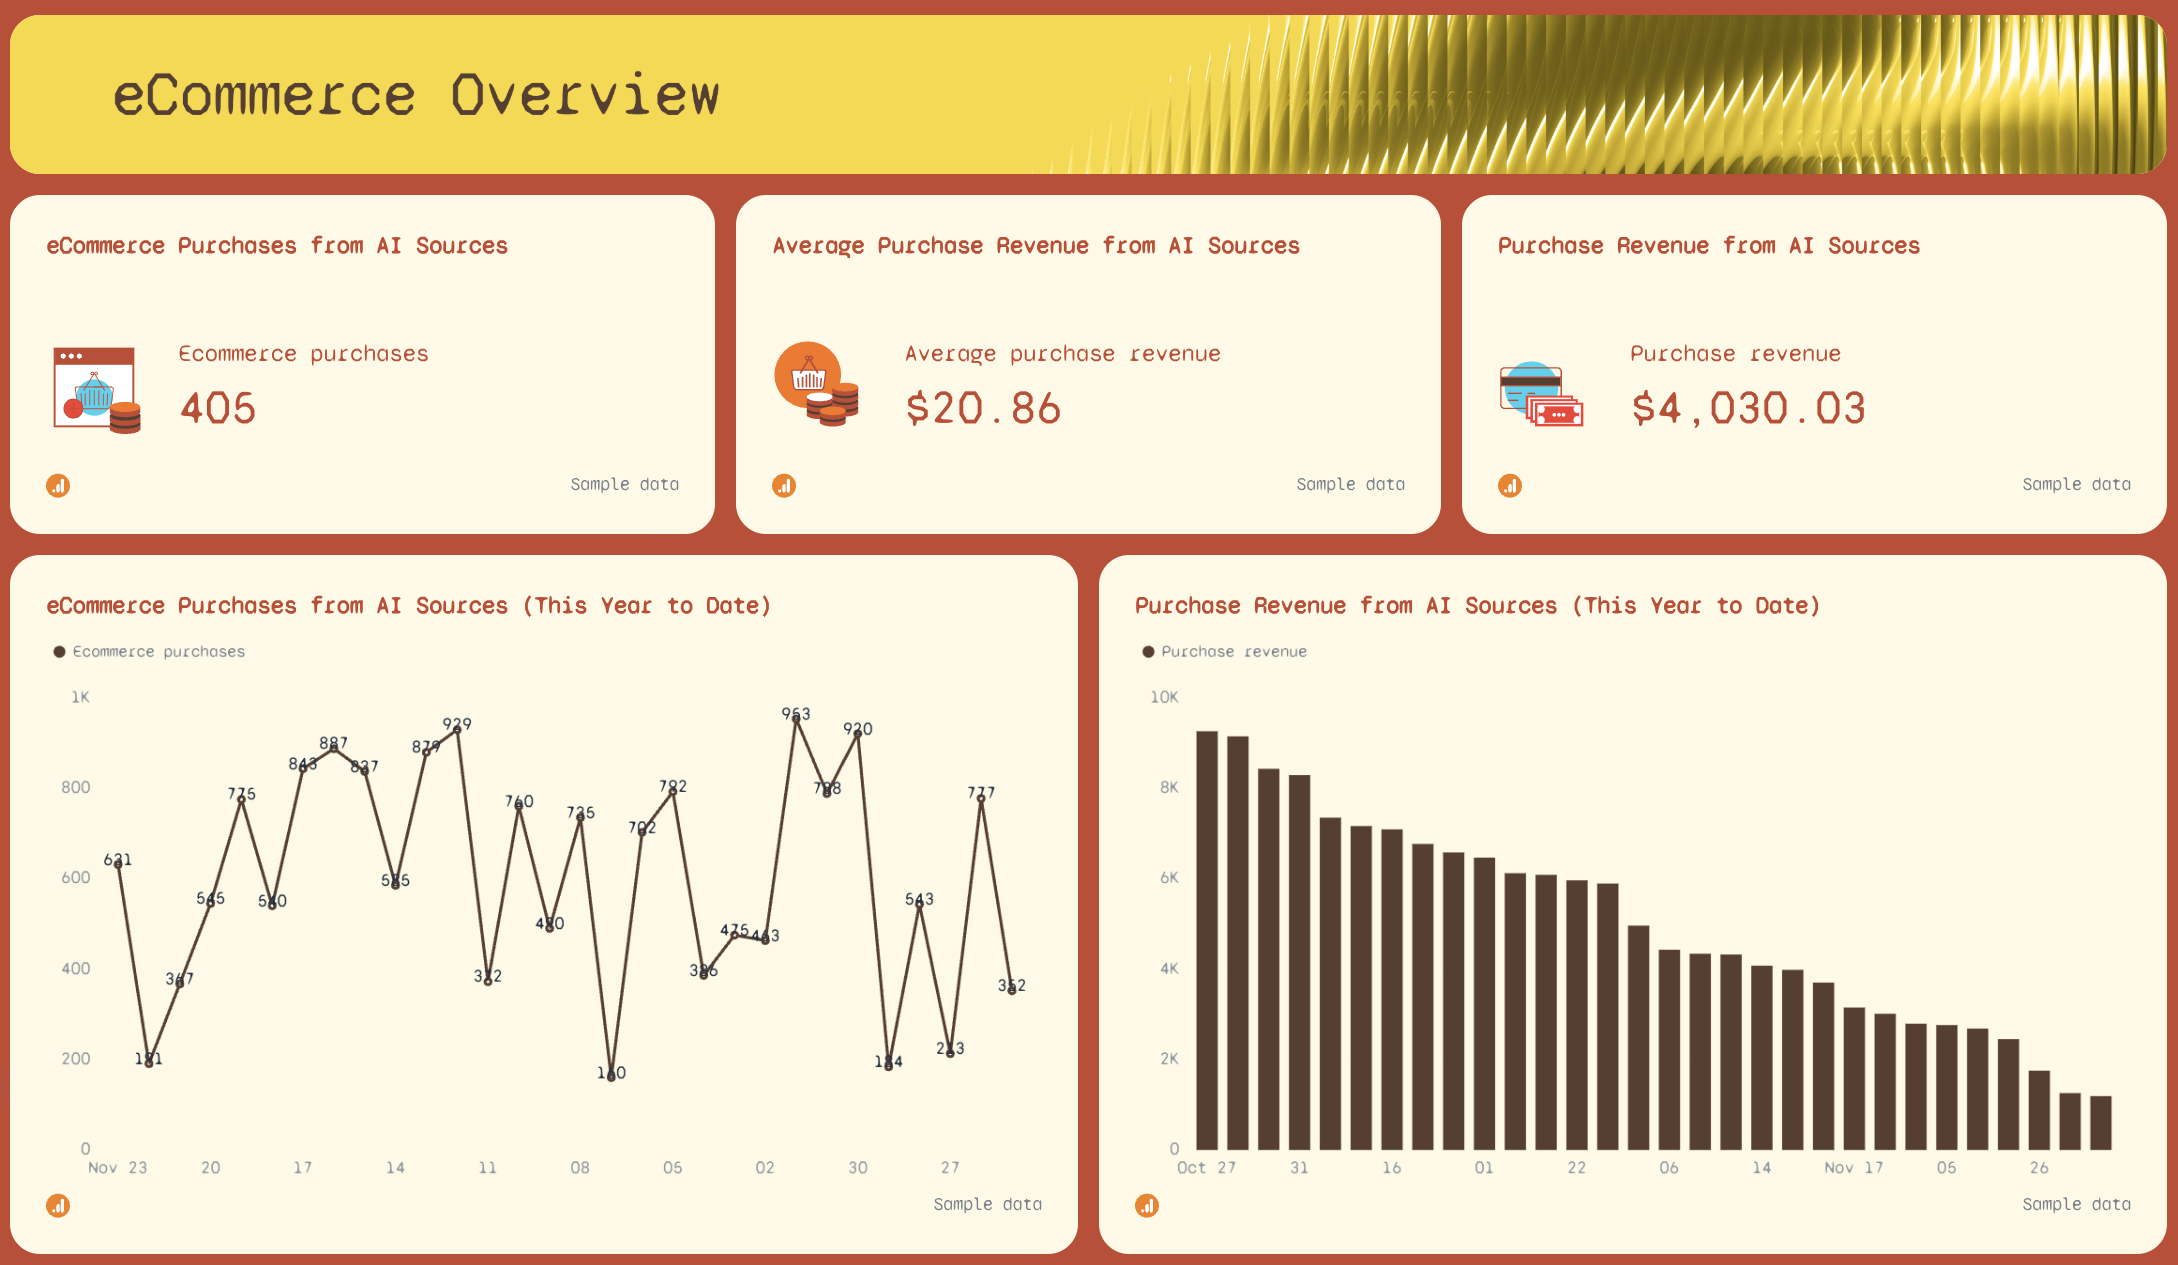
For teams running e-commerce or financial services operations, this section highlights how AI-driven traffic converts into revenue. You’ll see widgets for purchase volume, average purchase revenue, and total revenue—all generated from connected datasets.
Two long-range charts (year-to-date purchases and revenue) show how performance has shifted month over month. Because daily and even weekly data can be too noisy, this long-form data visualization provides a stable baseline that’s easier to interpret, especially when working with complex data or multiple marketing campaigns.
4. Session Breakdown
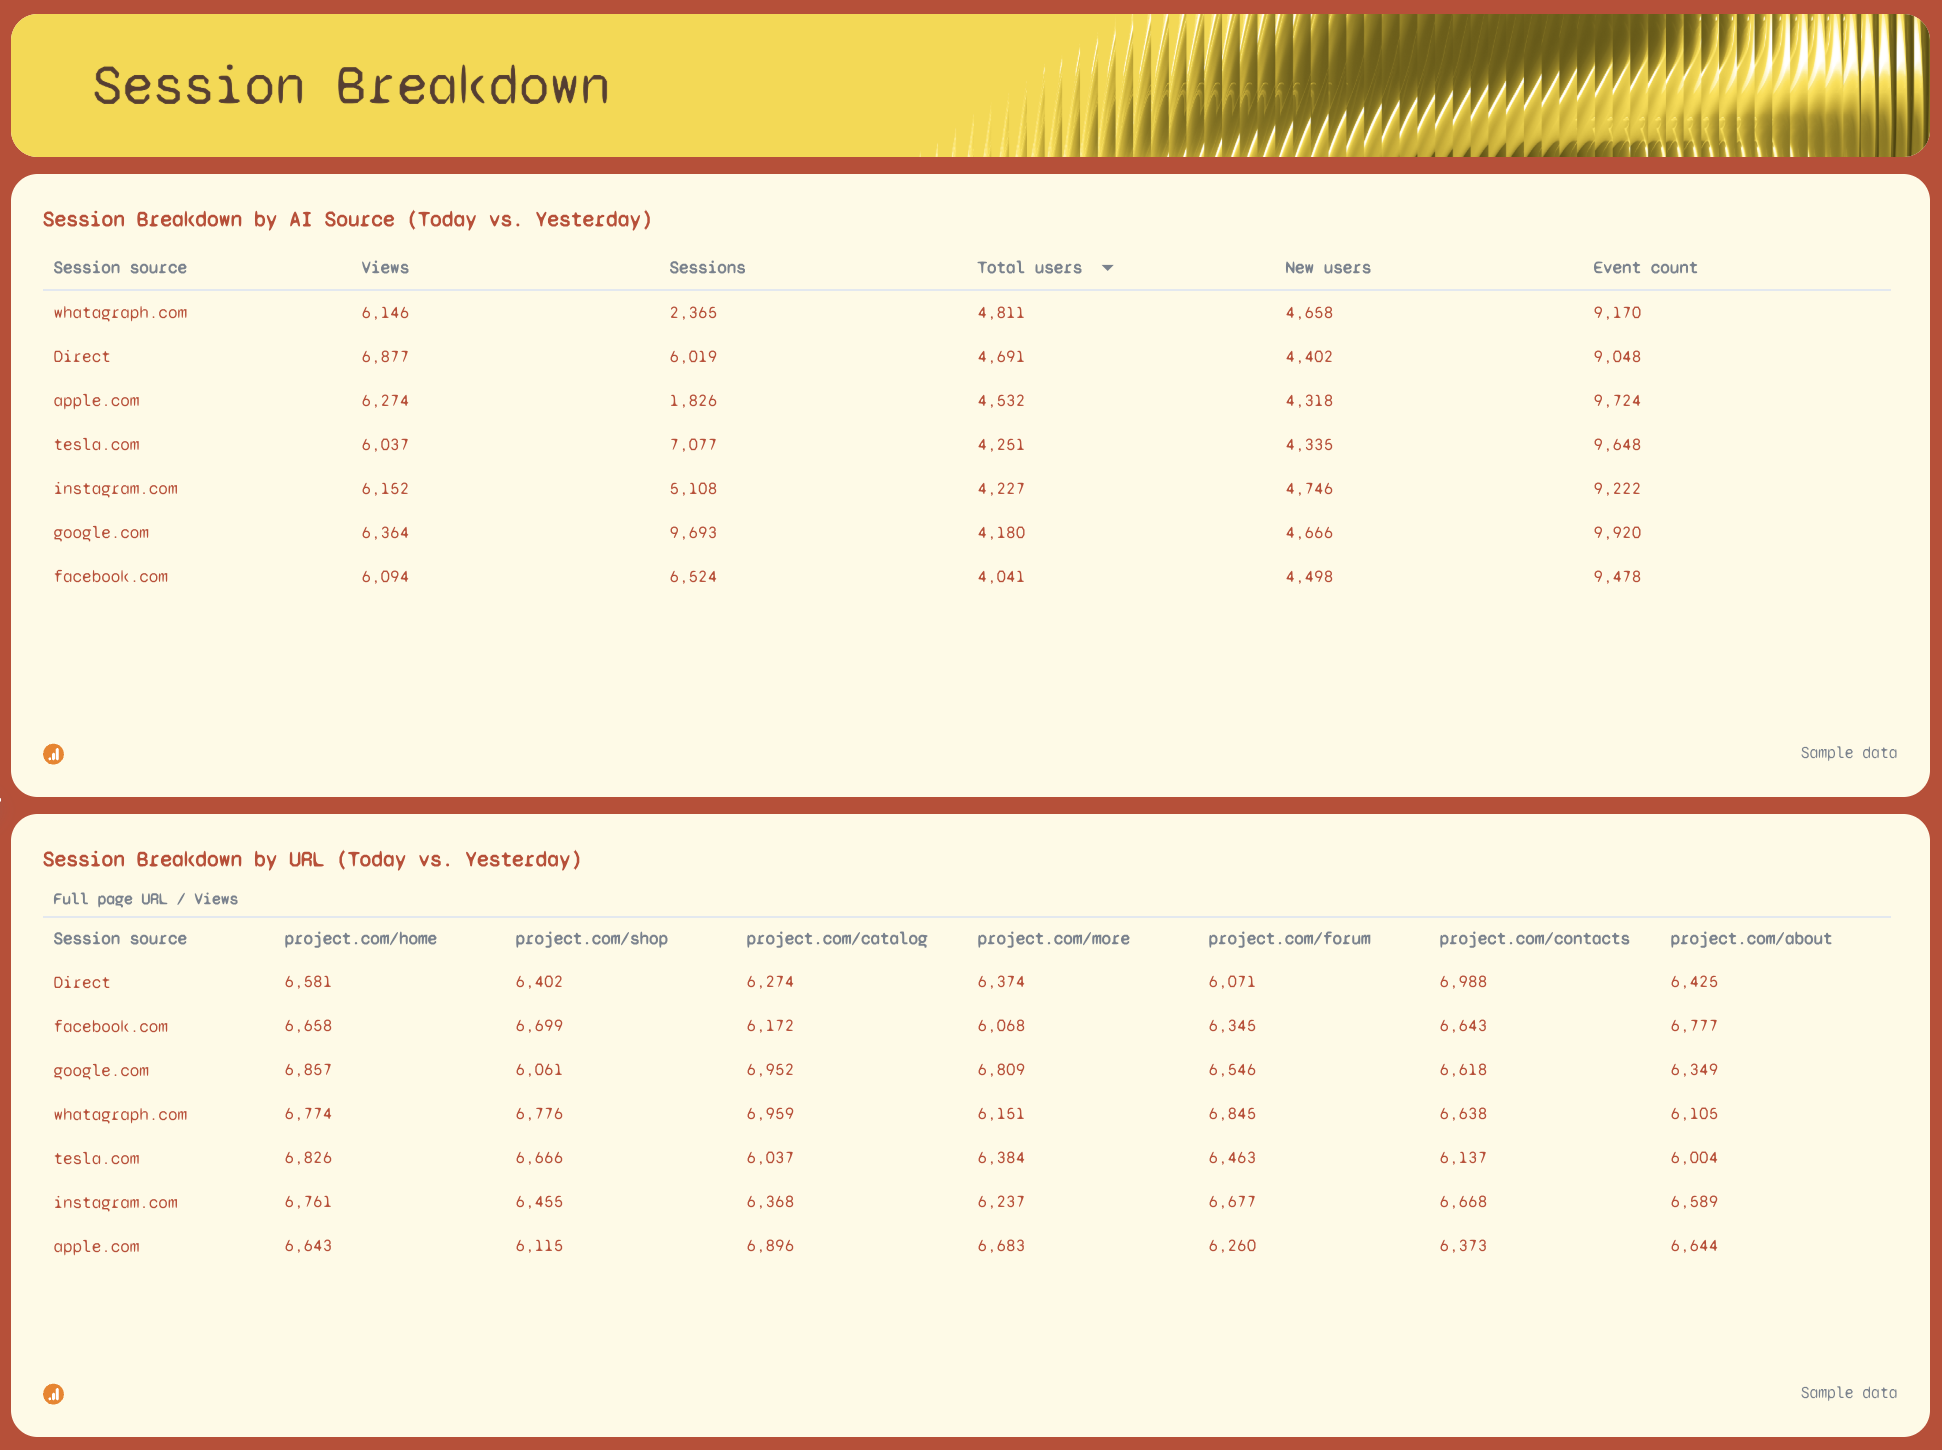
The session breakdown is your detailed look into where traffic is coming from. The report shows sessions, views, new users, and event counts by AI source.
A second table shows full URLs along with traffic numbers, helping you identify which landing pages benefit most from traffic generated through AI tools, chatbots, or large language models.
Because the data is broken out both by source and by URL, you get a more accurate understanding of user behavior, supply chain impacts, or the effects of specific marketing campaigns.
5. GEO vs. SEO
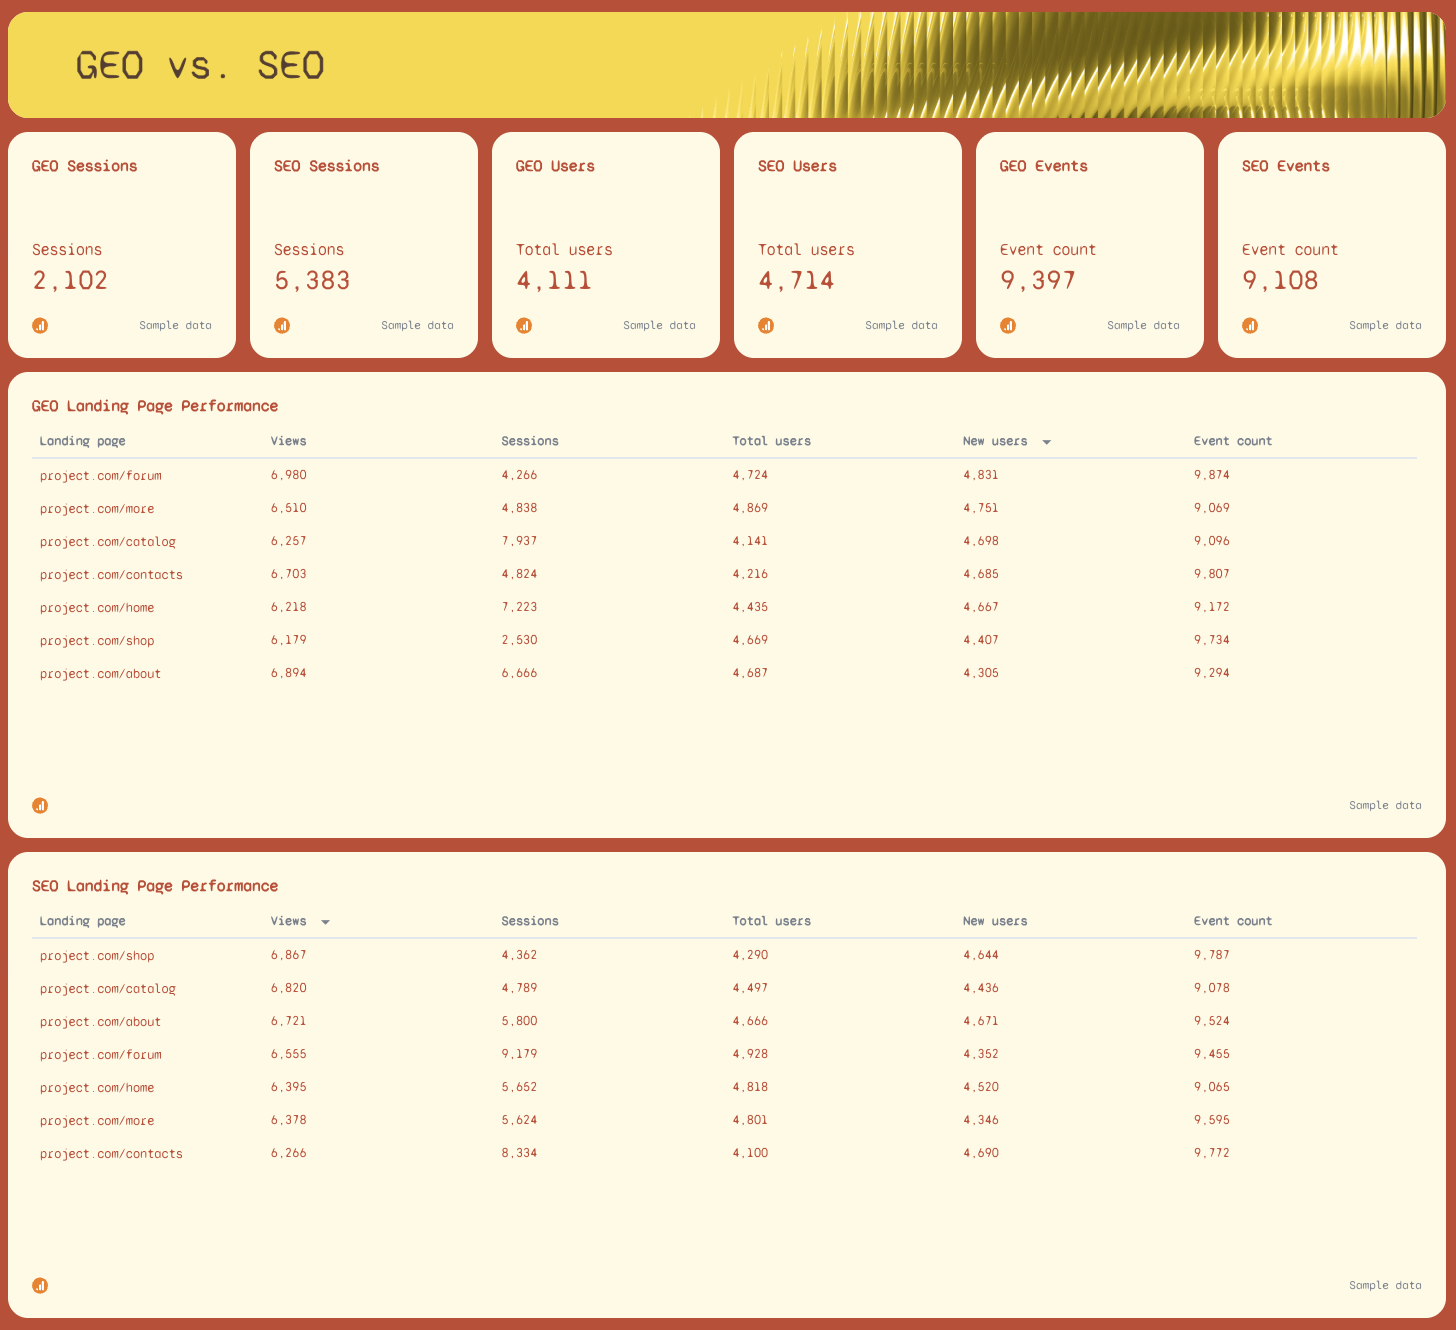
This final section compares AI-driven traffic (GEO) with SEO traffic in a single view. Both sides display the same KPIs—sessions, users, new users, event counts—so teams can easily evaluate which channel is driving the most meaningful outcomes.
Below the top metrics, display landing page performance side by side. This makes it easier to analyze datasets for channel-specific differences, identify where AI-driven initiatives outperform organic search, and see where to optimize for better performance across both channels.
This comparative block is one of the most powerful use cases for AI reporting because it helps transform data analysis into clear, actionable insights and makes it easier to adjust strategy across the entire reporting process.


