Free ChatGPT Monthly Report Template

Track exactly how many sessions, views, and conversions you’re getting from ChatGPT every month.

Visualize key metrics, see trends, and break down top performing pages all in this ChatGPT monthly report template.

ChatGPT Monthly Report Template - Dashboard showing performance metrics, including sessions, users, and views.

How to Use Whatagraph’s ChatGPT Monthly Report Template

Try Our Custom ChatGPT Report Generator

With Whatagraph IQ, just tell us what you need, and we'll build a stunning ChatGPT marketing report for you. No templates or manual setup needed.

What To Include in a ChatGPT Monthly Marketing Report

A ChatGPT monthly marketing report gives your team a full view of how ChatGPT impacts your website traffic, conversions, and growth over an entire month.

This template is built for marketers, SEO teams, and stakeholders who want clean data visualization, reliable metrics, and organized insights without sorting through datasets, spreadsheets, Microsoft files, or manual data analysis.

1. Performance Summary

ChatGPT Monthly Report Template - A dashboard with charts and metrics summarizing performance.

Start your monthly report with a simple overview of the month’s key metrics. This gives teams an instant executive summary and helps streamline monthly decision-making.

Include:

  • A monthly performance summary widget showing your main KPIs for the month, such as sessions, views, total users, new users, event count, and conversions. These key metrics are pulled straight from your dashboard so you don’t need to export anything to Excel or Google Sheets.
  • A goal widget that tracks monthly progress toward your targets. This makes it easy to see if your team’s performance is improving or slipping month to month.
  • A summary and recommendation text box powered by Whatagraph IQ.
    IQ lets you automate your writing and generate summaries in five formats: Summary, Wins, Issues, recommendations, or custom prompt. Because it uses your actual datasets from the platform, there are no hallucinations and no sharing of data with outside ai tools, keeping everything secure. IQ also works in 18 languages, which helps when your report is shared across several teams.

This section gives your whole workflow a strong foundation and keeps everyone aligned on the top takeaways for the month.

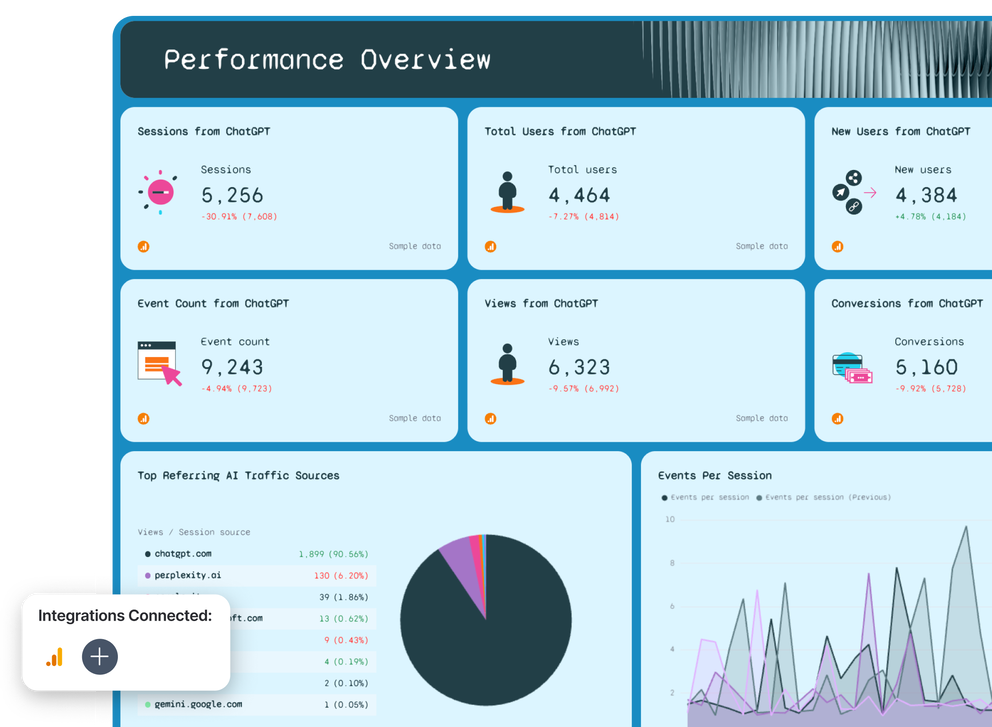
2. Performance Overview

ChatGPT Monthly Report Template - Dashboard with charts and key performance indicators.

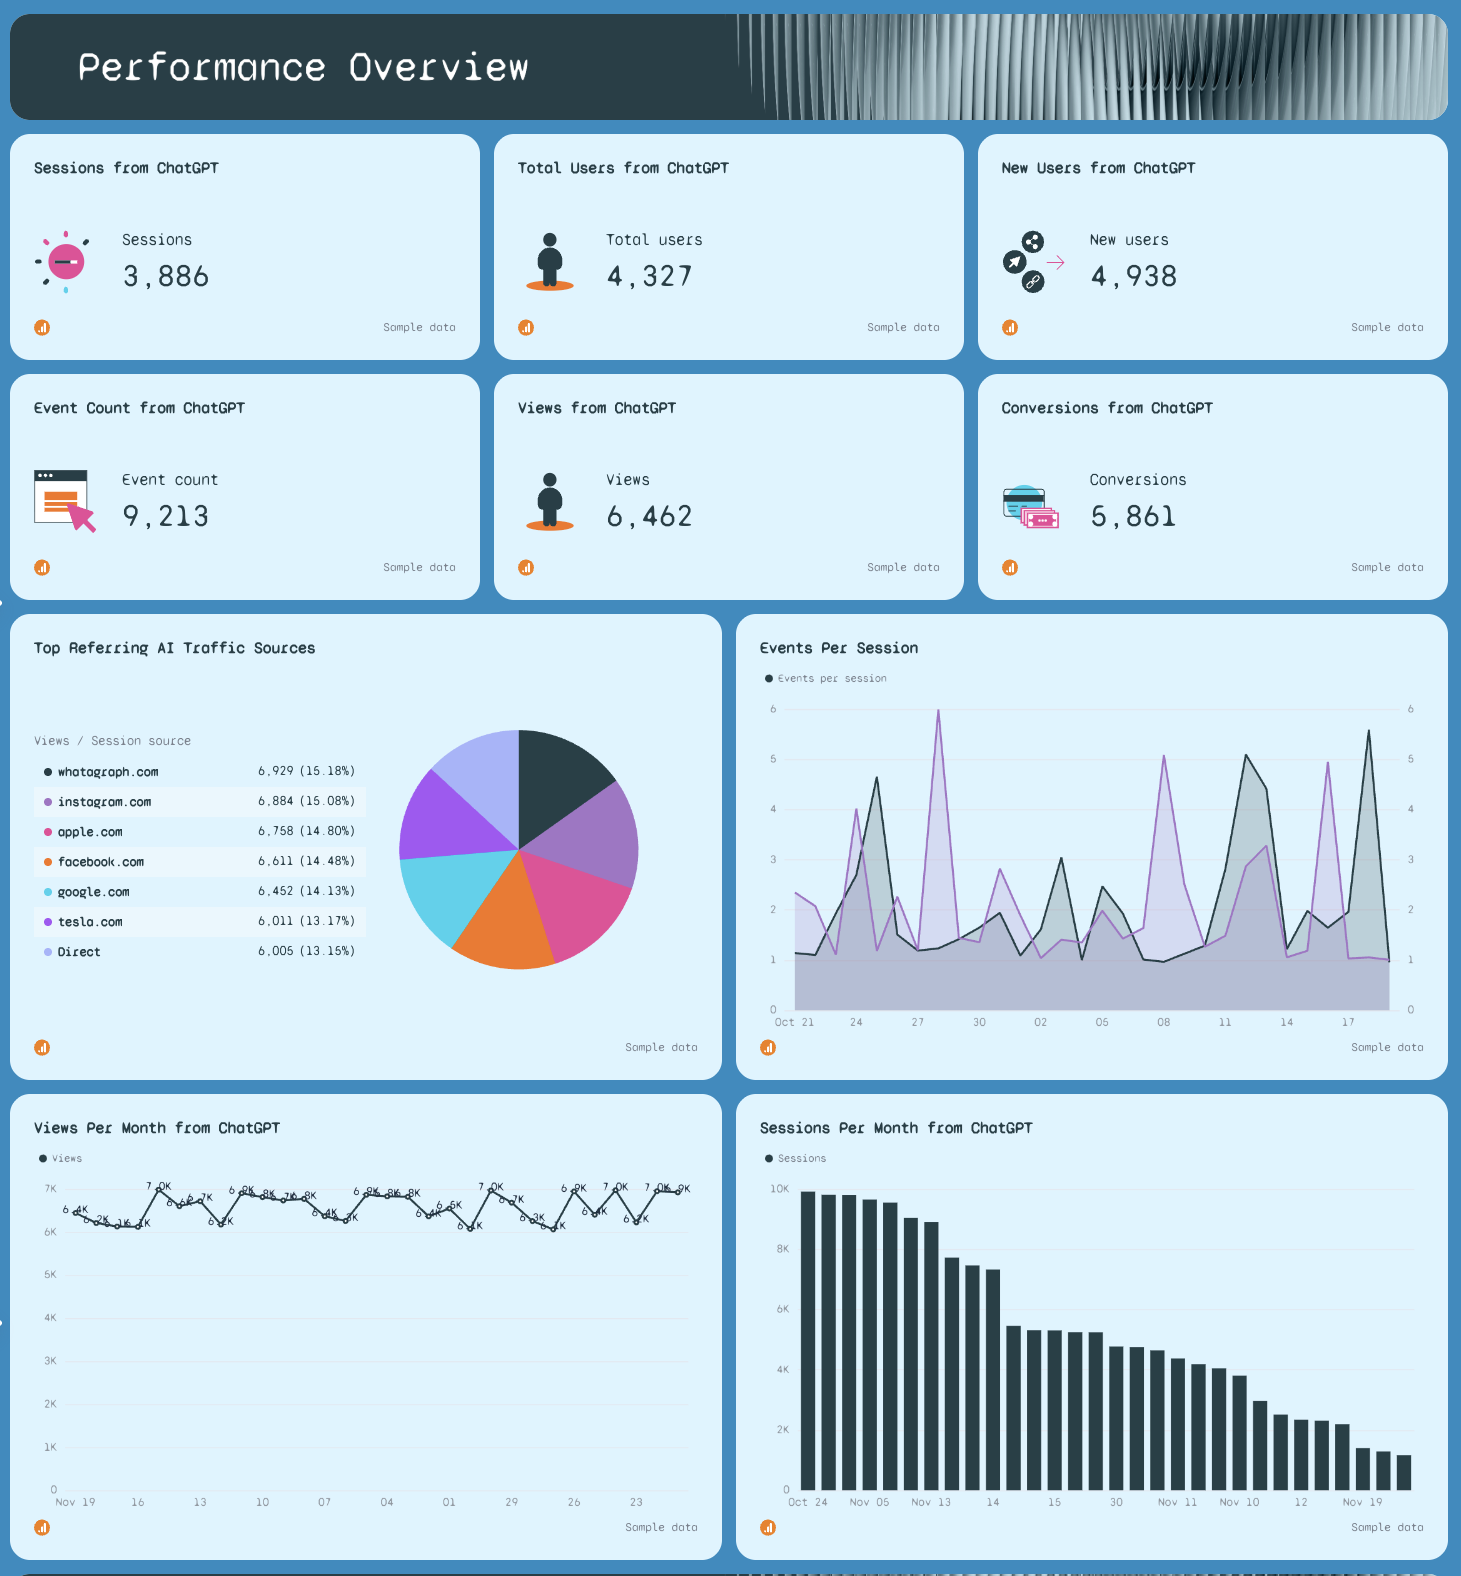
This part of the template breaks down how much traffic ChatGPT brought to your website throughout the month.

Include:

  • Single-value widgets for sessions, total users, new users, views, event count, and conversions.
  • These metrics come from Google Analytics 4, but the report uses a custom filter where Source / Medium → matches regex → chatgpt / openai, so you only see traffic that truly came from ChatGPT or similar AI sources like Copilot.
  • A pie chart showing your top referring AI traffic sources for the month. This helps you compare ChatGPT to others, such as Perplexity or Gemini.
  • A set of graphs showing trends for sessions per month, events per session, and views per month. These visuals make your performance report easy to share with stakeholders and reduce the need for step-by-step explanations.

This entire section helps your team quickly understand how using ChatGPT as a traffic source affects long-term website traffic and activity.

3. eCommerce Overview

ChatGPT Monthly Report Template - An eCommerce overview dashboard with charts and metrics.

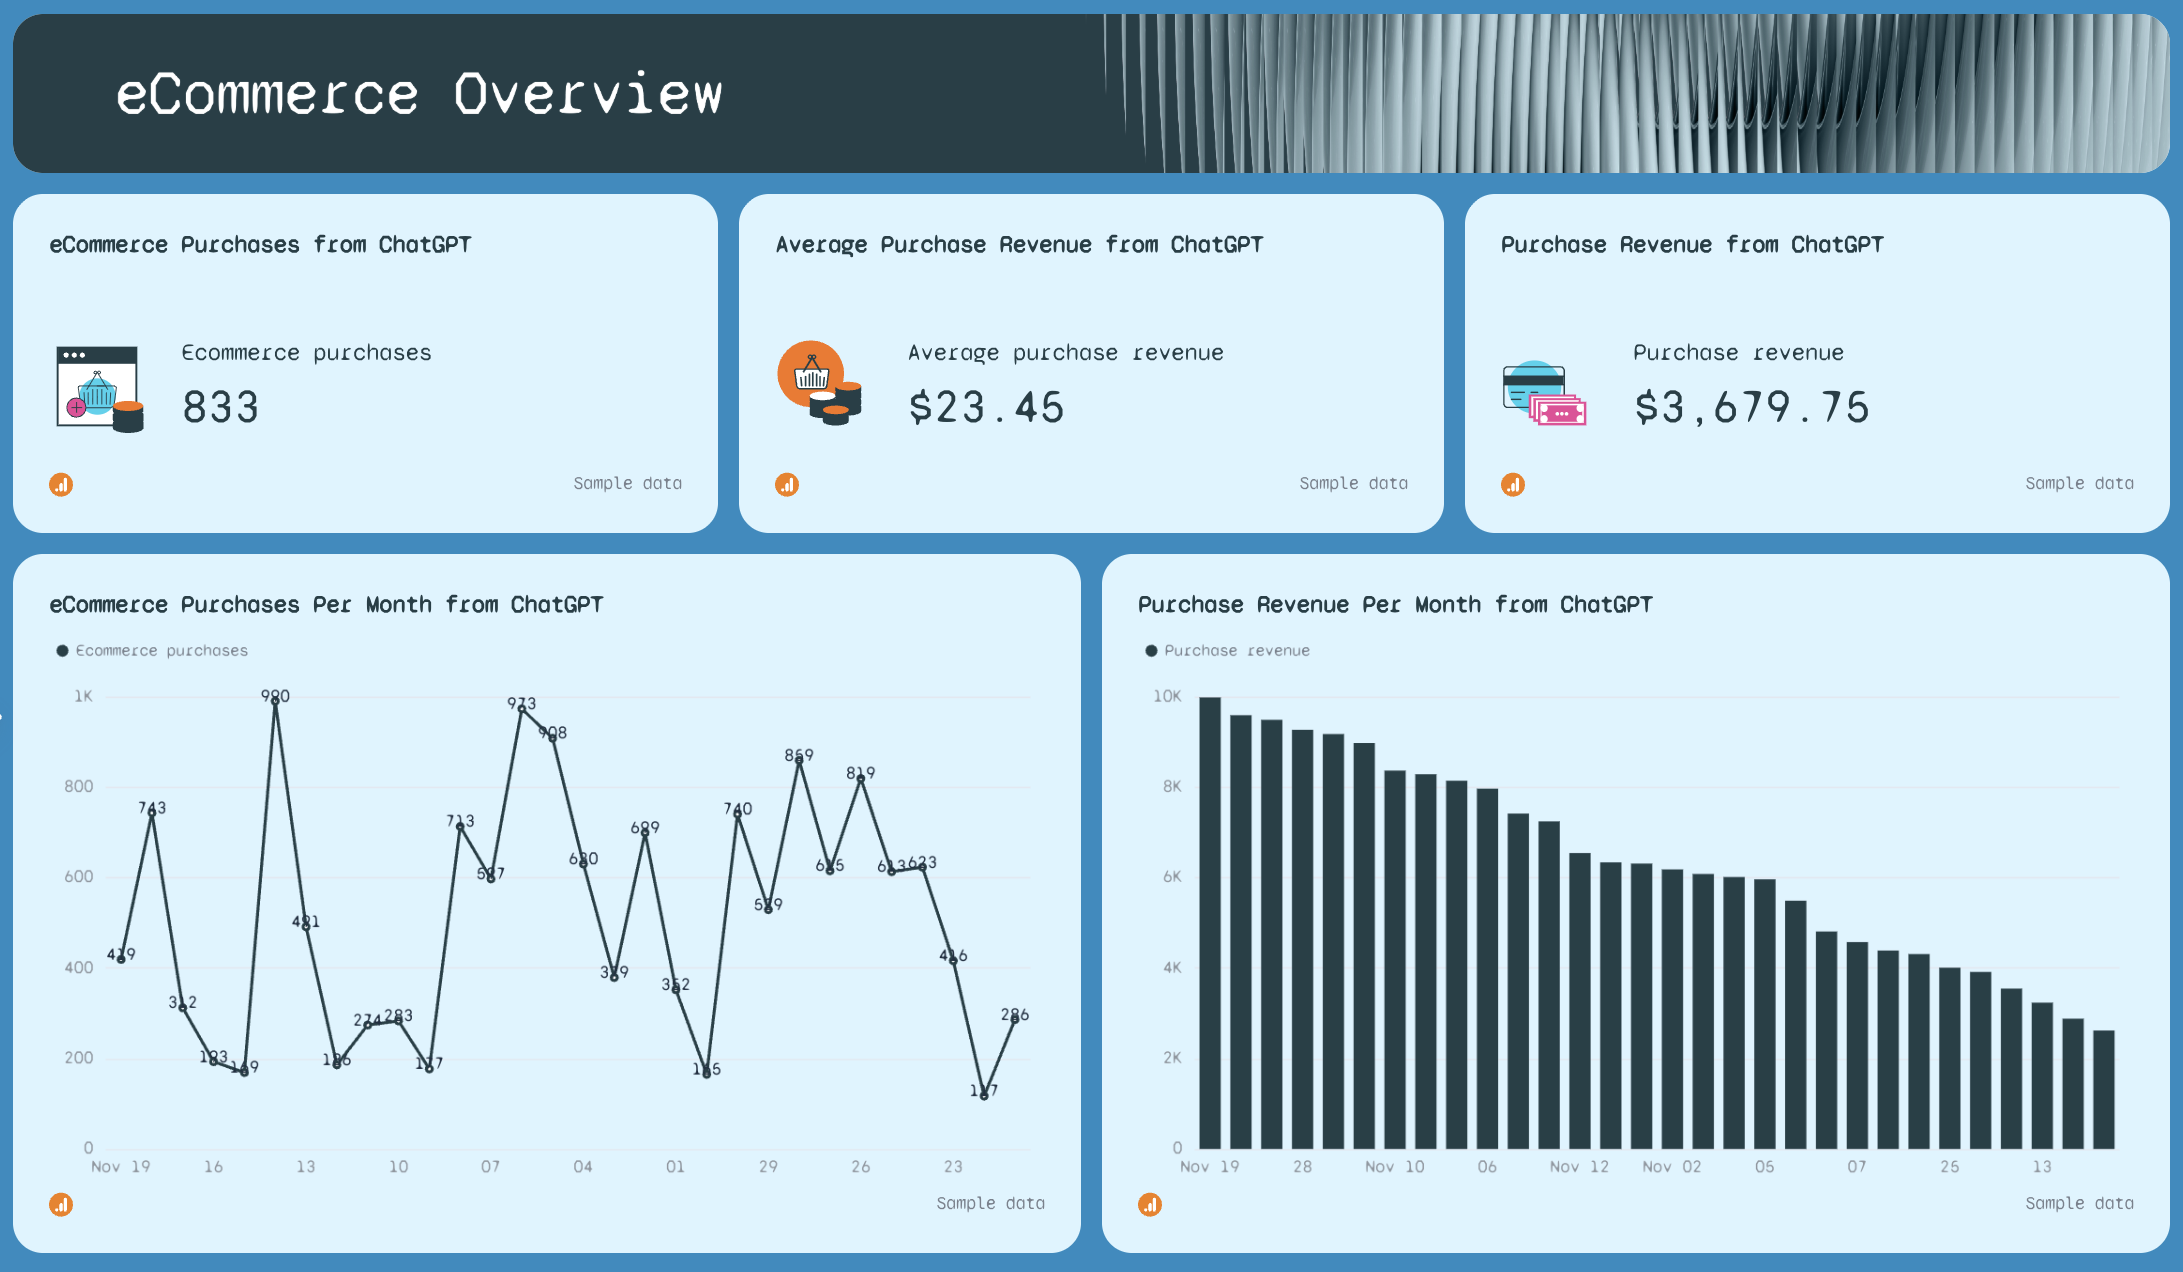
If you run an ecommerce business, this is where you can see how ChatGPT traffic impacts your sales.

Include:

  • Widgets for ecommerce purchases, total revenue from ChatGPT, and average purchase value.
  • A monthly line graph that shows ecommerce purchases coming directly from ChatGPT.
  • A monthly bar graph that shows total sales from ChatGPT traffic.

These visuals show exactly how well ChatGPT converts compared to your other channels, so you can improve conversion rates and update your methodology as needed.

4. Session Breakdown by AI Source (This Month)

ChatGPT Monthly Report Template - A table showing session breakdown by AI source and URL.

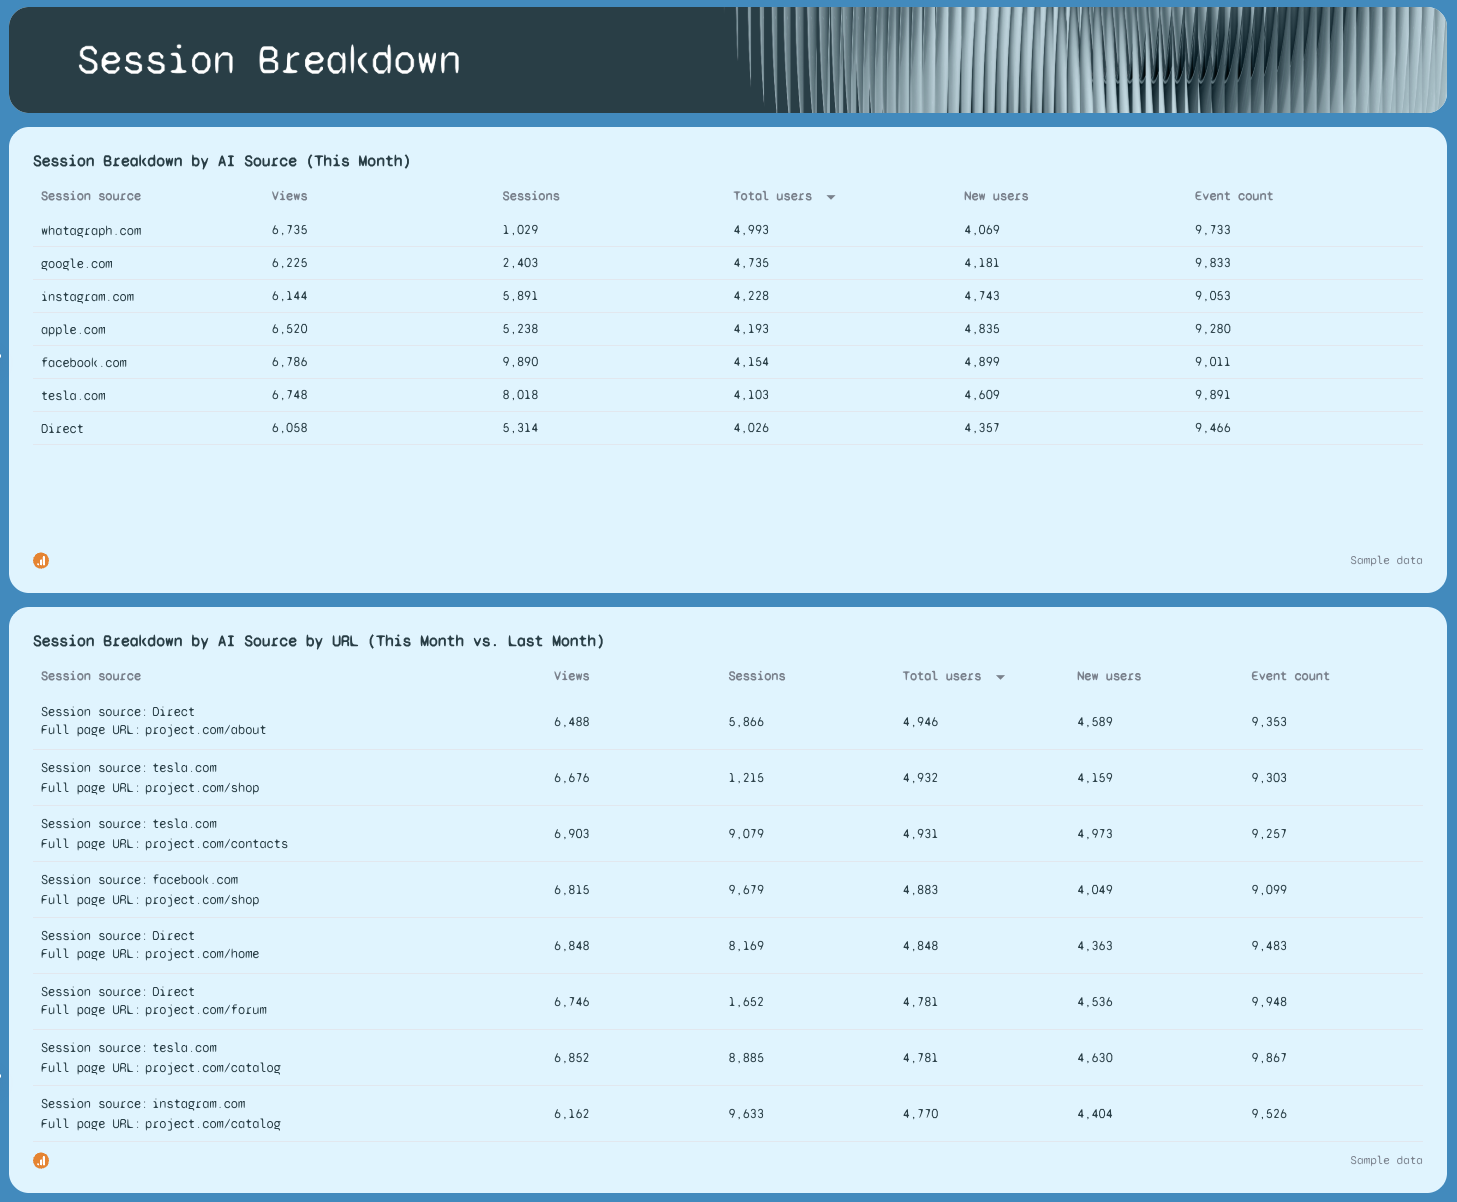
Here, you can see the specific channels sending traffic to your site and which URLs those channels support.

Include:

  • A table showing sessions from each AI source for the month.
  • A detailed table showing sessions from each source broken down by URL, giving you insight into performance by landing page.

This is helpful for data analysis and identifying use cases where ChatGPT performs well—or where optimization is needed.

5. ChatGPT vs. Google

ChatGPT Monthly Report Template - A dashboard with charts comparing data between ChatGPT and Google.

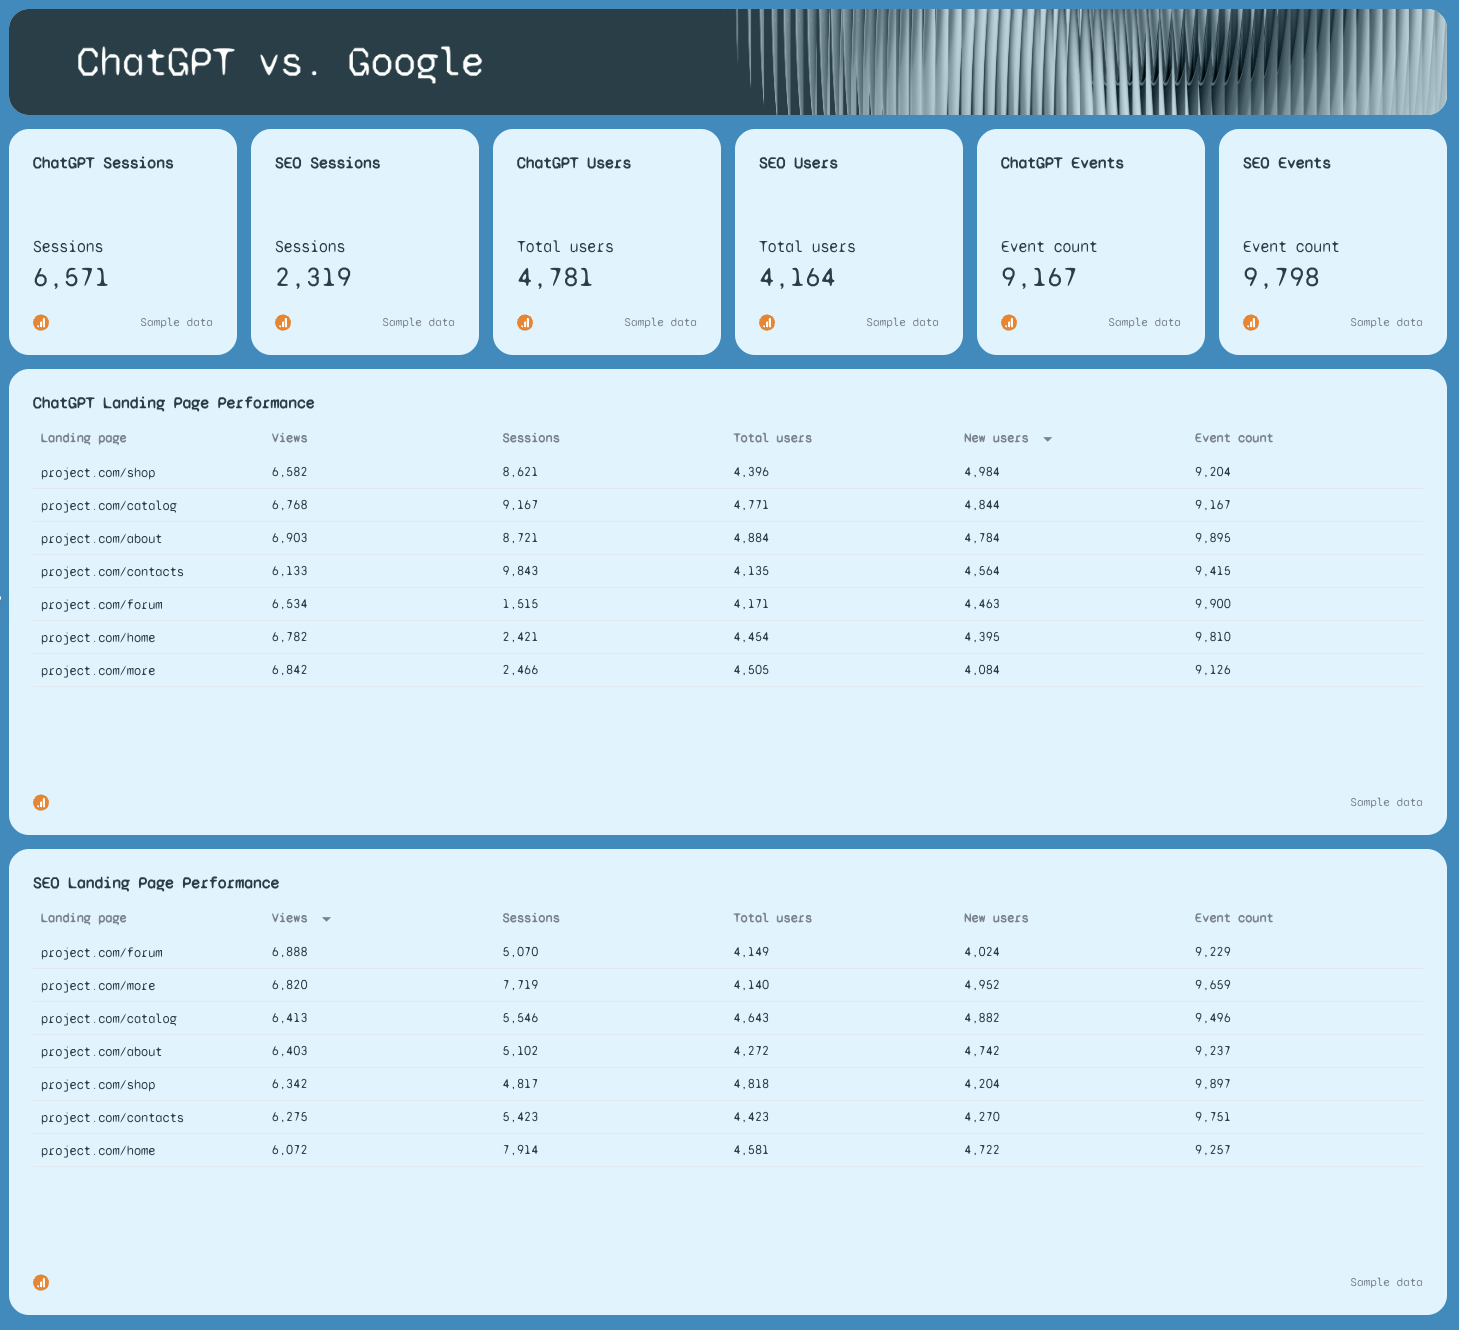
End your monthly report with a clear comparison between ChatGPT and traditional SEO traffic from Google. This helps you understand whether ChatGPT is supplementing or outperforming organic traffic.

Include side-by-side numbers for:

  • Sessions
  • Views
  • Total users
  • New users
  • Event counts

This comparison helps your team understand where to streamline content, where to focus brainstorming for next month, and what takeaways matter most for future status reports.

Connect All Your Marketing Data in One Place

Bring all your marketing data into one place with no-code, stable connectors that you don't need to babysit. 

Why Marketers Love Reporting on Whatagraph

Whatagraph’s AI saves time and energy for our marketing specialists. And the hours we’re saving is just pure profit.

Lars Maat

Lars Maat

Company Owner, Maatwerk Online

StarStarStarStarStar

Whatagraph took us to the next level with our clients and within our team. Our relationships with clients have been amazing, and we’ve even been able to retain them longer.

Kim Strickland

Kim Strickland

Digital Marketing Specialist @ Peak Seven

StarStarStarStarStar

Whatagraph has become an essential partner for scaling our reporting, and my teams love it because it saves so much time. We’d recommend it to any team looking to automate data reporting and use AI for insights.

Danielle Roberts

Danielle Roberts

Director of Implementation & Support @ Rentable

StarStarStarStarStar

Whatagraph is easy to use, visually attractive, and much smoother compared to tools like Looker Studio.

Stef Oosterik

Stef Oosterik

Quality Manager @ Dtch. Digitals

StarStarStarStarStar

Frequently Asked Questions

Have more questions? We answered them here.

Can ChatGPT generate a report?

Yes, ChatGPT can generate a report, but it can only create text: it can’t pull real data, build widgets, or create charts unless you upload or paste the information yourself. If you want a full report with visuals, metrics, and real data from your accounts, reporting tools like Whatagraph can build the entire reports for you automatically, with safe and accurate AI. 

How to generate a monthly report?

With Whatagraph, you can generate a monthly report in two easy ways:


Option 1: Use a ready-made template


- Start free, create an account, and set your password.


- Connect your data source.


- Pick a report template from our template library based on your specific needs and your report is ready instantly.


Option 2: Use Whatagraph IQ


- Start free, create an account, and set your password.


- Connect your data source.


- Choose “Create a report with IQ.”


- Type a prompt like “Create a weekly AI referral traffic report”, and Whatagraph IQ will build the full report using AI—widgets, charts, graphs, and all—within seconds based on your connected data.


Both options let you generate accurate, professional reports without the heavy lifting.

How do you summarize a monthly report?

Here again, you have two options:


1. Option 1: Using ChatGPT


You can paste your monthly data or upload a file into ChatGPT and ask it to summarize the results. However, this requires sending your client or company data to ChatGPT, which may create a data breach risk, and some executives may not approve sharing financial or business data with external systems.


2. Option 2: Using Whatagraph IQ


With Whatagraph IQ, you simply connect your data source securely, view your key metrics inside your report, and ask IQ to create summaries, wins, issues, recommendations, or whatever you want using custom prompt. 


IQ writes based on your actual report data, so there are no hallucinations, no exports, and no data leaving the platform.


Whatagraph also includes strong security measures such as ISO 27001 certification, GDPR compliance, EU data hosting, SSO/SAML support, and AES-256 encryption, which keeps your reporting safe end to end.

How to develop a reporting template?

Start by deciding what metrics matter most, such as sessions, conversions, website traffic, or social media results. Then choose the layout: a summary, visuals, tables, and takeaways. 


Many marketers begin with an existing template and customize it, while others automate the entire process using Whatagraph to build the structure, connect datasets, and update the report every period.

Does anyone use AI to do their reporting?

Yes, many teams now use AI to automate reports, especially for recurring tasks like monthly or weekly summaries. 


AI tools help remove manual work, reduce errors, and make it easier to share insights with stakeholders. Whatagraph IQ is especially popular because it writes summaries based on real data already in the report—and keeps everything secure inside one platform.

What are ChatGPT prompts for reporting templates?

You can use simple prompts such as:


- “Write a monthly marketing report summary in bullet points based on this data.”


- “Create a list of wins, issues, and recommendations from the metrics below.”


- “Explain these KPIs in simple language for executives.”


These prompts work in both ChatGPT and Whatagraph.


The benefit of Whatagraph is that you don’t need to paste anything. You just connect your data source, type what kind of report you want, and Whatagraph IQ builds the entire template with widgets, charts, and graphs based on your connected data in minutes.


When styling the report, you can upload a screenshot of your website or brand book, and Whatagraph will automatically match the colors. You can then share the live link with stakeholders or automate the report to send at a certain date, time, or frequency.

How can I use ChatGPT to create a monthly report template?

You can use ChatGPT by giving it your data manually and asking it to outline sections, write text, or suggest a structure. But it won’t build charts or import data automatically.


If you want a full monthly report with data pulled directly from your accounts, Whatagraph can create the entire template for you using AI—no copying, no spreadsheets, and no manual setup.