Google Local Service Ads Connector
Looking for an easy way to report on your Google LSA campaigns? Try our no-code Google Local Service Ads connector.
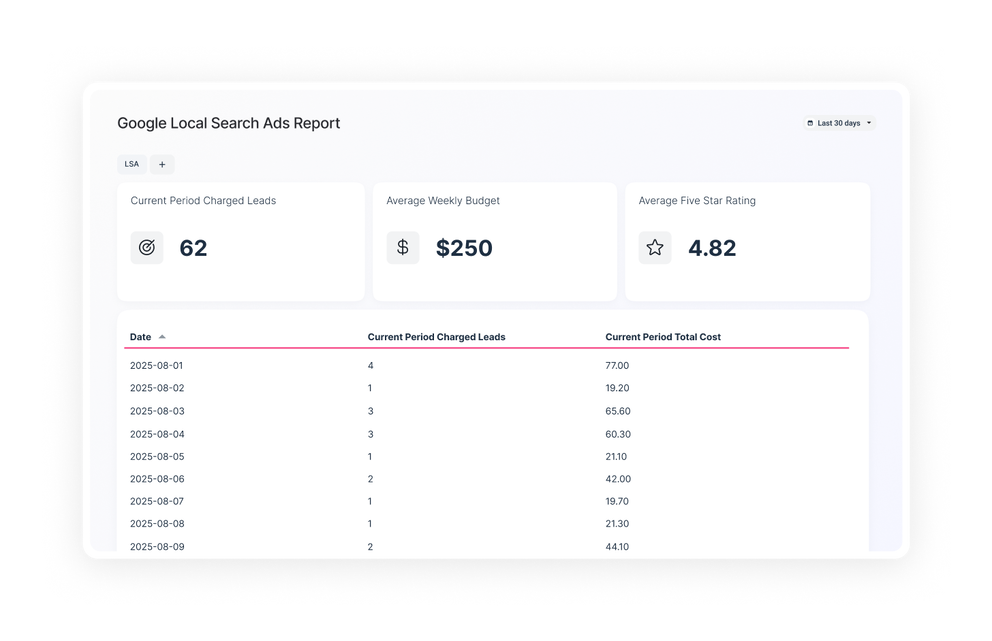
See all your key metrics on one dashboard and stay on top of your campaigns.
Share white-labeled reports with clients or the C-Suite. No third-party tools needed.


All-in-One Marketing Data Platform for Google Local Service Ads Data

Pull all Google LSA Metrics Into Your Reports and Dashboards
Check out related integrations:


Save Time on Monitoring and Reporting


Frequently Asked Questions
How easy is it to connect to Google Local Service Ads on Whatagraph?
It’s super easy, thanks to our home-built Google Local Service Ads integration. You don’t need any coding skills or third-party connectors to set up. In just a few clicks, you can connect your or your client’s Google LSA account and that’s it.
Do I need Looker Studio to visualize my Google Local Service Ads data?
No, you don’t need Looker Studio to visualize your Google Local Service Ads data. Whatagraph is an all-in-one marketing data platform to connect, organize, visualize, and share all your data.
With Whatagraph IQ, you can simply ask our AI to create a full-on report or individual widgets for you with the exact metrics, charts, and graphs you want to see.
When it comes to styling your reports, you can upload a screenshot of your brandbook or type in a prompt and Whatagraph automatically detects the colors and fonts and applies them to your reports.
How can I create custom reports using data from Google Local Service Ads sources?
Creating custom reports with Google Local Service Ads data is easy if you use Whatagraph.
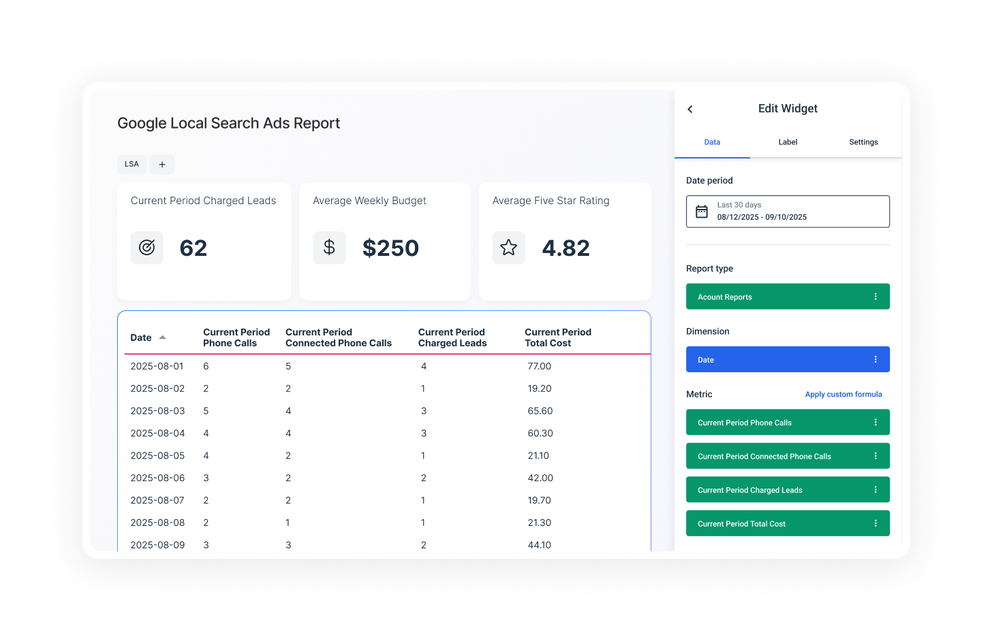
Once you connect your Google Local Service Ads account, you’ll see pre-made metric widgets—like leads, cost per lead, and disputed leads—that you can drag and drop into your report.
With Whatagraph IQ Report Builder, you don’t have to build everything from scratch. Just type what you need—like “show me leads by service area” or “compare spend vs valid leads”—and IQ will create the full report for you.
Use IQ Widget Creation to instantly generate new charts for any metric or KPI without manually configuring data sources.
Add IQ Summaries to automatically explain performance trends, making reports clear for both internal teams and clients.
Finally, apply IQ Themes to brand your report in seconds with your colors, fonts, and logos—no extra design work needed.
With Whatagraph, your Google Local Service Ads data turns into a custom, client-ready report in minutes instead of hours.
What metrics should I highlight on my Google Local Service Ads report?
The specific metrics will depend on each client or your internal needs, but those that you shouldn’t leave out are:
1. Total Leads: This metric shows the number of leads generated through your Google LSA. It gives you a clear picture of the campaign’s overall effectiveness.
2. Cost Per Lead (CPL): CPL helps you measure how efficiently your budget is being used by showing the average cost for each acquired lead. Tracking this metric allows you to adjust your budget and bidding strategy to reduce costs while maintaining lead quality.
3. Lead Conversion Rate: The conversion rate reveals the percentage of leads that resulted in actual sales or desired actions. This is crucial because it shows whether the leads generated are qualified and likely to convert.
4. Average Star Rating: A high star rating is crucial for improving ad visibility and attracting higher-quality leads, as customers tend to choose higher-rated businesses.
5. Number of Reviews: A regular stream of reviews can improve your ranking in LSA results and impact your conversion rates positively.
6. Booking Rate: This metric tracks how often a lead books your services directly through the LSA. A high booking rate is a strong sign of customer intent and willingness to convert.
7. Response Time to Leads: Quick responses are an important metric on LSA, as potential customers are more likely to choose businesses that respond promptly.
8. Impressions: Impressions measure how often your ad was displayed in search results. This metric gives insight into the visibility of your ads, helping you understand if your targeting parameters and budget are sufficient to reach your desired audience.
9. Click-Through Rate (CTR): A high CTR shows that your ad is relevant to the search queries and appealing to potential customers. It can also help identify the effectiveness of your ad headline and call to action.
10. Total Spend: Tracking total spend helps keep your campaign within budget while assessing the ad’s cost-effectiveness.
11. Return on Investment (ROI): ROI measures the revenue generated compared to the cost of running the LSA campaign. This metric is crucial for determining the profitability of the campaign and justifying continued or increased ad spend.
12. Top Performing Ad Variations: If you’re running multiple ad variations, this metric shows which versions are attracting the most leads and clicks.
Can I blend Google Local Service Ads data with other data?
Yes, you can blend Google LSA Ads data with other data on Whatagraph. And the best part is…you don’t need any coding or data science knowledge to do it.
With Whatagraph IQ Dimensions (available on more advanced plans), you can simply ask AI to create custom dimensions, metrics, and blends without having to do any complicated setup.
What others think about Whatagraph
I made a switch from GDS and Sheets for reporting to Whatagraph, and I am saving literal hours each week on performance report creation. Our small firm actually managed to onboard 2 new clients as a result of all the time we saved on managing data and reporting. The customer service is also really helpful and easy to reach.

Capterra verified review by
Mindaugas S., Marketing Consultant
Having active customer support to help fix any issues was a big contributor, but we also really liked the ability to save templates and connect sources to multiple charts/widgets at once without having to edit them individually. And having the grid layout is much easier to stay consistent with than the free form setup that Data Studio has.

Capterra verified review by
Nico T., Media Planner
The system has standard templates that are easy and fast to use. Also you can build your own report with lightning speed. It is very easy to use, has a lot of integration, and let get started very fast.

Capterra verified review by
Rasmus Bernt K., External Senior Management Consultant
We love Whatagraph - we would definitely recommend and our account manager is great! I love how easy this tool is to use, everyone on the team finds it much more user-friendly than other dashboards. Integration was easy, we sent some example reports to the team who duplicated these for us. We literally had to log in and send it to our clients!

Capterra verified review by
Stephanie S., Digital Director
We are showing our clients the work that we're doing for them and this is incredibly important for our clients ROI. They want to see results and having a tool like Whatagraph that can show data from virtually every source we use is hugely important.

Capterra verified review by
John S., SEO Strategist
The tool is easy to use; you do not need to have development resources. Even my junior project managers are capable of making campaign reports in minutes. There are a lot of pre-made templates you can use as well as many pre-made widgets.

Capterra verified review by
Erman E., Marketing Specialist
Really easy to connect data sources within the tool. The library of report templates has been helpful. The customer support team has been responsive to all of our needs. Our team enjoys the simplicity of setting up the reports and how the data is presented.

Capterra verified review by
Brent N., Director of Operations
Easy to create really beautiful graphs and reports which can help other team members to understand the most important takeaways. I especially like the automated report function, so I don't have to check on the same thing repeatedly.

Capterra verified review by
Orsolya S., Online Marketing Manager