

What is a social media report template?
A social media report template is a pre-built layout that helps you track, organize, and present key performance data from your social channels - without starting from scratch every time.
Instead of pulling numbers manually from Instagram Insights, Facebook Ads Manager, LinkedIn Analytics, and TikTok dashboards, a social media analytics report template brings it all into one clean, visual format.
The need for this has never been more urgent. According to Sprout Social’s 2024 survey, reporting and data analysis takes an average of 3.8 hours per week - nearly two full work days every month, per person.
Meanwhile, HubSpot's 2026 marketing report found that 69% of social teams are under increasing pressure to prove ROI, yet 41% of B2B marketers still struggle to tie social activity to business outcomes.
A good social media metrics report template solves both problems at once. It gives you a consistent way to show the good, the bad, and what’s driving results.
The right social media report layout should help you:
✅ Highlight key social media performance indicators like reach, engagement, conversions, and ROI
✅ Break down performance by channel, campaign, or content type
✅ Provide context with written insights, visuals, and trend comparisons
✅ Tailor the layout to match each client's goals or brand
✅ Share updates quickly through live links, PDFs, or scheduled email delivery
The manual reporting hours add up fast. Rentable, a company managing 215 reports across 5,000+ data sources spent 2 hours per report crafting each one manually. After switching to Whatagraph, that dropped to 20-30 minutes per report - saving 1.5 hours every time. With 215 active reports, that's hundreds of hours back every month.
My teams love Whatagraph. They're saving so much time, and I've only heard positive feedback since onboarding, like: 'It's so great. We're saving so much time. It's so easy to onboard. - Danielle Roberts, Director of Implementation and Support at Rentable
Most social media analytics tools still make you build reports manually - widget by widget, tab by tab. Whatagraph IQ builds the full report for you, brands it to match your client, and writes the insights automatically.
With Whatagraph's MCP, you can now connect the data in your social media report template to your favorite AI tool like Claude and analyze your data in plain language there
What Should a Monthly Social Media Report Template Include?
A great social media analytics report template helps you move from scattered screenshots to a single, clear performance story.
Here’s what to include in your monthly report:
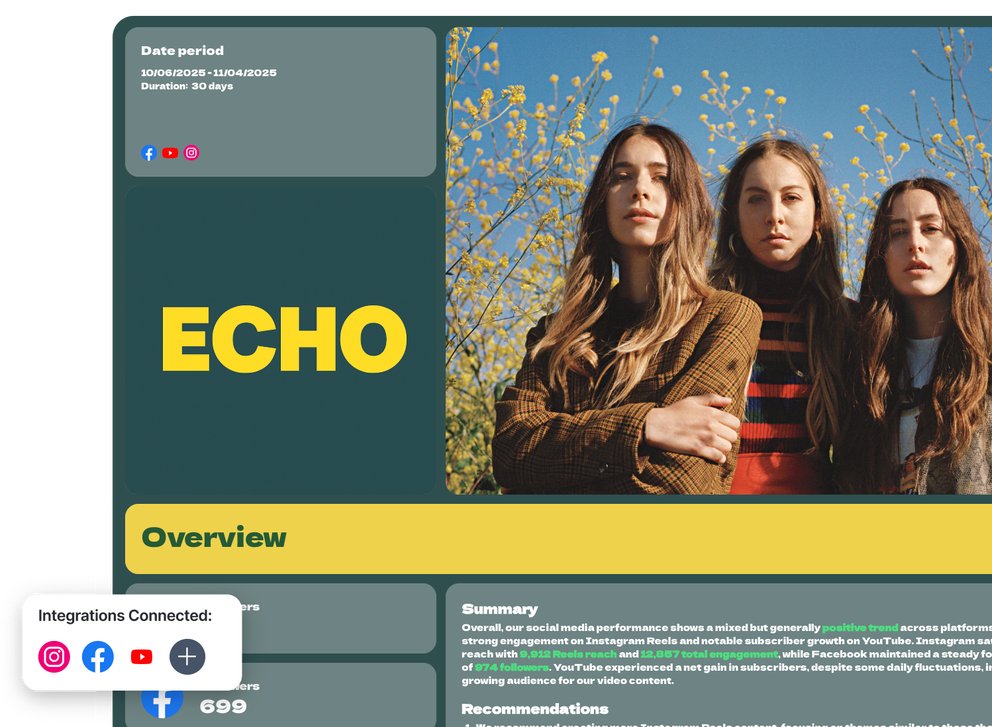
1. Cover Page
 Start with a polished first impression.
Your cover should include your brand logo, a featured image, and the report title. Add the reporting period and duration so clients instantly see what timeframe the data covers.
If you manage multiple platforms, include small channel icons (like Facebook, Instagram, or YouTube) for quick visual context.
2. Overview
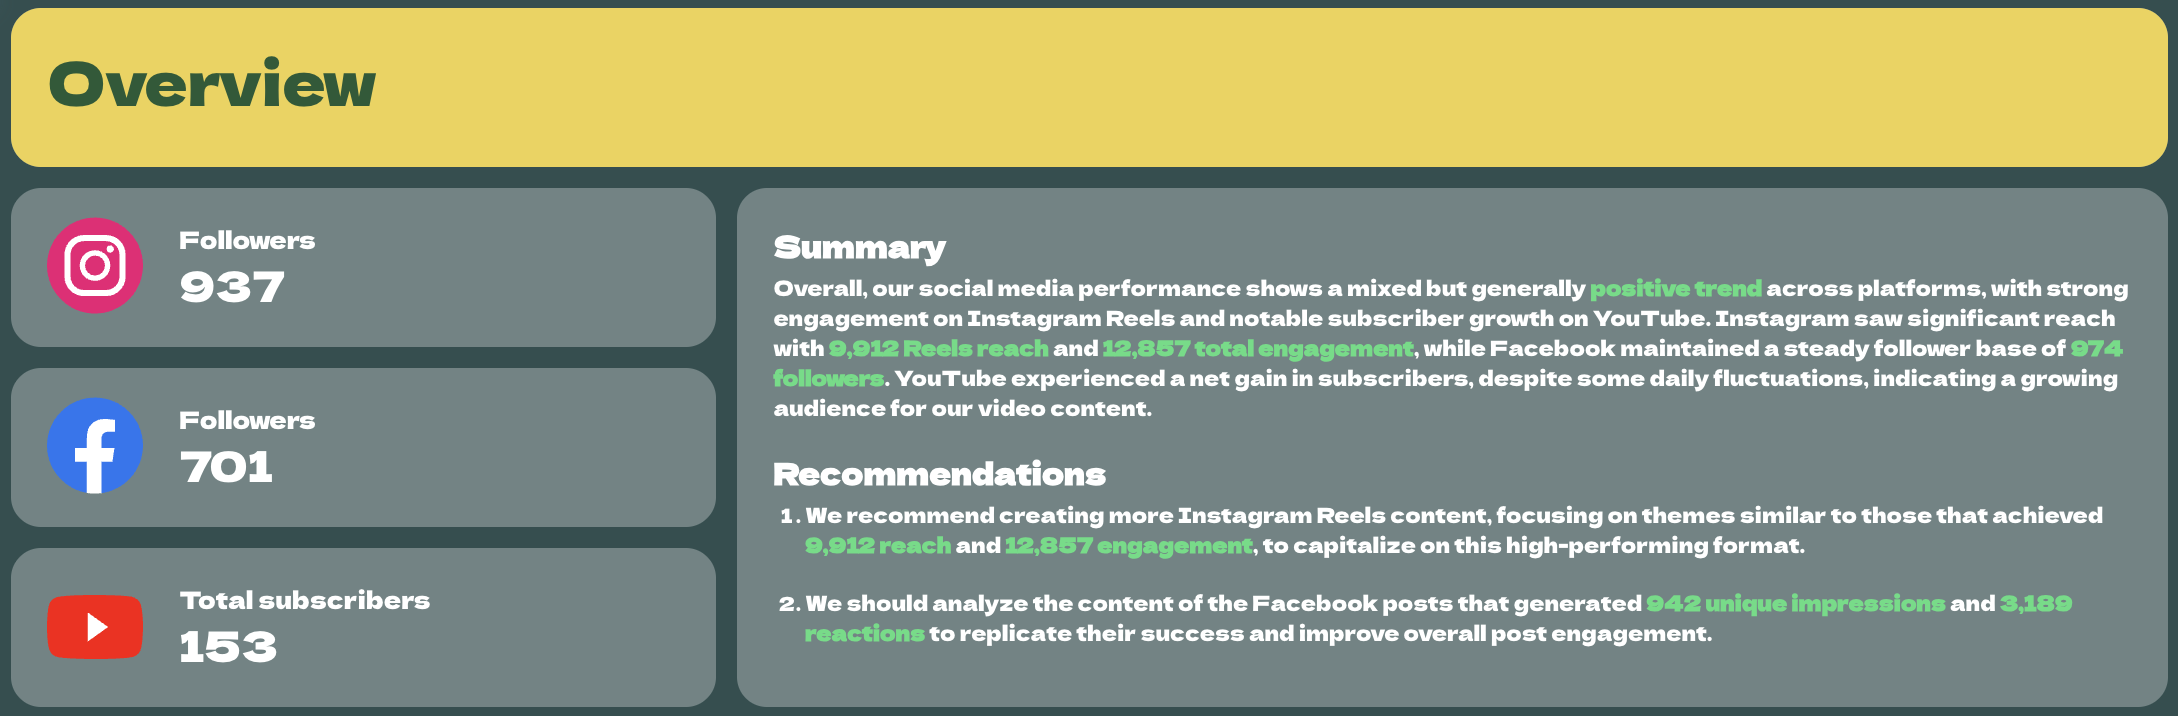 This is the big-picture snapshot. Summarize performance across all your active channels, highlighting key KPIs such as followers, engagement, reach, and impressions.
Add a short written summary that explains what happened this month: the wins, dips, and next step recommendations.
As Alexander Mitrofanov, Senior Paid Media Specialist at Tag Worldwide, says it best: “If your report doesn’t include 'what we’re doing next,' it’s incomplete.”
With Whatagraph IQ, you don’t have to write summaries manually.
IQ analyzes your actual social media data on your report, identifies trends, and automatically writes summaries in 18 languages.
You can also choose from content type: Summary, Wins, Issues, Recommendations, or write a custom prompt. You can still edit the text IQ has written to maintain that human touch.
Since the data never leaves Whatagraph, there’s zero risk of data breaches or hallucinated insights like with external AI tools.
3. Channel Breakdown: Instagram
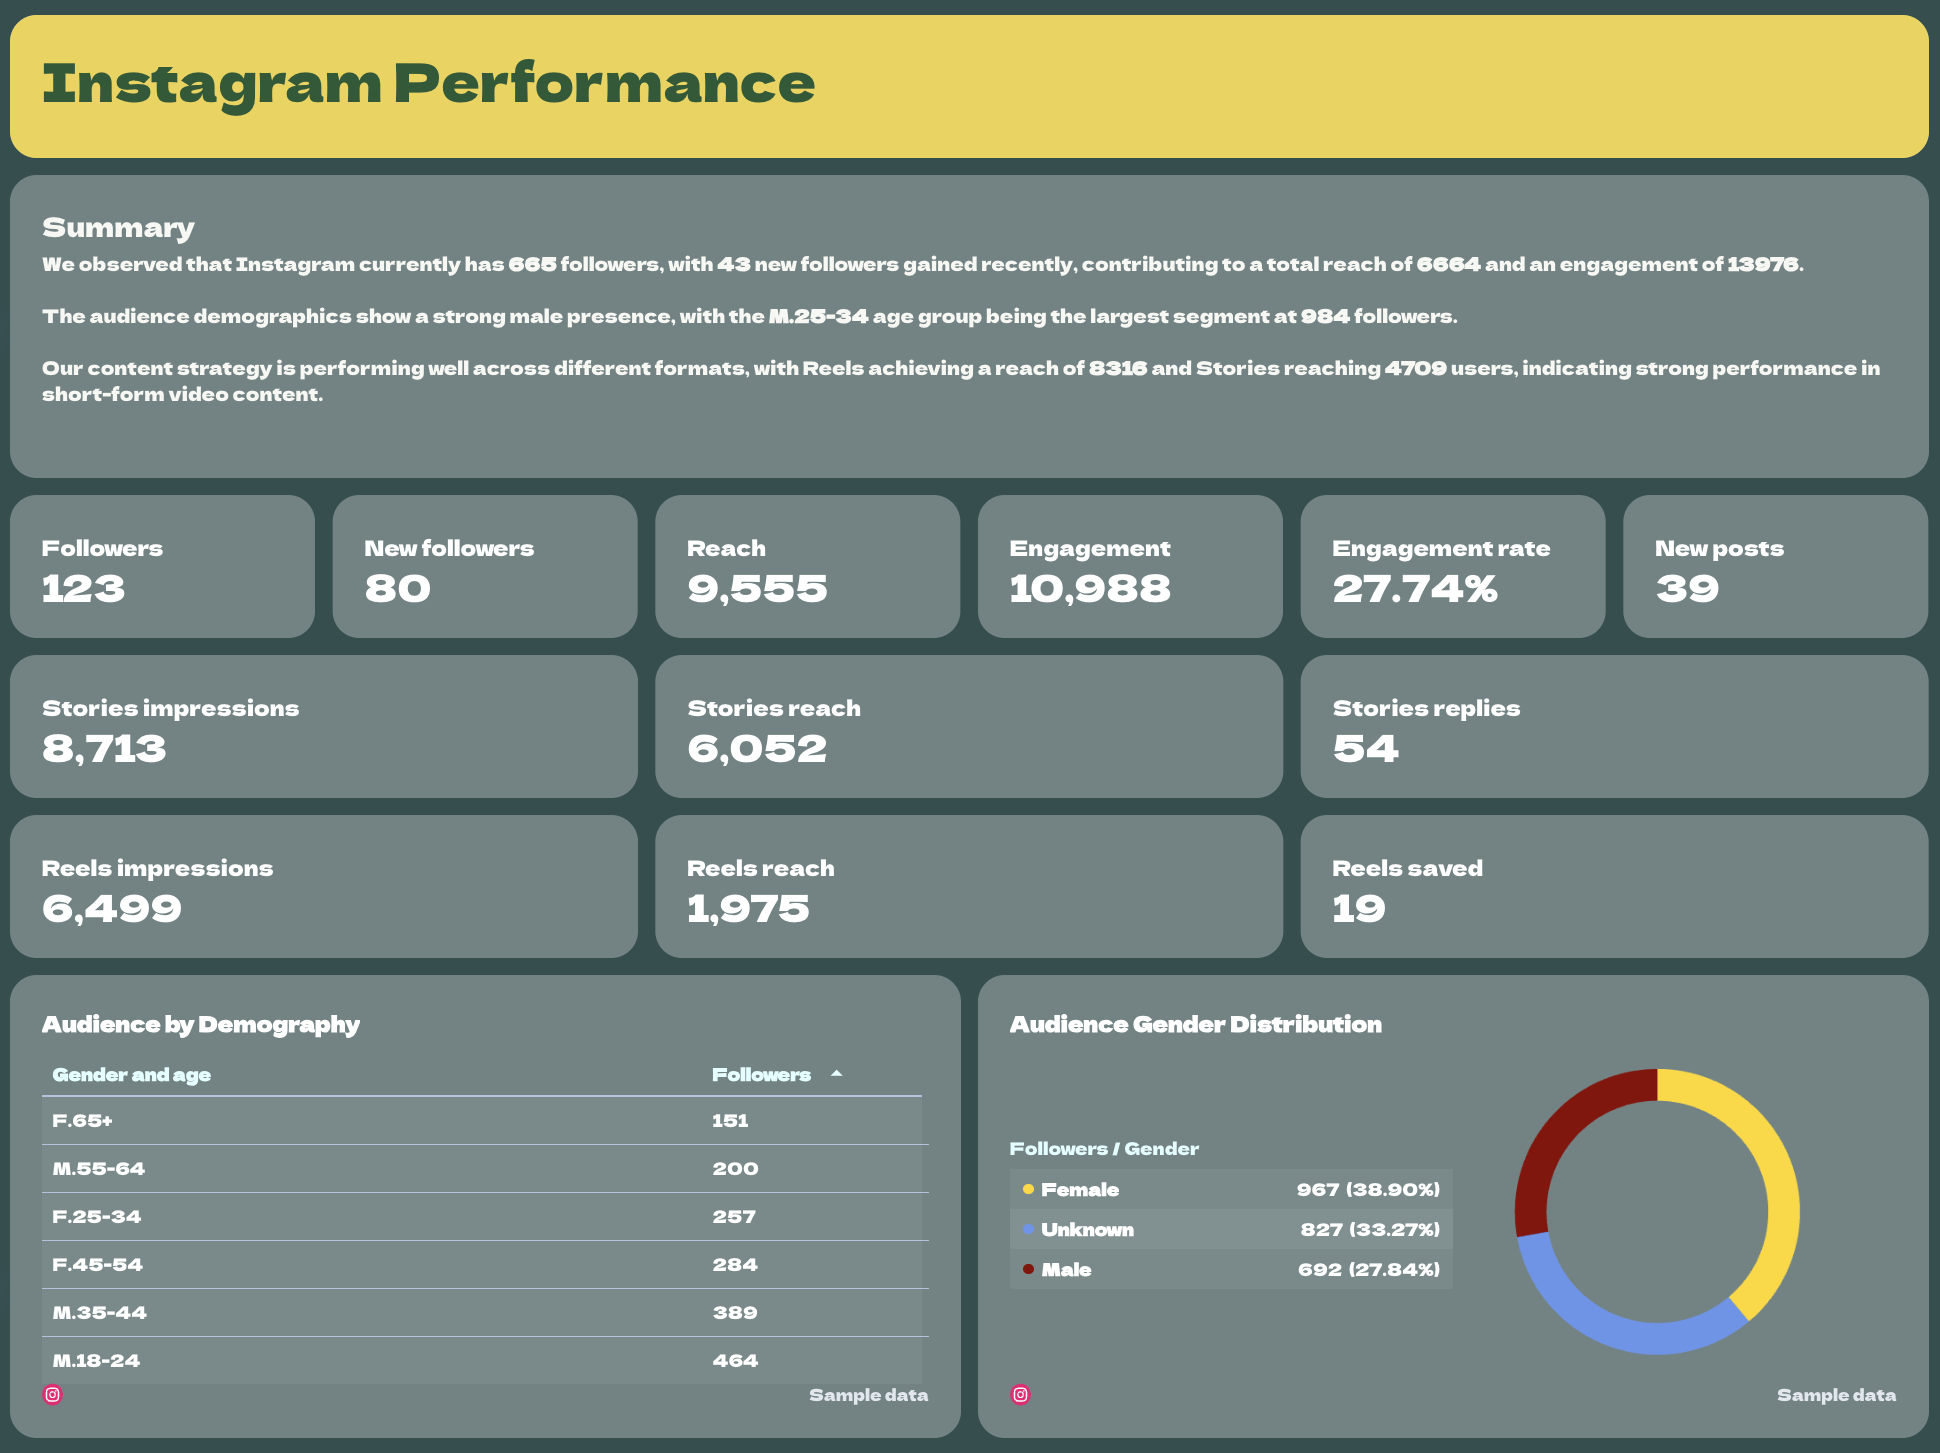
Drill down into how each social media platform performed, starting with Instagram social media analytics report template.
Begin with a quick summary: audience growth, engagement trends, and top-performing content.
Then show:
- Key KPIs: followers, reach, engagement rate, new followers, and impressions — in single-value widgets.
- Audience insights: demographics by age and gender, displayed in clear visual charts.
- Post performance: a pivot-style table breaking down every post’s impressions, reach, likes, and interactions.
- Trends over time: include graphs for Reach vs. Followers and Stories/Reels performance.
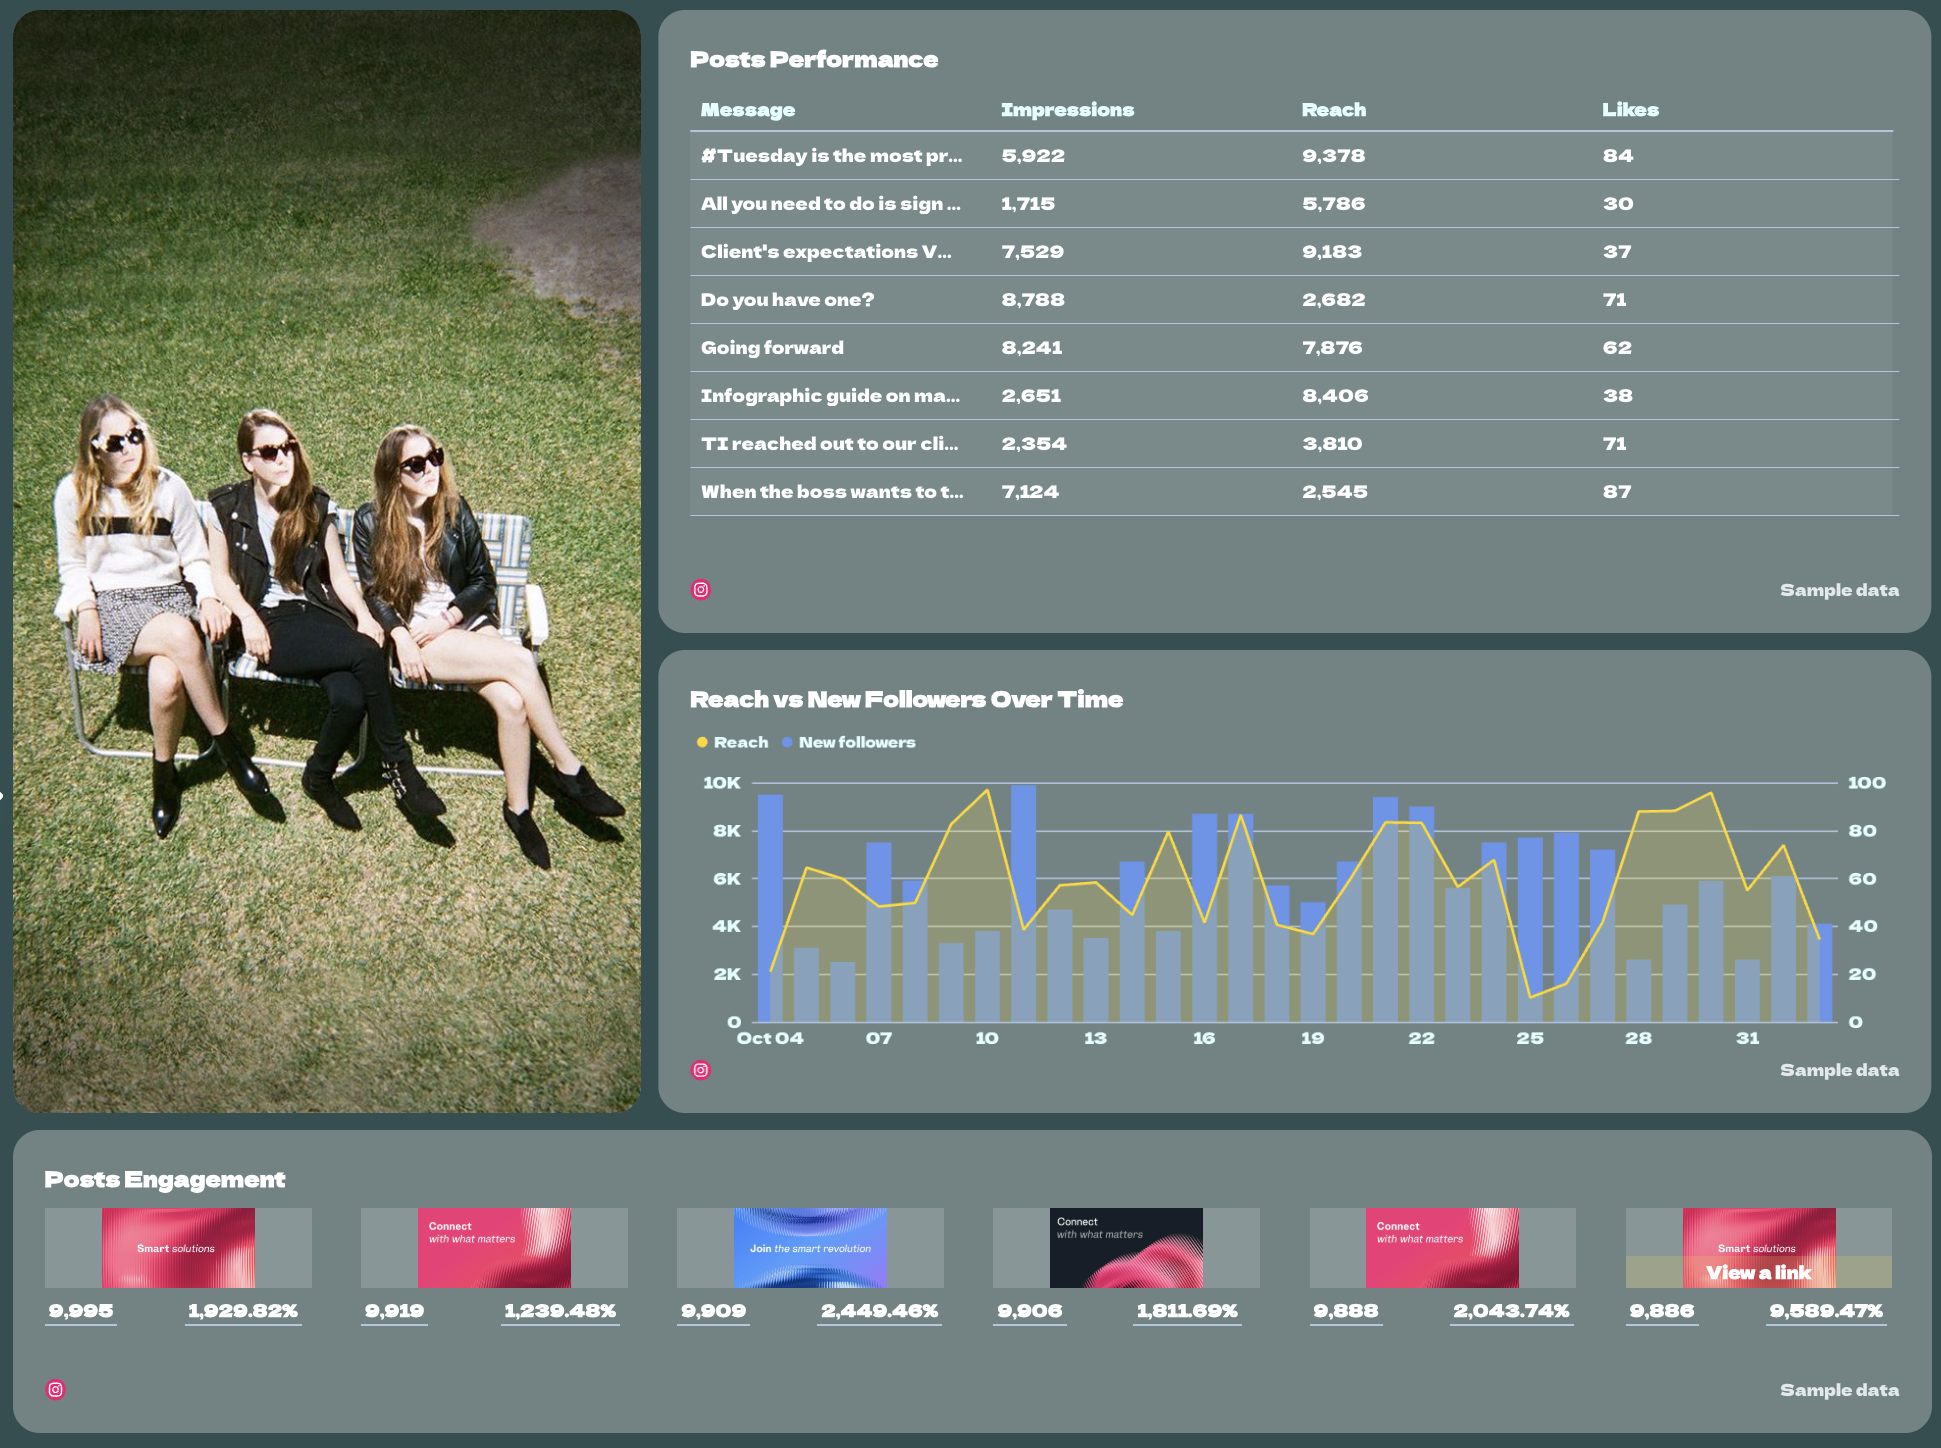
Wrap up the section with recommendations: what worked, what didn’t, and how to optimize for next month.
4. Channel Breakdown: Facebook
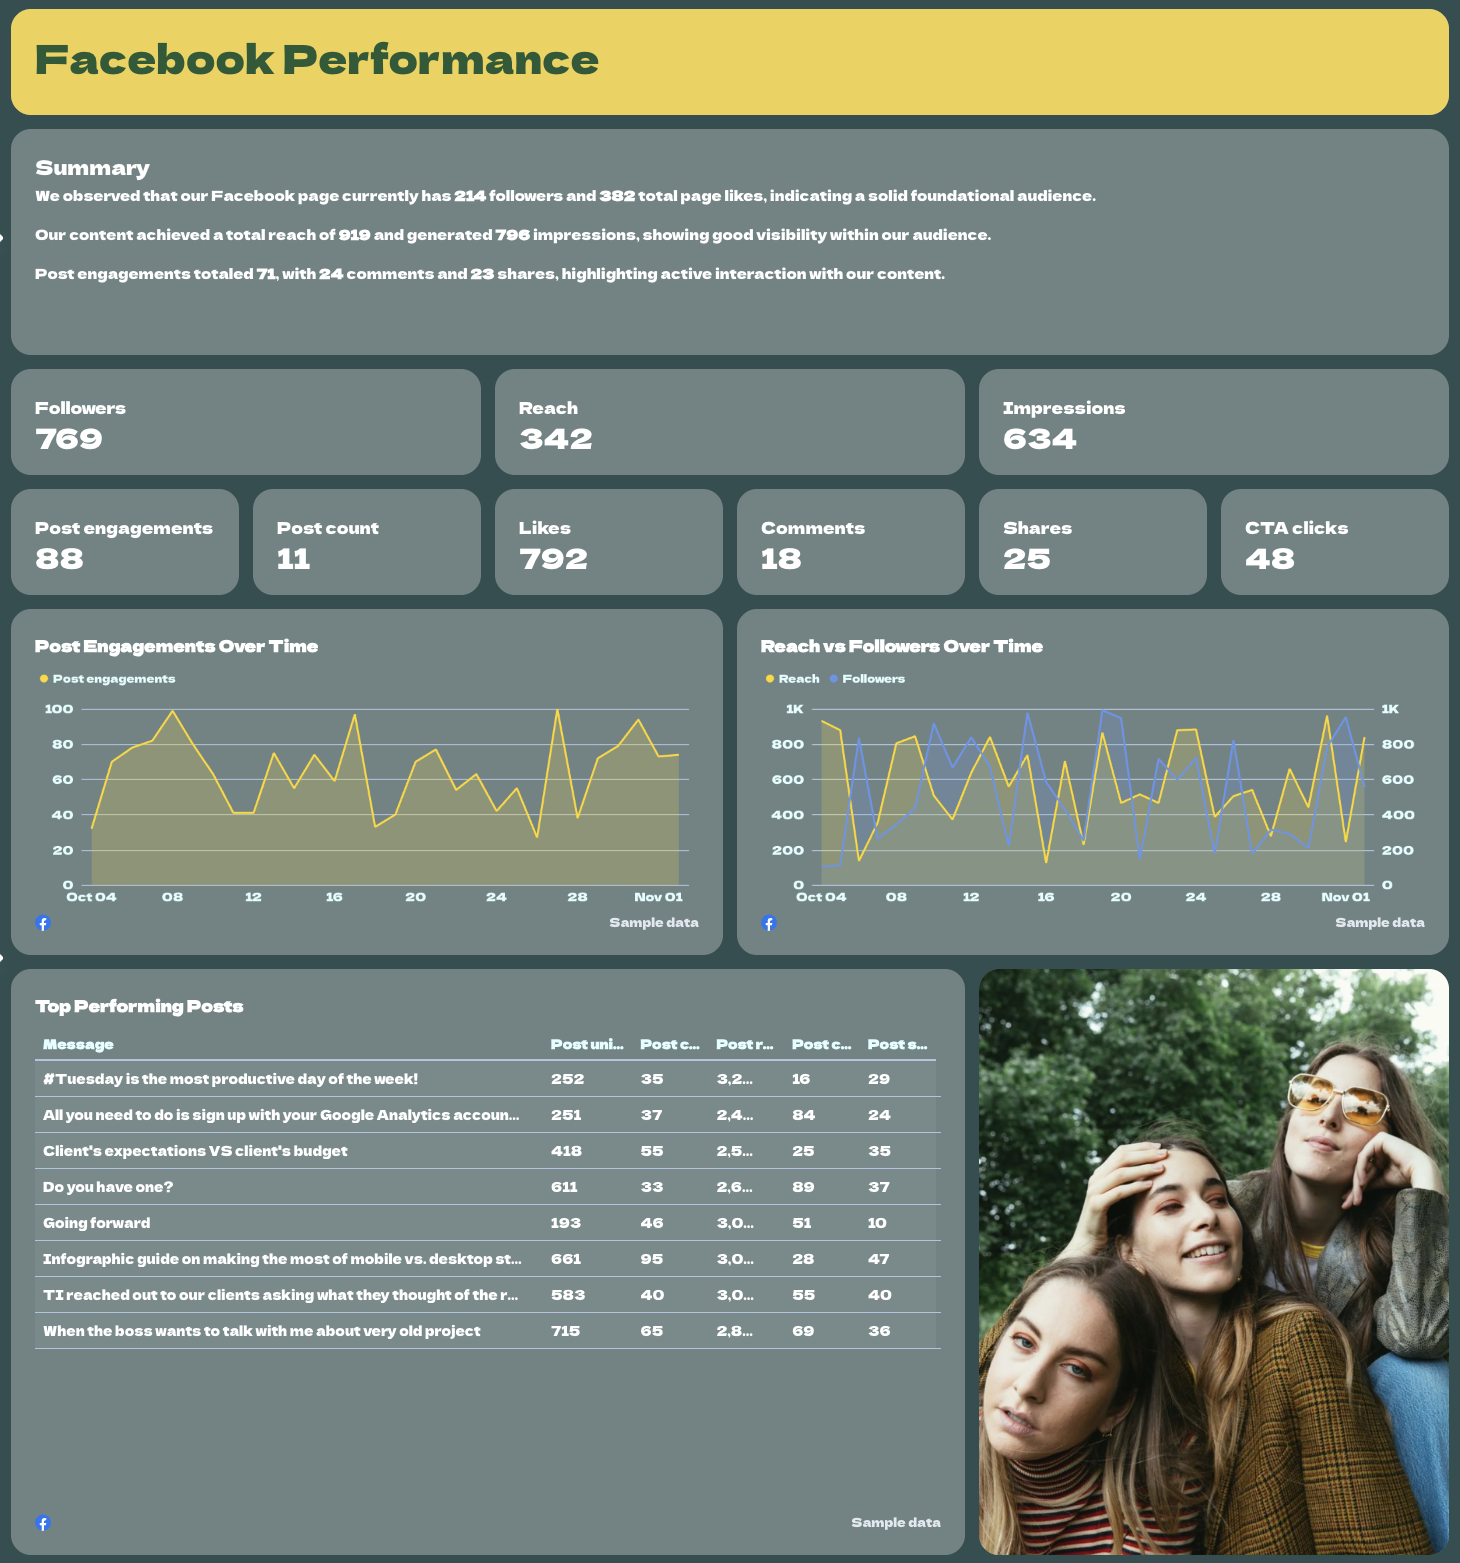
Next, spotlight your Facebook results in the Facebook social media report template section. Start with a summary that captures the highlights: audience growth, post engagement, and overall visibility.
Follow with:
- Important KPIs: followers, reach, impressions, post count, likes, comments, shares, and clicks.
- Performance over time: line charts showing post engagement and content performance, reach, and followers trends.
- Top performing posts table: the most engaging posts of the month, sorted by likes or reach.
- Engagement breakdown: simple pie charts that visualize the share of likes, comments, and shares.
- Top performing locations: tables listing the best-performing countries and cities to show where your audience is most active.
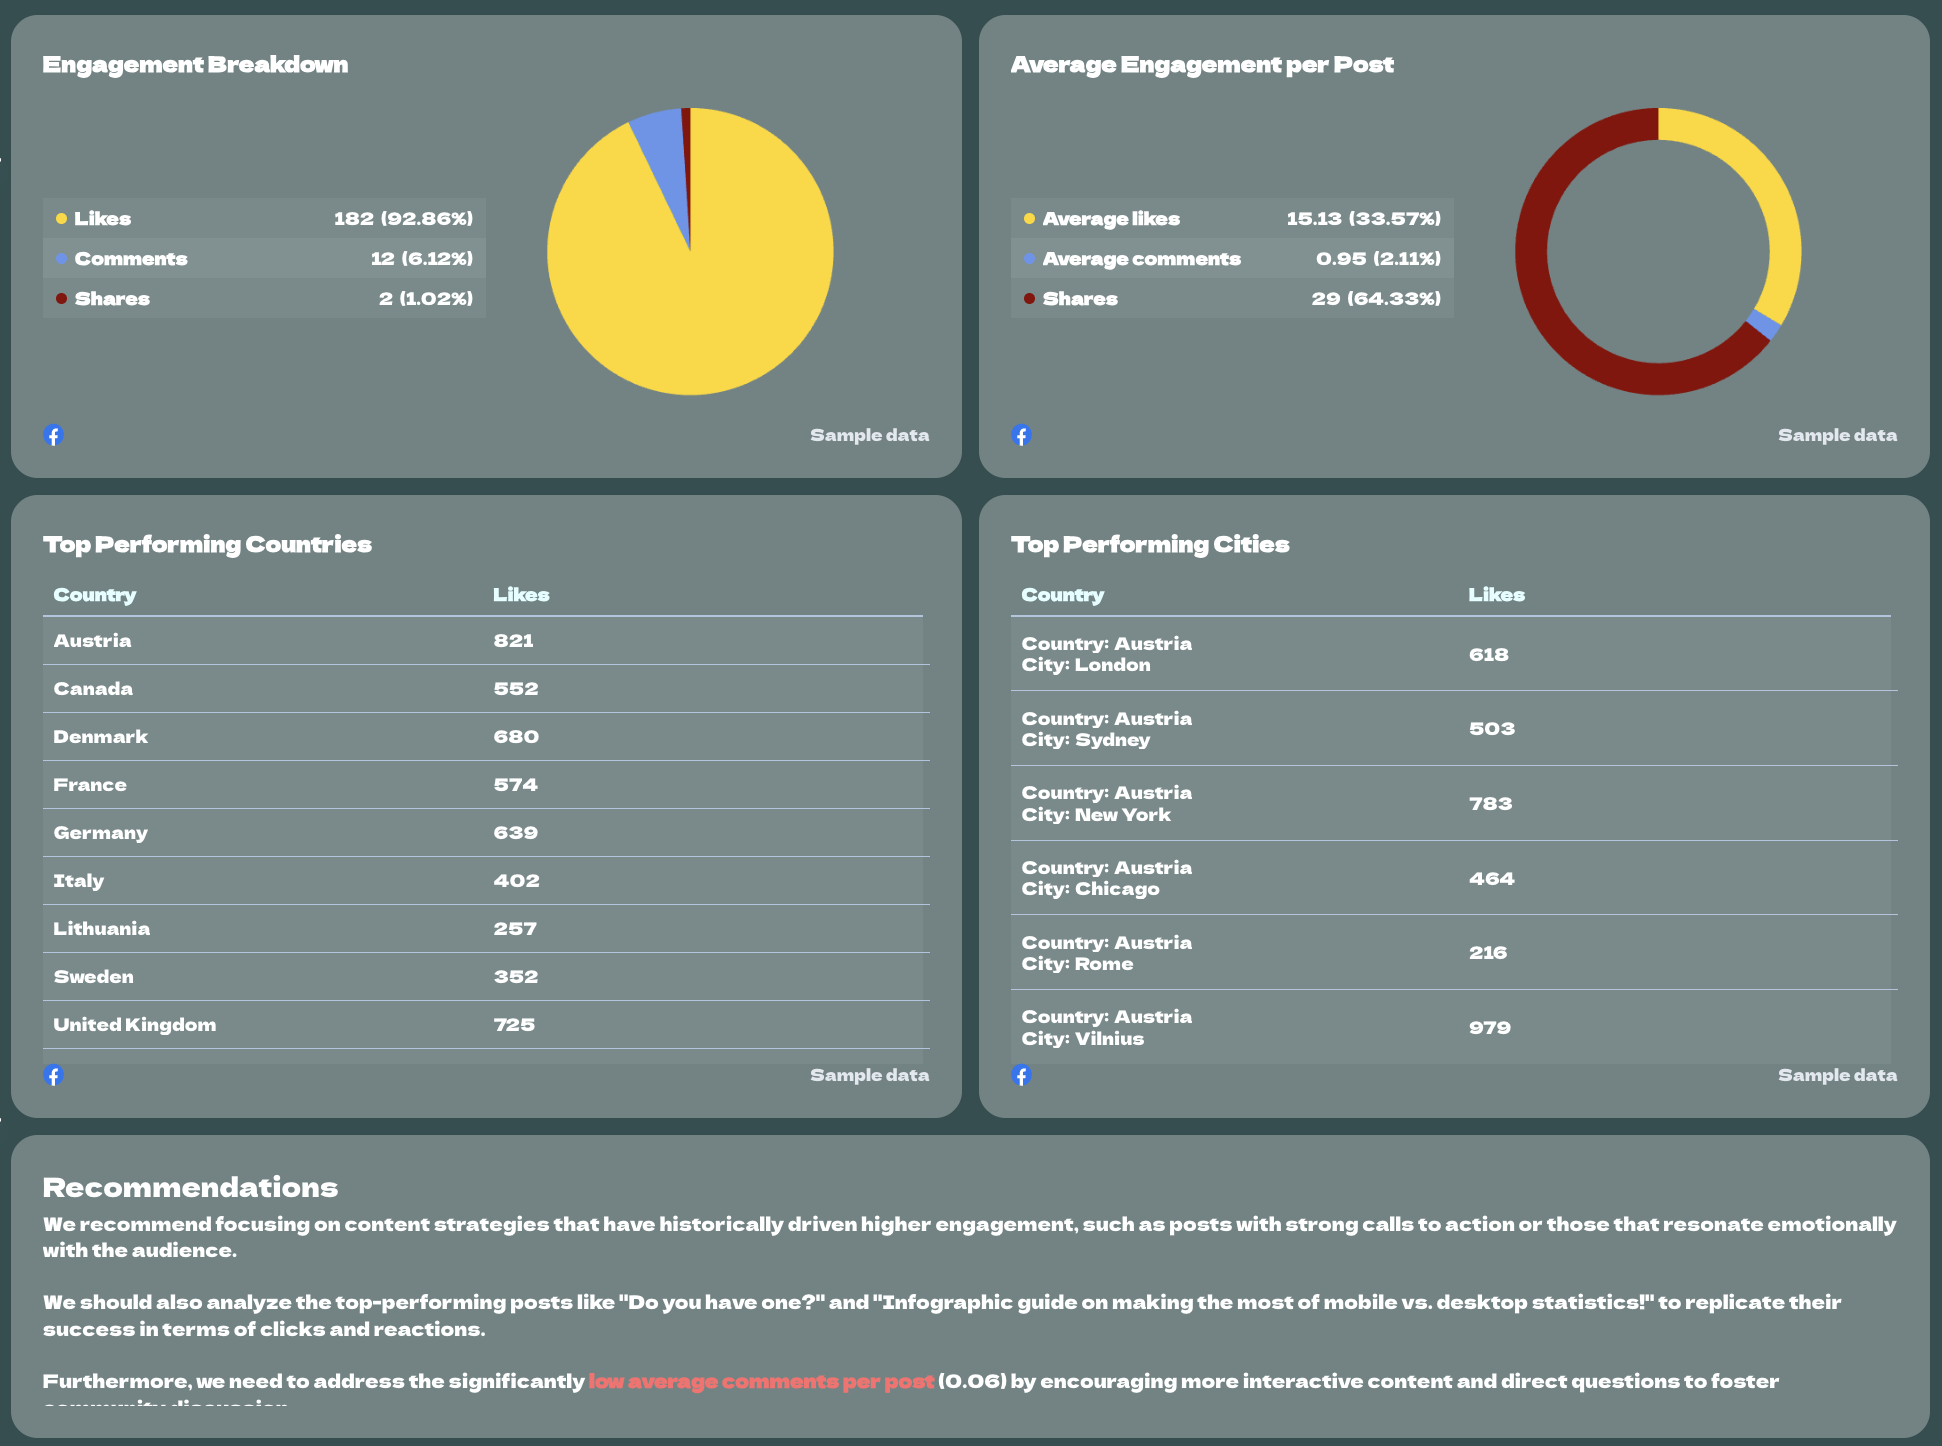
Close this section with recommendations on how to replicate top-performing content or re-engage less active regions.
5. Channel Breakdown: YouTube
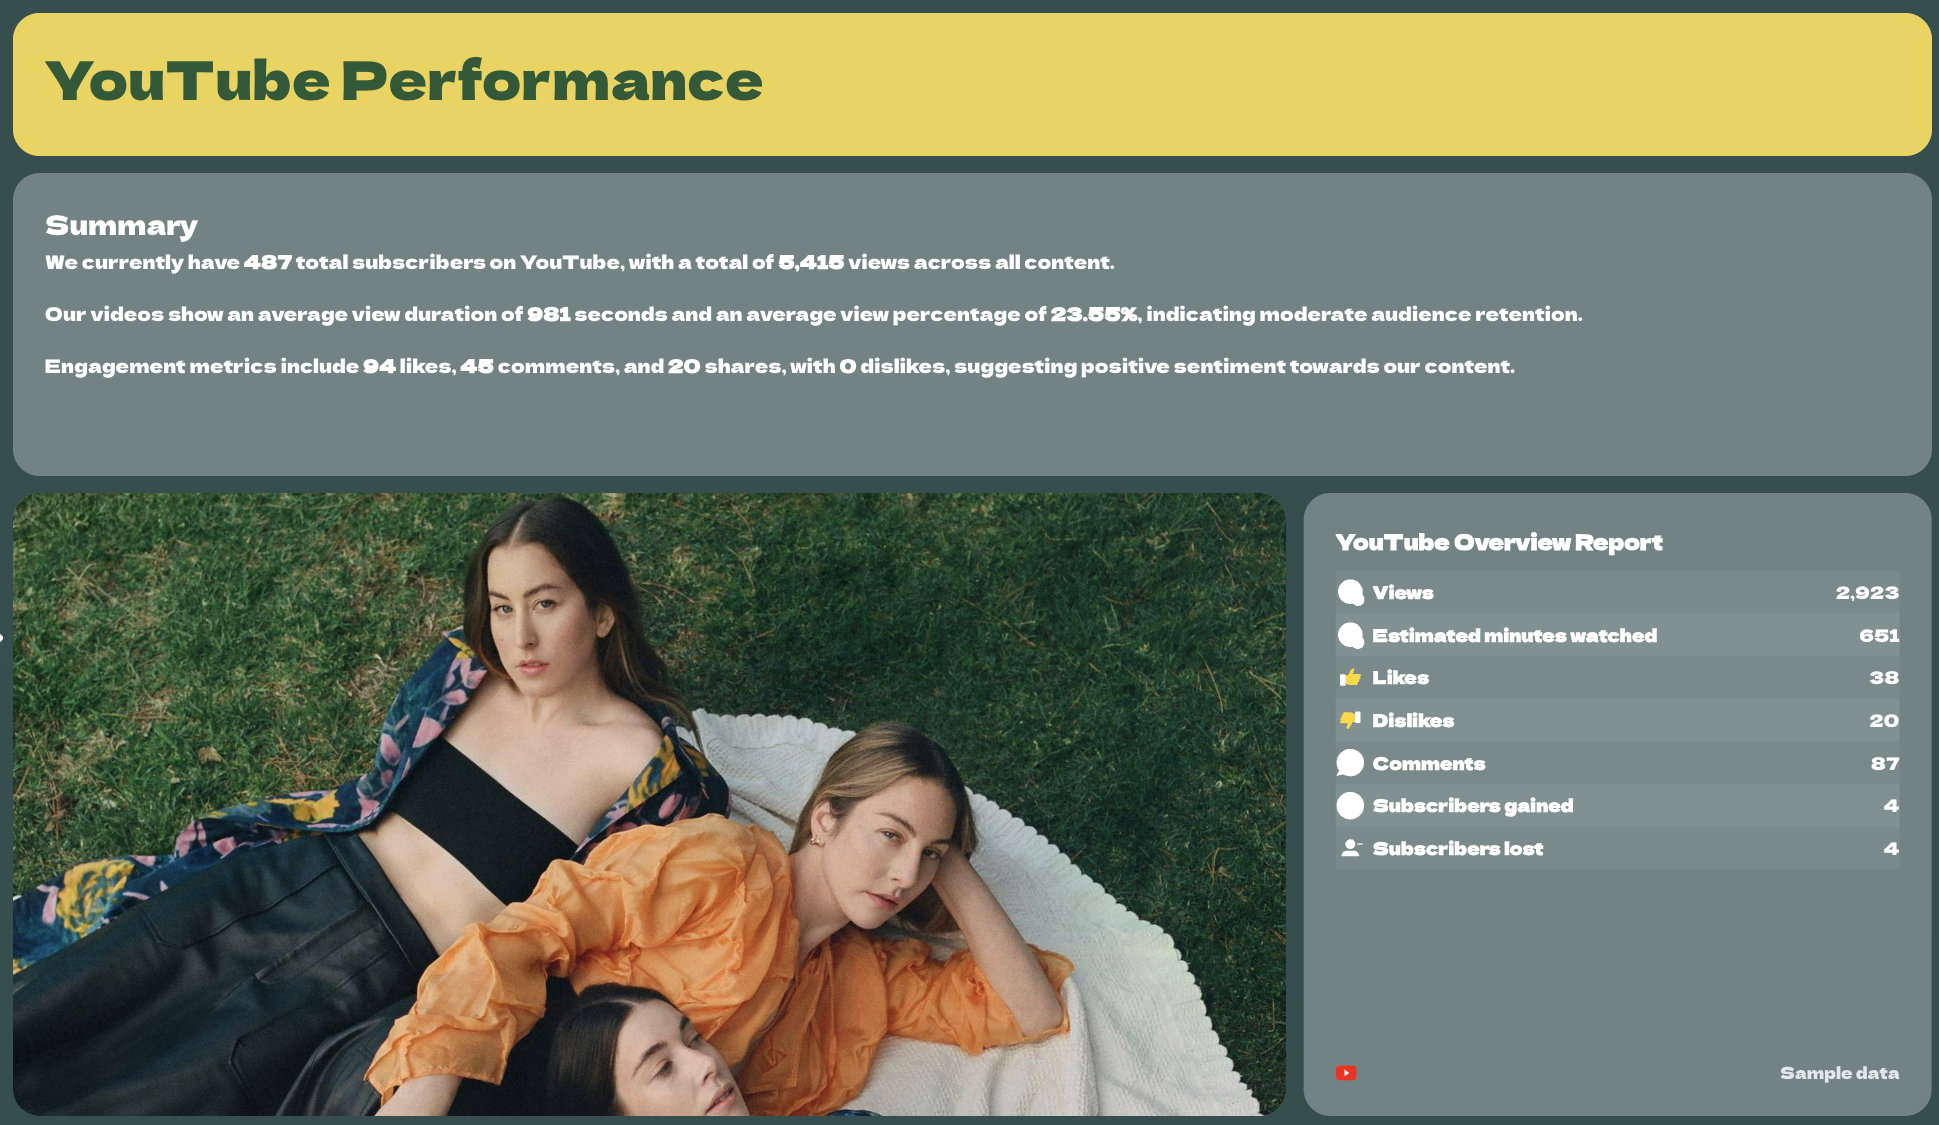
Finally, include a full YouTube performance overview. Begin with a summary of key stats: total subscribers, watch time, and engagement.
Add the YouTube Overview Report, which shows at a glance:
- Views, watch time, likes, dislikes, comments, subscribers gained, and lost.
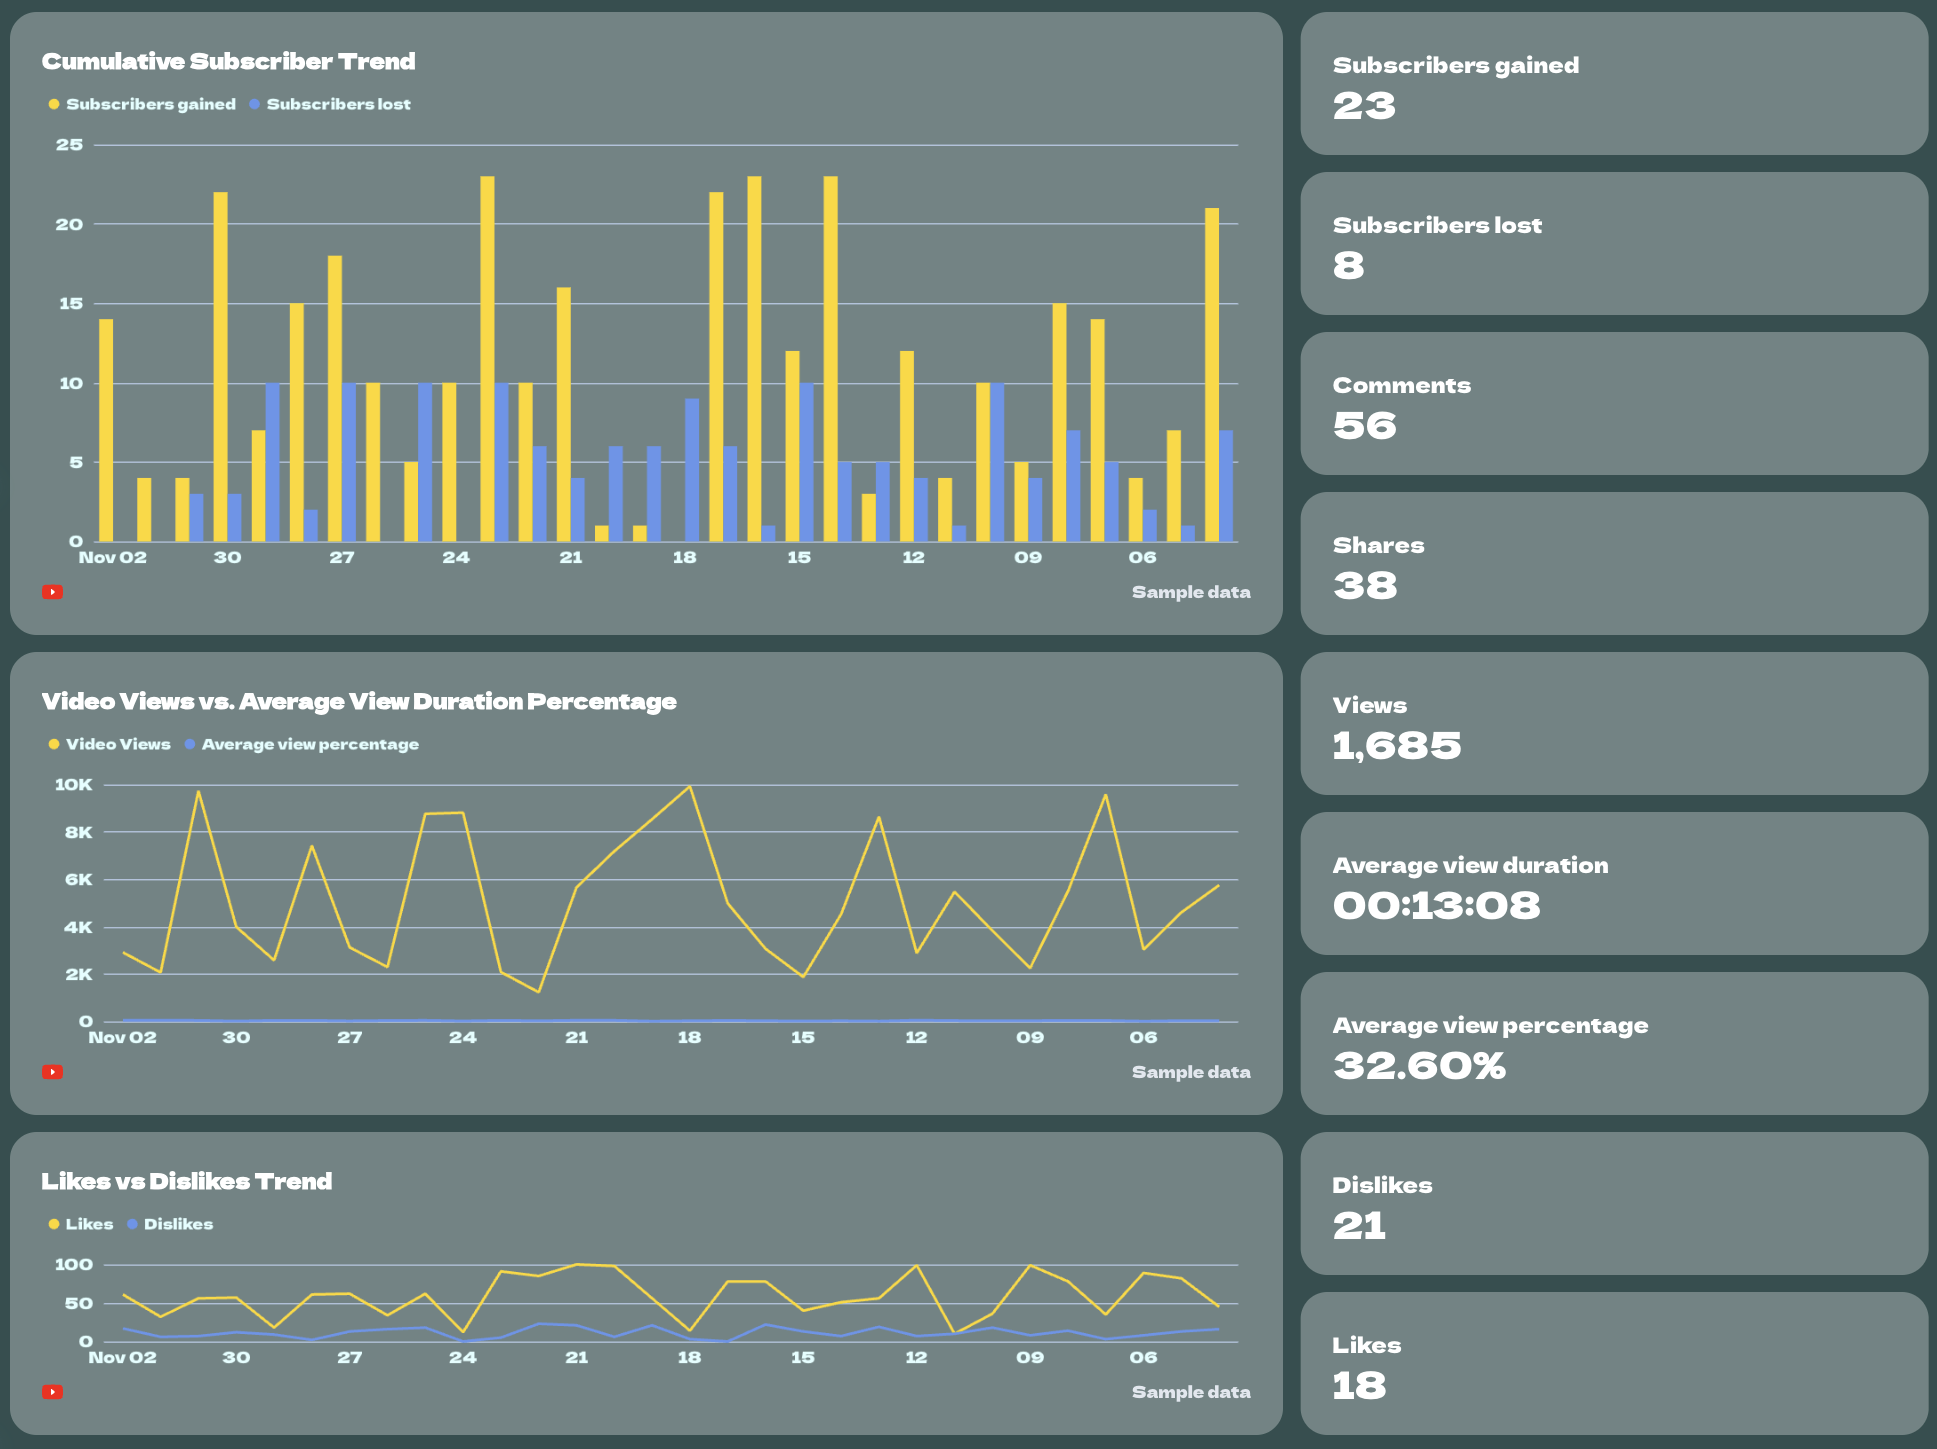
Then expand with:
- Trend charts for Cumulative Subscriber Growth, Video Views vs. Average View Duration, and Likes vs. Dislikes.
- Video Performance Table — breaking down each video’s performance indicators (views, likes, dislikes, subs gained/lost).
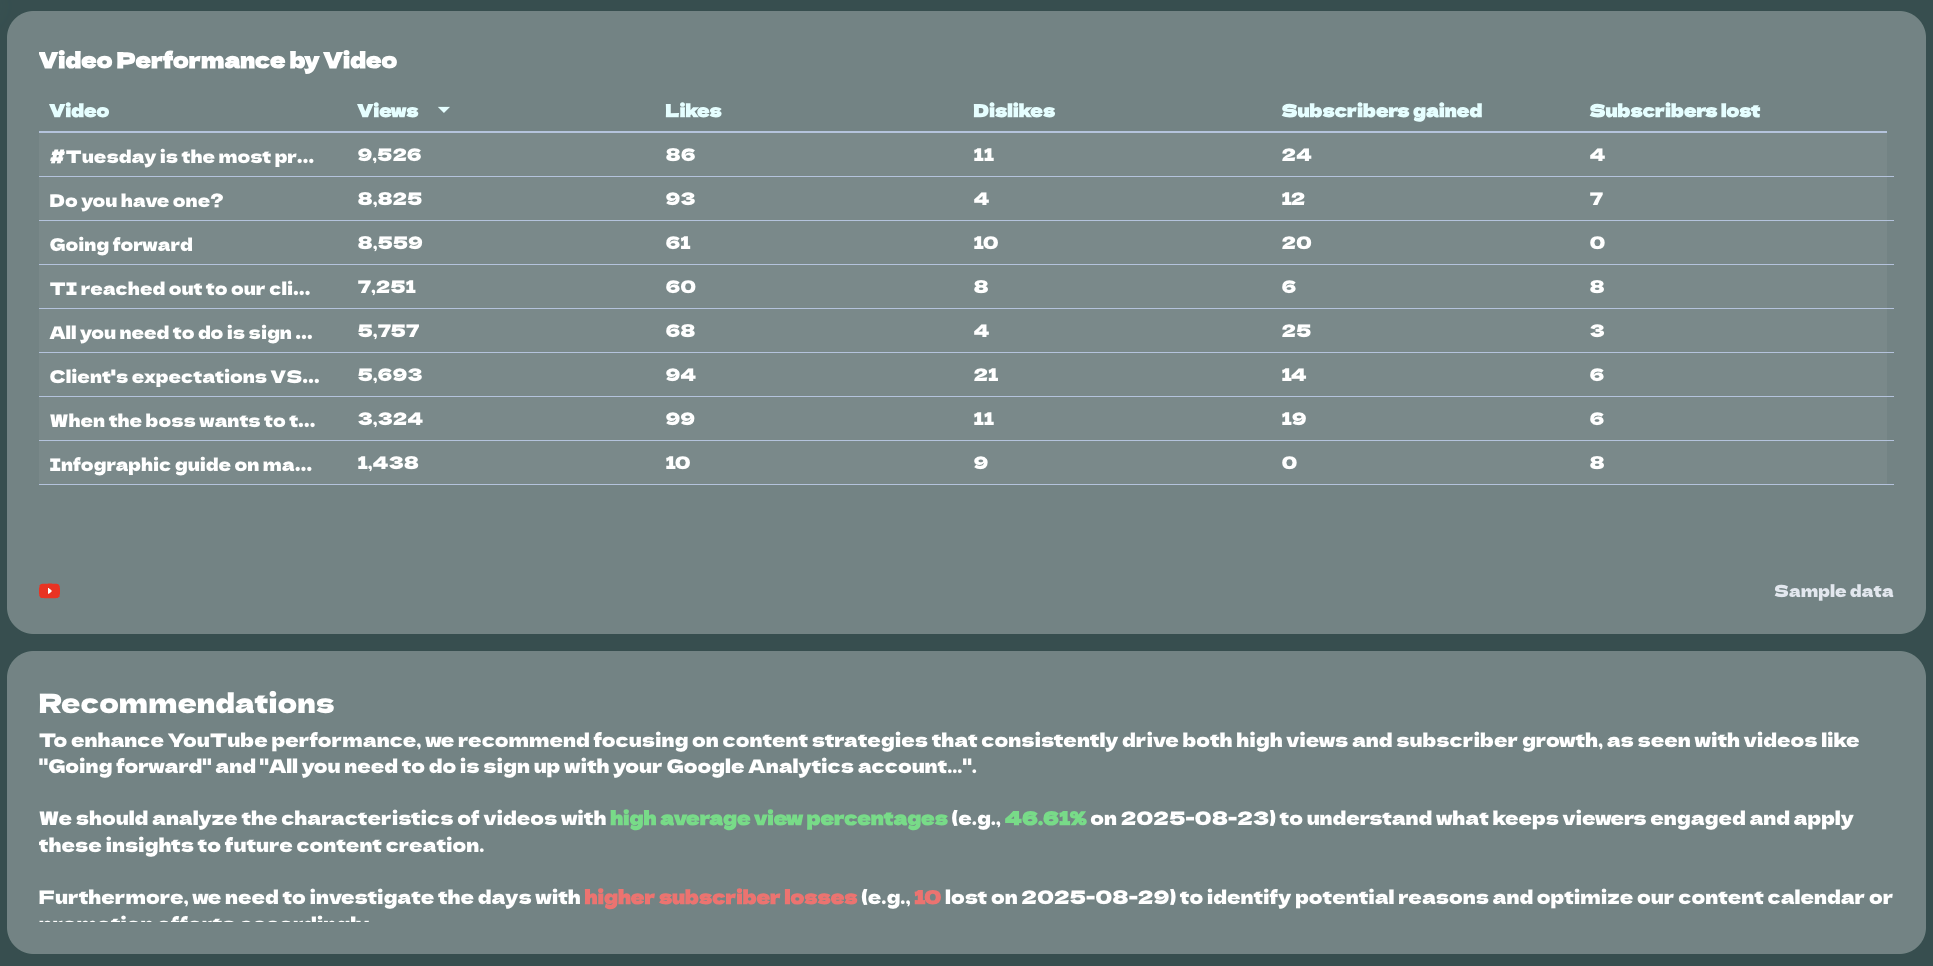
Wrap up with recommendations on how to improve engagement, retention, and growth for the next period.
What Data Should You Include in a Social Media Metrics Report Template?
The best way to understand which KPIs to add to a social media metrics report template is to ask your clients (or your C-Suite) what they want to see.
As a general rule, the goal isn't to include everything. As Elizabeth Greene, the co-founder of Junglr puts it:
A dashboard with 27 million different metrics is often unhelpful or confusing. What we’ve focused on instead is identifying the few core KPIs that help us quickly spot when something is going wrong in an account - because we want to catch negative trends as early as possible.
Here’s a breakdown of the most essential KPIs to track for your social media campaigns:
1. Engagement KPIs
These show how your audience interacts with your content—and how well your messaging resonates.
- Likes/Reactions – A simple but strong indicator of how much your content is appreciated.
- Comments – Show how engaged your audience is and what they care enough to respond to.
- Shares – Measure how valuable or relatable your content is to the point users want to pass it on.
- Saves (Instagram/TikTok) – A sign that your content has long-term value for the viewer.
- Engagement Rate – Combines all engagements relative to reach or followers, giving you a true sense of content effectiveness.
2. Performance KPIs
These help you measure reach, visibility, and how often your content is seen.
- Impressions – Total times your content was displayed—great for visibility tracking.
- Reach – The number of unique users who saw your content—key for brand awareness.
- Video Views / Completion Rate – For video-heavy channels, these show viewer interest and content stickiness.
- Post Frequency – Helps assess how consistent your posting is and its impact on engagement and growth.
3. Audience growth KPIs
These track how your community is evolving across different platforms.
- New Followers – A core indicator of how well your content and campaigns attract new audiences.
- Follower Growth Rate – Measures momentum over time, not just raw numbers.
- Total Followers – Gives context to your reach and engagement performance
4. Paid social KPIs
If you're running social ads, these show whether your spend is turning into real results.
- Ad Spend – The total amount spent on paid campaigns—essential for budget tracking.
- CTR (Click-Through Rate) – Indicates how compelling your ad content is.
- CPC (Cost Per Click) – Measures how efficiently your ads drive traffic.
- Conversion Rate – Tells you how effective your ads are at driving actions.
- ROAS (Return on Ad Spend) – A key metric for proving ad profitability.
- Cost per Result (e.g. Lead, Purchase) – Lets you optimize for the most efficient outcomes.
5. Conversion & traffic data
These connect social media efforts to business goals and on-site behavior.
- Clicks – How many users clicked on your content—great for driving traffic analysis.
- Landing Page Views – Measures actual interest beyond just a click.
- Conversions (Leads, Purchases, etc.) – Shows how well your social media drives real business outcomes.
- Assisted Conversions – Highlights the role of social in multi-touch journeys.
- Scroll Depth – Indicates how engaging your landing page content is post-click.
Conversion metrics are what tie every other number in the performance report back to the bottom line. Tom Jauncey, the CEO of Nautilus Marketing sums it up:
Clients mostly care about the results - bottom line. ROI, lead conversions, and growth metrics are what they’re really looking for. Fancy visuals are nice, but they just want to know: is this working?
6. Audience insight KPIs
These help you understand who you're reaching—and how to tailor your strategy.
- Top Performing Audience Demographics – Helps tailor content to the age/gender groups that engage most.
- Top Geo-Locations – Reveals which regions respond best to your marketing campaigns.
- Device Type – Helps optimize visuals and user experience based on where your audience is browsing.


