Free TikTok Ads Report Template

Turn your TikTok Ads data into actionable insights in seconds.

Track video performance, CTR, and engagement metrics in one holistic TikTok Ads report template.

TikTok Ads Report Template - Dashboard showing performance overview, charts, metrics, and integration options.

How to Use Whatagraph's TikTok Report Template

Create Custom TikTok Ads Report Templates in Seconds

With Whatagraph IQ, just tell us what you need, and we'll build a stunning TikTok Ads report for you. No templates or manual setup needed.

What to Include in a TikTok Performance Report Template?

A TikTok ads report template gives you a complete view of your campaign performance, from ad spend and reach to conversions and demographics. Here’s how to structure it for clear insights and easy sharing.

1. Performance Summary

TikTok Ads Report Template - A report with key metrics about TikTok ads performance.

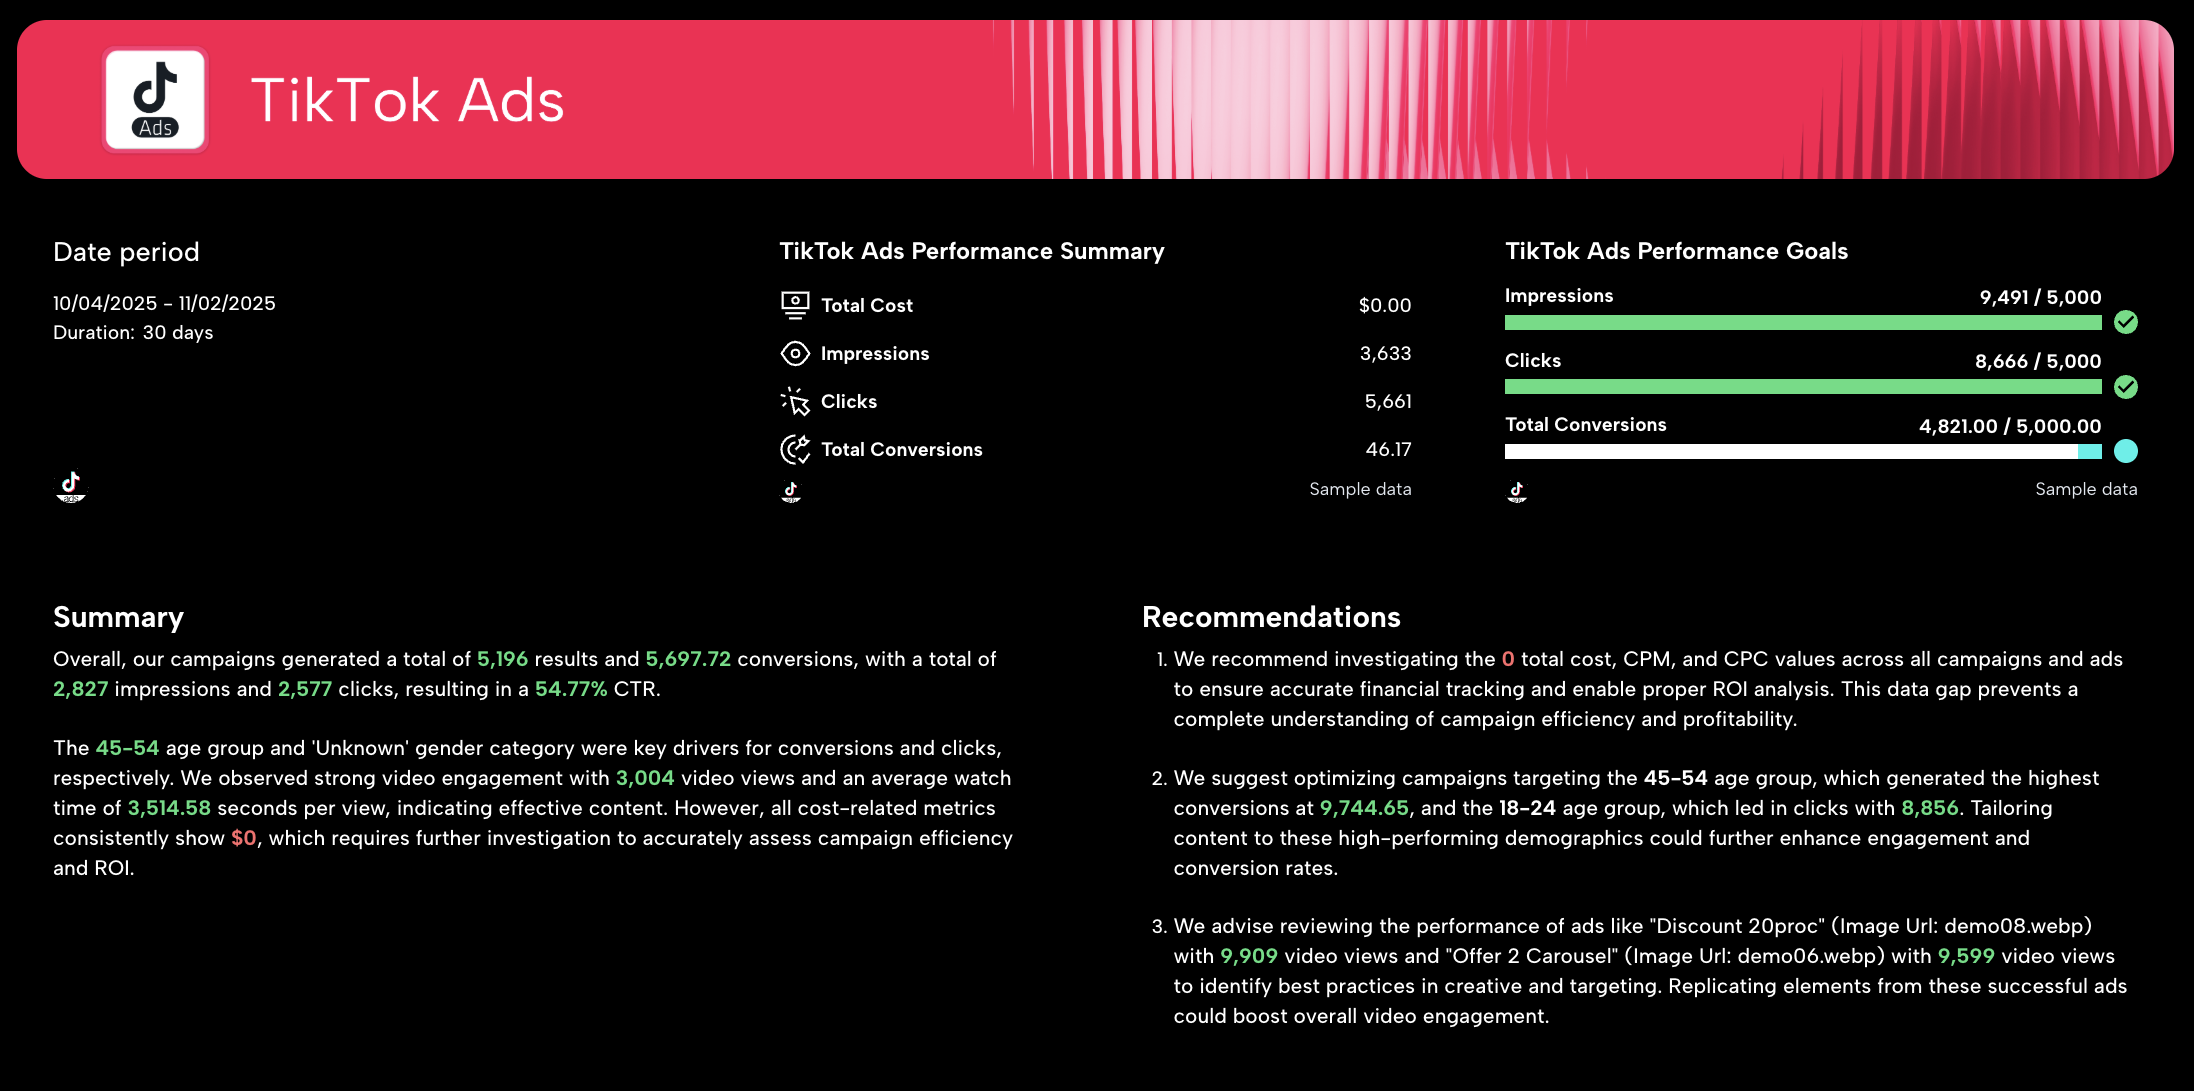
Start your report with a clear overview of your TikTok ad campaigns for a specific time period.

Include:

  • A goal widget showing KPI progress such as impressions, clicks, conversions, and engagement.
  • A performance summary list that displays these metrics for the reporting period, like “last 30 days.”
  • Text widgets for insights, recommendations, and next steps.

With Whatagraph IQ, you no longer have to write summaries manually. You can ask Whatagraph to write them in 18 different languages, based on the data already in your report. For example, you could write a custom prompt like “Summarize key wins and recommend optimizations for the next campaign cycle.”

IQ uses your actual TikTok data to generate insights, so there are no hallucinations or inaccuracies. You can fully edit the text to match your tone and style, and because everything happens inside Whatagraph, there’s no risk of data breaches or sharing information with third-party tools.

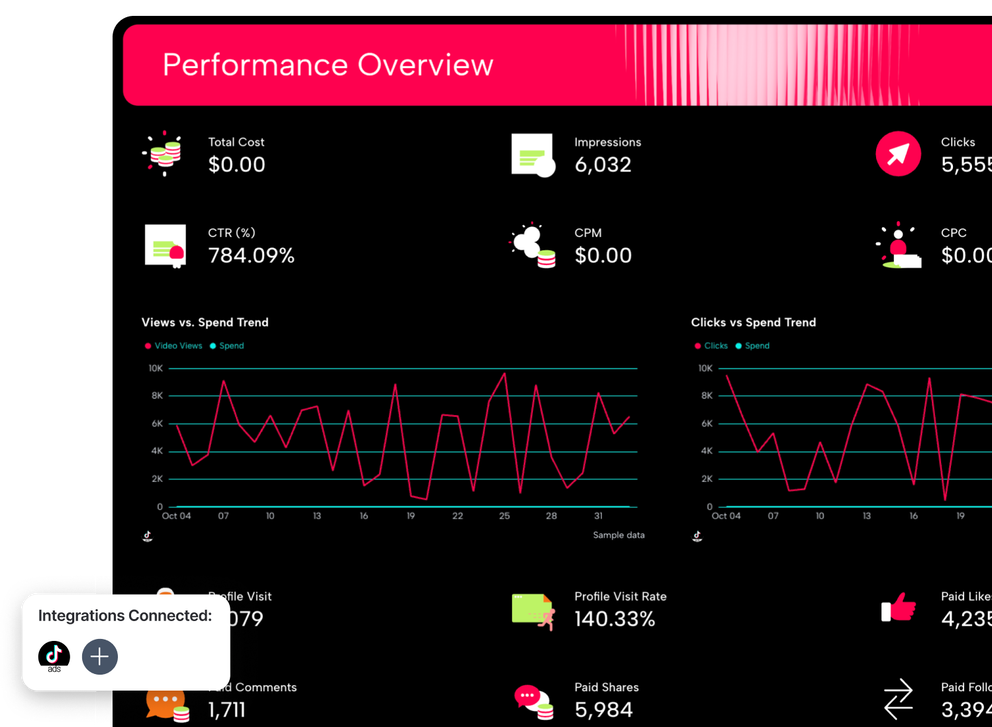
2. Performance Overview

TikTok Ads Report Template - A dashboard showing performance metrics for TikTok ads.

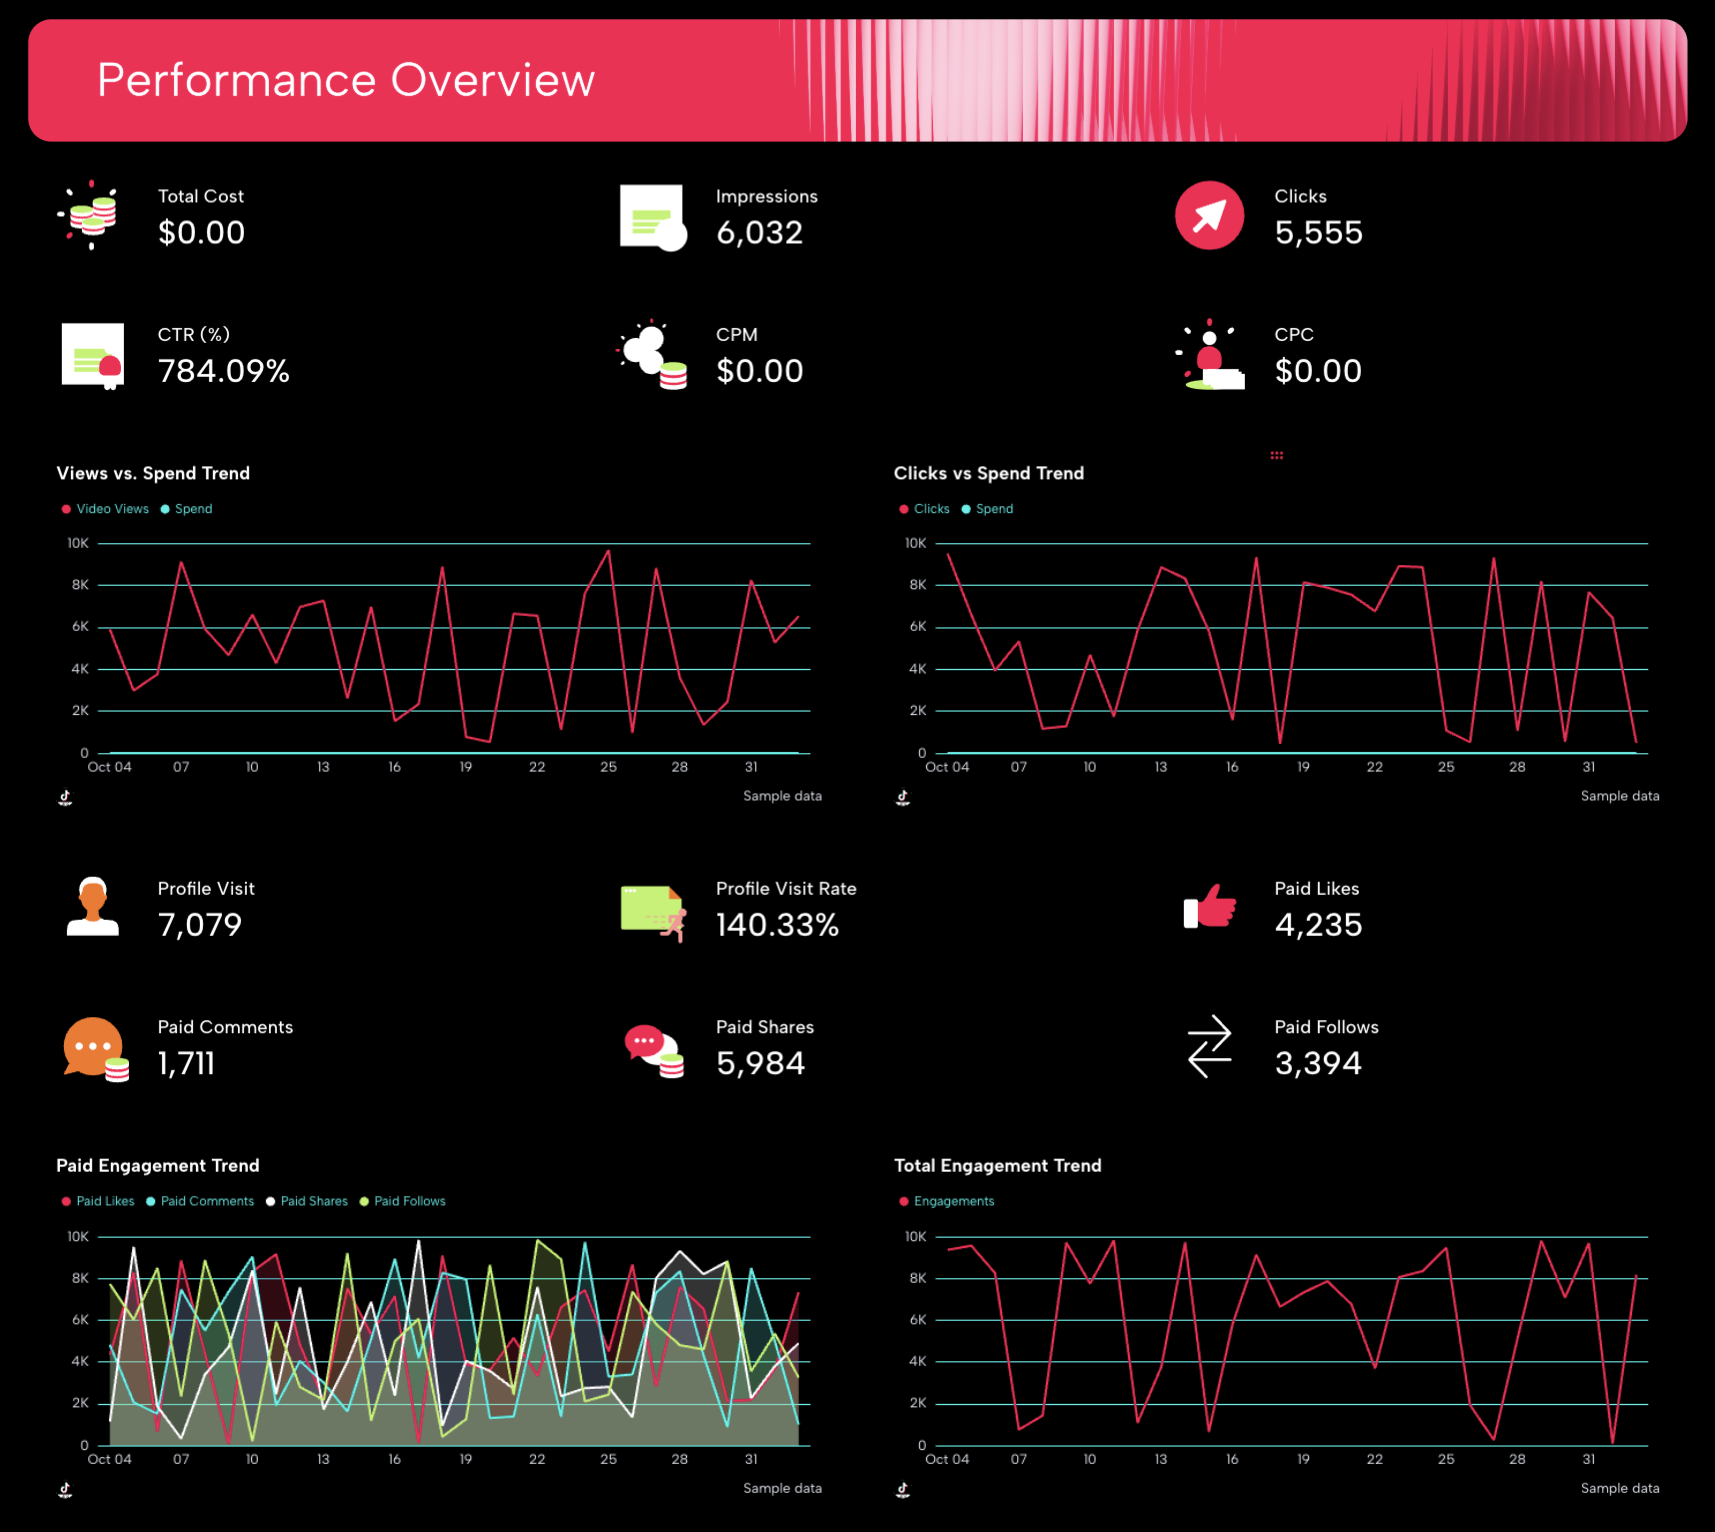
This section visualizes your most important KPIs in single-value widgets.
Show metrics like total ad spend, impressions, CTR, CPC, CPM, and conversion rate.

Compare these performance metrics with the previous period to show growth or decline. Add graphs or line charts to illustrate trends in real time, making it easy for clients or marketing teams to track progress.

3. Reach Breakdown

Reach Breakdown - Dashboard with charts tracking reach, results, and costs over time.

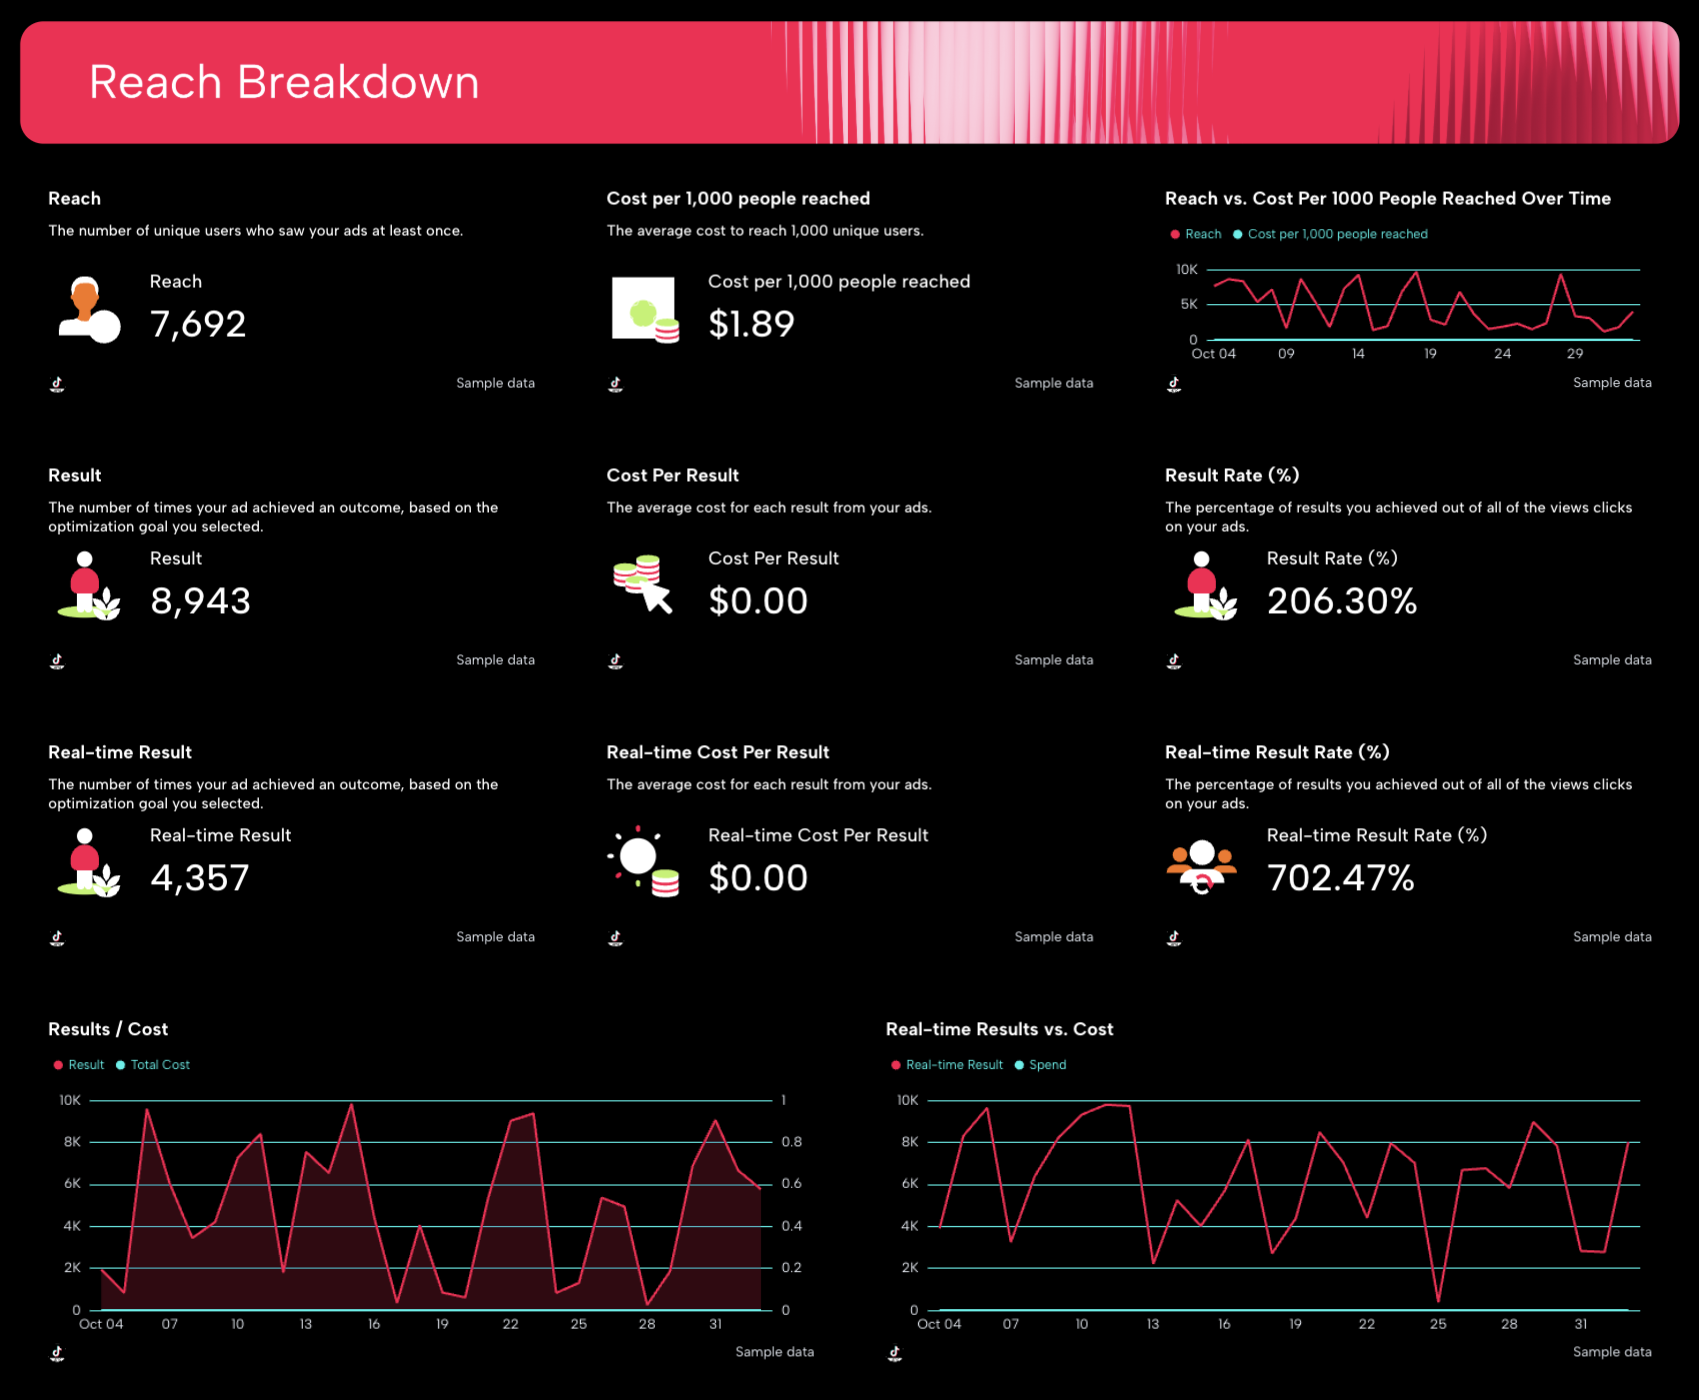
Visualize reach KPIs to understand how far your TikTok ads are spreading. Show total reach, unique users, and cost per 1,000 people reached, then display trends over time.

You can also compare one metric to another — for example, reach vs. cost — to spot opportunities for better budget optimization and content strategy.

4. Campaign and Ad Performance

TikTok Ads Report Template - Table with campaign and ad performance data.

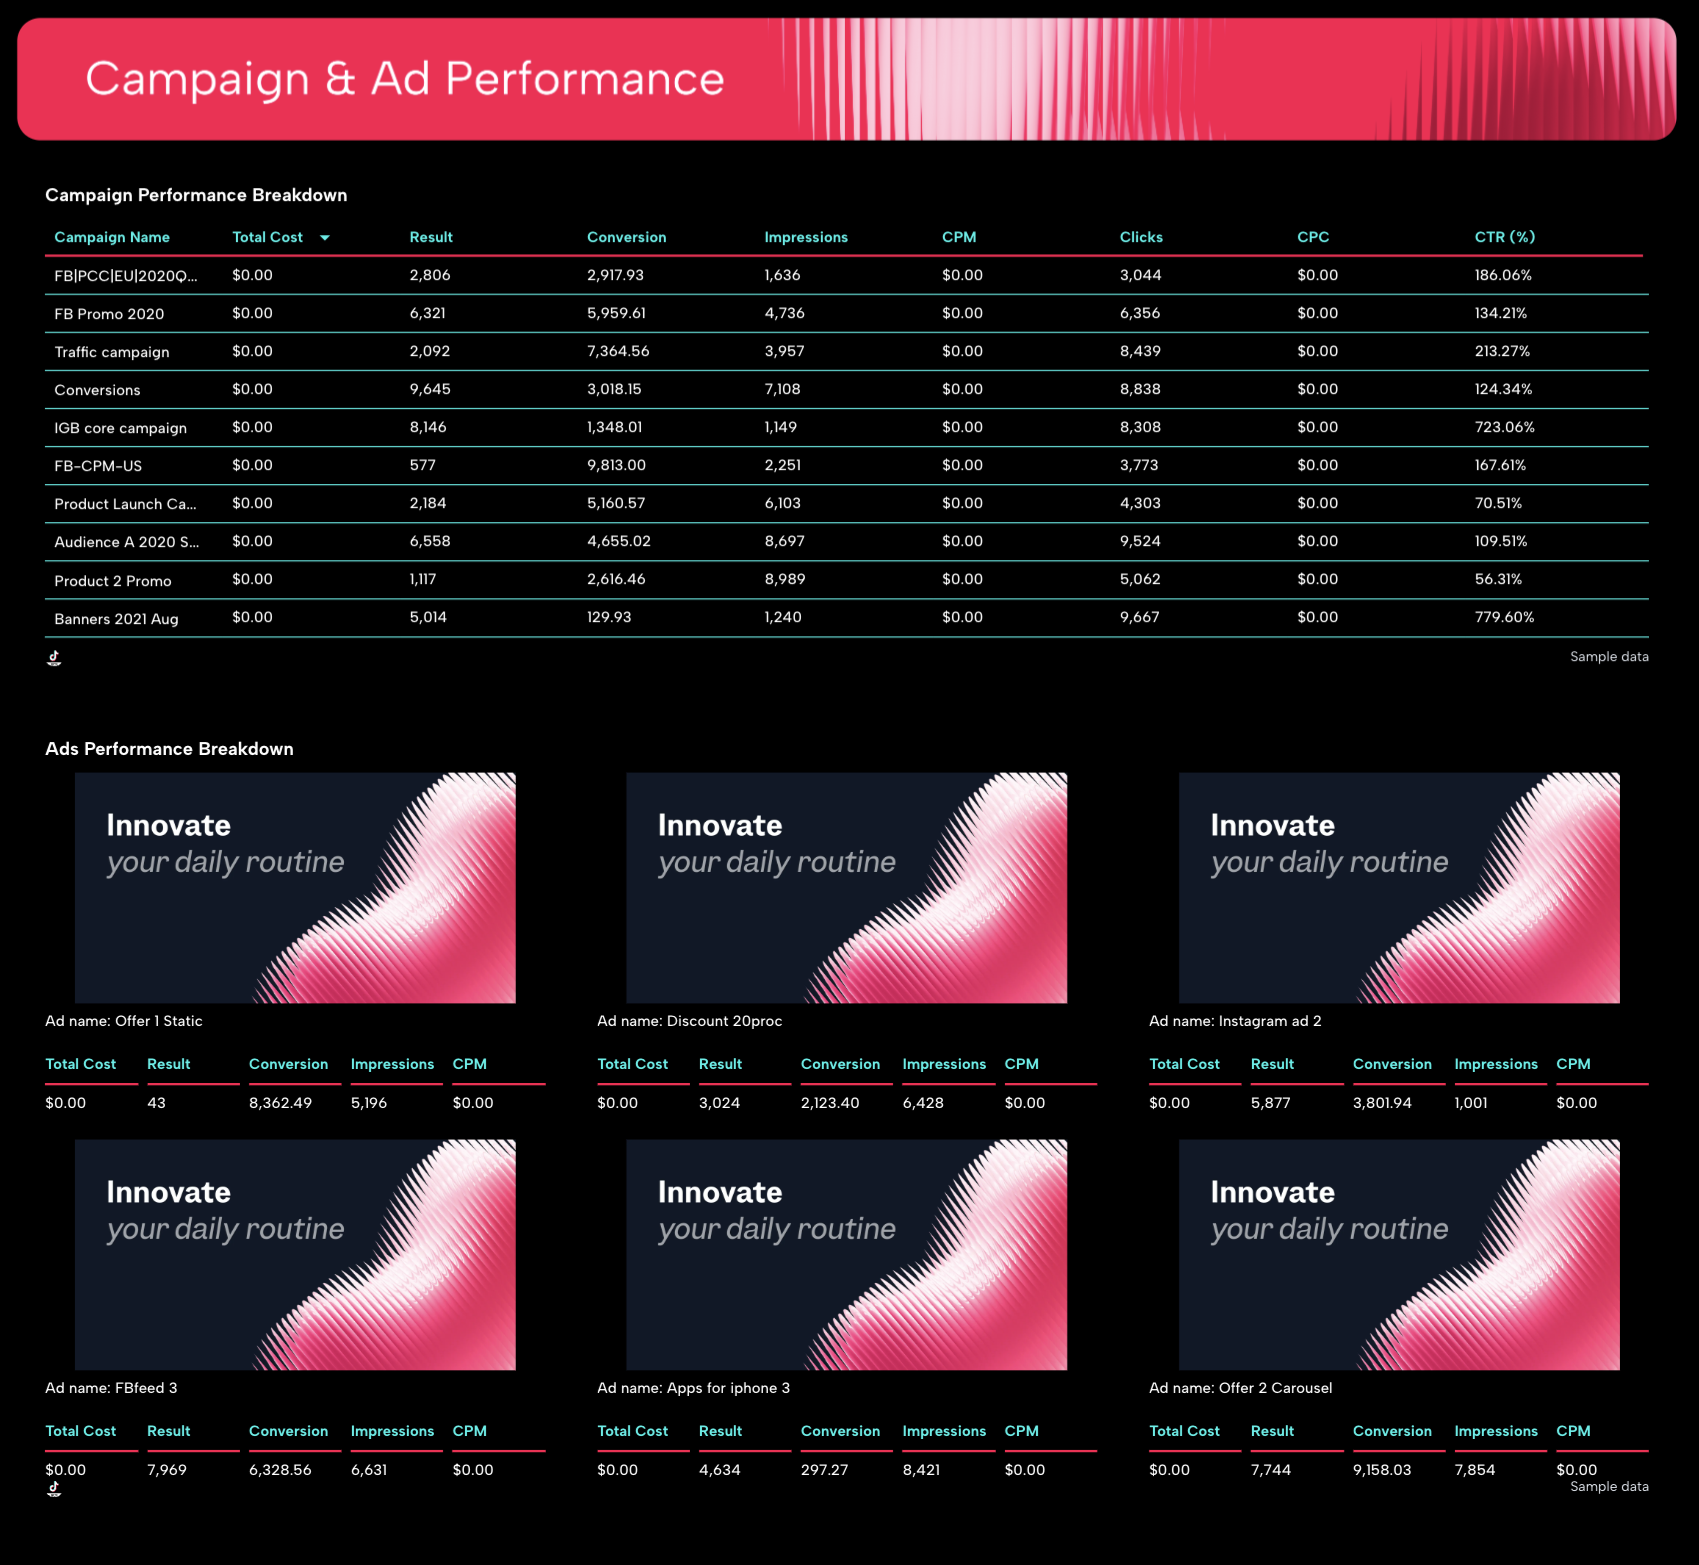
This is where you dig into the details of each campaign.

Include a table showing campaign performance metrics like total cost, results, conversions, impressions, CPM, clicks, CPC, and CTR.

This view helps you see which campaigns are performing best and which need adjustments. Add a carousel of top-performing TikTok ads that includes thumbnails and KPIs for each. These visuals make it easy to show what’s resonating with your audience and what could be improved.

5. Views Breakdown

TikTok Ads Report Template - A dashboard of various metrics with a red header.

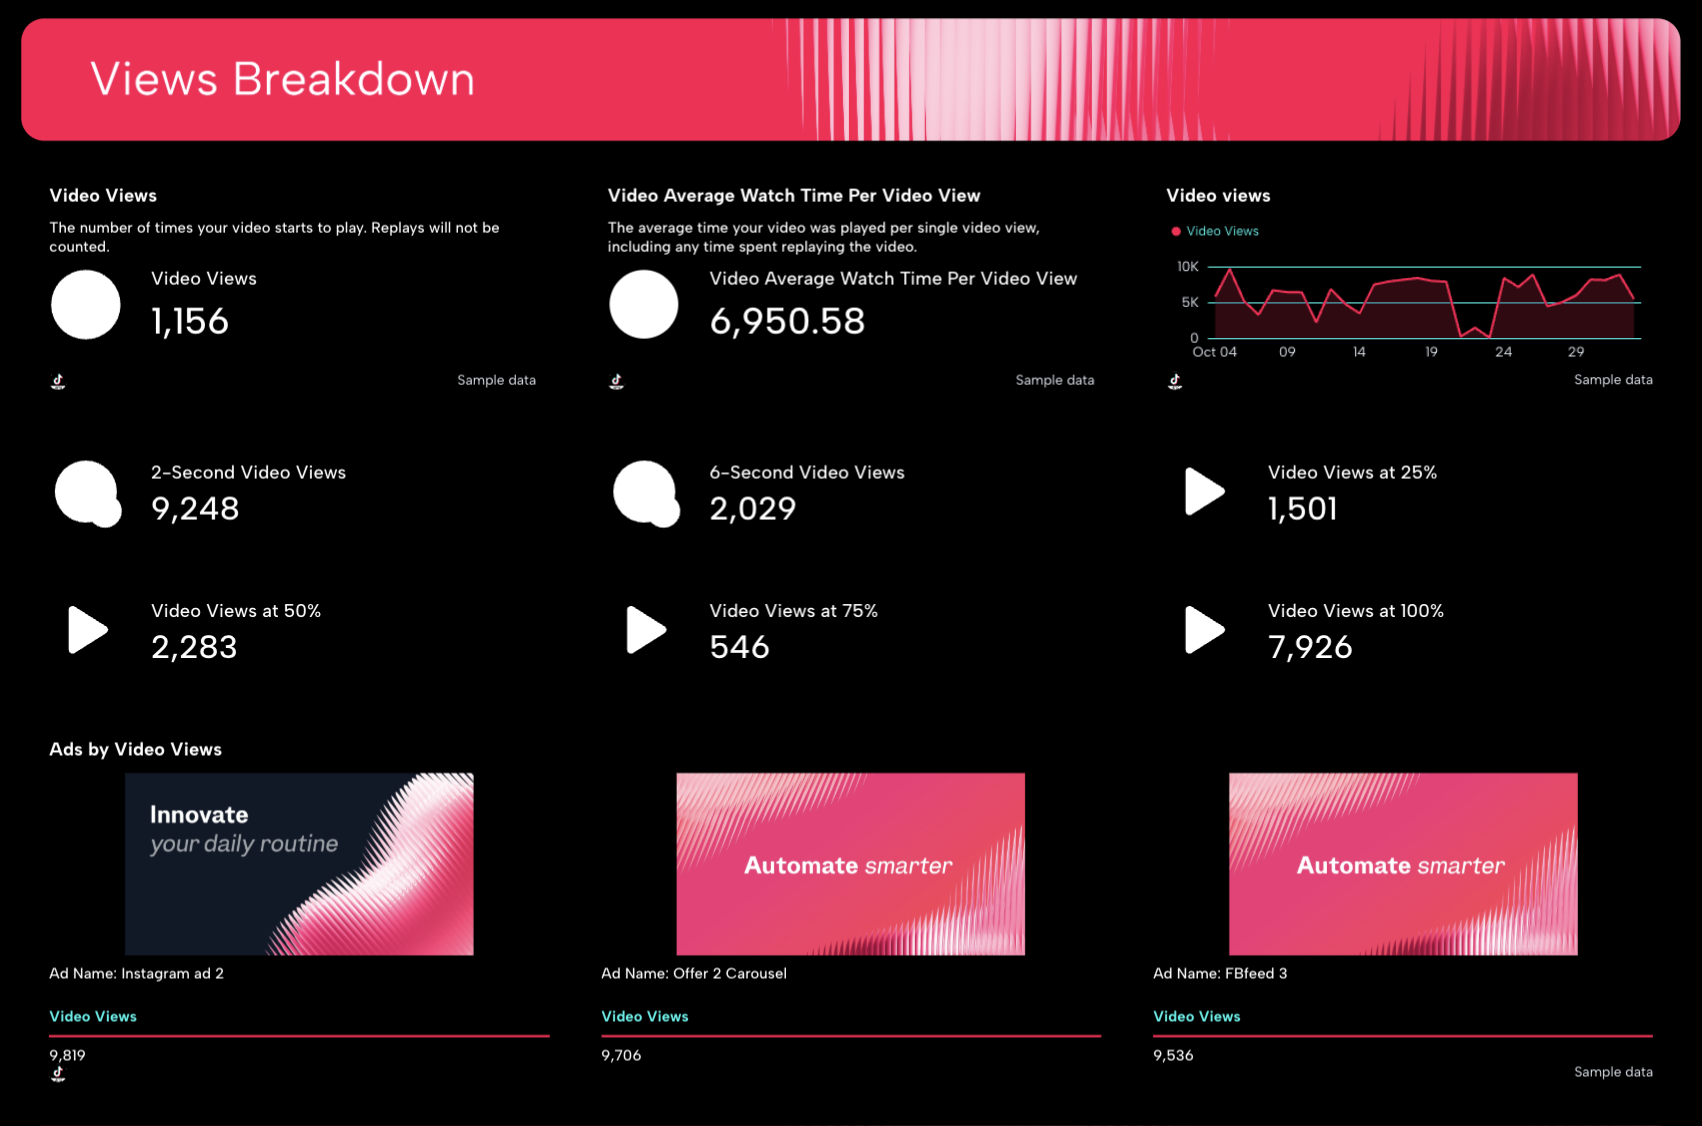
In your TikTok Ads dashboard, focus on video performance and engagement metrics like video views, average watch time, and view-through rates.

Use trend charts to show how these metrics change over time.

Add a carousel that highlights ads with the highest video views and engagement rate, helping your team or clients understand which creatives are driving the strongest response.

6. Engagement Breakdown

TikTok Ads Report Template - A dashboard displays engagement metrics with tables and pie charts.

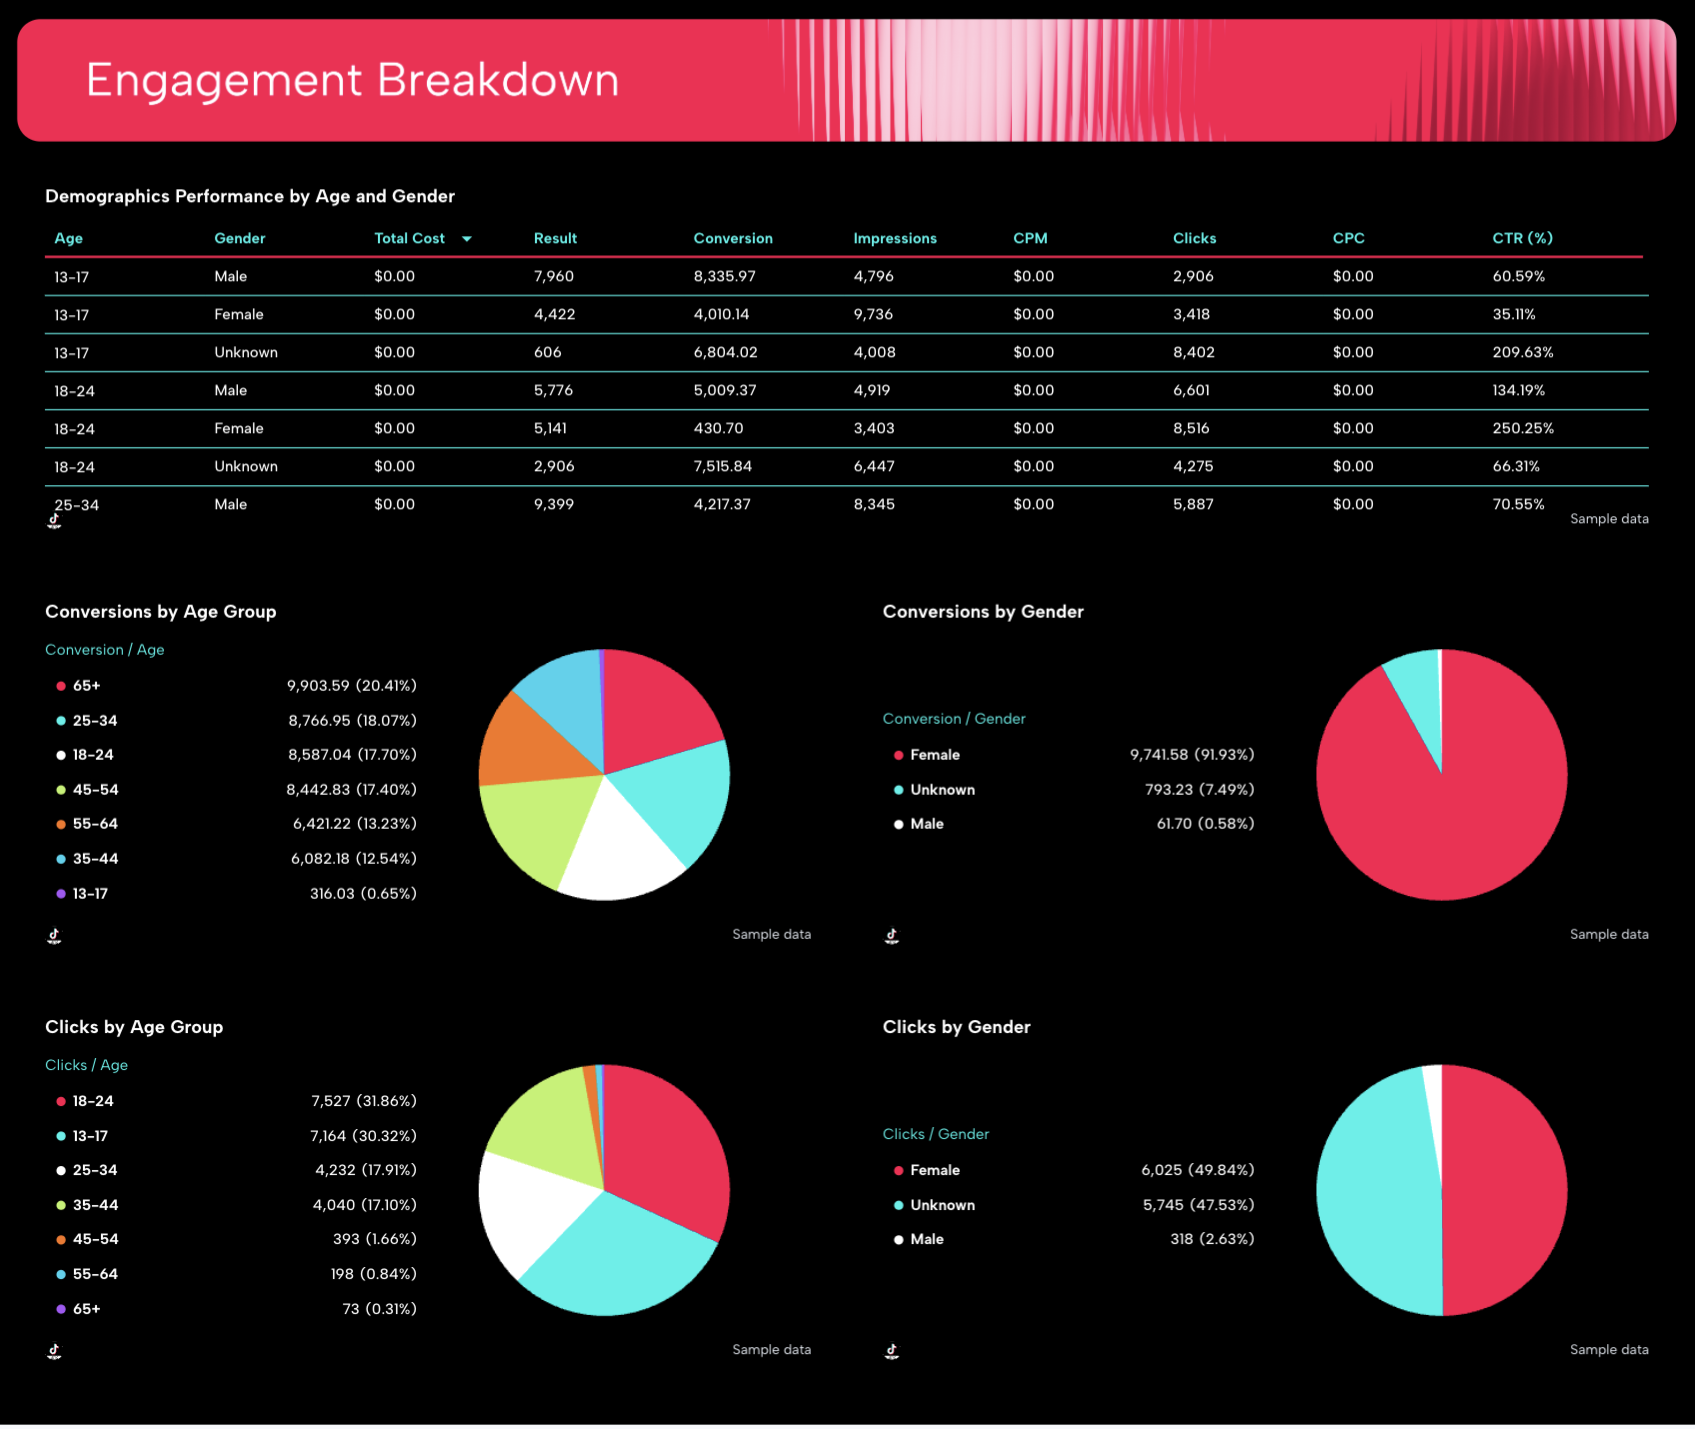
Round out your TikTok report with an audience-focused view.

Include a table breaking down performance by demographics such as age and gender, showing key metrics like clicks, impressions, cost, and CTR.

Use pie charts to visualize conversions and clicks by age group or gender. This makes it easy to see which segments are engaging most and where to optimize targeting.

You can break down any KPI by demographic category, helping you connect performance insights directly to audience behavior.

Connect All Your Paid Ads Channels in One Place

Bring all your paid ads data into one place with no-code, stable connectors that you don't need to babysit. 

Why Marketers Love Reporting on Whatagraph

Whatagraph's AI is saving so much time and energy for our marketing specialists. We now have more time to focus on strategic things that help both our agency and our clients grow.

Lars Maat

Lars Maat

Co-Founder @ Maatwerk Online

StarStarStarStarStar

Whatagraph took us to the next level with our clients and within our team. Our relationships with clients have been amazing, and we’ve even been able to retain them longer.

Kim Strickland

Kim Strickland

Digital Marketing Specialist @ Peak Seven

StarStarStarStarStar

Whatagraph is easy to use, visually attractive, and much smoother compared to tools like Looker Studio.

Stef Oosterik

Stef Oosterik

Quality Manager @ Dtch. Digitals

StarStarStarStarStar

Whatagraph has become an essential partner for scaling our reporting, and my teams love it because it saves so much time. We’d recommend it to any team looking to automate data reporting and use AI for insights.

Danielle Roberts

Danielle Roberts

Director of Implementation & Support @ Rentable

StarStarStarStarStar

Frequently Asked Questions

Have more questions? We answered them here.

What is a TikTok Ads report template?

A TikTok report template helps you track and visualize how your TikTok ads perform in one place. Instead of digging through TikTok Ads Manager or building manual reports in Google Sheets, a ready-made TikTok analytics report template automatically pulls your TikTok data and turns it into simple, visual insights.


It highlights key metrics such as impressions, CTR, CPC, CPM, ad spend, and conversions, giving you a full picture of your campaign performance. You can also track video performance, watch time, and engagement rate to understand which content resonates most with your target audience.

What is a TikTok Ads report?

A TikTok Ads report gives you a full overview of how your TikTok account and ad campaigns perform. 


It brings together key TikTok metrics such as impressions, click-through rate, cost per click, cost per conversion, ad spend, and conversions into one visual dashboard template. You can also track TikTok organic performance and follower growth to connect paid and organic impact across social media.


With a reporting tool like Whatagraph, all your marketing data is automatically synced from TikTok Ads Manager, Google Ads, Facebook Ads, and LinkedIn, then displayed through clear visualizations you can customize or export to Looker Studio.

How do you write a report on TikTok?

Start with a performance summary that highlights campaign goals, results, and next steps. Add sections for ad group and campaign performance, engagement, and reach. Visualize your KPIs like CTR, CPC, and conversions to see how your videos perform over time.


If you use Whatagraph, you can streamline reporting by connecting your data sources and letting Whatagraph IQ Summary write the performance text for you. You can even create a custom report that compares TikTok Ads, Google Analytics, and SEO data to show how your ads contribute to your wider PPC or marketing strategy.

Can I create my own custom metrics on Whatagraph?

Yes. You can easily build custom metrics that combine data from platforms like Google Ads, Facebook Ads, and TikTok Ads in one place. For example, you can calculate your blended cost per conversion or compare CTR across paid and tiktok organic campaigns, using no-code workflows.


You can even ask AI to create custom dimensions for you with Whatagraph IQ.

Where can I find a TikTok analytics report template?

You can access free TikTok analytics report templates directly in Whatagraph. They’re prebuilt, fully editable, and ready to use for both TikTok ads and TikTok organic performance. Each report template automatically imports your marketing data, visualizes it with clear charts, and helps you compare results with Google Analytics or SEO campaigns.