Web Analytics Reporting for Agencies

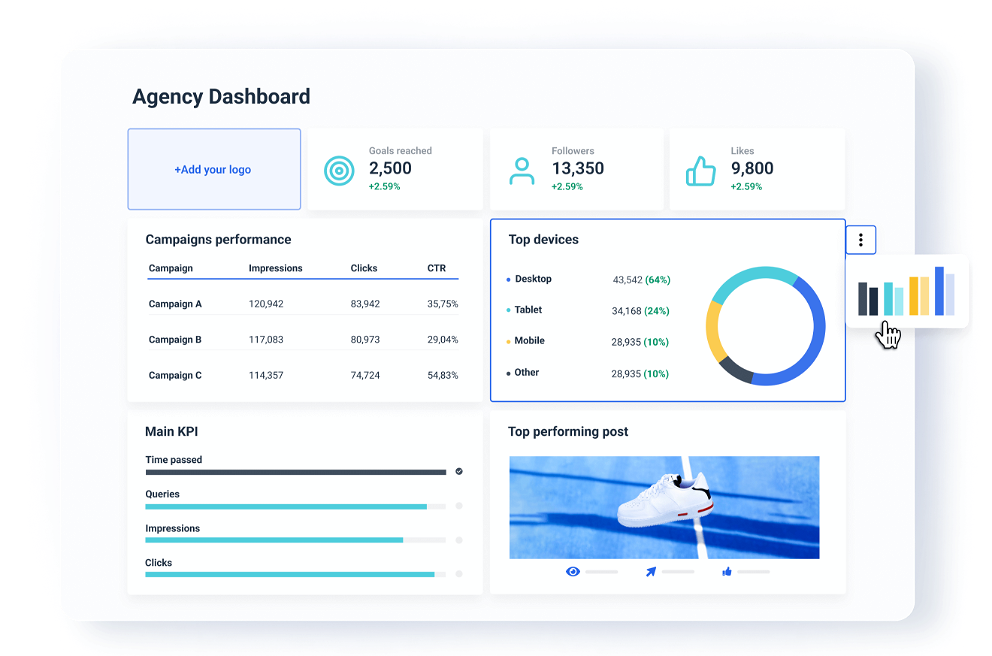
Deliver the results of your marketing efforts in the most effective way. Show your clients what you did for them using our web analytics reporting tool. With over 45 integrations to popular marketing data sources, a no-code data organize feature, great design, automated reports, and white-label options, Whatagraph has everything you need to create and send amazing reports.

    Web Analytics Reporting for Agencies
    Join marketing agencies and teams worldwide who use Whatagraph to work with marketing data!
    Ogilvy logo
    n365 logo
    House dentsu logo
    upstick logo
    thrive logo
    Power digital logo
    havas logo
    mc cann logo

    Explore our website analytics reporting solutions and effortlessly track your client’s online presence

    Using Whatagraph, you can send a web analytics report just for your client’s website or create a cross-channel report with real-time data. With more than 45 different integrations with different marketing and analytics tools, you can report on your marketing campaigns effortlessly with Whatagraph.

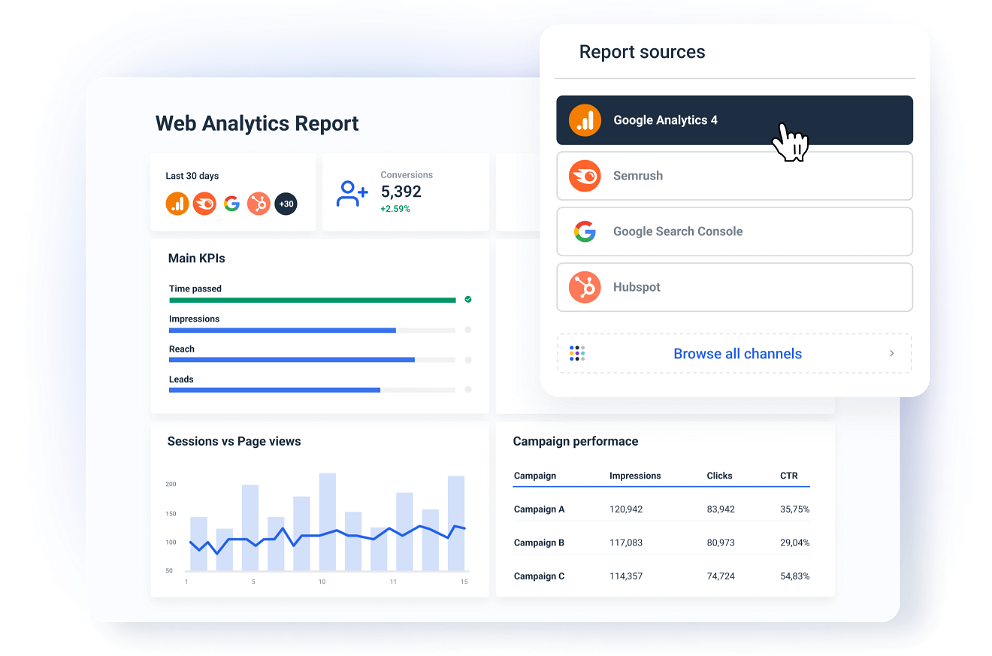
    Connect your web analytics data sources in a few clicks

    More than 45 fully managed integrations with social, paid advertising, email marketing, SEO, CRM, and other marketing sources to bring all your data to one place. Connect any source via Google Sheets, BigQuery, or Custom API and manage all the connected sources and channels in a single hub. 

    SVG image
    Connect your web analytics data sources in a few clicks

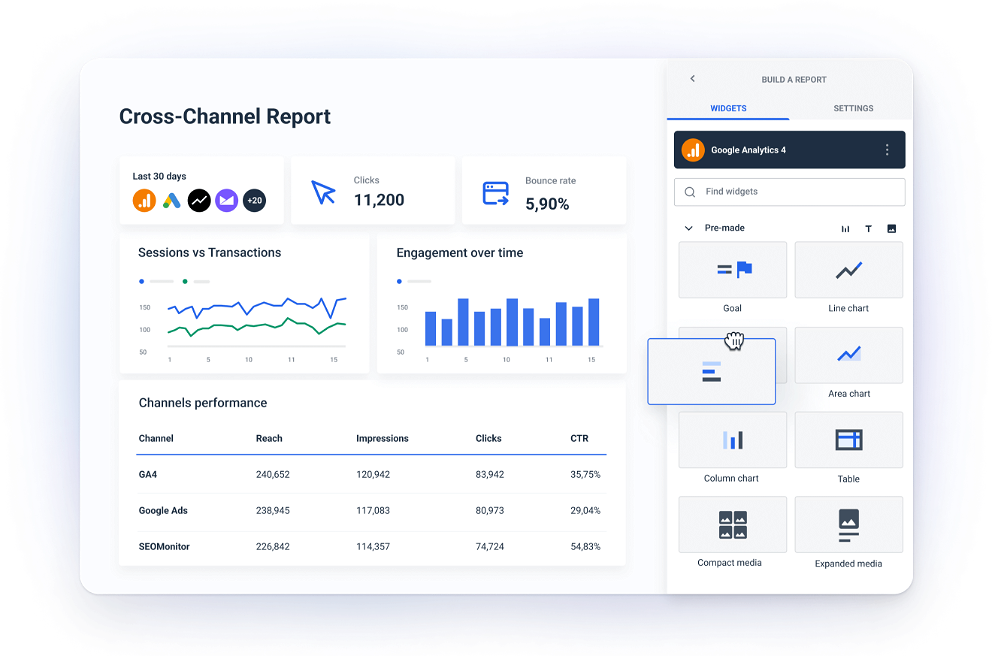
    Build your web analytics report in minutes instead of hours

    Create your perfect website analytics reporting tool without any tech and design knowledge using graph, chart, and table widgets as building blocks. Choose your widgets and drag and drop them on the page to instantly create live charts and tables. Build your custom widgets from the available visual elements. Save anything you create as a template. Add media widgets that pull social media posts or ad visuals and display them along the metrics of choice.

    SVG image
    Build your web analytics report in minutes instead of hours

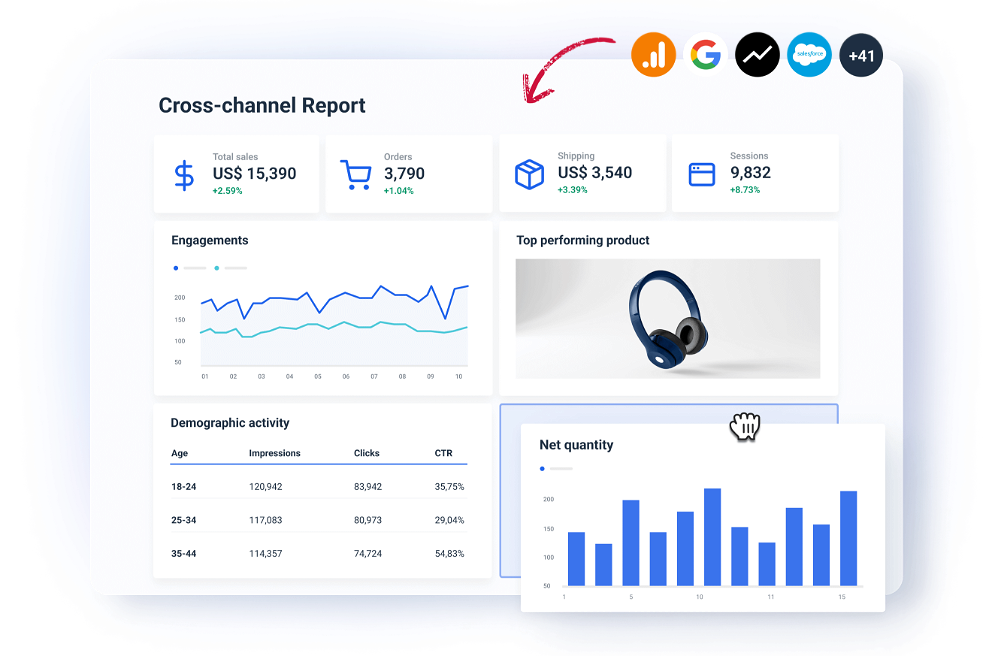
    Present cross-channel insights with no hassle

    Comprehensive cross-channel insights are now within your reach. Analyze several sources together to get the whole picture of your web analytics performance. Connect any marketing channel to your report and pick the widgets to visualize the data you want. Blend data to compare results from multiple platforms and visualize the metrics in multi-source widgets.

    SVG image
    Present cross-channel insights with no hassle

    All reporting features your agency needs

    45+ data sources

    Create a true cross-channel digital marketing dashboard in Whatagraph. Over 45 integrations for your cross-channel marketing campaigns.

    Cross-channel reports

    Combining cross-channel data is intuitive and takes a few clicks. Create a single client report for all channels instead of one report for each.

    Full report automation

    Schedule your reports at desired intervals or share a live link to a report so your clients can check for updates at any moment.

    White-label reports

    Customize colors and logos in each report to align it with your agency’s or clients’ branding and style.

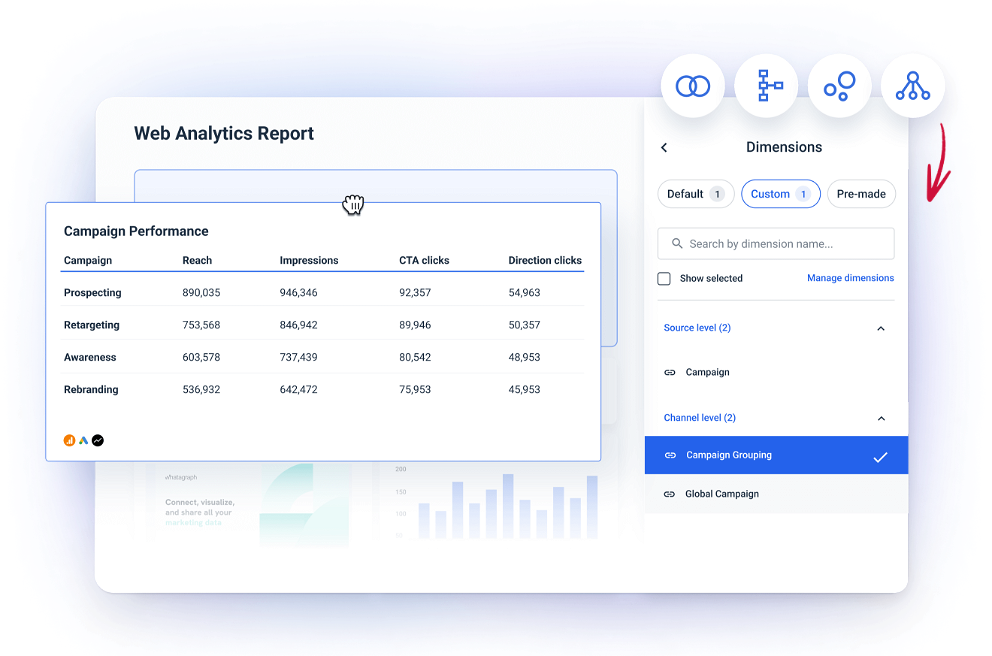
    Organize and blend your web analytics data without any code

    Blend performance metrics from two or more different channels inside one table. Create a group of sources and aggregate related metrics. Create a custom formula with any metric from your blended sources. Change metrics names so the end-readers don’t get confused about what is what. Build new metrics that the source platform’s API doesn’t provide using simple calculations. Add agency markup for ad spend on individual platforms.

    SVG image
    Organize and blend your web analytics data without any code

    Apply white-labeling & customization to make every web analytics report your own

    Tried Whatagraph but don’t like the way our report templates look? You can change everything, from the design and colors to messaging and widgets. Create a global theme for your agency, or create multiple themes on the dashboard and even widget level. For a fully custom feel, remove the Whatagraph logo from your reports so they look like you built them from scratch. Provide a seamless user experience by hosting every web analytics report on your own domain.

    SVG image
    Apply white-labeling & customization to make every web analytics report your own

    Fully automated marketing reporting at your fingertips

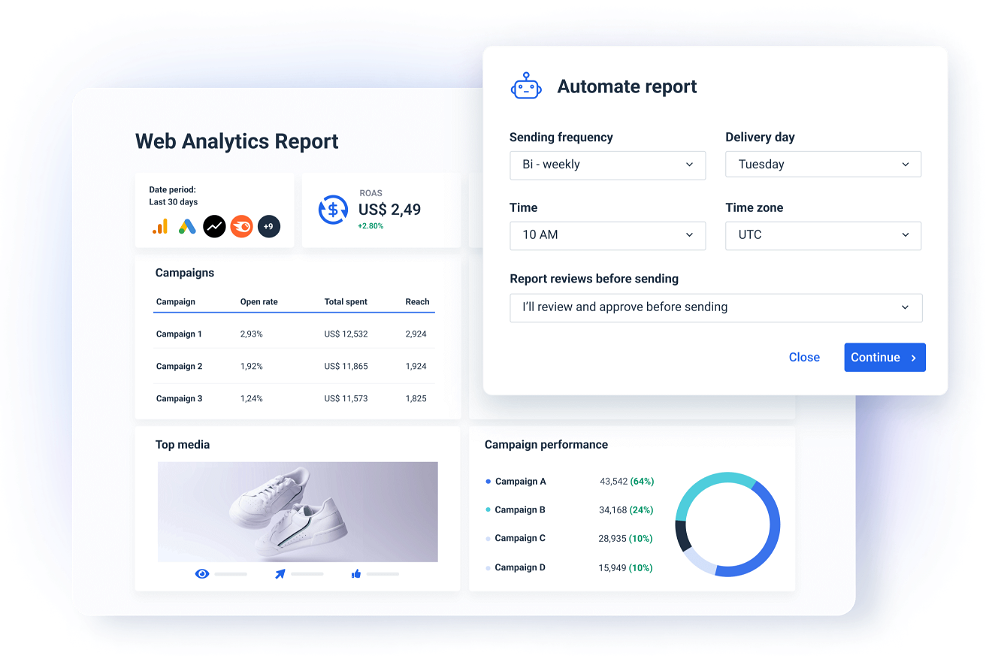
    Automate every web analytics report you create. Pick the recipients, cadence, and the time of sending, and never worry about missing a send. Data updates automatically before every send-out, so the whole process is on autopilot. If needed, add a review step before sending to inspect the report and make final edits and comments. Share live reports to build additional trust and transparency with on-demand reporting accessible from anywhere, anytime.  

    SVG image
    Fully automated marketing reporting at your fingertips

    What is web analytics reporting?

    Web analytics reporting involves tracking, reviewing, and reporting marketing data to measure web activity, including the usage of a website and its components, like webpages, images, and videos. Data collected through web analytics may include traffic sources, referring sites, page views, segmentation by user demographics and devices, paths taken, and conversion rates.
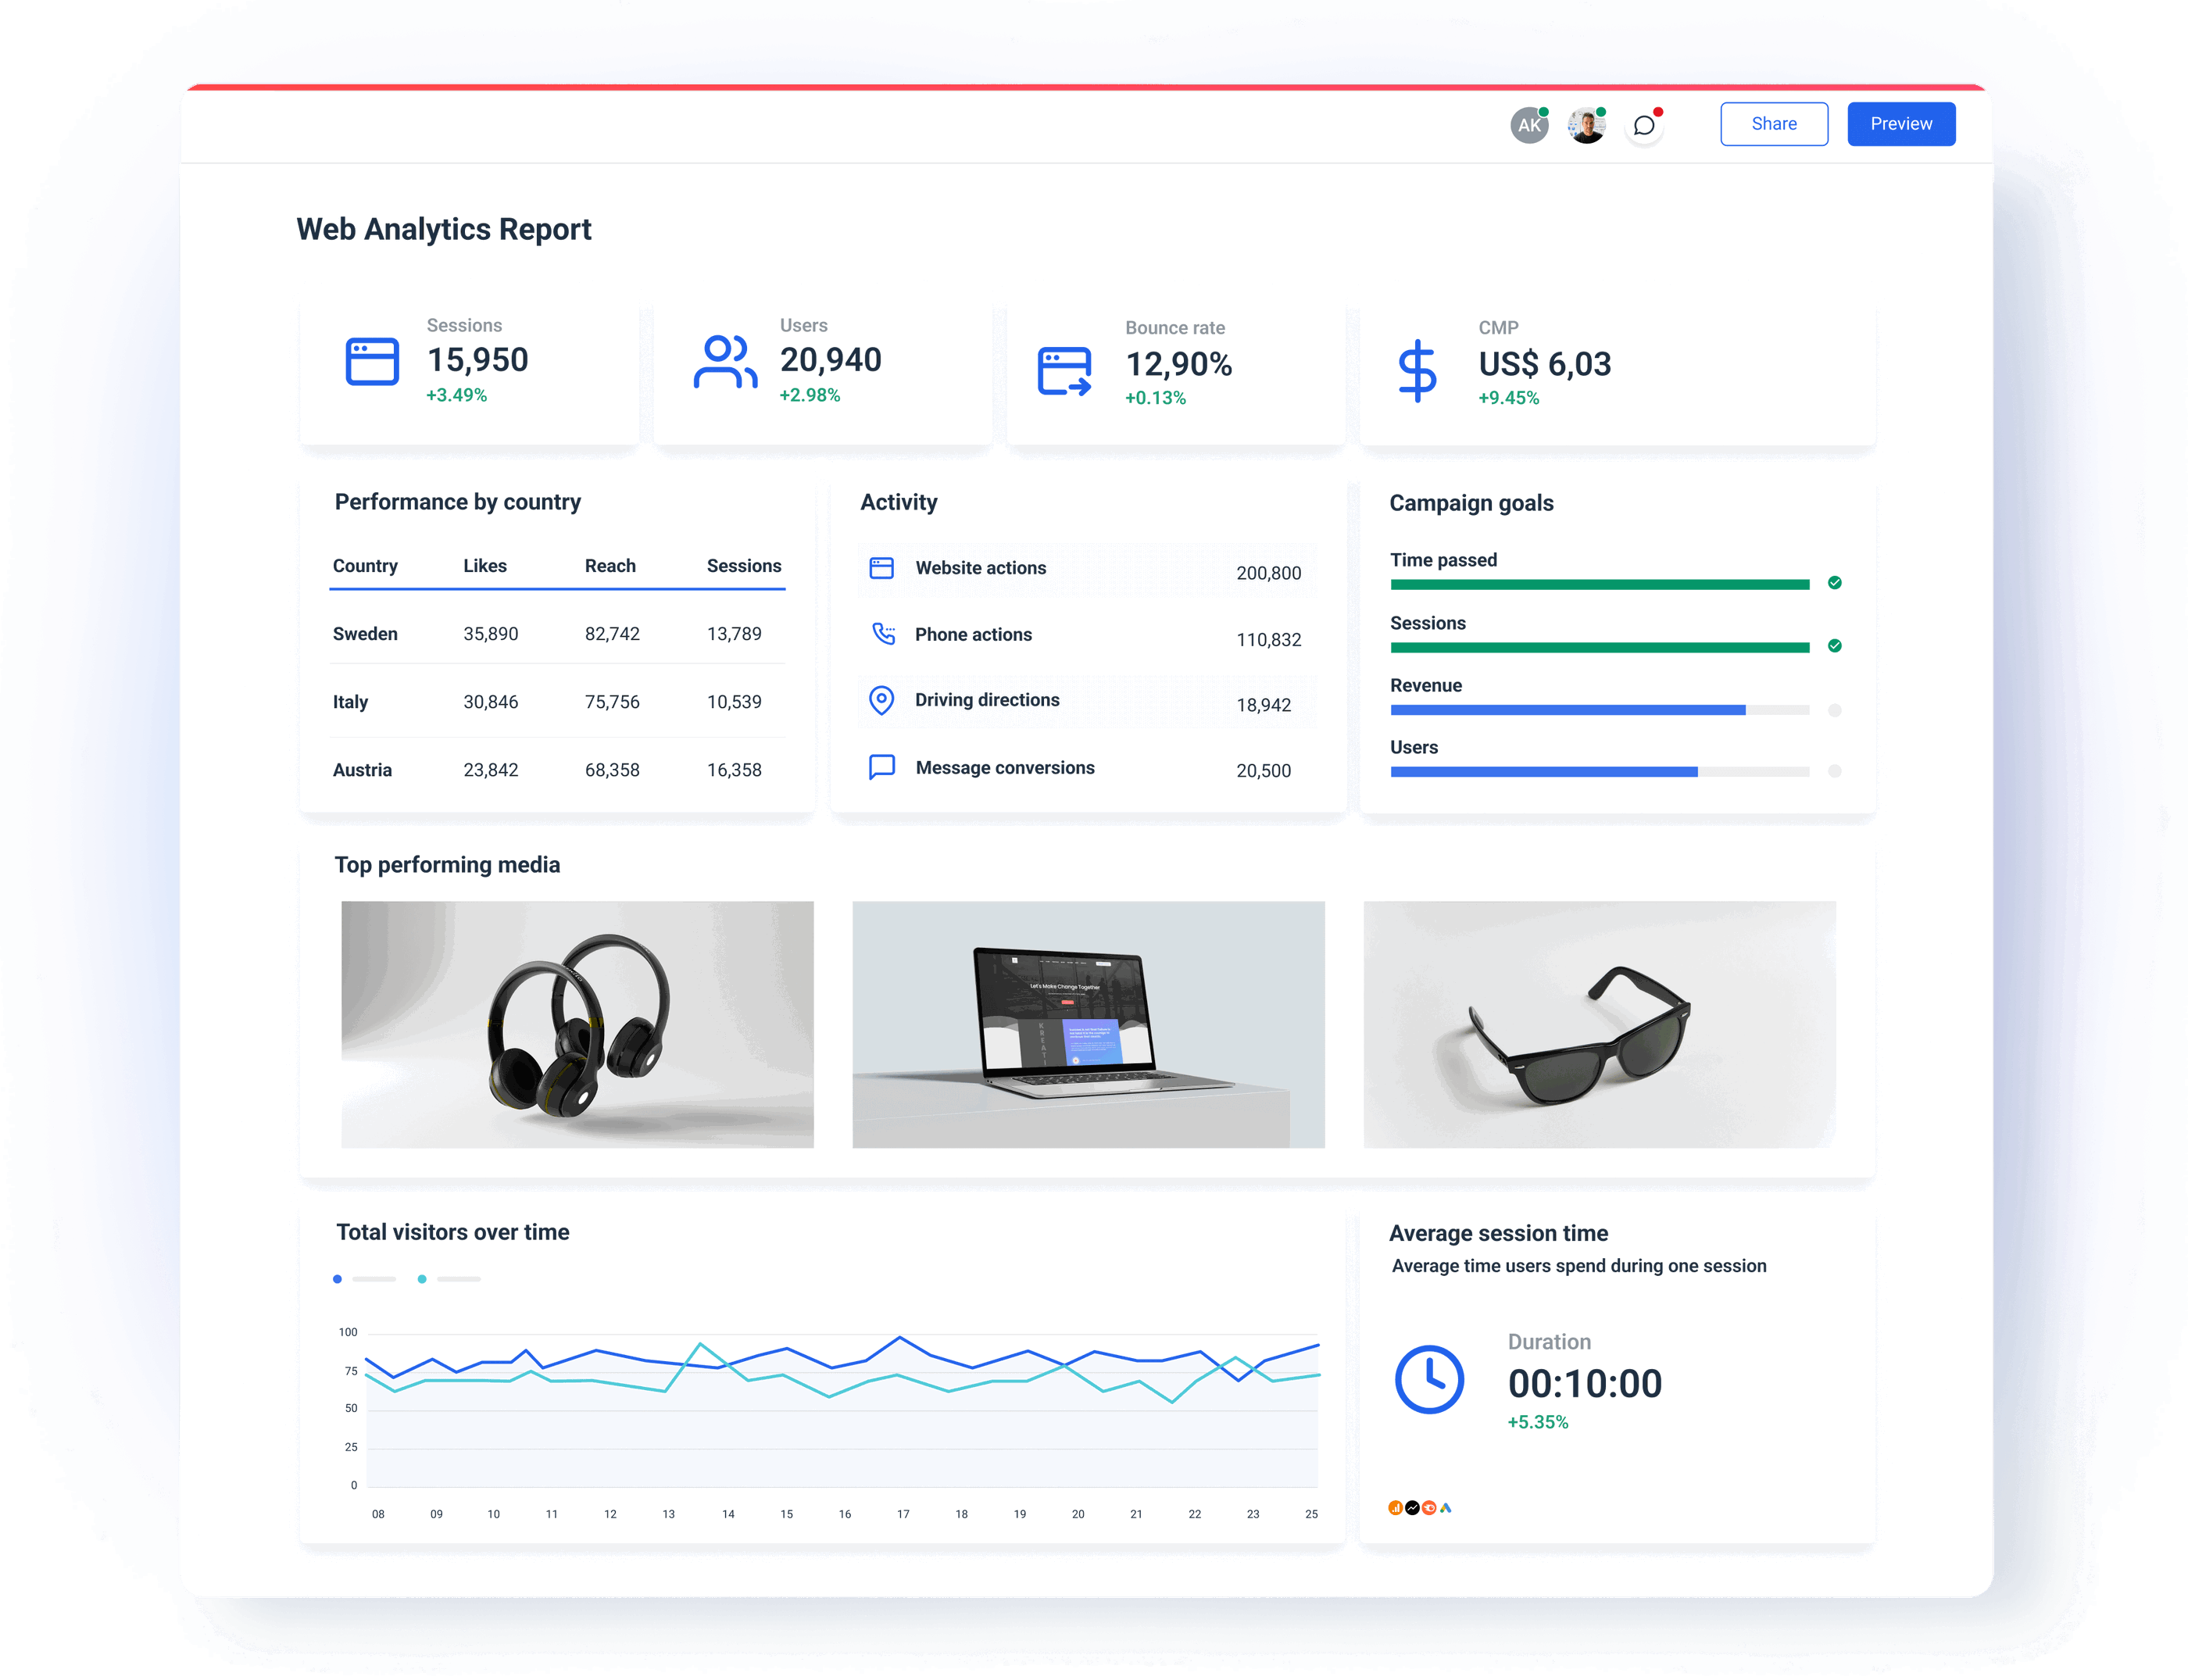
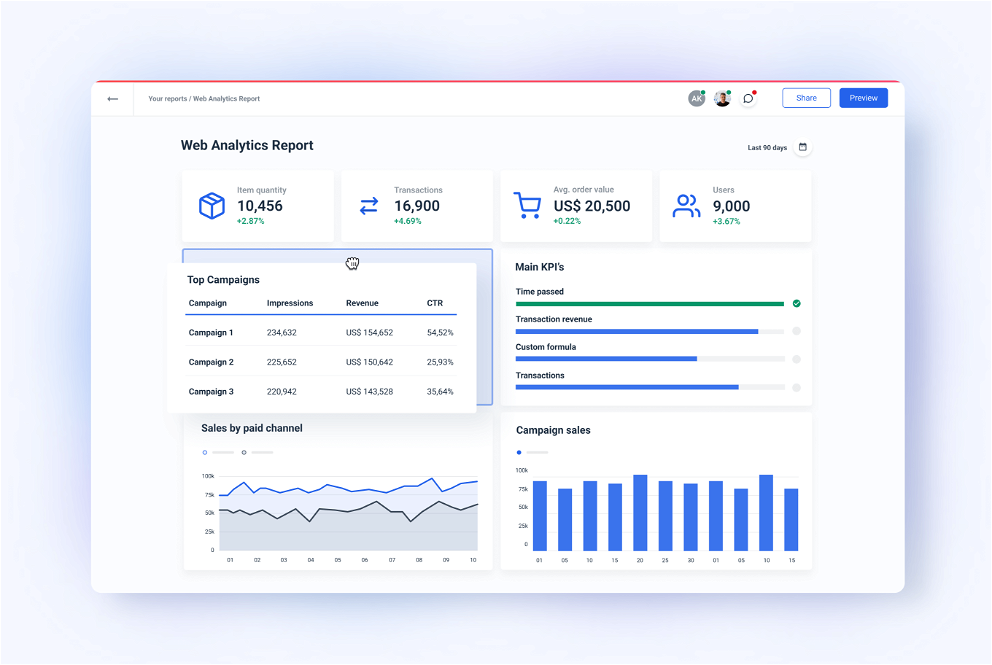
    Web analytics report in Whatagraph

    Why build a web analytics report?

    A web analytics report allows your clients to monitor their website performance easily. Additionally, a web analytics report makes key metrics accessible to stakeholders unfamiliar with marketing tools like Google Analytics, Google Search Console, or e-commerce platforms. A web analytics report allows you to aggregate all the essential website insights from those channels in a concise, simple way.

    How to collect website analytics data?

    Your website holds a wealth of information, such as what keywords, bring the most traffic, which pages visitors don’t read, how well your PPC ads are performing, and ultimately the ROI of your marketing efforts. There are several tools you can use to collect website data, however the most popular is Google Analytics (GA).

    Google Analytics is a free tool that can tell you a lot about your website performance. Some of the most valuable web analytics insights include:

    Number of sessions or visits: They represent the raw count of website visitors over a certain time period. Tracking this metric over time and comparing year-over-year (YOY) and month-over-month (MOM) data tells you how well your website performs.

    Percentage of new sessions: This metric tells you what percentage of your website visitors are on your website for the first time, as opposed to returning visitors and total number of individuals (unique visitors). If people are not coming back to your website, this can point out to a problem with your content, design, etc.

    Traffic channels: It’s important for you to know what percentage of your visitors come from Pay-per-Click (PPC), social media, organic search, direct traffic, or other websites (referral traffic). This information helps you invest more in the channels that are performing well and less in the ones that are underperforming.

    Conversions and goals: Conversions can refer to things like sales in the case of e-commerce sites, form submissions for lead generation sites, downloads for information sites, etc.

    Bounce rate: The bounce rate is the percentage of visitors that leave without interacting with your website in any way. A high bounce rate can tell you that your website is not relevant to the needs of your visitors or that your UX is not user-friendly. Google Analytics 4 (GA4) has a bounce rate metric but it’s essentially the negative engagement rate.

    Engagement: Engagement metrics cover the actions people take on your website. These can include things like the number of pages viewed, the average time on site, session duration, goal completions, and other KPIs.

    Content performance: Content performance metrics tell you how well your content is performing. Are people reading, sharing, and commenting on it or do they leave the page after a few seconds? Combined with insights from your search engine optimization tools, these metrics can be particularly useful for blog posts, articles, product pages, infographics, etc.

    Audience: Audience metrics provide valuable insights into who your website visitors are. These include age, gender, location, interests, etc. This also includes what device they use, which can help you optimize the design.

    Lead capture: If you have a lead capture like gated content or an exit form on your website, you’ll want to track how many people are filling it out and how much it’s costing you per lead.
    FAQs

    All your questions answered. And if you can’t find it here, chat to our friendly team.

    How do I write a website analytics report?

    Here’s a quick 5-step guide on how to write a website analytics report:


    Step 1: Define your business or client’s objectives.


    Step 2: Choose the metrics and key performance indicators to measure.


    Step 3: Select the right web analytics report format.


    Step 4: Decide how often you need to send the report.


    Step 5: Discuss the report with your team or client.

    What are the best data sources to include for web analytics reporting?

    It’s best to start with the basic website analytics: Google Analytics 4 and Google Search Console. This has more than enough website data to give your clients an idea about their web traffic, stats on website visitors, best-performing landing pages, and more.


    As a web analytics reporting platform, Whatagraph allows you to connect more data sources and, apart from website traffic and user behavior, include your e-commerce and paid search metrics in your web analytics reporting.

    Can you export data from web analytics reports?

    Yes, you can export data from individual widgets or whole web analytics reports as Excel and CSV files.

    Create Your Own Custom Reports in Minutes

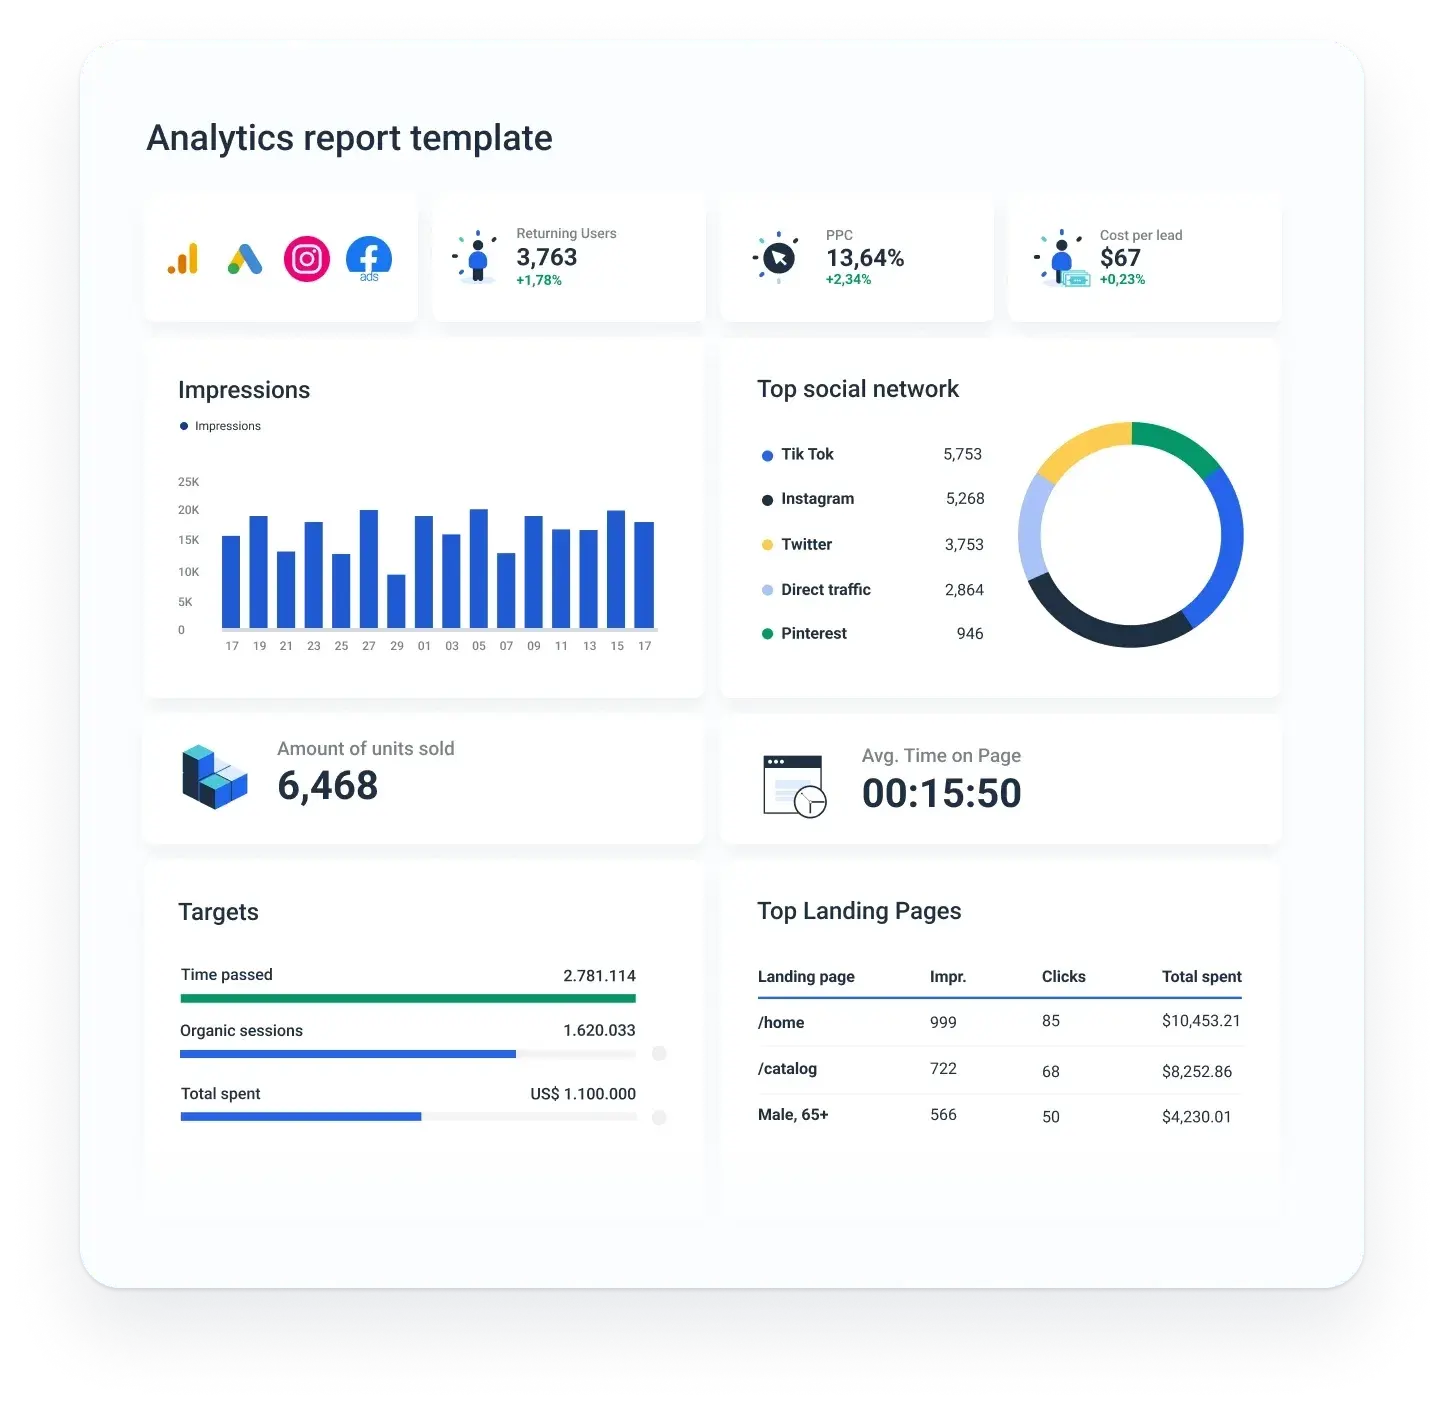
    Whatagraph's Analytics Report Template

    Use our Analytics Report Template with Whatagraph

    The easiest way to create a dashboard for web analytics reporting is to use our analytics report template. It has all the elements you need from a report, so all you have to do is connect your client’s accounts and the data will automatically populate in real-time directly from their web pages.

    How to Get Started with Whatagraph?

    1. Sign up for your free account

    All it takes is a few bits of information and you’re ready to create reports in under 10 minutes. No credit card info is needed!

    2. Connect your data sources

    Add the data sources you want to use in your clients’ marketing reports. We have 45+ available to choose from.

    3. Choose a report template

    Select a template that best shows the work you do for your clients. With a few clicks, your template becomes a fully finished client report!

    It’s good to be loved! Our clients are not shy about expressing it.

    I made a switch from GDS and Sheets for reporting to Whatagraph, and I am saving literal hours each week on performance report creation. Our small firm actually managed to onboard 2 new clients as a result of all the time we saved on managing data and reporting. The customer service is also really helpful and easy to reach.

    Mindaugas S., Marketing Consultant Capterra logo for Whatagraph review

    Capterra verified review by

    Mindaugas S., Marketing Consultant

    Having active customer support to help fix any issues was a big contributor, but we also really liked the ability to save templates and connect sources to multiple charts/widgets at once without having to edit them individually. And having the grid layout is much easier to stay consistent with than the free form setup that Data Studio has.

    Nico T., Media Planner Capterra logo for Whatagraph review

    Capterra verified review by

    Nico T., Media Planner

    The system has standard templates that are easy and fast to use. Also you can build your own report with lightning speed. It is very easy to use, has a lot of integration, and let get started very fast.

    Rasmus Bernt K., External Senior Management Consultant Capterra logo for Whatagraph review

    Capterra verified review by

    Rasmus Bernt K., External Senior Management Consultant

    We love Whatagraph - we would definitely recommend and our account manager is great! I love how easy this tool is to use, everyone on the team finds it much more user-friendly than other dashboards. Integration was easy, we sent some example reports to the team who duplicated these for us. We literally had to log in and send it to our clients!

    Stephanie S., Digital Director Capterra logo for Whatagraph review

    Capterra verified review by

    Stephanie S., Digital Director

    We are showing our clients the work that we're doing for them and this is incredibly important for our clients ROI. They want to see results and having a tool like Whatagraph that can show data from virtually every source we use is hugely important.

    John S., SEO Strategist Capterra logo for Whatagraph review

    Capterra verified review by

    John S., SEO Strategist

    The tool is easy to use; you do not need to have development resources. Even my junior project managers are capable of making campaign reports in minutes. There are a lot of pre-made templates you can use as well as many pre-made widgets.

    Erman E., Marketing Specialist Capterra logo for Whatagraph review

    Capterra verified review by

    Erman E., Marketing Specialist

    Really easy to connect data sources within the tool. The library of report templates has been helpful. The customer support team has been responsive to all of our needs. Our team enjoys the simplicity of setting up the reports and how the data is presented.

    Brent N., Director of Operations Capterra logo for Whatagraph review

    Capterra verified review by

    Brent N., Director of Operations

    Easy to create really beautiful graphs and reports which can help other team members to understand the most important takeaways. I especially like the automated report function, so I don't have to check on the same thing repeatedly.

    Orsolya S., Online Marketing Manager Capterra logo for Whatagraph review

    Capterra verified review by

    Orsolya S., Online Marketing Manager

    Need more help with getting started?

    An image of the Whatagraph dashboard, with a custom reporting template

    We can set up your report campaign for you!

    If you need help with setting up Whatagraph - our team can create your campaign reports!

    Ready for insights?

    It's time to focus your time on the tasks that really matter, and let us worry about your marketing analytics. Start your free 7-day trial.

    • Free for 7 days
    • No credit card required
    • Live chat support
    • Cancel anytime
    Start Reporting For Free

    No credit card required

    Cross channel reporting template with Whatagraph