


What is web analytics reporting?
Web analytics reporting involves tracking, reviewing, and reporting marketing data to measure web activity, including the usage of a website and its components, like webpages, images, and videos. Data collected through web analytics may include traffic sources, referring sites, page views, segmentation by user demographics and devices, paths taken, and conversion rates.
Why build a web analytics report?
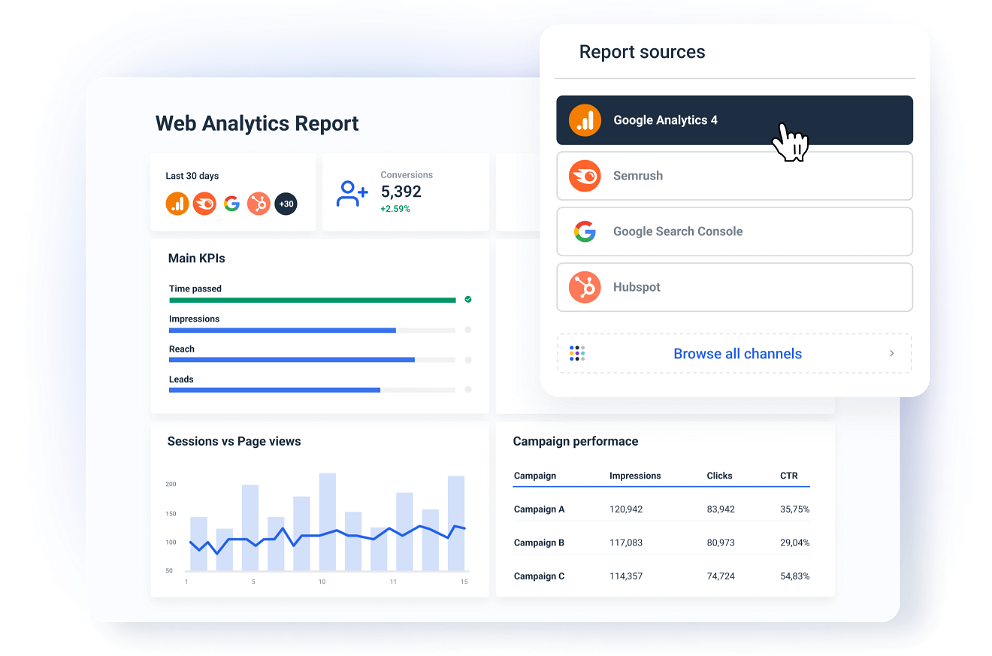
A web analytics report allows your clients to monitor their website performance easily. Additionally, a web analytics report makes key metrics accessible to stakeholders unfamiliar with marketing tools like Google Analytics, Google Search Console, or e-commerce platforms. A web analytics report allows you to aggregate all the essential website insights from those channels in a concise, simple way.
How to collect website analytics data?
Your website holds a wealth of information, such as what keywords, bring the most traffic, which pages visitors don’t read, how well your PPC ads are performing, and ultimately the ROI of your marketing efforts. There are several tools you can use to collect website data, however the most popular is Google Analytics (GA).
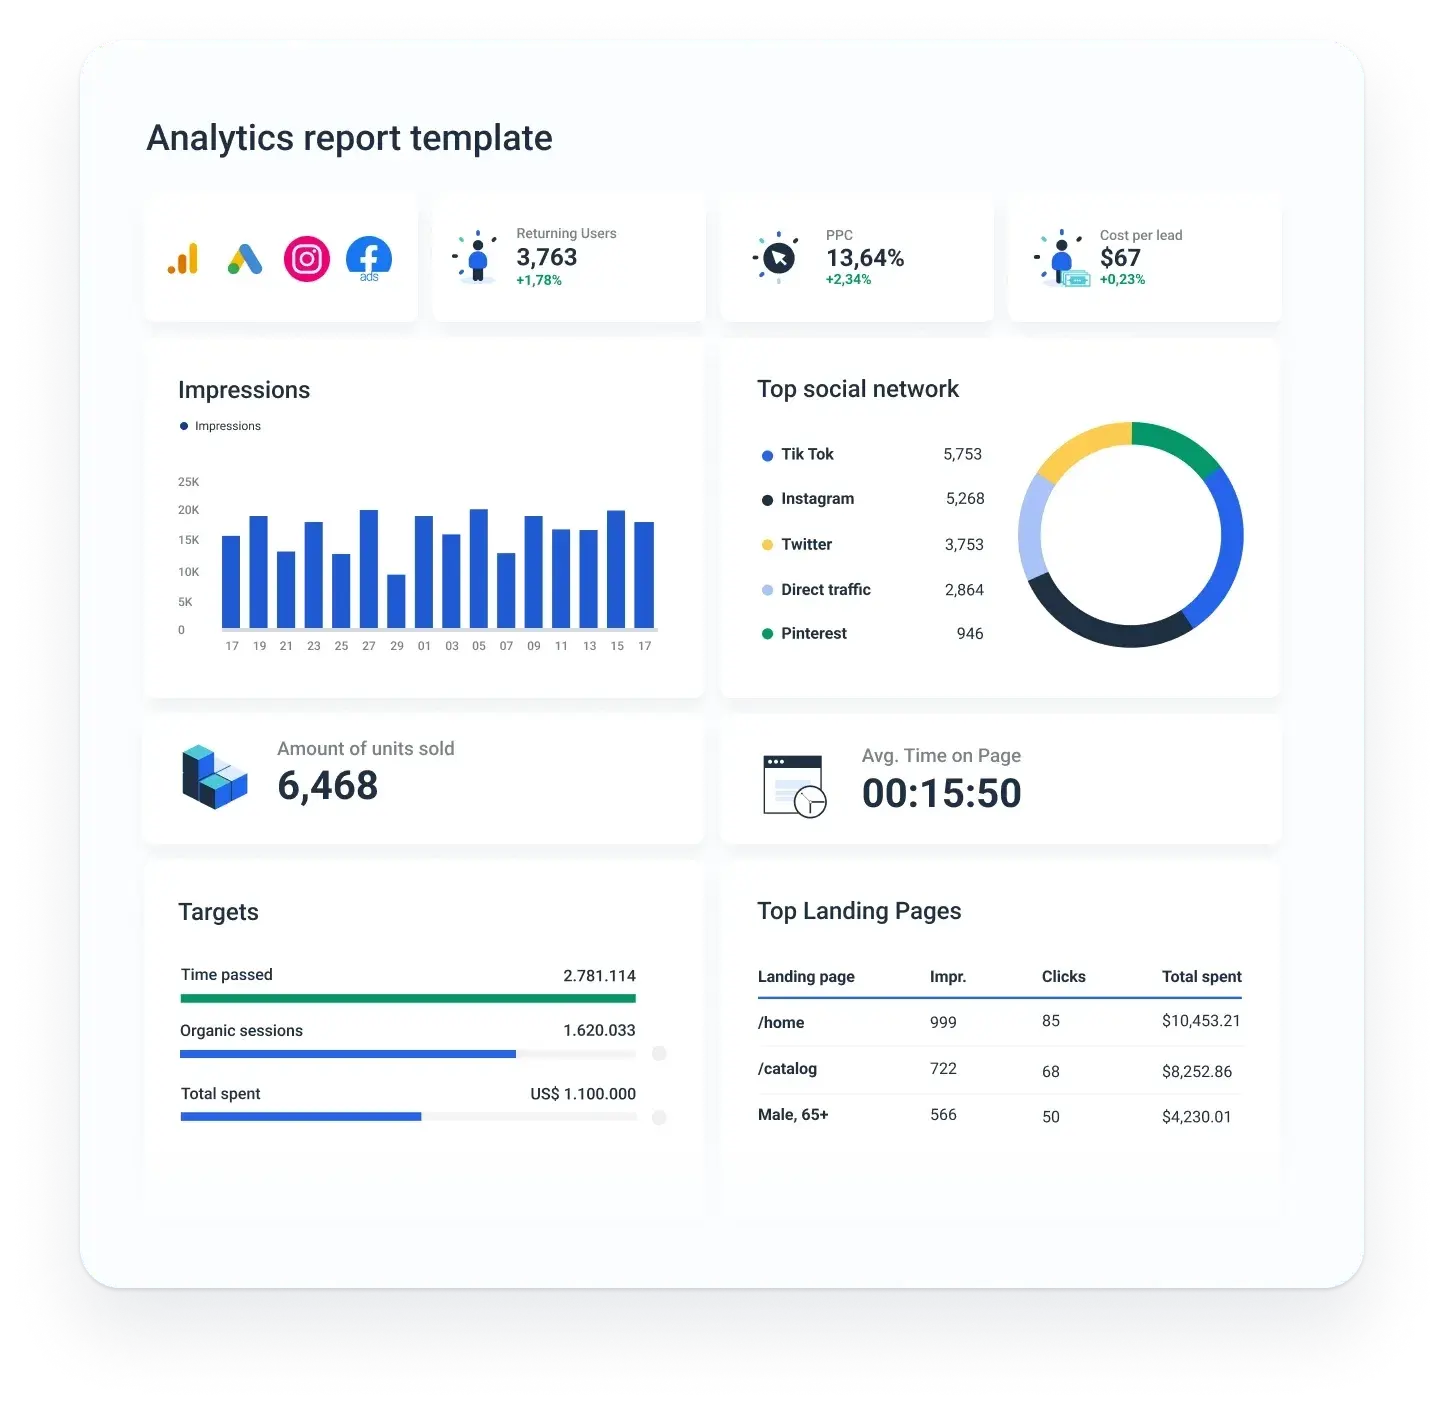
Google Analytics is a free tool that can tell you a lot about your website performance. Some of the most valuable web analytics insights include:
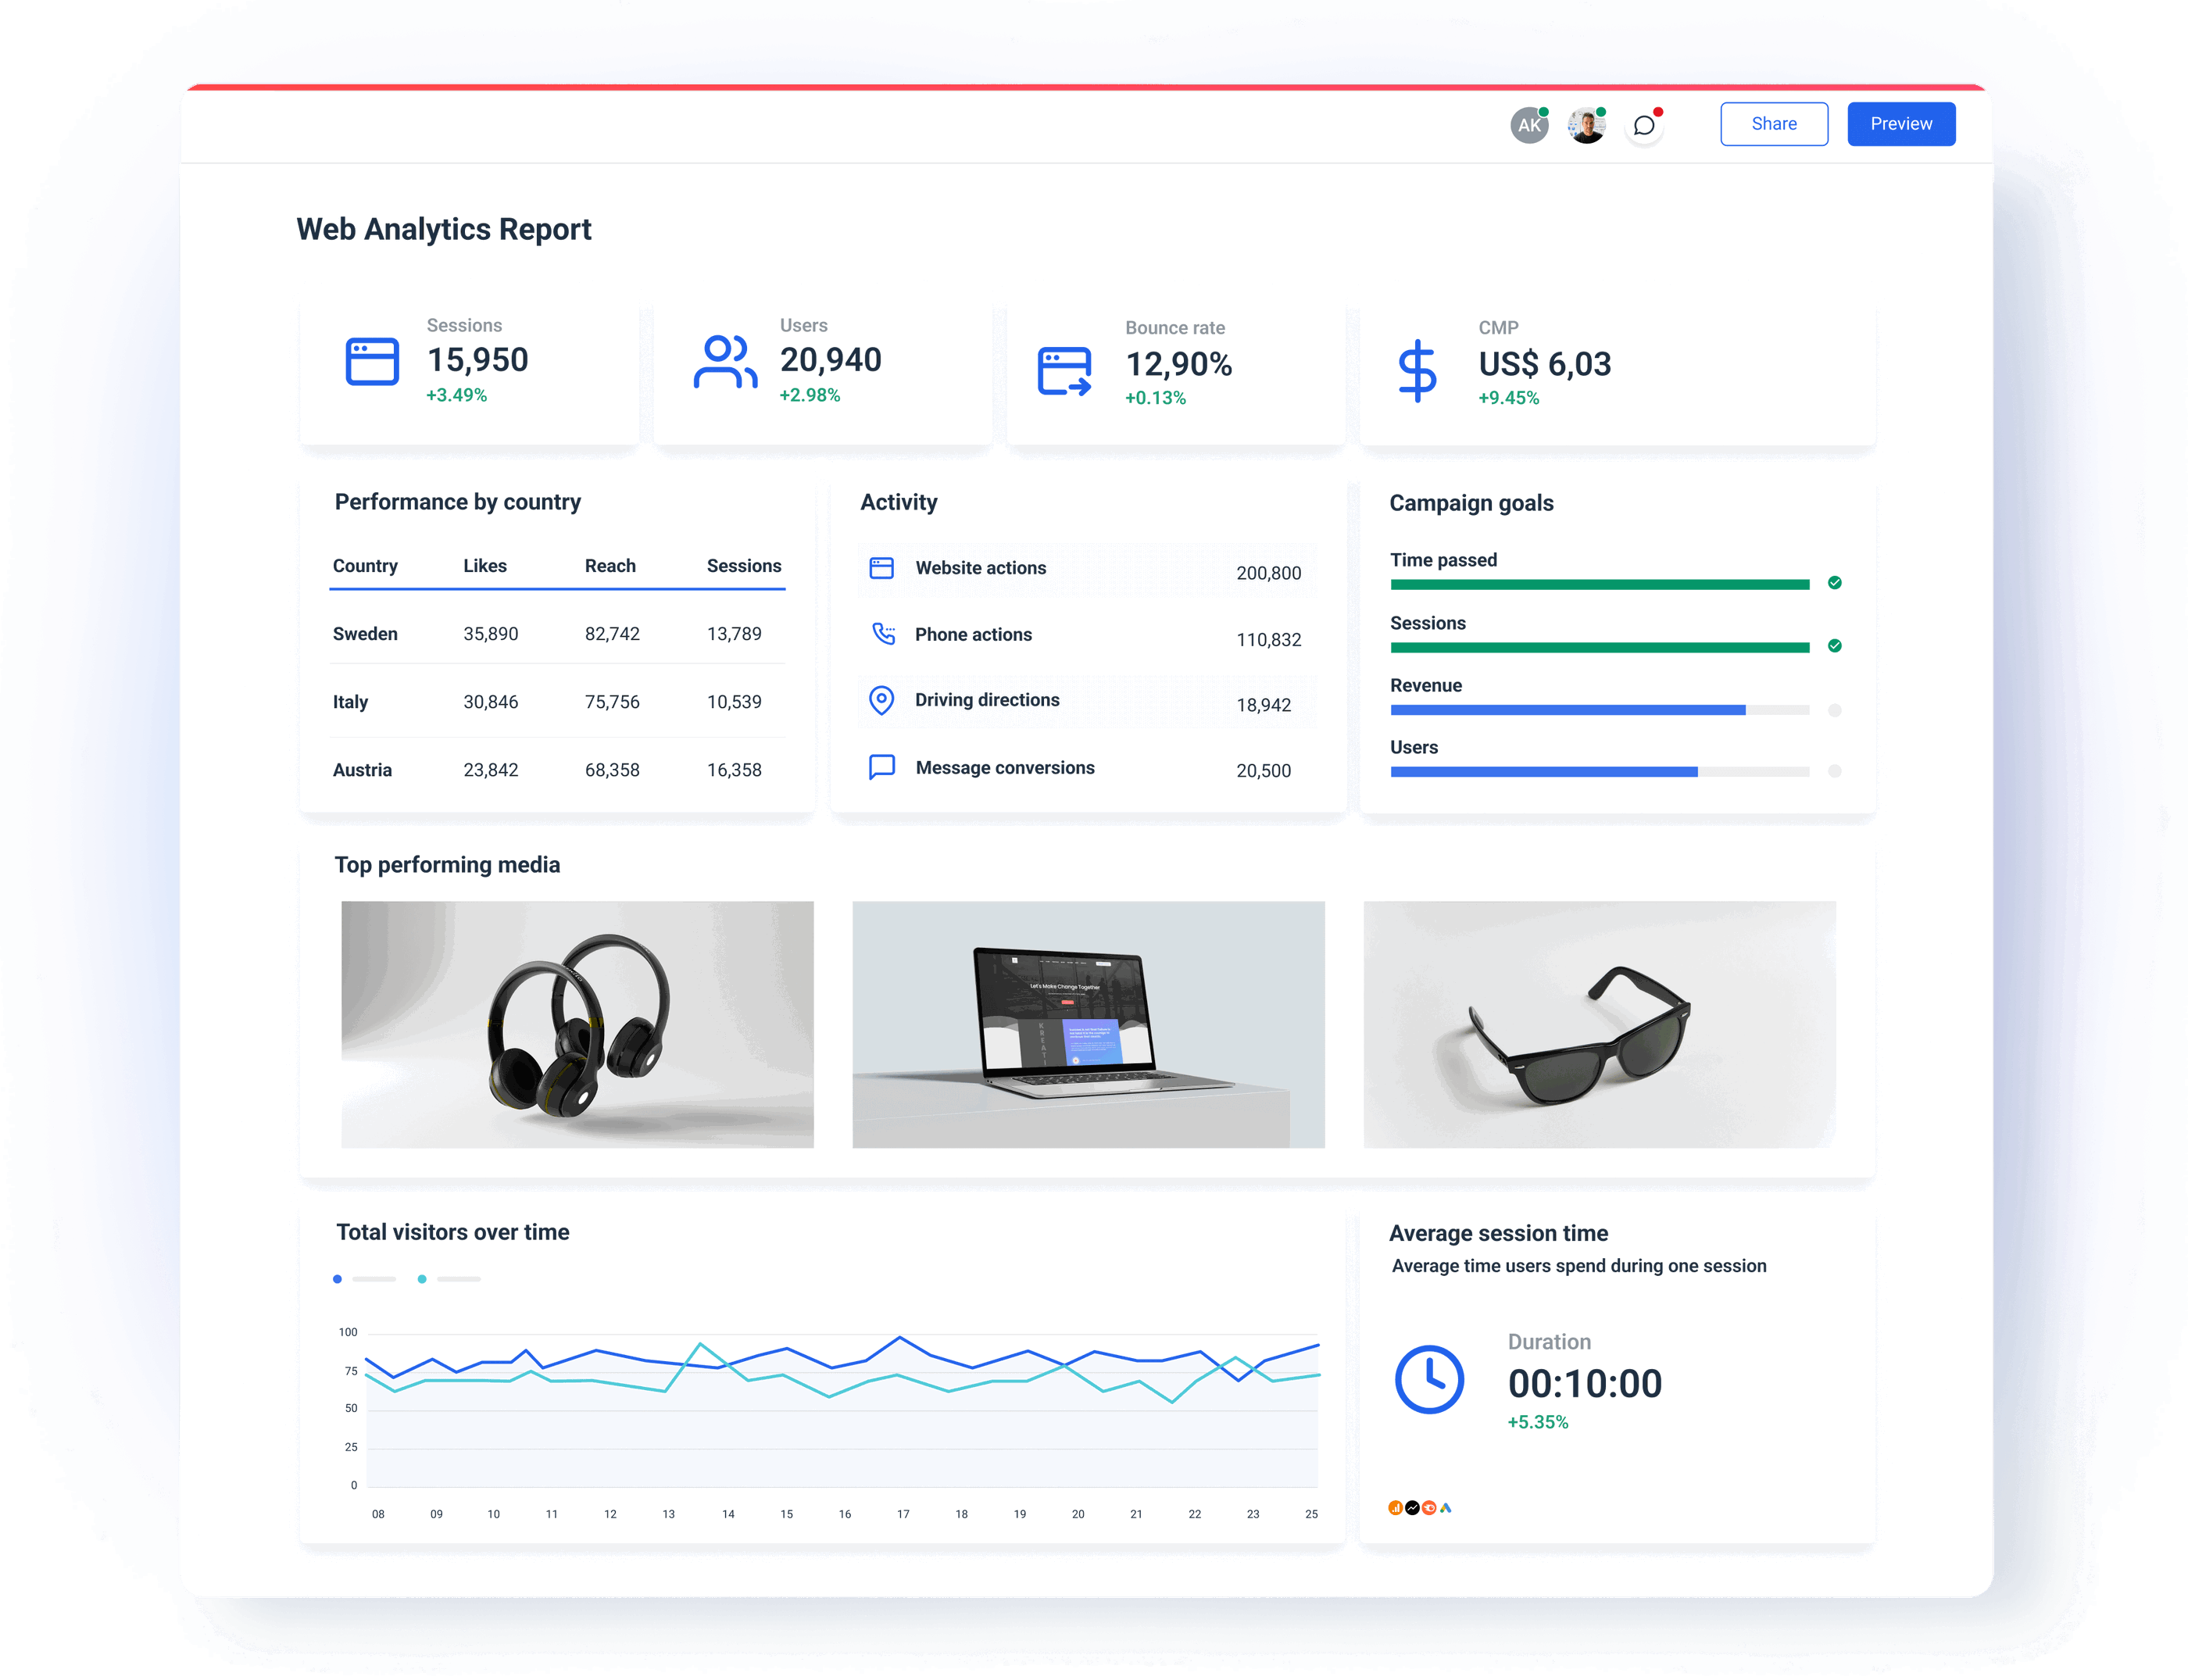
Number of sessions or visits: They represent the raw count of website visitors over a certain time period. Tracking this metric over time and comparing year-over-year (YOY) and month-over-month (MOM) data tells you how well your website performs.
Percentage of new sessions: This metric tells you what percentage of your website visitors are on your website for the first time, as opposed to returning visitors and total number of individuals (unique visitors). If people are not coming back to your website, this can point out to a problem with your content, design, etc.
Traffic channels: It’s important for you to know what percentage of your visitors come from Pay-per-Click (PPC), social media, organic search, direct traffic, or other websites (referral traffic). This information helps you invest more in the channels that are performing well and less in the ones that are underperforming.
Conversions and goals: Conversions can refer to things like sales in the case of e-commerce sites, form submissions for lead generation sites, downloads for information sites, etc.
Bounce rate: The bounce rate is the percentage of visitors that leave without interacting with your website in any way. A high bounce rate can tell you that your website is not relevant to the needs of your visitors or that your UX is not user-friendly. Google Analytics 4 (GA4) has a bounce rate metric but it’s essentially the negative engagement rate.
Engagement: Engagement metrics cover the actions people take on your website. These can include things like the number of pages viewed, the average time on site, session duration, goal completions, and other KPIs.
Content performance: Content performance metrics tell you how well your content is performing. Are people reading, sharing, and commenting on it or do they leave the page after a few seconds? Combined with insights from your search engine optimization tools, these metrics can be particularly useful for blog posts, articles, product pages, infographics, etc.
Audience: Audience metrics provide valuable insights into who your website visitors are. These include age, gender, location, interests, etc. This also includes what device they use, which can help you optimize the design.
Lead capture: If you have a lead capture like gated content or an exit form on your website, you’ll want to track how many people are filling it out and how much it’s costing you per lead.