AI Report Generation Explained: How to Create a Report With AI?
This may be an ironic pill to swallow, but The Atlantic is right: “Machines make marketers more human.”
When you’re drowning in what MarTech calls the "three Vs of data"—volume, velocity, and variety—you aren’t exactly spending your 9-to-5 doing human things like strategizing or storytelling.

Feb 25 2026●8 min read


46% of senior marketing leaders now say data analysis is the most critical skill in their profession, and “evidence-based creativity” is the new price of admission.
But look at the math marketers are expected to solve: high content quality (42%), fast execution (40%), the flexibility to adapt before the market moves without you (37%). All three, all at once, all while two-thirds of teams say their tech stack still isn't helping them do more with fewer resources.
Something has to give. So let’s start by automating the very task that eats into 4.1 hours every week for marketers: report generation.
What is AI Report Generation?
AI report generation is the practice of using a tool that automates the entire lifecycle of a marketing report, from pulling raw data to writing the final summary and ideally, automating its delivery to your clients.
The software uses machine learning (ML) to connect your data sources, organize the metrics, and then also explain the story behind the numbers when prompted.
The process of automated report generation specifically replaces three manual bottlenecks:
- The build: The AI does the heavy lifting of pulling the right numbers and putting them into a client-ready layout that makes sense and is instantly shareable.
- The analysis: The AI answers any questions you or your clients have about your data in seconds. You won’t have to dig through pages and pages of reports to answer a simple client question. You just ask AI and it spits out the answer based on your actual connected data – within your reporting platform.
- The commentary: The AI looks at the charts it just built and summarizes performance based on your connected data for a specific time period on your report (e.g. last month).
Why use AI for marketing reporting?
McKinsey recently found that revenue increases from AI are most common in three sectors, the chief being marketing and sales.
Further, Influencer Marketing Hub reports that 34.1% of marketers are seeing significant improvements in their outcomes after implementing AI.
But the true win comes from the hours clawed back from manual reporting.
Chris Marrano, Founder of Blue Water Marketing, recently shared on LinkedIn how his team went from 60 hours of reporting to 5 minutes, using Whatagraph’s AI to generate a full cross-channel report from a single question.
For him, Whatagraph gives him “reporting that finally matches the speed of decision-making”—which is exactly the point of report generation automation.
How to Create a Report With AI in Whatagraph
Earlier, we defined AI report generation as a process that handles the build, the analysis, and the commentary for you.
In this section, I’m going to follow this exact three-part definition inside Whatagraph to show you how you can save 100+ hours per month on reporting with AI.
1. The build: Walk with me from prompt to report in 30 seconds with Whatagraph’s AI dashboard generator.
For this walkthrough, I’m using sample data so I don’t have to redact half the screenshots. The live experience is identical once your own accounts are connected.
- First, Start a free-trial.
- Hit Create report and then Create using AI to create a dashboard from prompt
- Here, I selected my own website as the source for the report.
- Then I choose a suggested prompt from the smart suggestions below—Engagement—so it auto-fills the text box for me, but you can also enter your own.
- Finally, hit Generate, and the AI builds the first draft of the report in a few seconds.
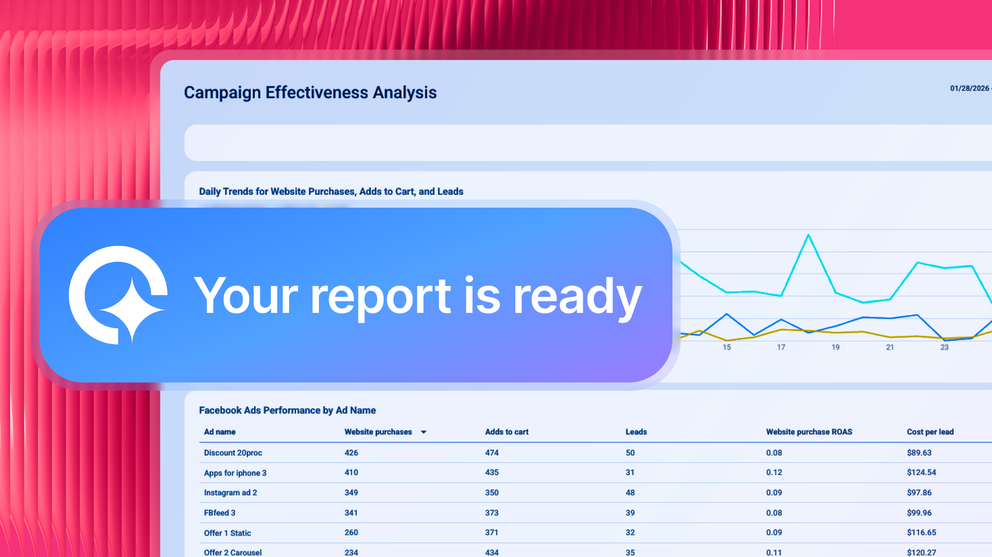
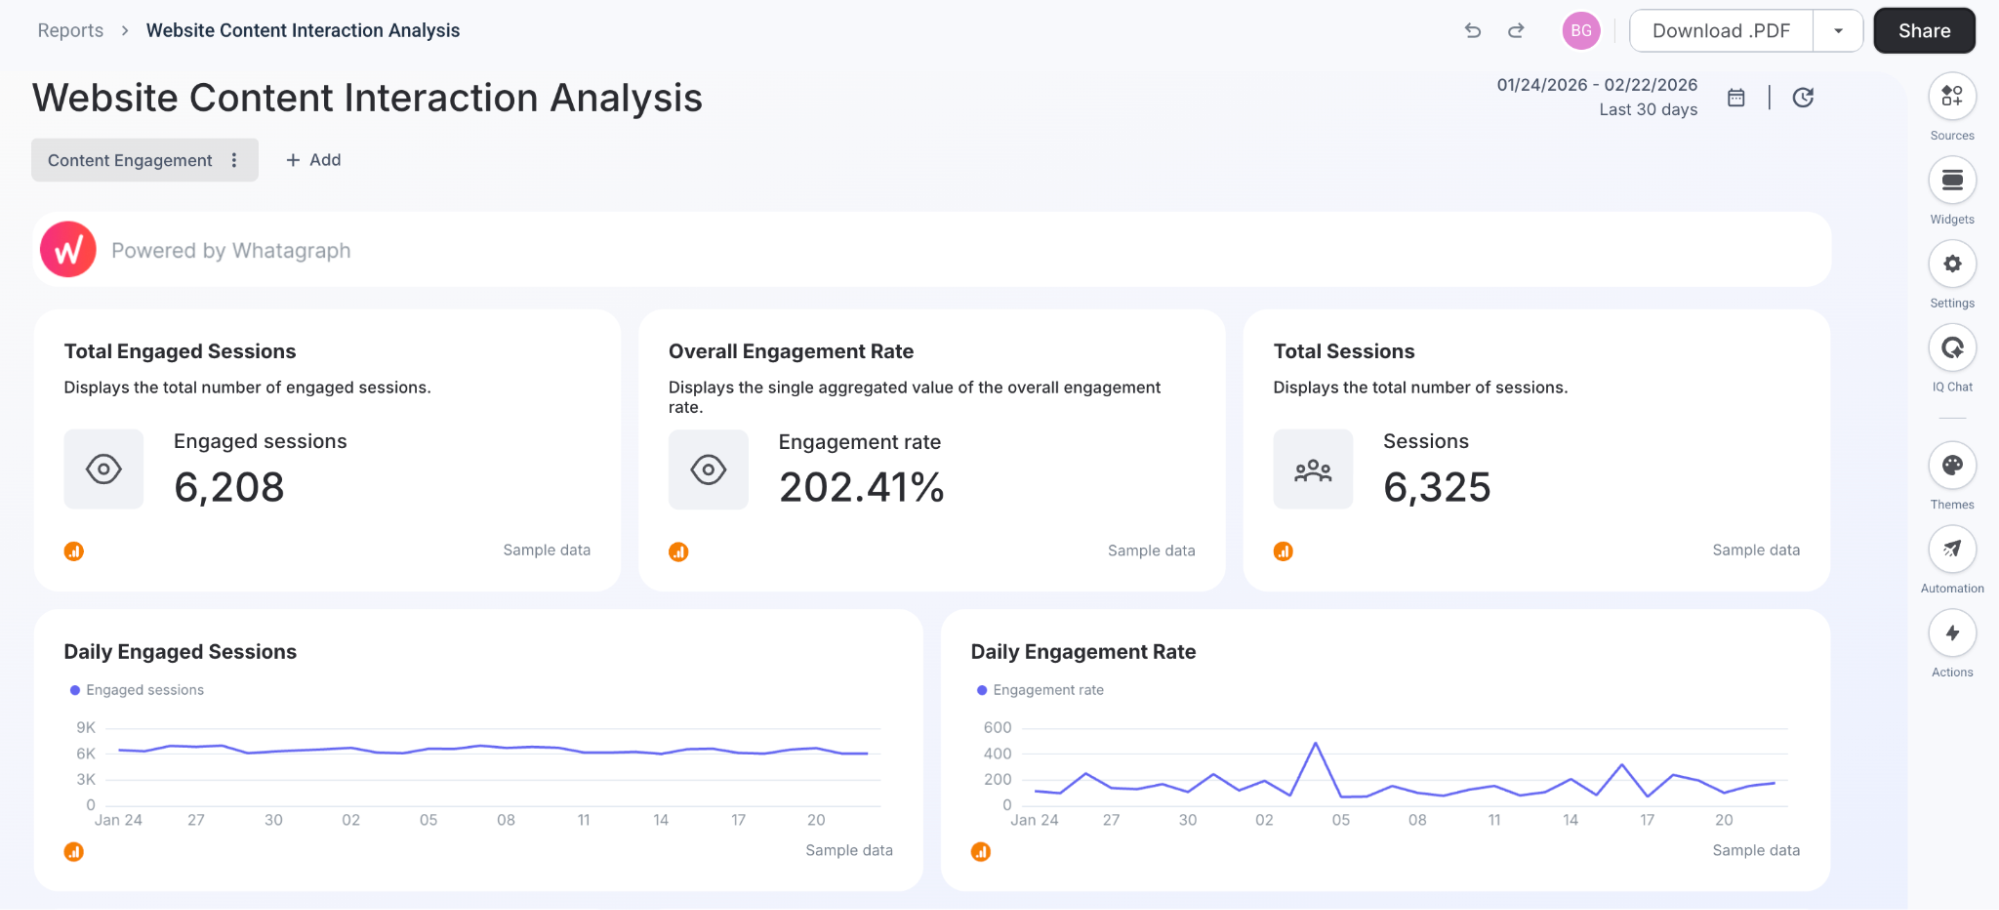
Et voila! In under 30 seconds, I went from a dashboard home screen to a fully visualized, multi-widget report.
Honestly, if this is the only part you read, you’re fine. You’ve just traded an entire afternoon of manual reporting for one little button click. That’s AI report generation in practice for you.
But you know the build doesn't stop at the first draft. Sometimes you need to pivot a specific metric, but you still don't want to go digging through a menu of 500 variables.
In Whatagraph, if you click on any widget, you can apply quick changes using a natural language prompt.
So instead of rebuilding the whole thing, I just typed "Show me visitors" into the “Total Engaged Sessions” widget's AI prompt.
The engine automatically predicted the right dimensions and metrics, fetched the data, and swapped the widget instantly.
Plus, you can literally drag on the grid to draw a box, then describe the widget you want in natural language, and IQ builds it for you.
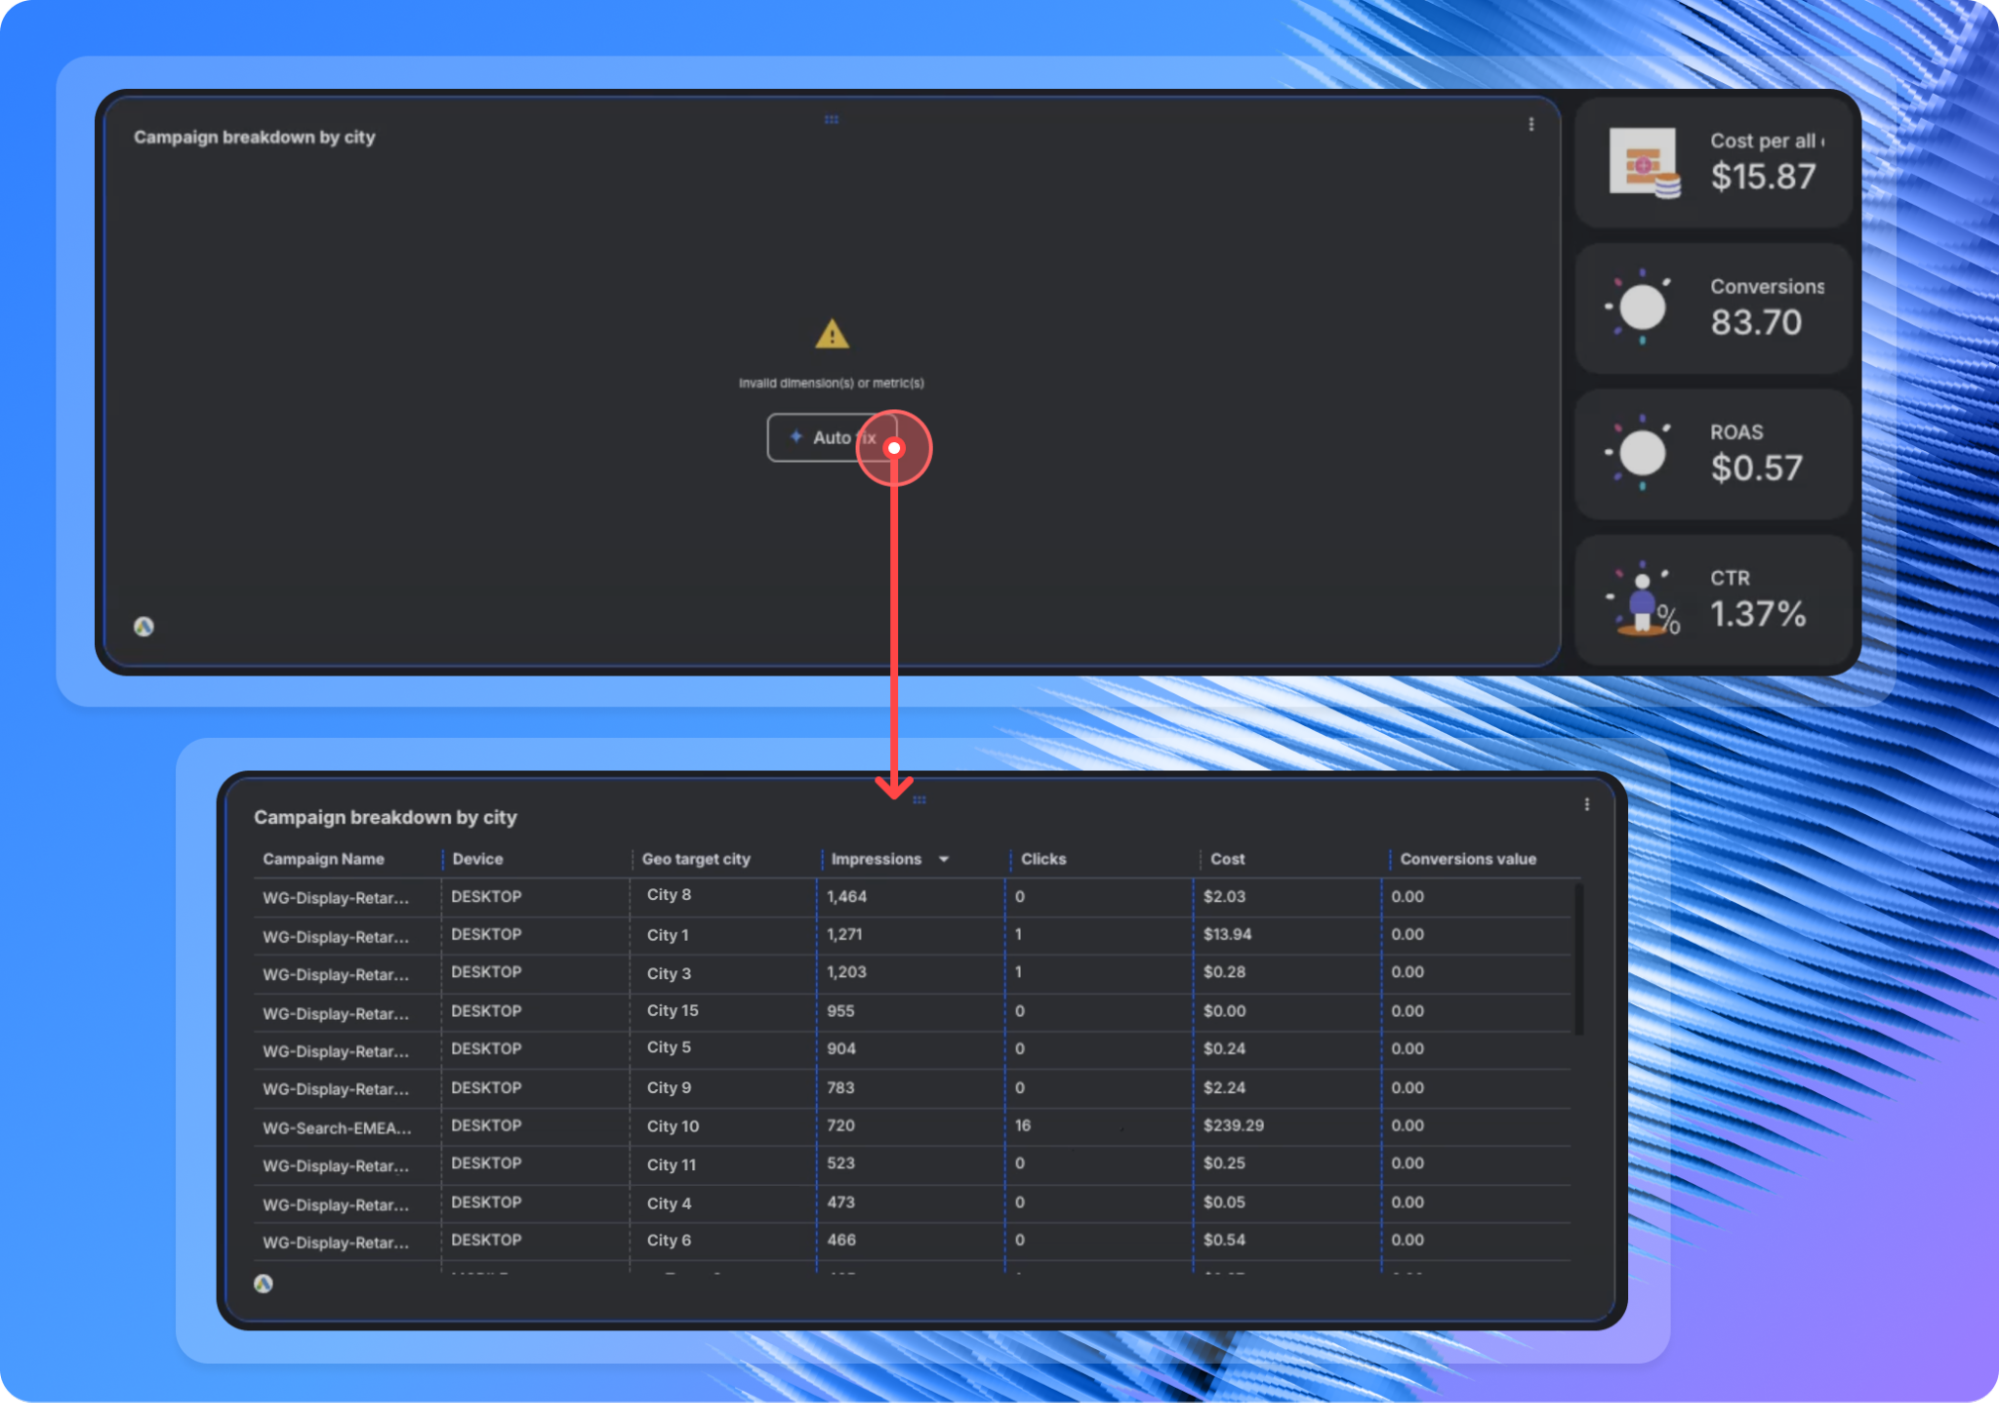
✨ New feature: Whatagraph’s self-healing widgets—Widget Auto-fix—powered by Whatagraph IQ, automatically detects issues like incompatible metrics, incorrect dimensions, or other widget errors and proposes the right fix before they break your report. If you’re happy with the suggestion, you apply it in one click. If not, you can undo it just as fast.
 Next, the part of the build that makes or breaks client trust: does the report actually look like it came from you?
From my report, I hop over to the right-hand menu and click Themes.
Here, you can:
- Control the full white-label package: Add your own logo, brand colors, text style, header and footer text, and even a branded subdomain so reports live on “reports.youragency.com,” not “app.whatagraph.com.”
- Create a reusable global branding theme: In Custom Branding, set up a theme with your brand colors and other custom branding settings at the global team level. Once it’s active, any new report automatically inherits that look and feel.
- Swap the logo in a couple of clicks: Open the report, go to Report settings > Edit next to Custom Branding themes, click the little cross to remove the default logo, and then hit Upload image to add your own. Save, and that logo now fronts the report your client sees.
Introducing Whatagraph’s AI Report Theme Generator
The fun bit is the Whatagraph IQ Themes. Inside the same branding panel, there’s an Enhance theme style with IQ option.
You’ve got three ways to work it:
- Type a natural-language prompt like, “Use a muted, editorial palette with dark headers.”
- Pick from a suggested color palette if you already have a set brand color you want.
- Or do what I did—upload one of your monograms as the prompt and let IQ pull a palette straight from that image. It’s like an “logo-to-theme” generator, but for reports.
The result is a perfectly white-labeled marketing report you’d be proud to share with your clients.
Did you know? Marketers burn 2.2 hours a week on data entry and cleansing. A lot of that is pesky little things like campaign names not matching across platforms. With Whatagraph’s custom dimensions powered by IQ Plus, you show the AI how you want campaigns grouped, and it builds a cleaned-up dimension you can reuse in every future report.
AI Dashboard Generator Examples
Now, let’s get practical.
Below, I’m going to show you how to generate reports with Whatagraph IQ in less than 2 minutes each.
First up - social media report generator. All I did was:
- Choose the channels and sources I want to report on. (In this case it was Facebook and Instagram)
- Add a custom prompt (e.g. create a Facebook and Instagram report for X time period.)
In just 1 minute 42 seconds (no, we didn’t speed it up), you’ll get a full social media report. You can then:
- Adjust the metrics in the widget
- Add new widgets or edit existing ones with AI
- Create custom dimensions and metrics
- Style it with Whatagraph IQ Theme
- Automate the report
This works for all of 60+ channels available on Whatagraph as integrations. This means you can use it as:
- Google Ads report generator
- GA4 report generator
- Facebook ads report generator
- PPC report generator
- Tiktok Ads report generator
- LinkedIn Ads report generator
- Google Search Console report generator
- Google Business Profile report generator
- Microsoft Ads report generator
- YouTube report generator
- SEO report generator
The possibilities are endless.
Want report templates instead? We’ve got over 50.
2. The analysis: Walk with me as Whatagraph IQ takes the first pass at your data.
I’m still inside the same report. The widgets are populated, branded, and live. The whole point of automatic report generation is to cut out the time you spend manually scanning every graph.
Go over to Whatagraph IQ Chat, our AI insights generator, on the right and let the AI do the first round of thinking.
Ask IQ what changed and where
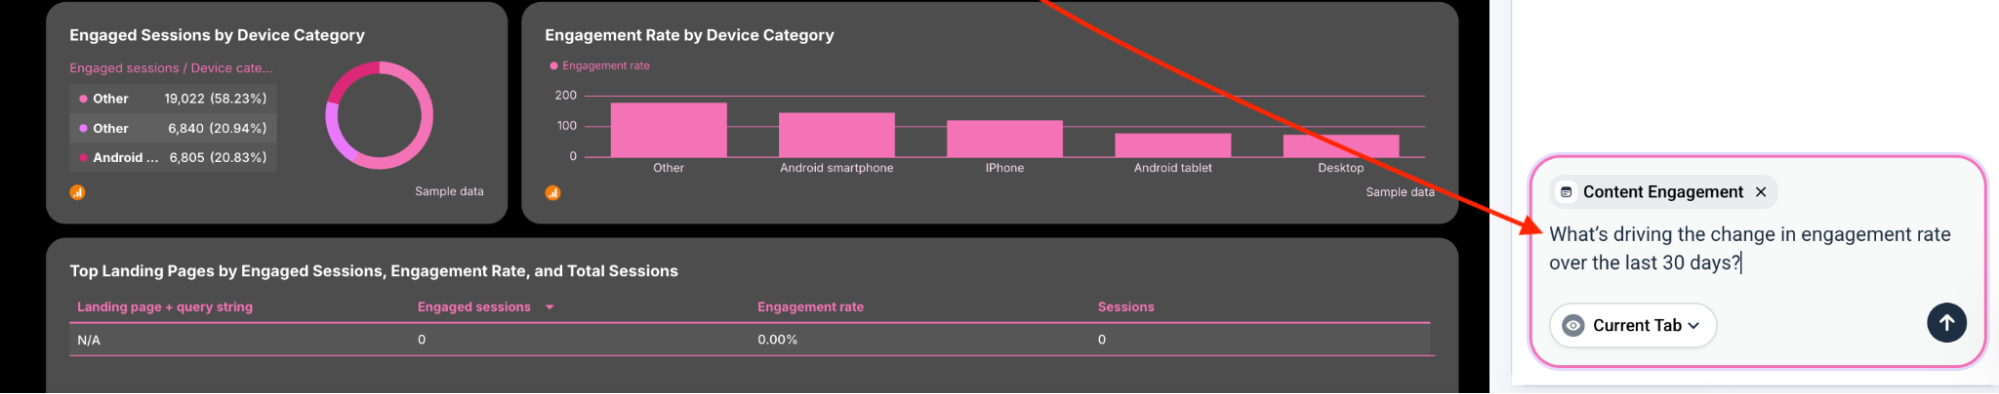
For this round, I’m looking at content engagement over the last 30 days.
In the IQ Chat panel, I type: “What’s driving the change in engagement rate over the last 30days?”
IQ analytics chatbot knows which tab I’m on (Content Engagement) and which source I’m using (GA4), so it doesn’t make me restate any of that.
 IQ analytics chatbot knows which tab I’m on (Content Engagement) and which source I’m using (GA4), so it doesn’t make me restate any of that.
A few seconds later, I get a breakdown that reads like a mini AI analytics assistant instead of a generic summary:
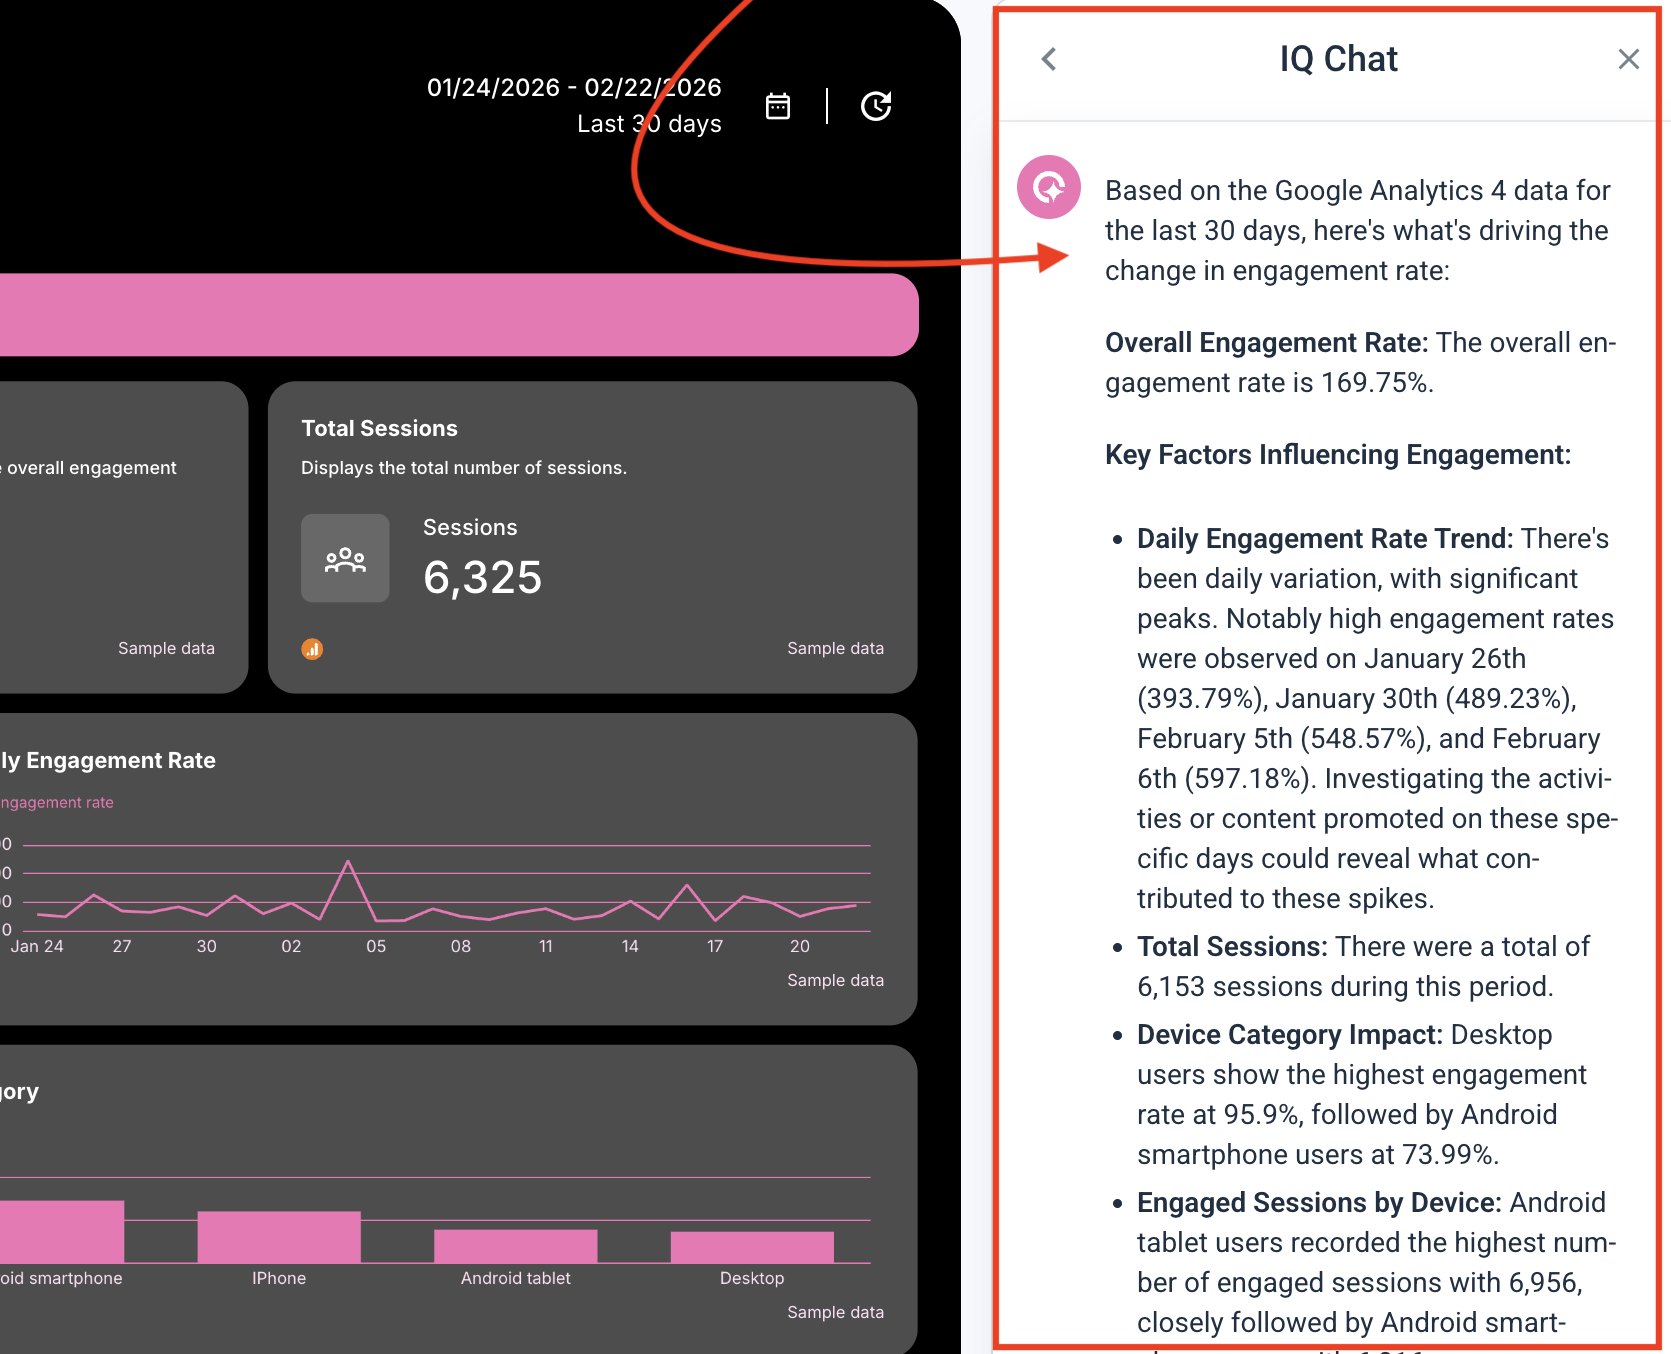
IQ is doing the cross-referencing you’d normally do manually: scanning the time series, lining it up with sessions, and slicing by device category.
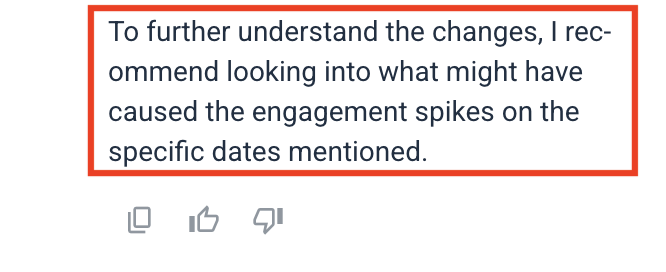
IQ’s natural language analytics also nudges you toward what to do next. At the end of the breakdown, it adds a simple recommendation for me:
“To further understand the changes, I recommend looking into what might have caused the engagement spikes on the specific dates mentioned.”
So in one pass, IQ has:
- Summarized the last 30 days,
- Highlighted the key drivers; and
- Surfaced the next best step to dig into.
All of this means that by the time you start thinking about your own recommendations, you’re already two steps ahead of staring at raw charts.
And power users like Ben Goodey, Founder of Spicy Margarita, are already doing this in the wild—asking IQ for things like “a performance report on traffic and leads coming from ChatGPT over time” or “a succinct written analysis of traffic from ChatGPT.com,” straight from their GA4 data.
Take a look at how Ben is using Whatagraph for ChatGPT traffic reporting:
Let IQ surface anomalies and trends for you
Zooming out, Whatagraph’s feature set is built around instant marketing insights: performance overviews by country, team, or product, plus goals and alerts that notify you when something needs attention.
So in a live client report, analysis looks like:
- You set Goals & Alerts around critical KPIs like engagement rate, ROAS, budget pacing, conversion volume, in an Overview that tracks all your campaigns or clients.
- Data refreshes every ~30 minutes, which really makes a difference when you’re watching paid performance.
If something weird happens like a sudden spike in spend or a dip in conversions, Goals & Alerts send you daily or weekly notifications via email, Slack, or in-app so you can jump straight into the relevant Overview and fix it.
Chantelle Bowyer, Founder and CEO at Metis Marketing, raves about this feature:
We needed a way to stay on top of client budgets without having to constantly log into native ad platforms and monitor performance there. Whatagraph took that feedback and built Goals & Alerts, so we get notified timely when performance needs attention and spending goes off-track. And I have to say...it’s epic!
Enable your clients to chat with their own data
Once your report is ready, you go to Share, and before you copy the link, you toggle on IQ Chat for the report.
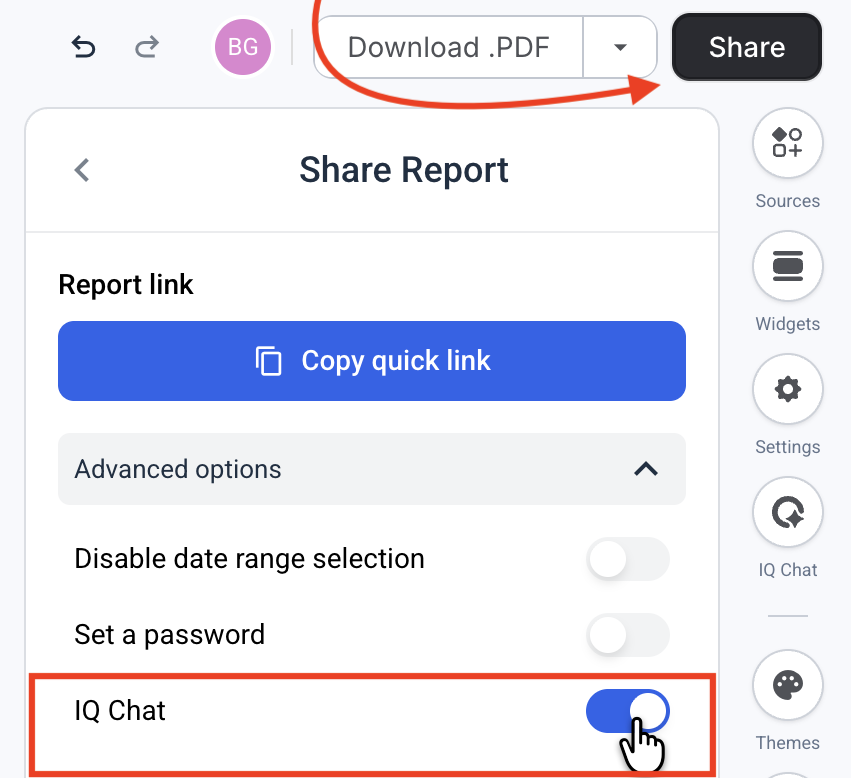
From your client’s point of view, it’s magic. They open the link and see a little AI chat bubble in the bottom-right corner, styled to match your report branding.
Clients get to chat with data and get instant answers, directly inside the report. And as a result, you get fewer “quick question” emails and Slack pings, because the obvious stuff is handled.
Your agency still owns the interpretation and recommendations, but the basic “what happened?” is now self-serve.
3. The commentary: Walk with me as AI summarizes your report with AI Executive Summary Generator
The final bottleneck in marketing reporting is the prose—the commentary—the cumulative hours you spend staring at a blank text box willing for the insights to write themselves.
No more with Whatagraph IQ Summary.
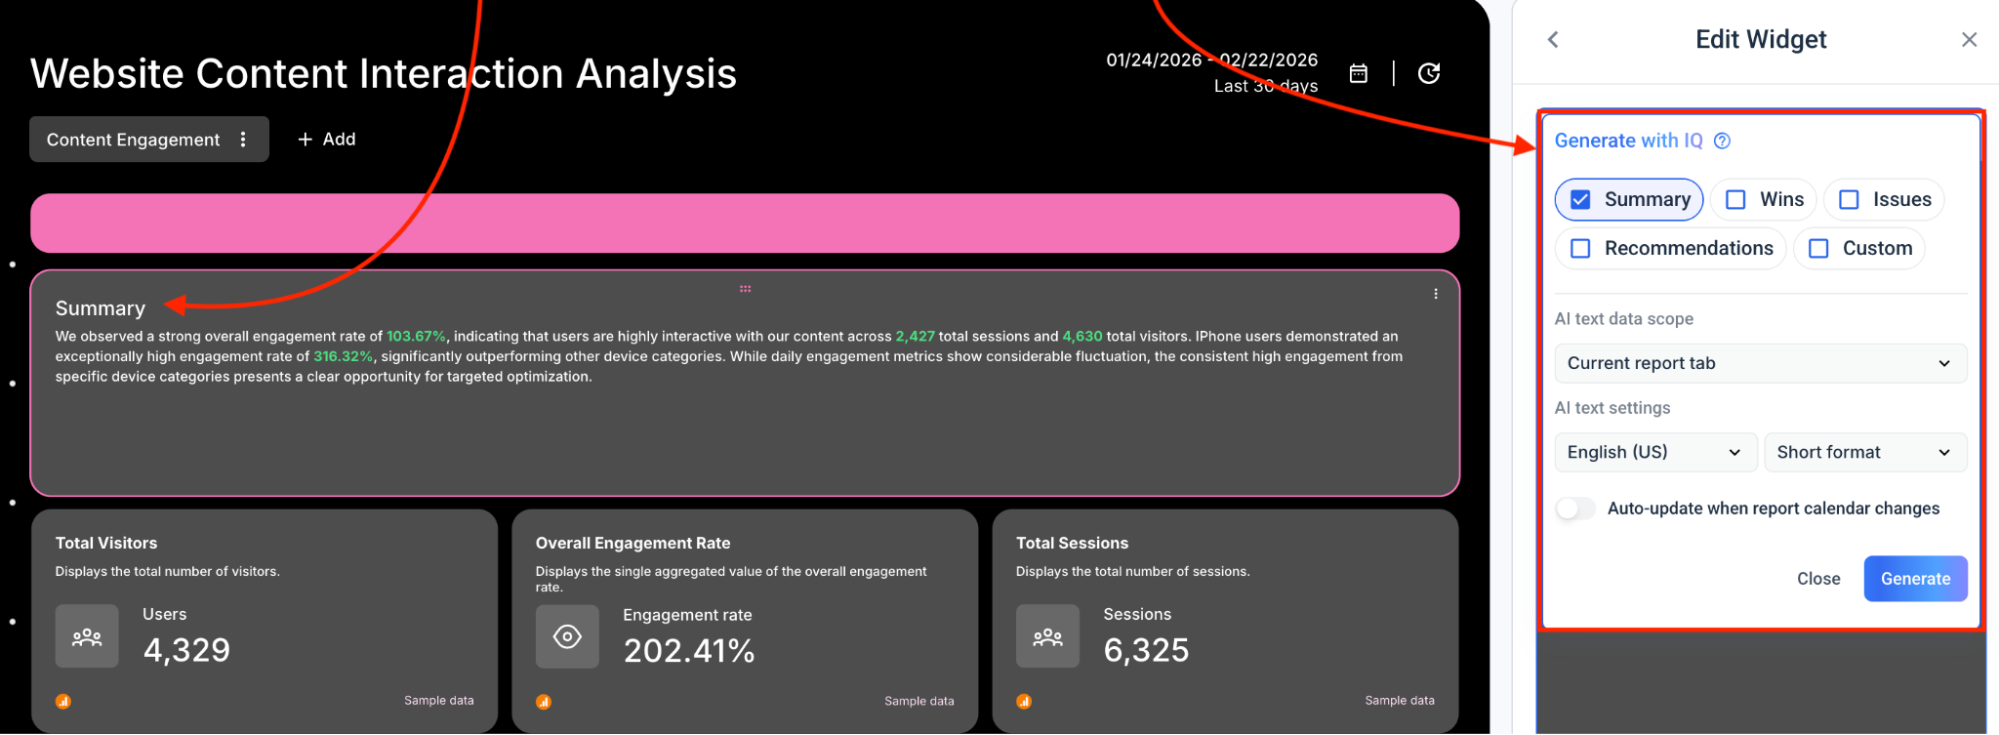
From the right-hand menu, click Widgets. That opens the widget drawer on the right, where you can select Text (includes AI summary) and drop it in at the top of your report, like so: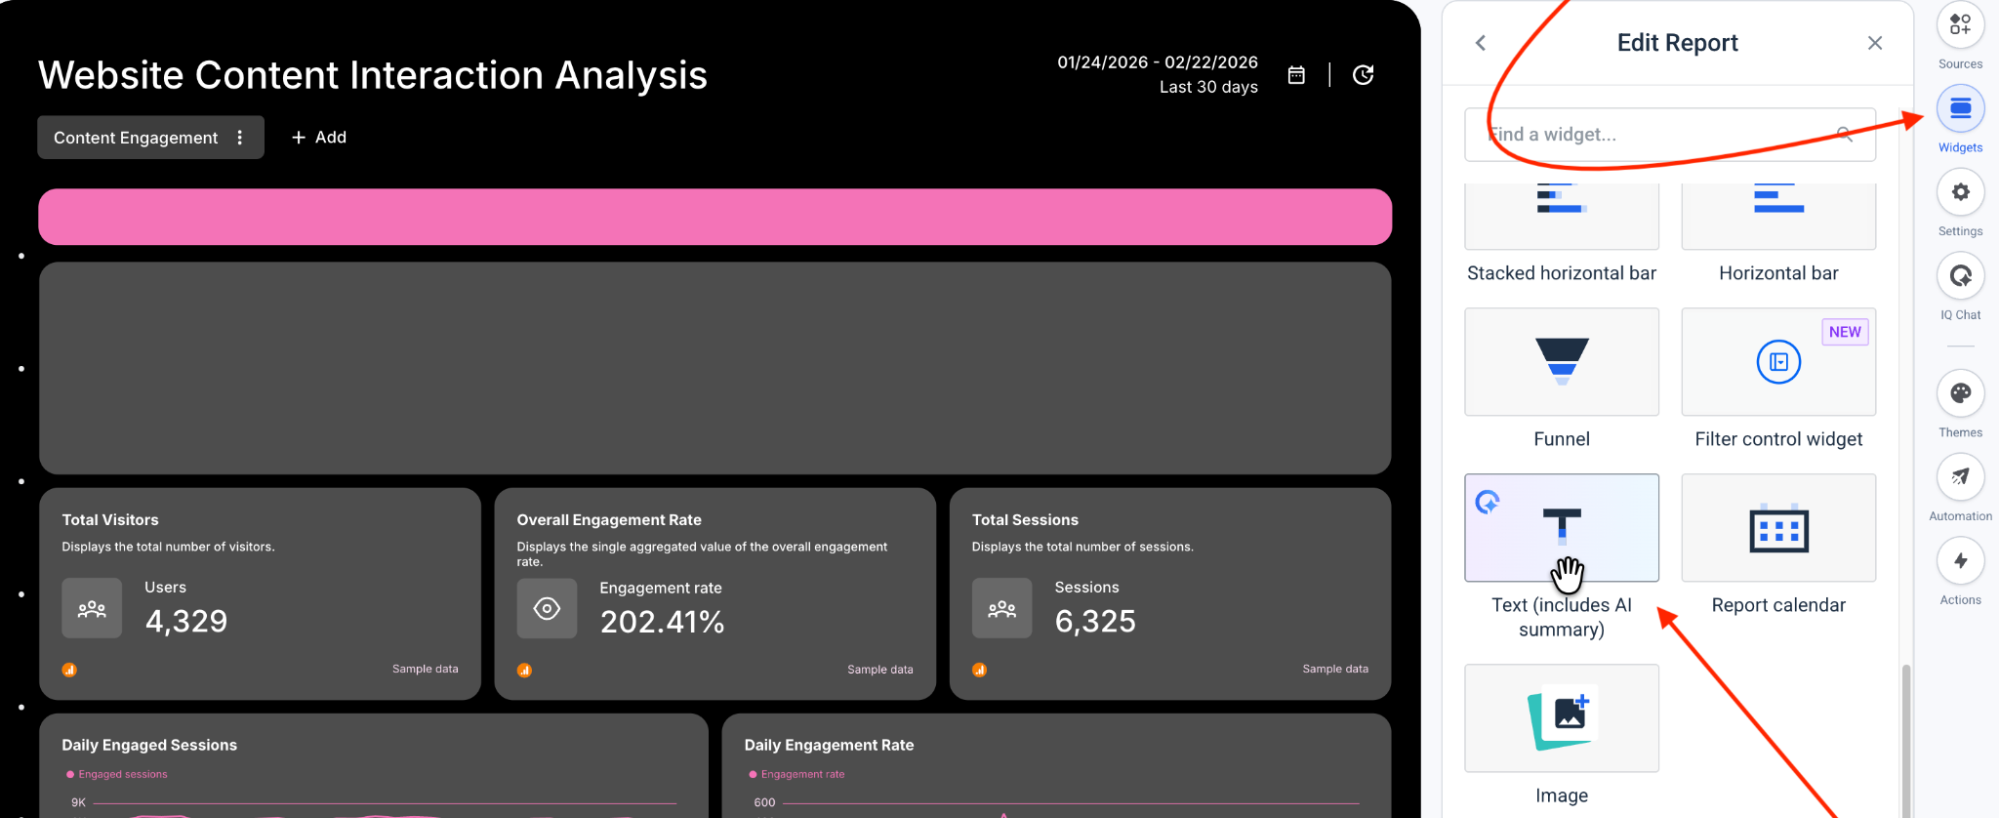 Once the text widget is in place, click into it. In the widget editor, there’s a Enhance with IQ icon.
- Choose your story: Inside the Generate with IQ panel, tell it what kind of narrative you need: a high-level AI performance summary, a list of wins and issues, or specific recommendations. Go custom if you have a specific angle in mind.
- Set the scope: You can tell IQ to stick to the current tab, perfect for a content-only view; or pull from the entire report for a big-picture executive summary.
- Customize the delivery: Choose from 18 languages and select your preferred length—short for a CMO skim or long for a deep-dive performance review.
Hit Generate and watch the empty text box turn into a narrative.
 ✨ The IQ Plus advantage: As soon as IQ Plus is enabled on a report:
- When you change the date range, IQ Plus proactively rewrites the summaries to match the new period.
- Your commentary stays aligned with the latest data, without you rewriting the same paragraph for “this month” vs “last month” vs. “Q1.”
- If you want to take over, you can switch it off and make manual edits at any time.
How to Automate Reporting on Whatagraph
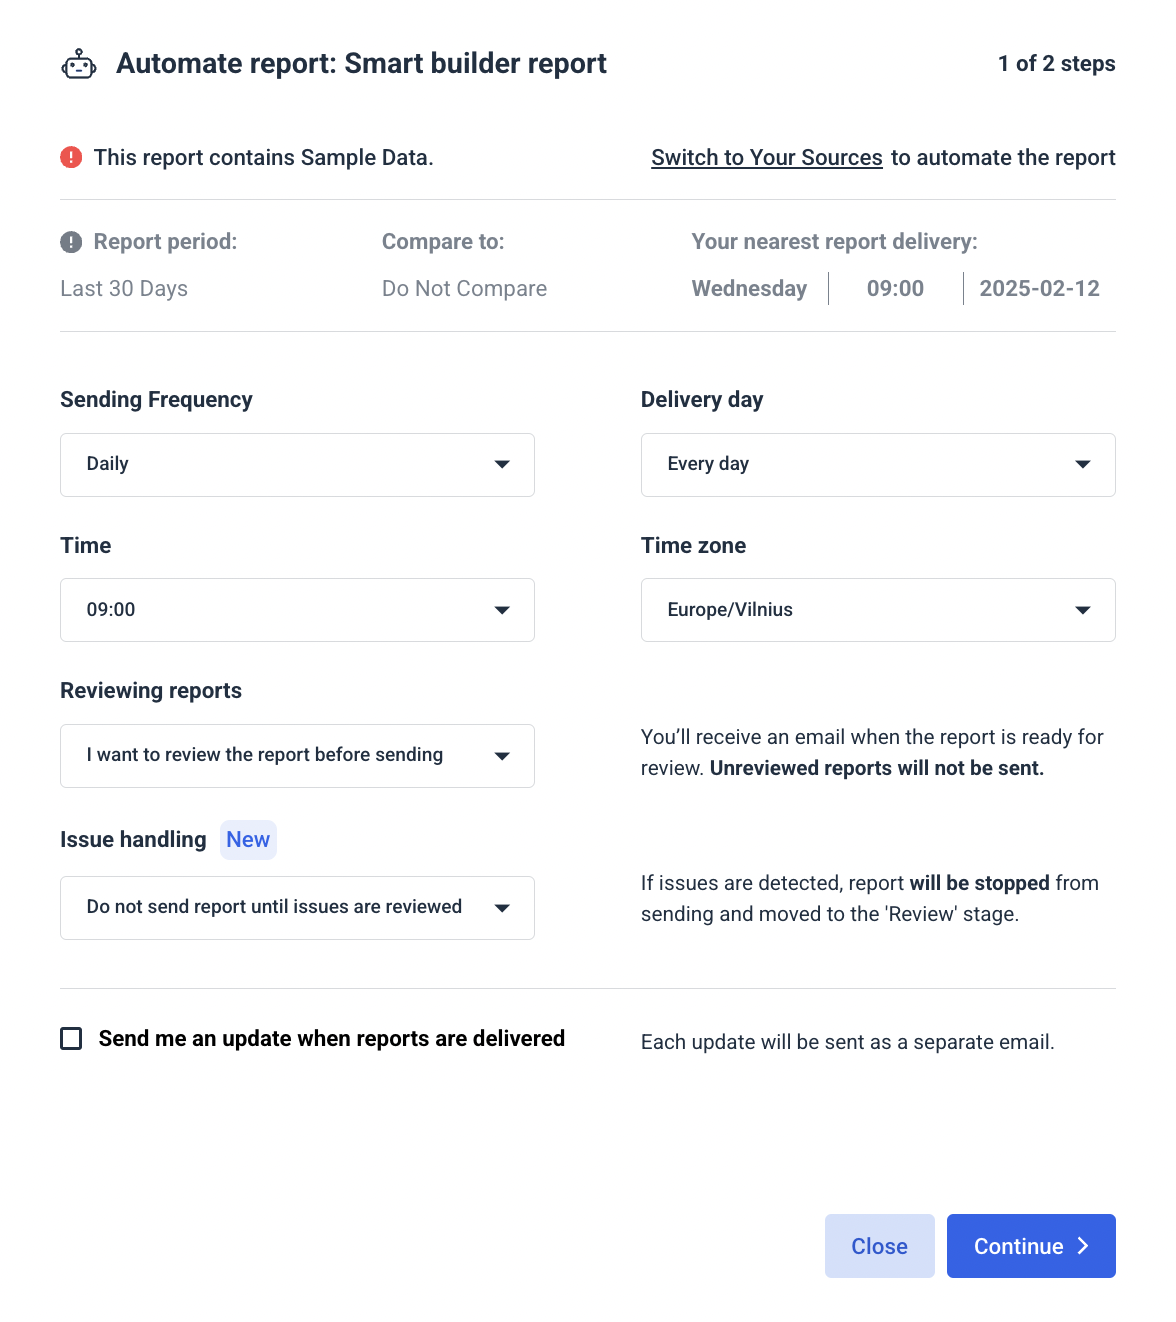
Whatagraph also bakes automated client delivery into report automation. Once your report is set up with the right date range, you go to Automation > Automate report and tell it:
- How often to send, that is, the sending frequency.
- Which day, time, and time zone to use.
- Whether you want to review before sending or let it ship automatically.
- Who should receive it—you, your team, your clients, or all of the above.
A Case of AI Report Automation: How Maatwerk Online Saves 100 Hours a Month on Reporting
Maatwerk Online is one of the Netherlands’ more prominent performance agencies, serving 100+ clients across SEO, SEA, and paid social.
On paper, they’d already solved reporting with a combination of Supermetrics and Looker Studio. But in truth, it was what I call a “Frankenstack.”
Worse, the reports themselves had turned into a second Google Analytics: dozens of tables, way too many metrics, and very few clients actually reading them.
Lars’ philosophy is pretty simple: a report should focus on what matters—top-level KPIs, clear targets, and profitability—and specialists shouldn’t have to burn their best brain hours building dashboards they resent.
Enter Whatagraph.
Lars is especially a fan of the AI Widget Creator—his team no longer has to create charts from scratch. They literally draw a space on the grid, describe the widget in plain language and let Whatagraph build it.
Here’s Lars in his own words:
Lars also loves Whatagraph IQ Chat: “Let’s say you’re in a client meeting and they ask a bunch of questions,” he said. “Instead of saying, ‘Let me get back to you,’ you can just ask the AI chatbot and get the numbers right away. That’s really amazing.”
Here’s him raving about IQ chat:
Put those pieces together and the compounding effect is 100+ hours saved every month for Maatwerk Online. After switching to Whatagraph, the team now saves at least one hour per client, per month on reporting.
Whatagraph’s AI saves time and energy for our marketing specialists. And the hours we’re saving is just pure profit. We now have the time to focus on more strategic things that help both our agency and our clients grow.
If you’re reading this thinking, “That’s nice for Lars, but my team is still stuck in Franken-report hell,” that’s your cue.
Your move: Pick one client, one channel, and one report. Plug it into Whatagraph, build it once with IQ, and see how it feels to get the same (or better) insight without sacrificing a full afternoon.
Worst case, you’ve proved AI report generation isn’t for you. Best case, you’ve just bought your team 100 hours a month back.
Get started with Whatagraph today.
Published on Feb 25 2026
WRITTEN BY
Brinda GulatiBrinda Gulati is a fractional content marketer and freelance writer who specializes in data-driven storytelling and writing easy-to-understand, informative content for humans. She has two degrees in Creative Writing from the University of Warwick, and believes that above all, stories are a deeply human endeavor. She has two dogs, knows thrifting spots, and loves afternoon naps.