Building Brilliant MailChimp Campaign Reports: a How-To Guide
Mailchimp is leading the way in email marketing campaign management and delivery. As with all digital marketing tools, campaign results must be analyzed carefully and reported to executives or your clients. Native analytic tools may not always cut it - you need to compile data yourself and build comprehensive reports that tell the whole story.

Jan 21 2021


Whatagraph is a tool used to aggregate digital marketing data and present it in a visually appealing way. This tool works with various popular digital marketing platforms, one of which is an email campaign management platform – MailChimp.
Sending marketing emails may require a lot of creative energy and strategic planning. But if you don’t use a report to look at the output data of these emails until you send them, how do you know if your efforts are paying off?
That’s why you need a comprehensive MailChimp email report – it makes it easy to see patterns and outcomes by having relevant data in one place. Sure, you want to see the clicks of each email you sent. But to get a fuller view of the peaks and lows of your campaign, you’ll also want to see improvements in your email acquisition rate.
Let’s take a look at how to build an insightful MailChimp analytics report.
What metrics should you keep an eye on?
Before you jump into the report creation process, we need to assess the key metrics to report on. Here are a few:
- Open rate: the number of people that opened the email divided by the number of people you sent the email.
- Click rate: also referred to as CTR, short for click-through rate. It’s the number of clicks on an email, divided by the number of people you sent the email.
- Unsubscribe rate: the number of people who unsubscribed from your list divided by the number of people who got the email.
- Goal conversions: the desired action that takes place on your website.
- Email bounce rate: the number of recipients on your list who didn’t receive your email because it was returned to the recipient’s server.
- Conversion rate: In Google Analytics, the percentage of visits that result in the completion of the target.
- Unique opens: the number of new, unique users who opened your email.
The above listed are the go-to metrics that help gauge the effectiveness of your email marketing approach. Chances are when the reporting period arrives, these metrics will be placed under the magnifying glass. You can also consider using the Mailchimp dashboard.
Now that we’ve covered the brunt of email campaign metrics, it’s time to get your data organized. All this data needs is to turn into actionable reports that tell a story and provide insights.
Let’s get started.
Aggregate valuable metrics at the top
Compiling the essential email campaign metrics at the top is of utmost importance. We’ve already covered what metrics to keep an eye on. So, this portion of the report is all about organizing them.
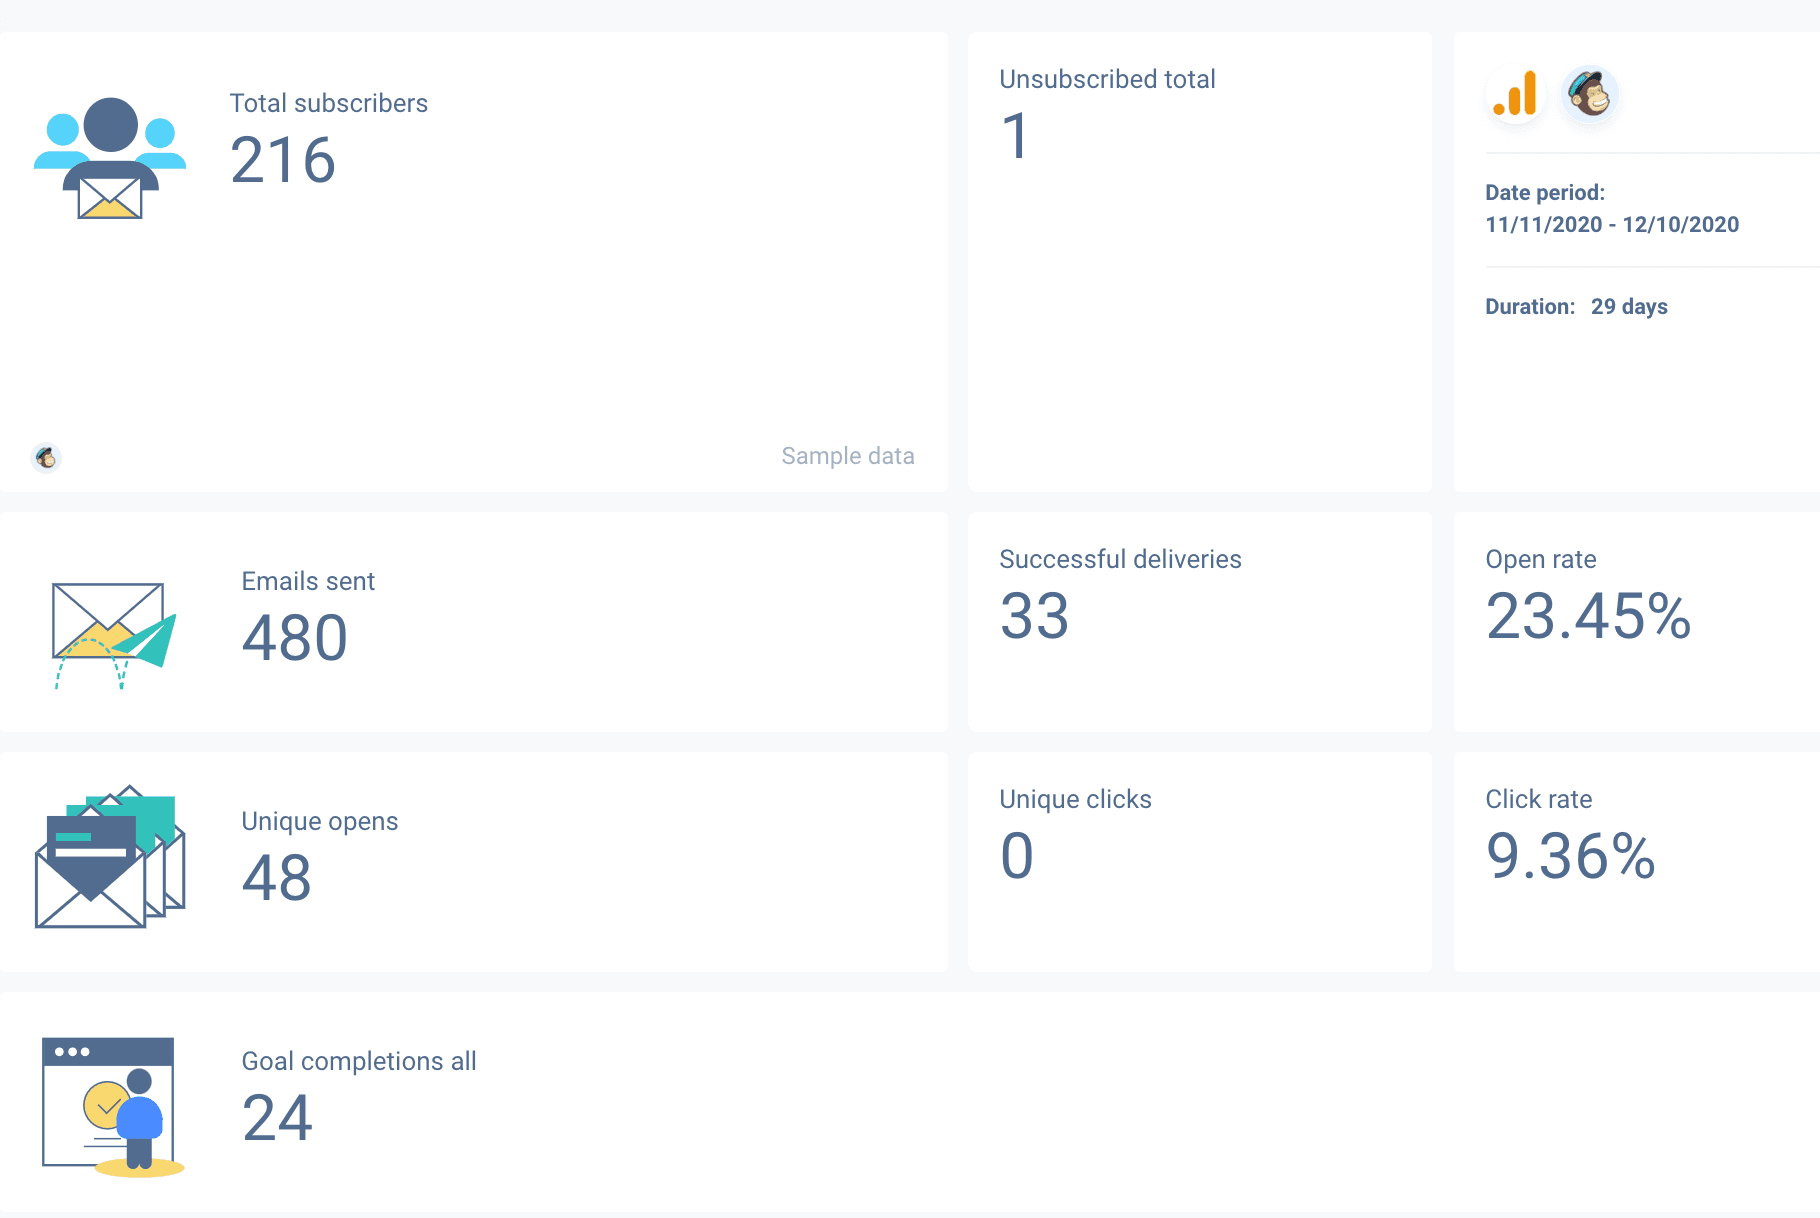
This portion contains compiled metrics of all MailChimp campaigns you’ve launched during a selected period. These are big-picture metrics that generalize the performance of email lead generation and marketing campaigns.
Make sure you also provide an option to compare current performance results against previous reporting periods.
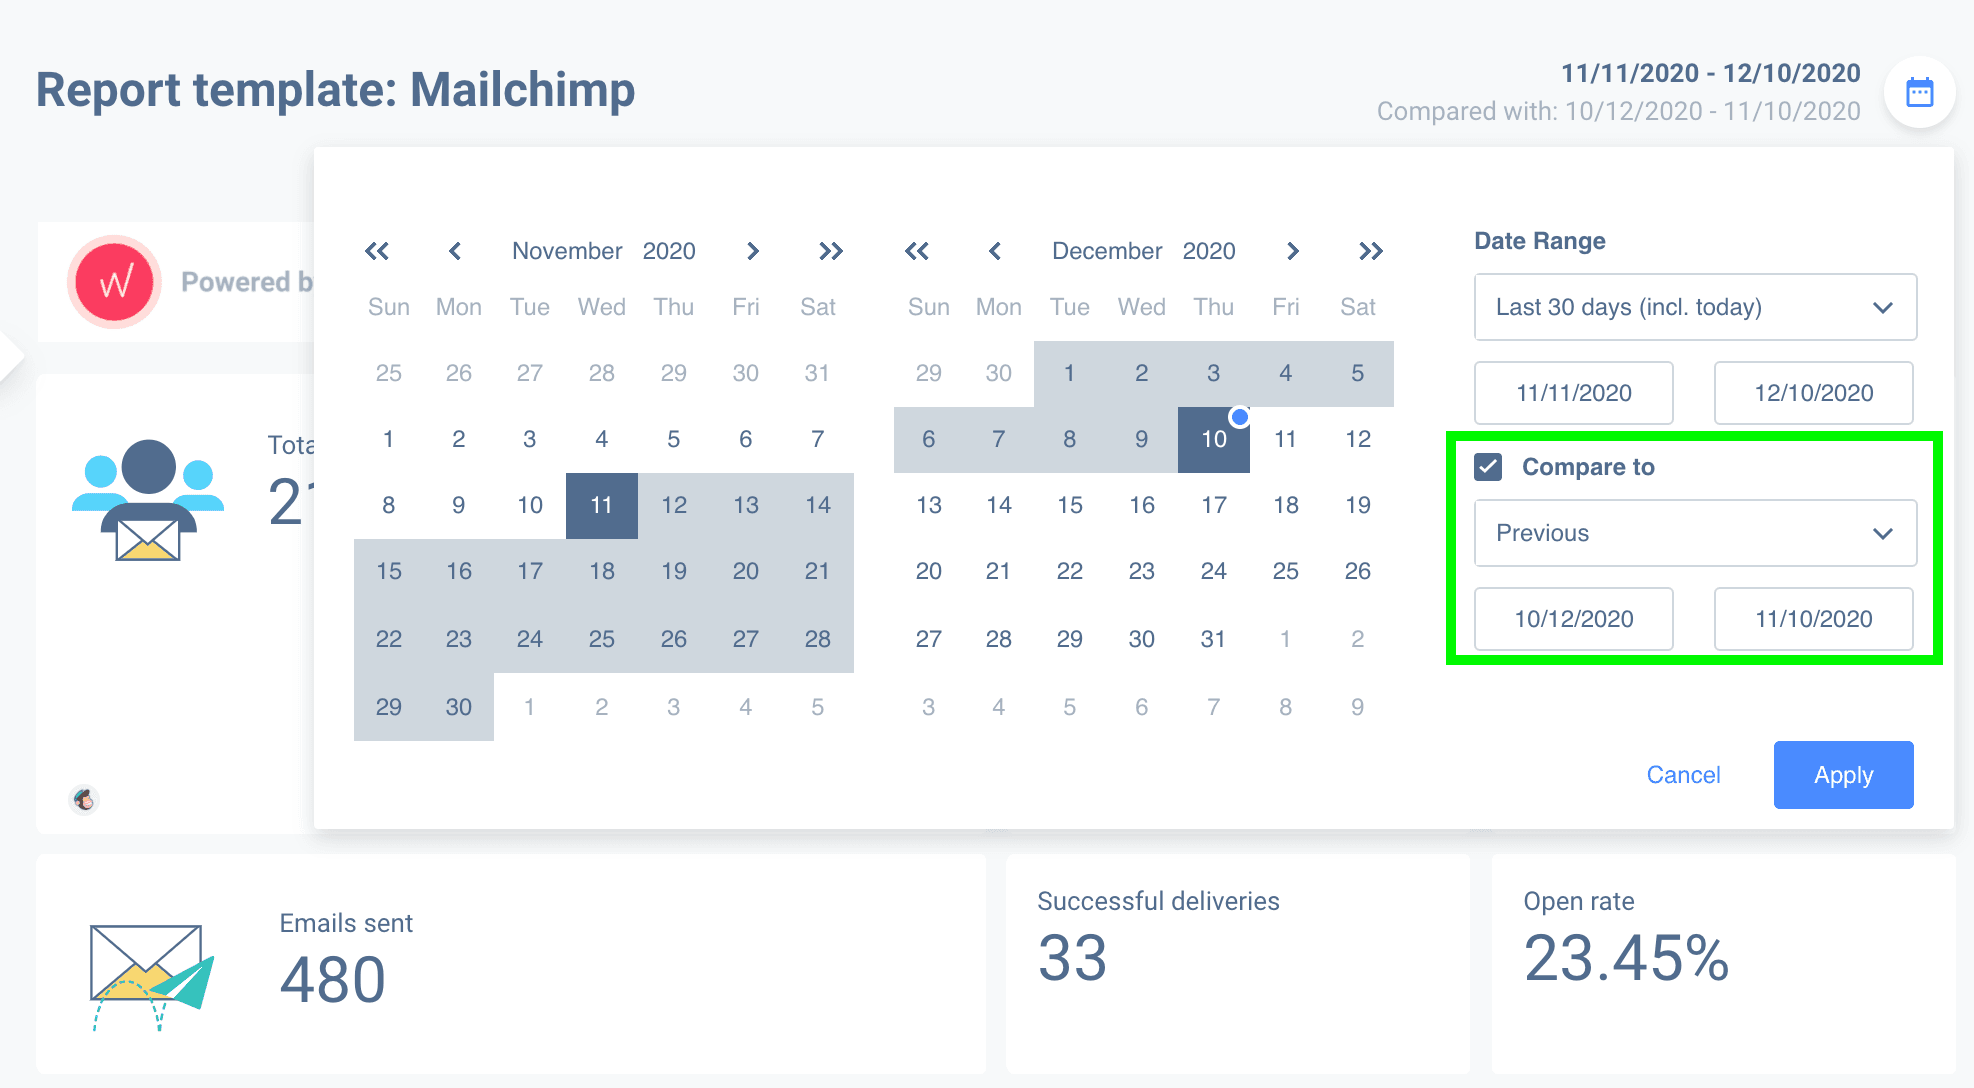
It helps you and your client (or an executive) understand performance metrics and their development throughout multiple reporting periods. Is your current strategy performing better than what you’ve done in the past? This data is paramount to a complete MailChimp report.
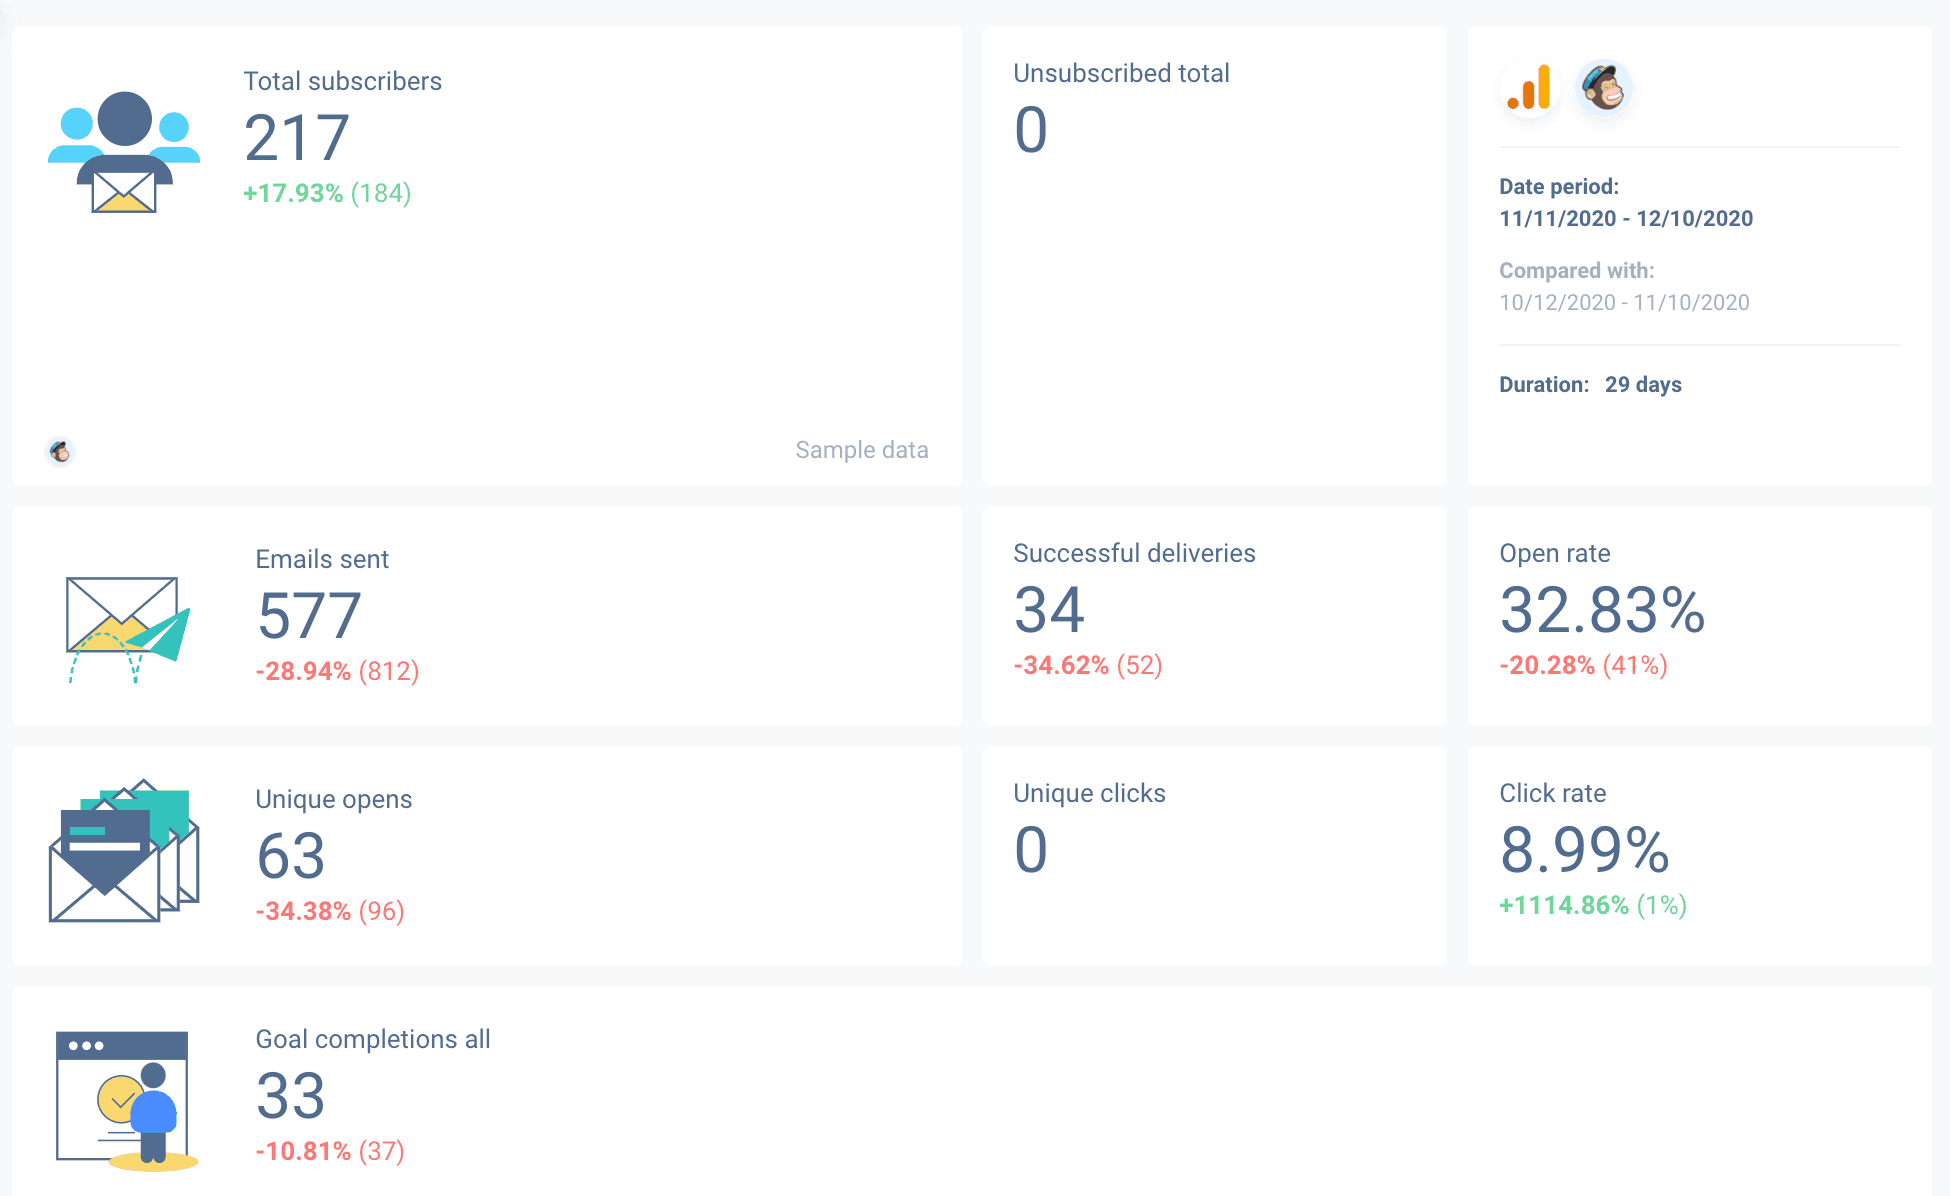
In our example above, the growth % along with real numbers are all clearly labeled under the current metrics.
Now let’s dwell deeper into individual email marketing campaigns.
Assess specific campaign performance
Not all of your MailChimp campaigns will be created equally – they all have their nuances and perform differently. In addition to the big-picture, aggregated data, it’s good to break down individual campaigns’ performance within the report.
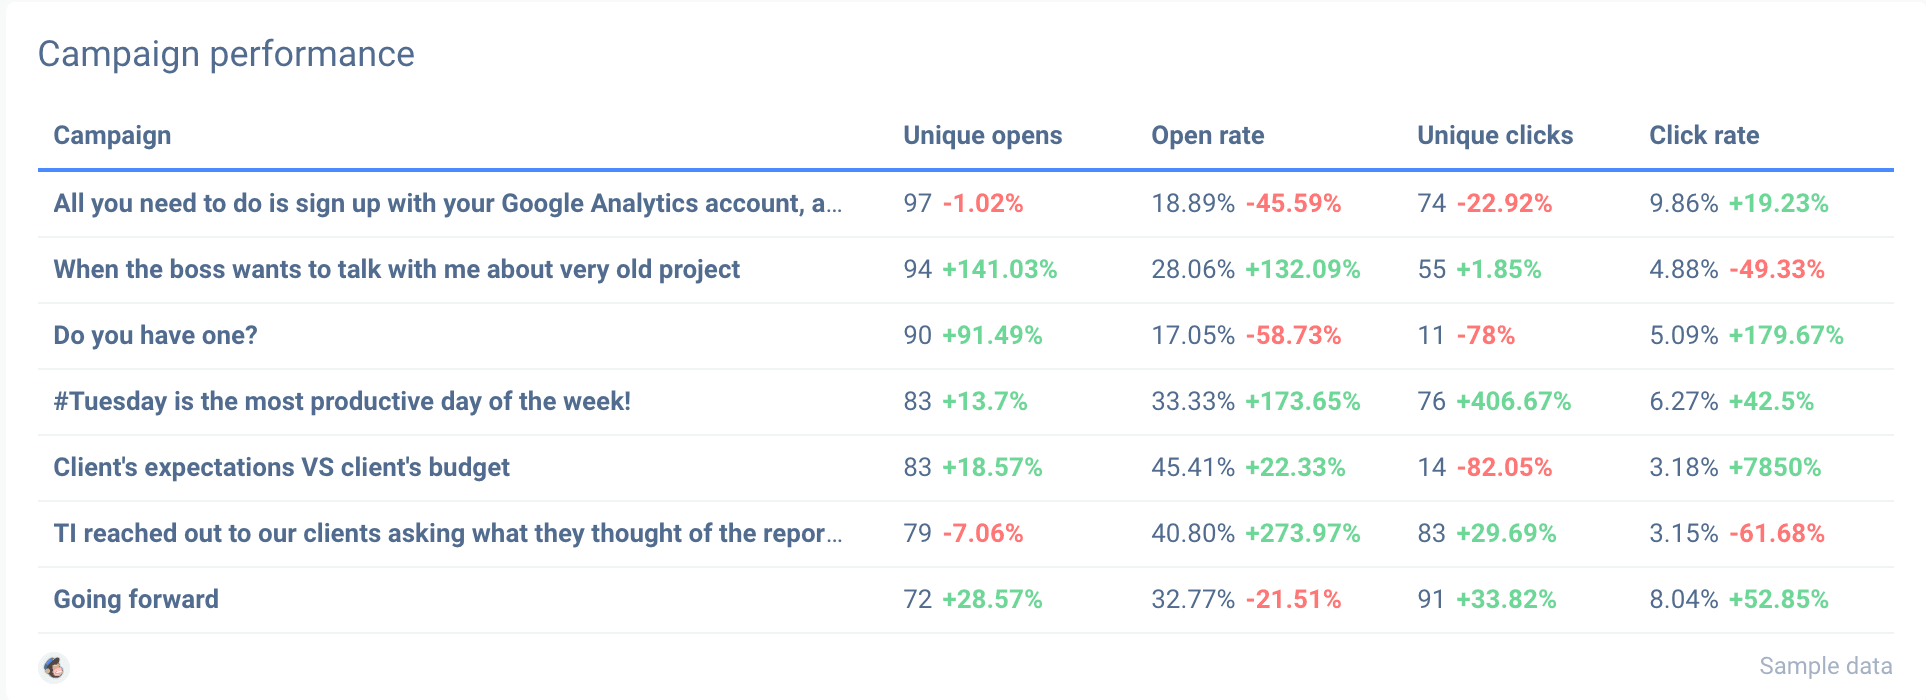
This data is relevant to you as an email marketing manager and gives valuable insights to your client. They may want to look deeper into which campaigns perform best and what budget allocation looks like.
Assessing open rates and CTR of each campaign is detrimental to understanding what emails perform well and which ones don’t. Granular data helps you notice the positive aspects of the emails you send out to your mailing list. It also gives a perspective into what’s the Achilles heel of your campaign.
Double down on strategies that engage your audience and throw the lackluster campaigns that falter to the side.
Data must be accompanied by appropriate context
When it comes to data, context is something worth considering, especially if you’re reporting to clients or executives within your firm.
Context comes from knowing the past and present of your industry and the dynamics of your market. Plus, understanding the context can help you interpret the data better.
Consider the season
For instance, if you’re selling skiing equipment and your campaigns get fewer opportunities in the summer, don’t be discouraged. It’s natural to see seasonal fluctuations in your marketing results – be sure to address these in a report.
Look for anomalies
Be on the lookout for irregularities while you review your reports. Anomalies occur when the metric increases drastically or falls in your results. They will tell you, for example, if your message was resonating with customers.
Anomalies can inform you about outside influences that impact your audience’s actions. A big increase in list signups on your landing page, for example, could be attributed to a virtual video.
Identify potential outliers and the inliers
It’s a good idea to watch for spikes and dips in your results. This way, you can investigate why they happened and predict when they’ll occur again.
Next, search for the outsiders – it may be something that affects your metrics, like a holiday or a big news case.
Make context known within the reports you create
There will be fluctuations in results – that’s part of the marketing gig. When you’re building a report, you may consider adding relevant comments – this way, you can provide insights into unusual performance metrics.
By including context within the MailChimp report, you can avoid unnecessary calls and disturbances from clients or executives.
A reporting tool with customization options and premade templates is essential
Insightful client-centric reports tell the story of your progress via visuals and precise information.
Great internal reports help your team monitor the current situation and quickly find any shortcomings within your processes.
You are welcome to try out our pre-built MailChimp report template for free. We’ve already built the report for you: all you need to do is connect your MailChimp account, and your data will be extracted automatically. Enjoy!
Published on Jan 21 2021
WRITTEN BY
Mindaugas SkurvydasMindaugas is the SEO specialist at Whatagraph with experience in driving organic traffic and improving SERP visibility for industries like B2B martech, B2B and B2C finance. He loves to be at the edge of new developments by maintaining numerous contacts with other publishers in the SaaS niche. When he’s not writing he’s pushing our technical SEO strategies into implementation.