How to Create a Killer Dashboard With Google Sheets Data [+ Template]
Google Sheets is a spreadsheet application similar to Microsoft Excel but part of the Google Drive package that you can use to track and store all kinds of business data. One way to draw meaningful insights from spreadsheet data is to create a Google Sheets dashboard.
In this guide, we explain how to create a sweeping dashboard using Google Sheets data and why doing it in Google Sheets may not be the best idea.

Mar 22 2023●5 min read


![How to Create a Killer Dashboard With Google Sheets Data [+ Template]](https://media.whatagraph.com/googsheedas_d72ba38114.png?width=992)
What is a Google Sheets dashboard?
A Google Sheets dashboard is a tab you can create in a Google Sheets document to quickly display key information about your project or campaign. When you collect information through Sheets, you can create different graphics and charts to visualize your information. So instead of switching between different pages, you can place them all on the same page, summed up in a dashboard of key metrics.
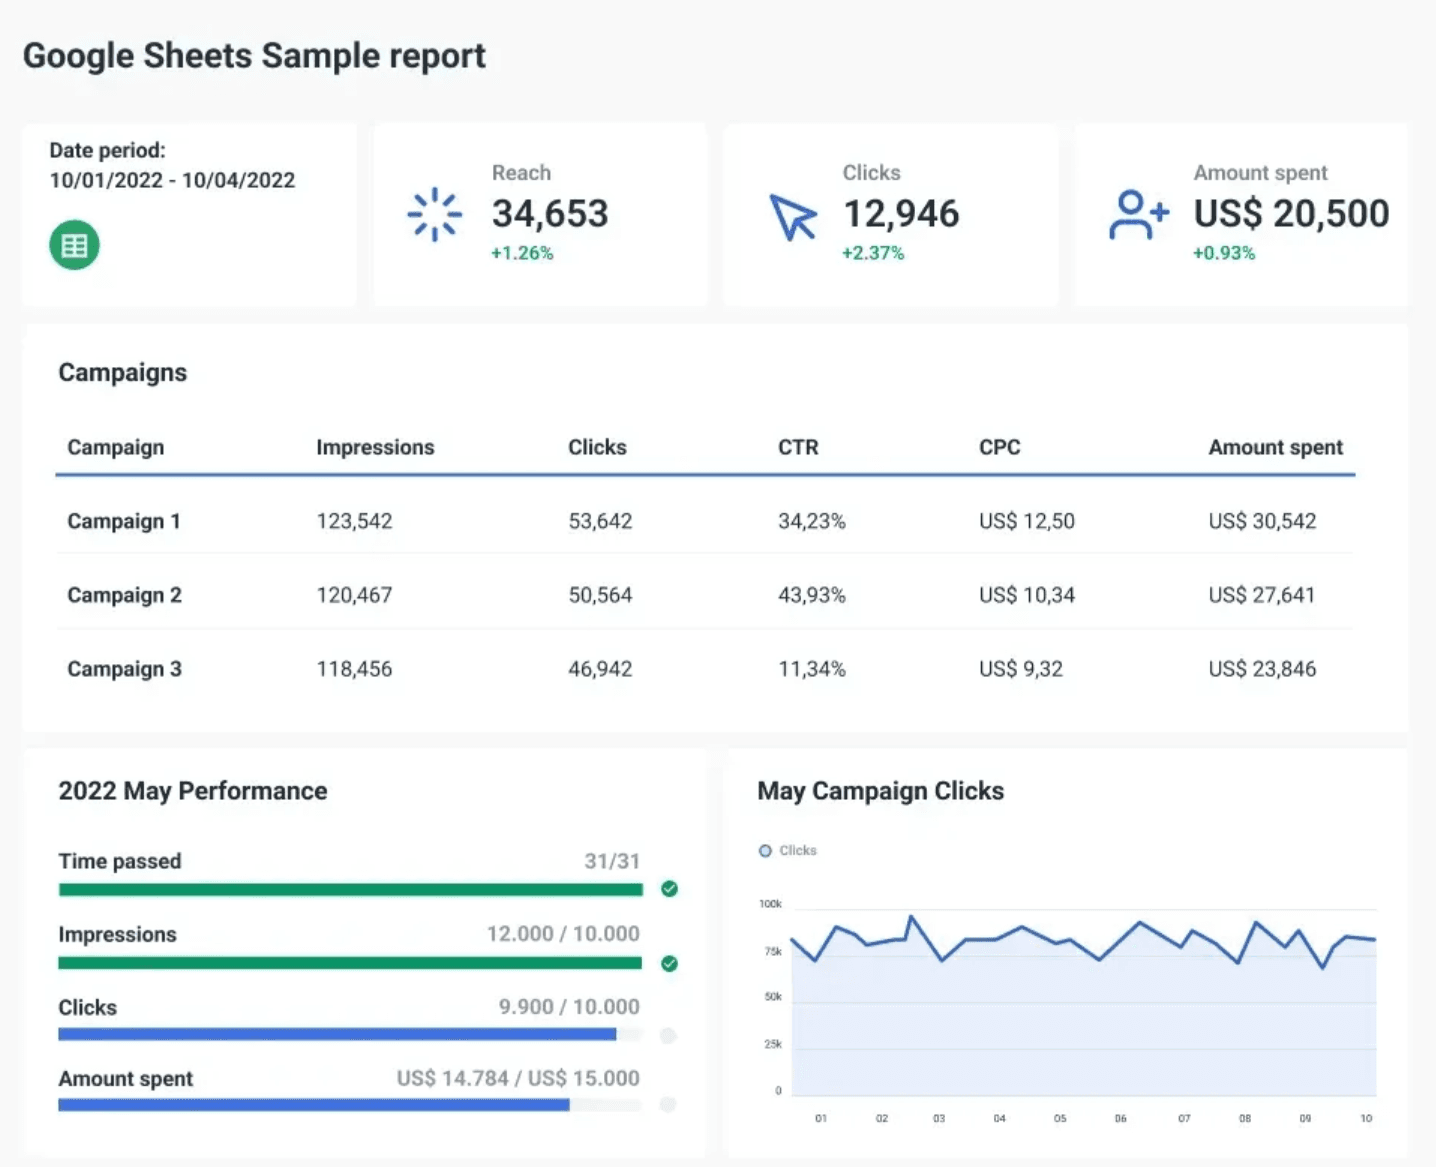
For example, a business may use several spreadsheets to track information related to sales and marketing. The dashboard can include graphs that visualize the number of sales in the current fiscal year, which salesperson closed the most sales, which marketing channels perform the best, etc.
5 reasons why creating dashboards in Google Sheets is not a great idea
1. Lack of proper visualizations
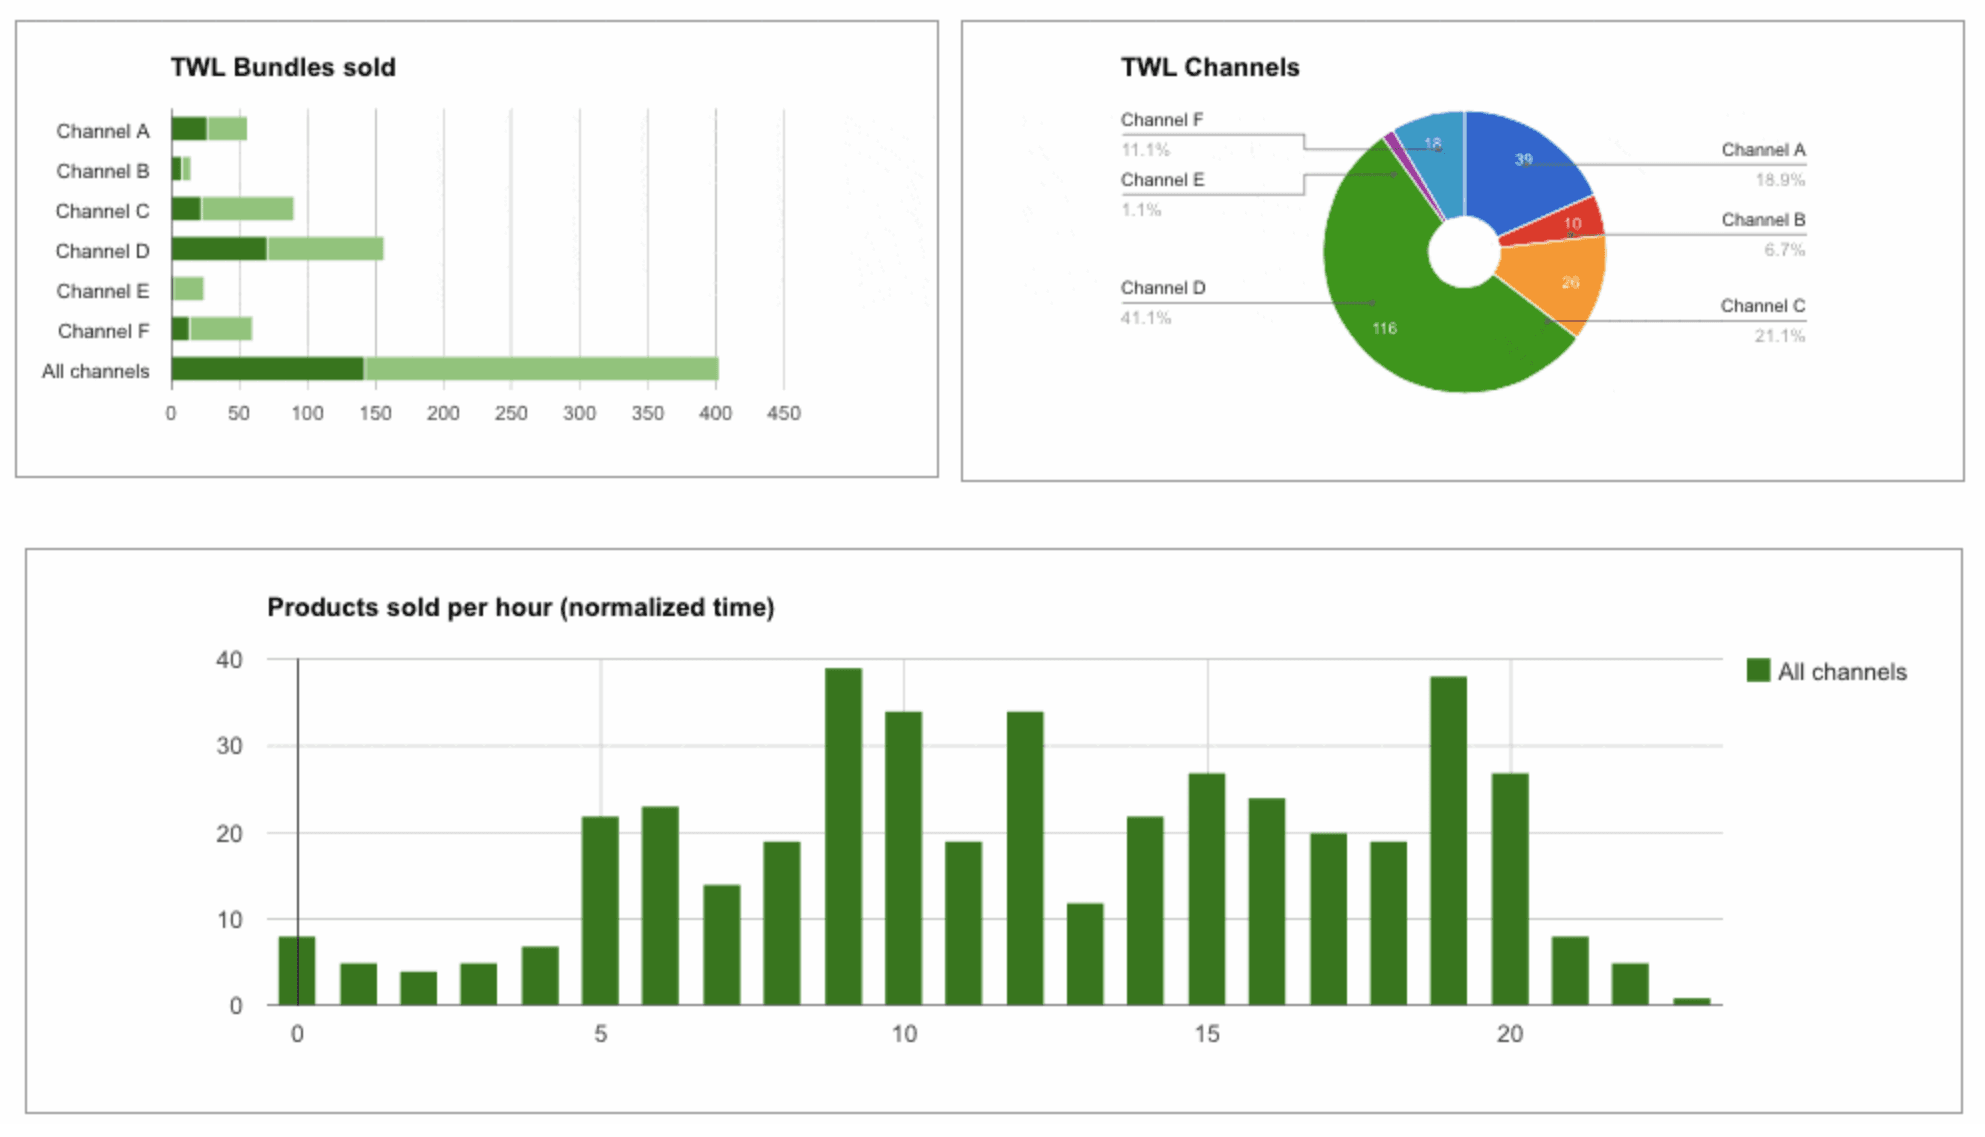
The ability to visualize data is essential for anyone working in marketing. Sure, Google Sheets has data visualization ability, but it’s very limited by today’s standards. You can create a pie chart, a line chart, or a column chart, but these look plain and simple. Not what you’d want for a presentation that should knock your clients off their feet.
Then there’s the issue of insights. Since a spreadsheet takes all of your data into account, an important bit of information can remain hidden or not entirely interpreted. For marketers whose job is to know the customers and market inside out, such inaccuracy is unacceptable.
2. Lack of real-time data updates
Collecting data in real-time is among the most important advantages of any marketing agency today. Knowing what your customers want at any given time is not just a nice thing to have — it’s a must.
Achieving that with an ongoing stream of data and a spreadsheet is hard to imagine. If you want to update a spreadsheet, you need to do it manually, and manual data collection and a business driven by data somehow don’t match up.
3. No way to automate the dashboard delivery
Whenever you want to send the dashboard to your clients, it’s manual work all the way. You need to export it as a .pdf and email it as an attachment.
There’s no way to automate the delivery, so you need to keep a separate calendar with reminders of which dashboard to send to which client at what time interval.
Another technicality to worry about instead of focusing on your core business.
4. No good way to customize your dashboard
Google Sheets has a limited gallery of graph and chart types and a limited way of arranging them. You need to merge existing cells to create shapes and text boxes in the size you need, which doesn’t leave much for creativity.
Also, there are no widgets that you can use to present the key metrics.
Try to change the color scheme of the Google Sheets dashboard. Good luck with that. At best, you can fill in the tables with different colors, but that’s it.
You can probably add your or your client’s logo, but again you’d have to merge adjacent cells to display the image right.
5. No native integration with business systems
If you want to connect the spreadsheets to other systems you use, you better hope there’s an integration with Salesforce or a similar tool. If there isn’t, you have to transfer the data over to other systems manually.
Because of this lack of integration, customers and prospects might get redundant information or none at all. Neither is good for sales and the growth of our business.
So what are your options?
To export your Google Sheets data to a reporting tool and create a much more engaging and inclusive dashboard using Whatagraph’s Google Sheets dashboard template.
Whatagraph’s Google Sheets Dashboard Template
Spreadsheets are far from ideal for managing large volumes of data, let alone visualizing this data for actionable insights.
It makes much more sense to export and migrate your data to Whatagraph and automate your reporting.
Our Google Sheets Dashboard template can help you present your data in a format that clients can easily understand.
All the value widgets, tables, and graphs are already inside. Use them as they are or customize the dashboard with visual elements of your choice.
Let’s show you how to visualize your Google Sheets data using our template.
How to create a dashboard with Google Sheets data in 4 steps in Whatagraph
Step 1: Start with your Google Sheets data
The first thing you need to do is make sure you have enough raw data in your Google spreadsheet before you start building a dashboard. There are a few ways you can import data into your spreadsheet:
- Using IMPORT functions: If the data you want to import is already accessible, you can use Google Sheets IMPORT functions to complete the task. Using these functions, you can import a wide range of data types, including CSV, TS, XML, RSS, etc. Just keep in mind that for this method to work, the data you want to import must be publicly available first.
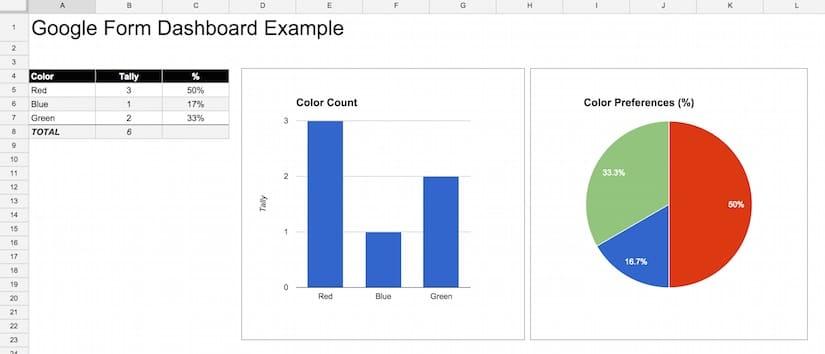
- Using Google Forms: Google Forms are great for importing an abundance of data to your spreadsheet. By using the IMPORTRANGE function, you will be able to quickly transfer the data from Google Forms to Google Sheets. If you don’t have Google Forms and need to create a new one, connect it to a spreadsheet so data can be stored separately and you don’t risk losing it.
- Using an external source: This method requires a bit of technical knowledge. Look for API connectors add-ons in the Google Workspace Marketing and import the data to your Google Sheets by using the API. However, if the add-on gets updated, this might disrupt your dashboard, and you’ll have to start building it from scratch.
Step 2: Move the data to Whatagraph
Analyzing large amounts of spreadsheets data can be time-consuming, especially if you are managing multiple clients and data sources.
Google Sheets is a good choice if you need to handle a large dataset on a one-time basis. For example, if you’ve exported all traffic data for your website and want to find pages that saw the most traffic.
However, if you want to track a large volume of data over time, you should export and migrate your Google Sheets data to a dedicated data pipeline like Whatagraph.
With Whatagraph, you can say goodbye to manual data entry. Just connect your Google Sheets to Whatagraph, and the data fills in and updates automatically in the future.
Apart from Google Sheets data, with Whatagraph, you can integrate data and visualize KPIs from a range of social media platforms, web analytics, SEO, PPC, and eCommerce apps through all-inclusive custom dashboards.
Step 3: Visualize your data
Now you’re ready to visualize your Google Sheets data in Whatagraph. To create a dynamic dashboard with Google Sheets data, you need to
1. Open Whatagraph and click Create new in the top-right corner.
2. Choose to Create from template.
3. Scroll down to find the Google Sheets dashboard template and click on it.
4. Now you have a Google Sheets dashboard with basic metrics.
5. To add a Google Sheets source, click on the drop-down menu under Actions > Manage Data Sources, and then Browse More Sources.
6. Select Google Sheets and pick one of the available accounts.
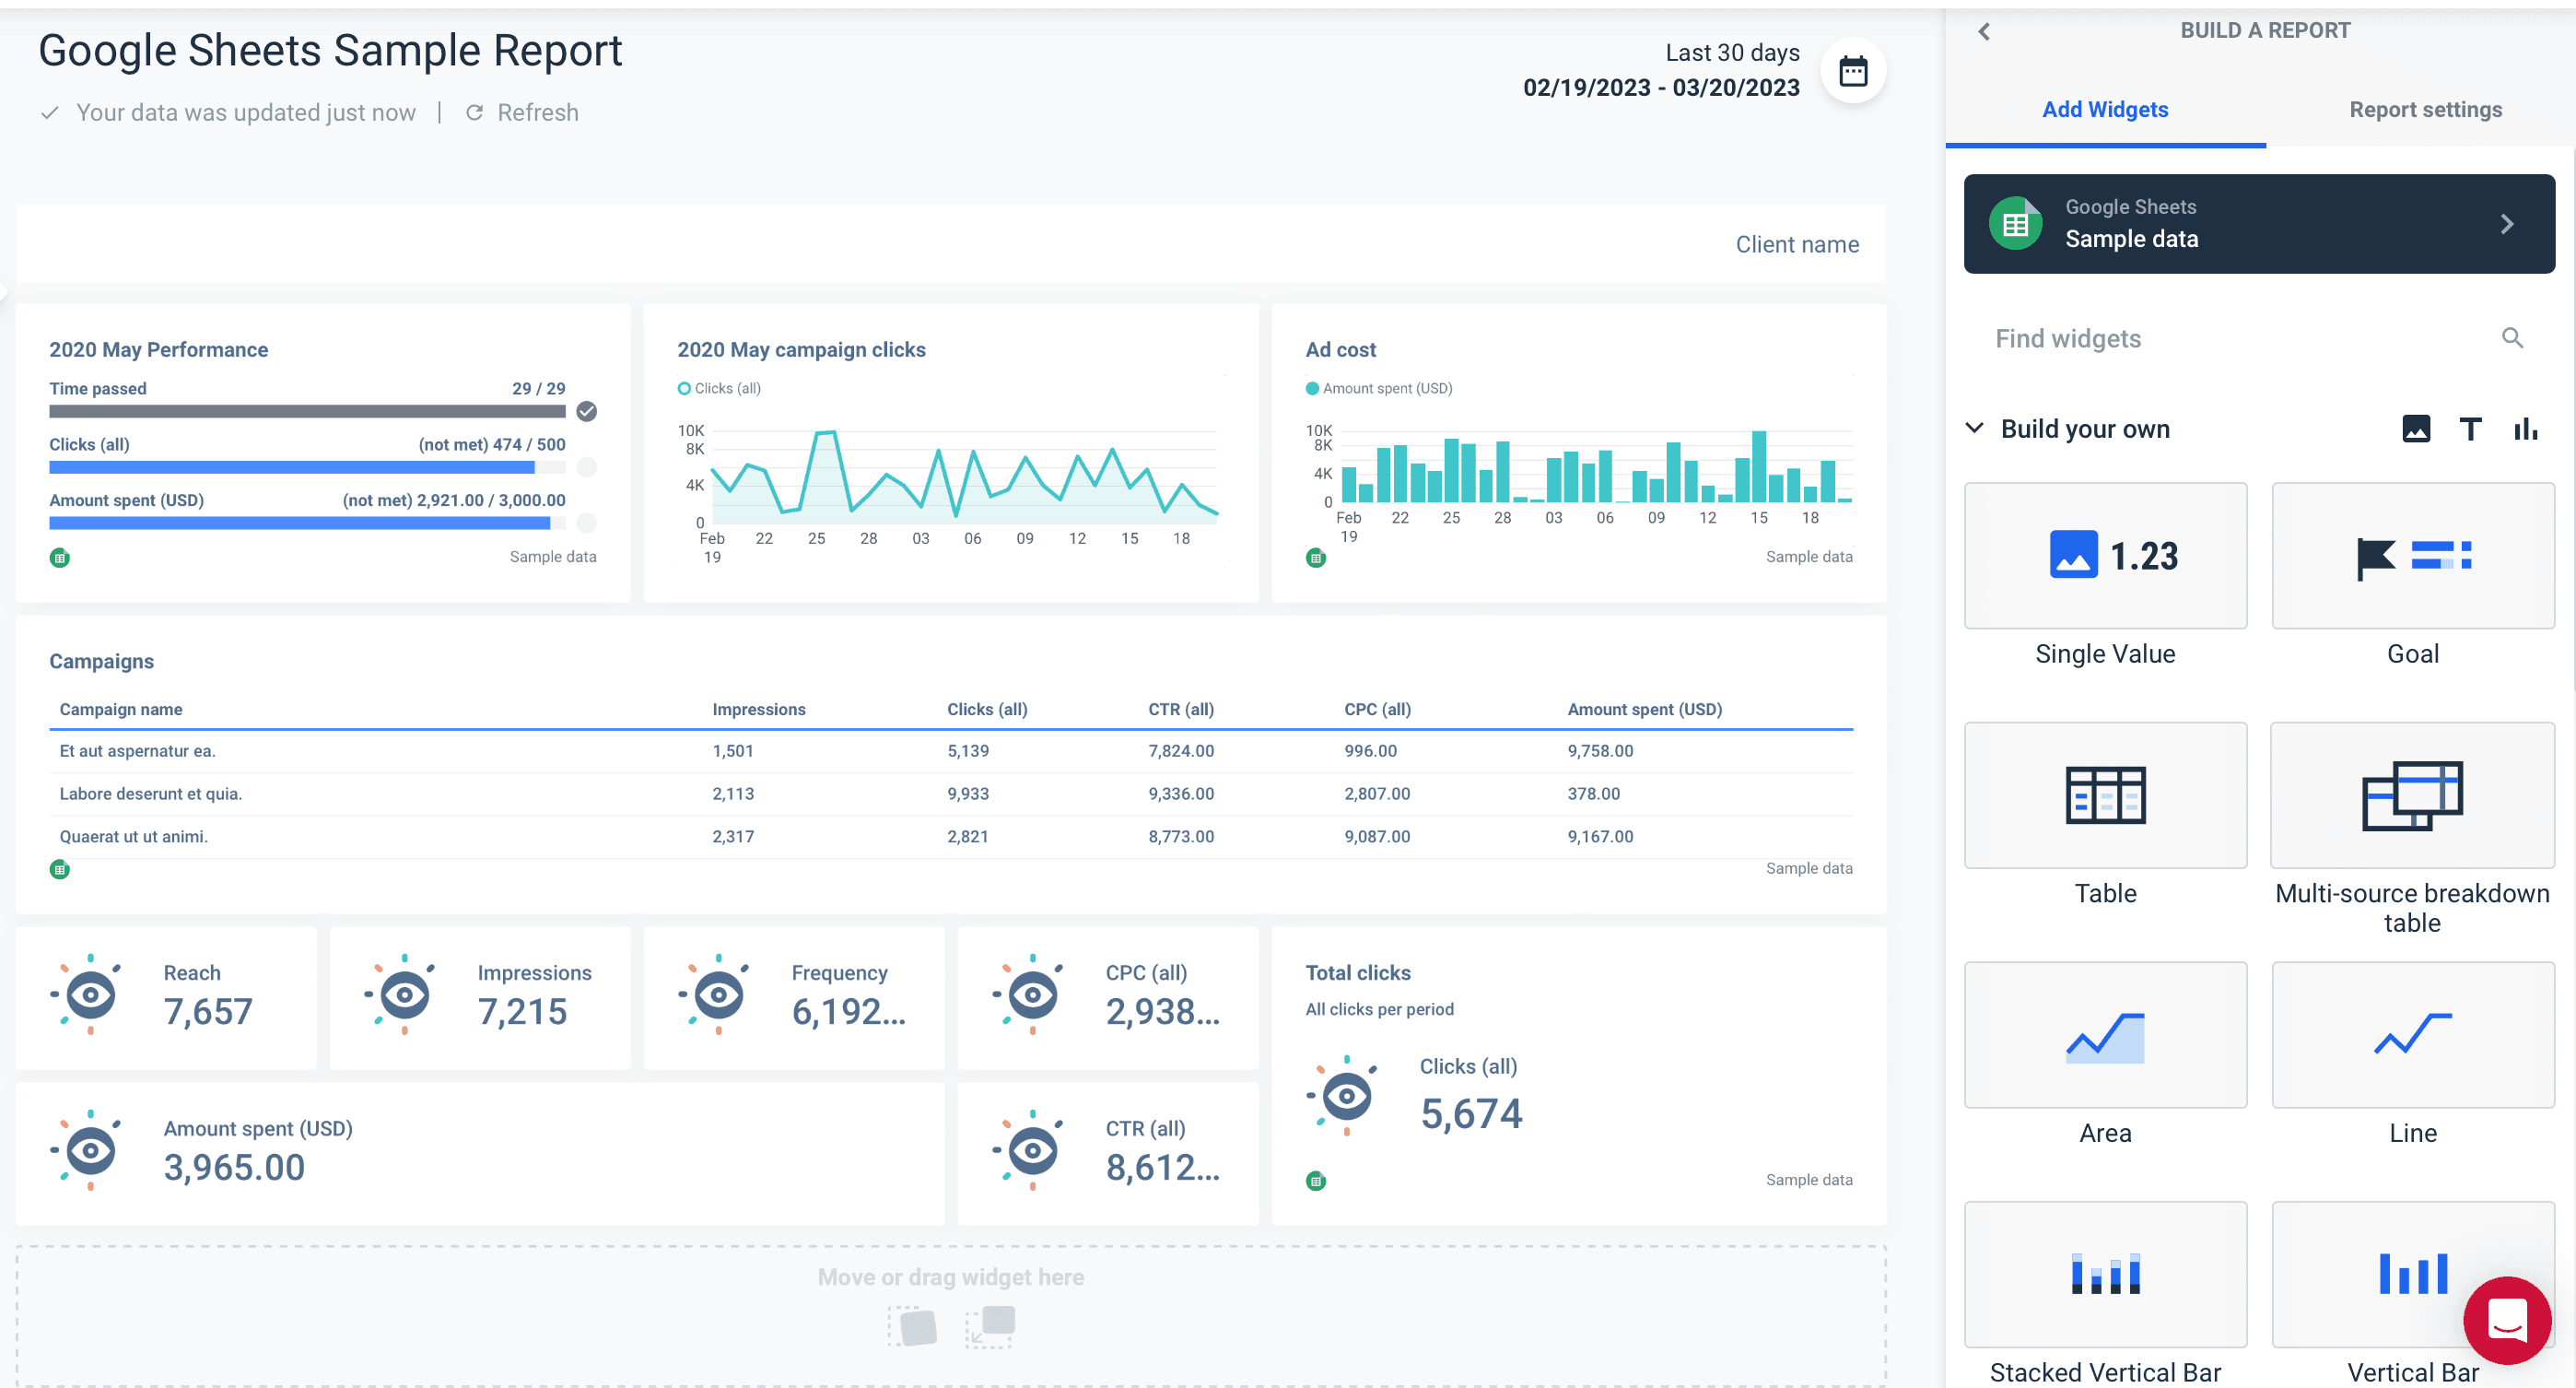
Step 4: Customize your dashboard
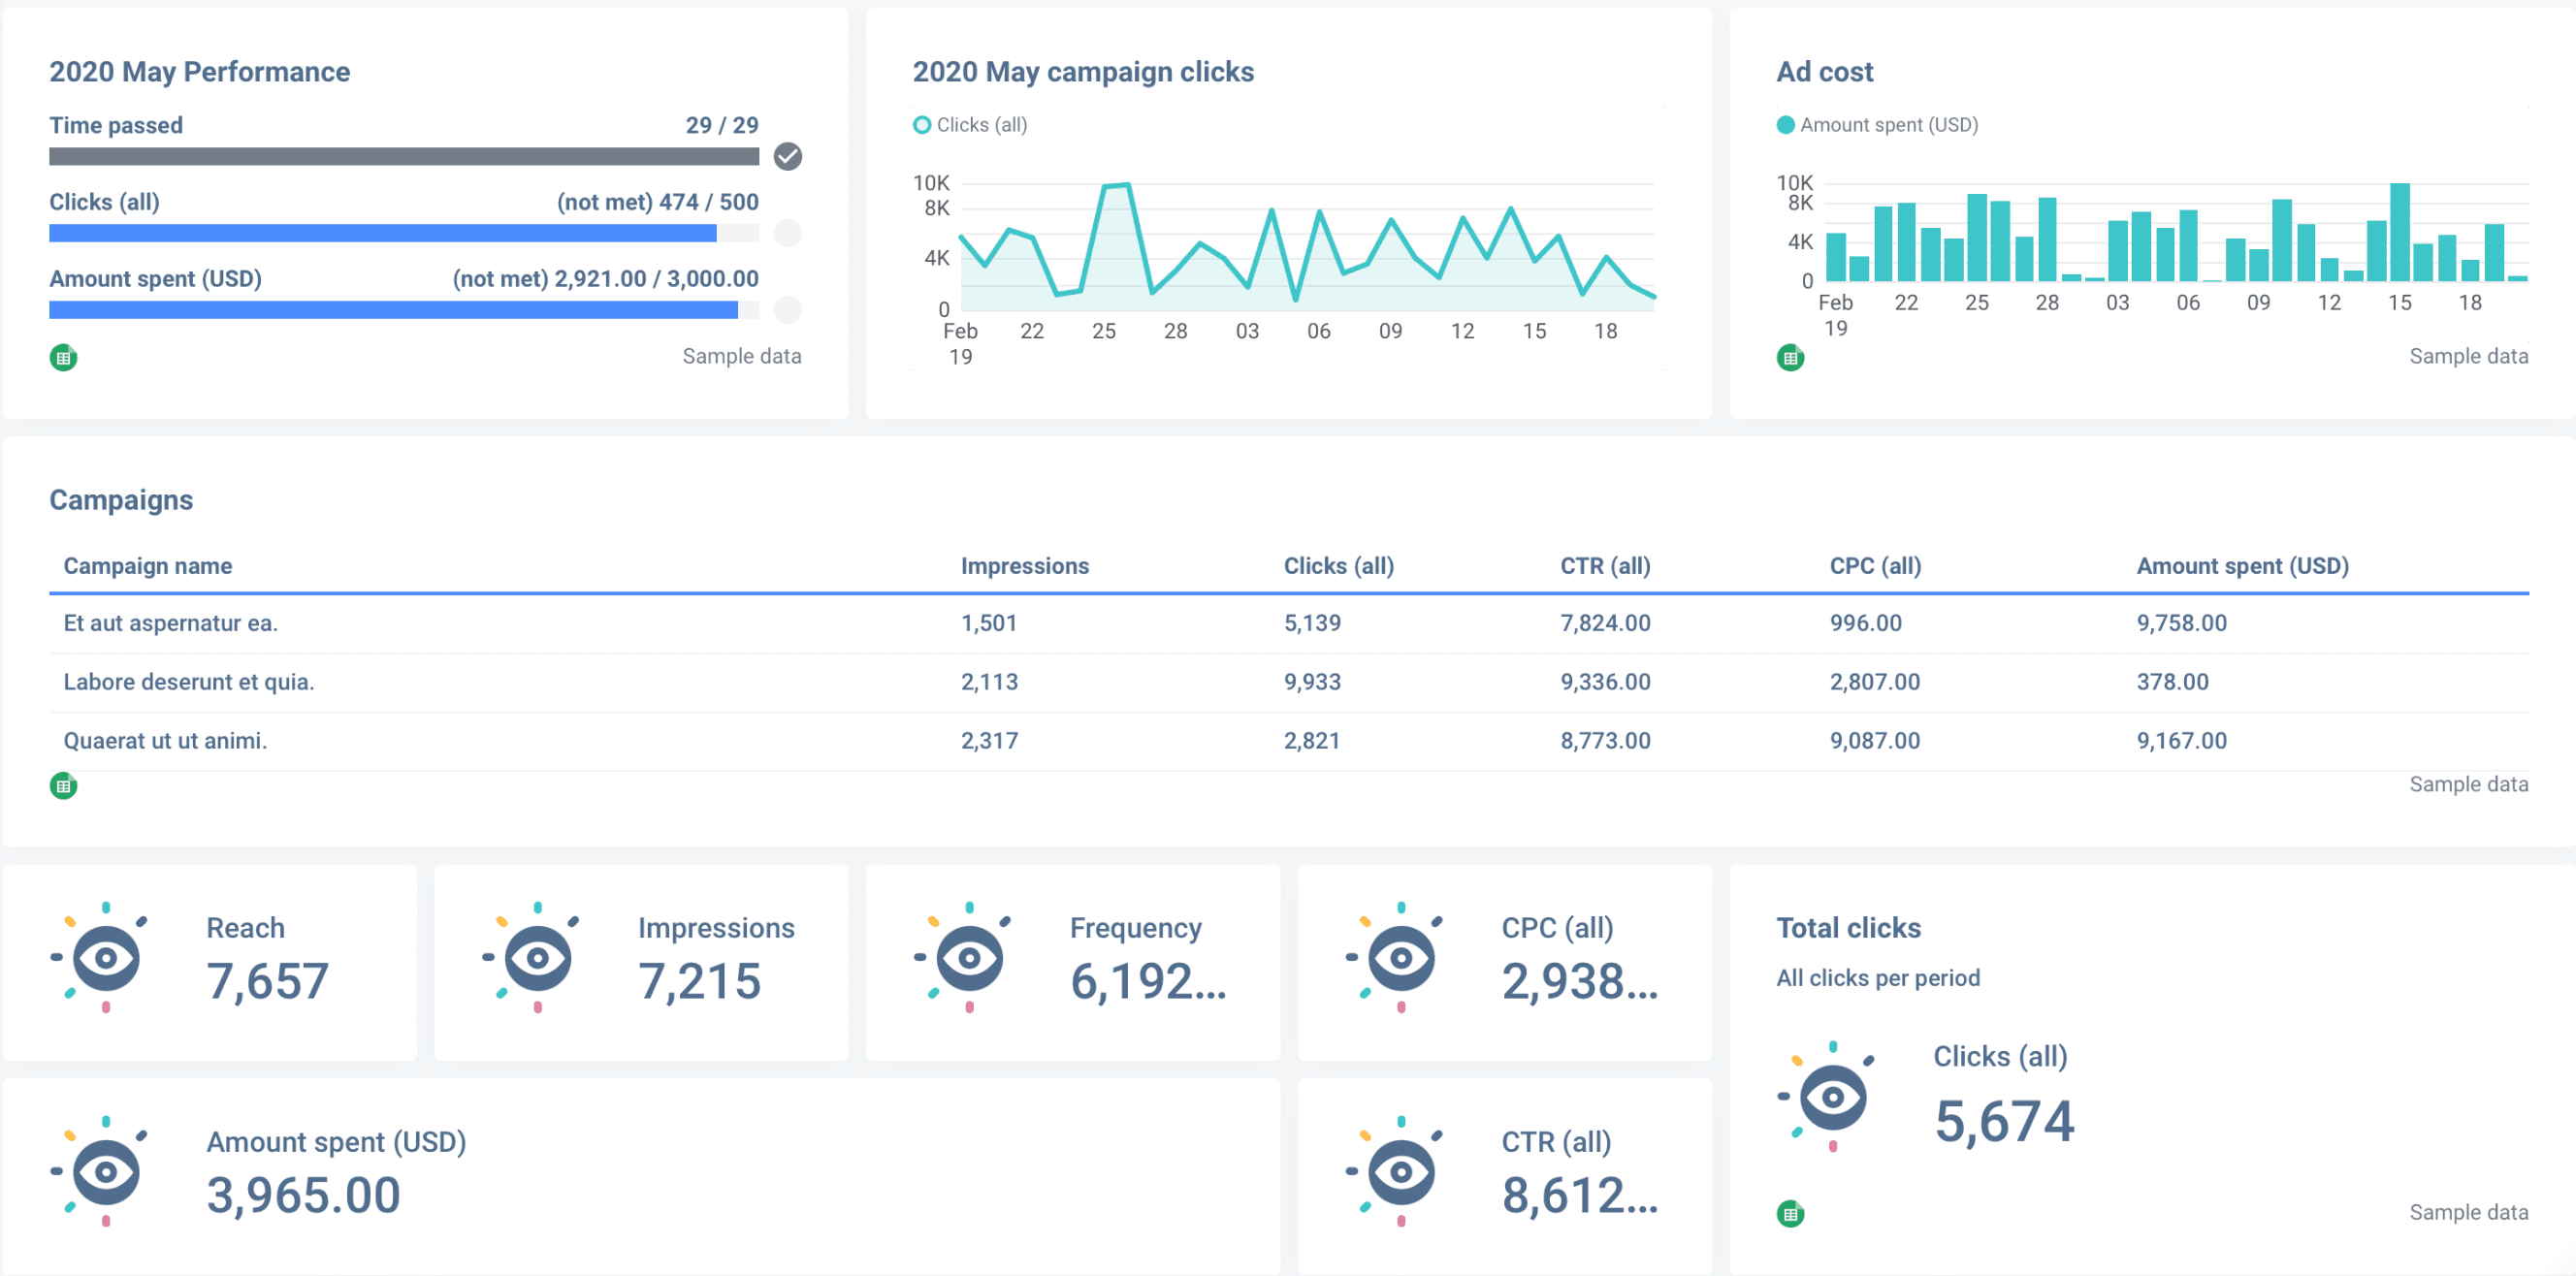
When your Google Sheets dashboard is done, you can customize it to your client’s preferences. Unlike Google Sheets, where you have few customization options, Whatagraph dashboards allow you to remove and add new visualization forms.
This includes single-value and goal widgets, multi-source breakdown tables, area charts, donut charts, stacked horizontal and vertical bar charts, funnels, and even a report calendar, while any images you upload fit seamlessly into the dashboard layout.
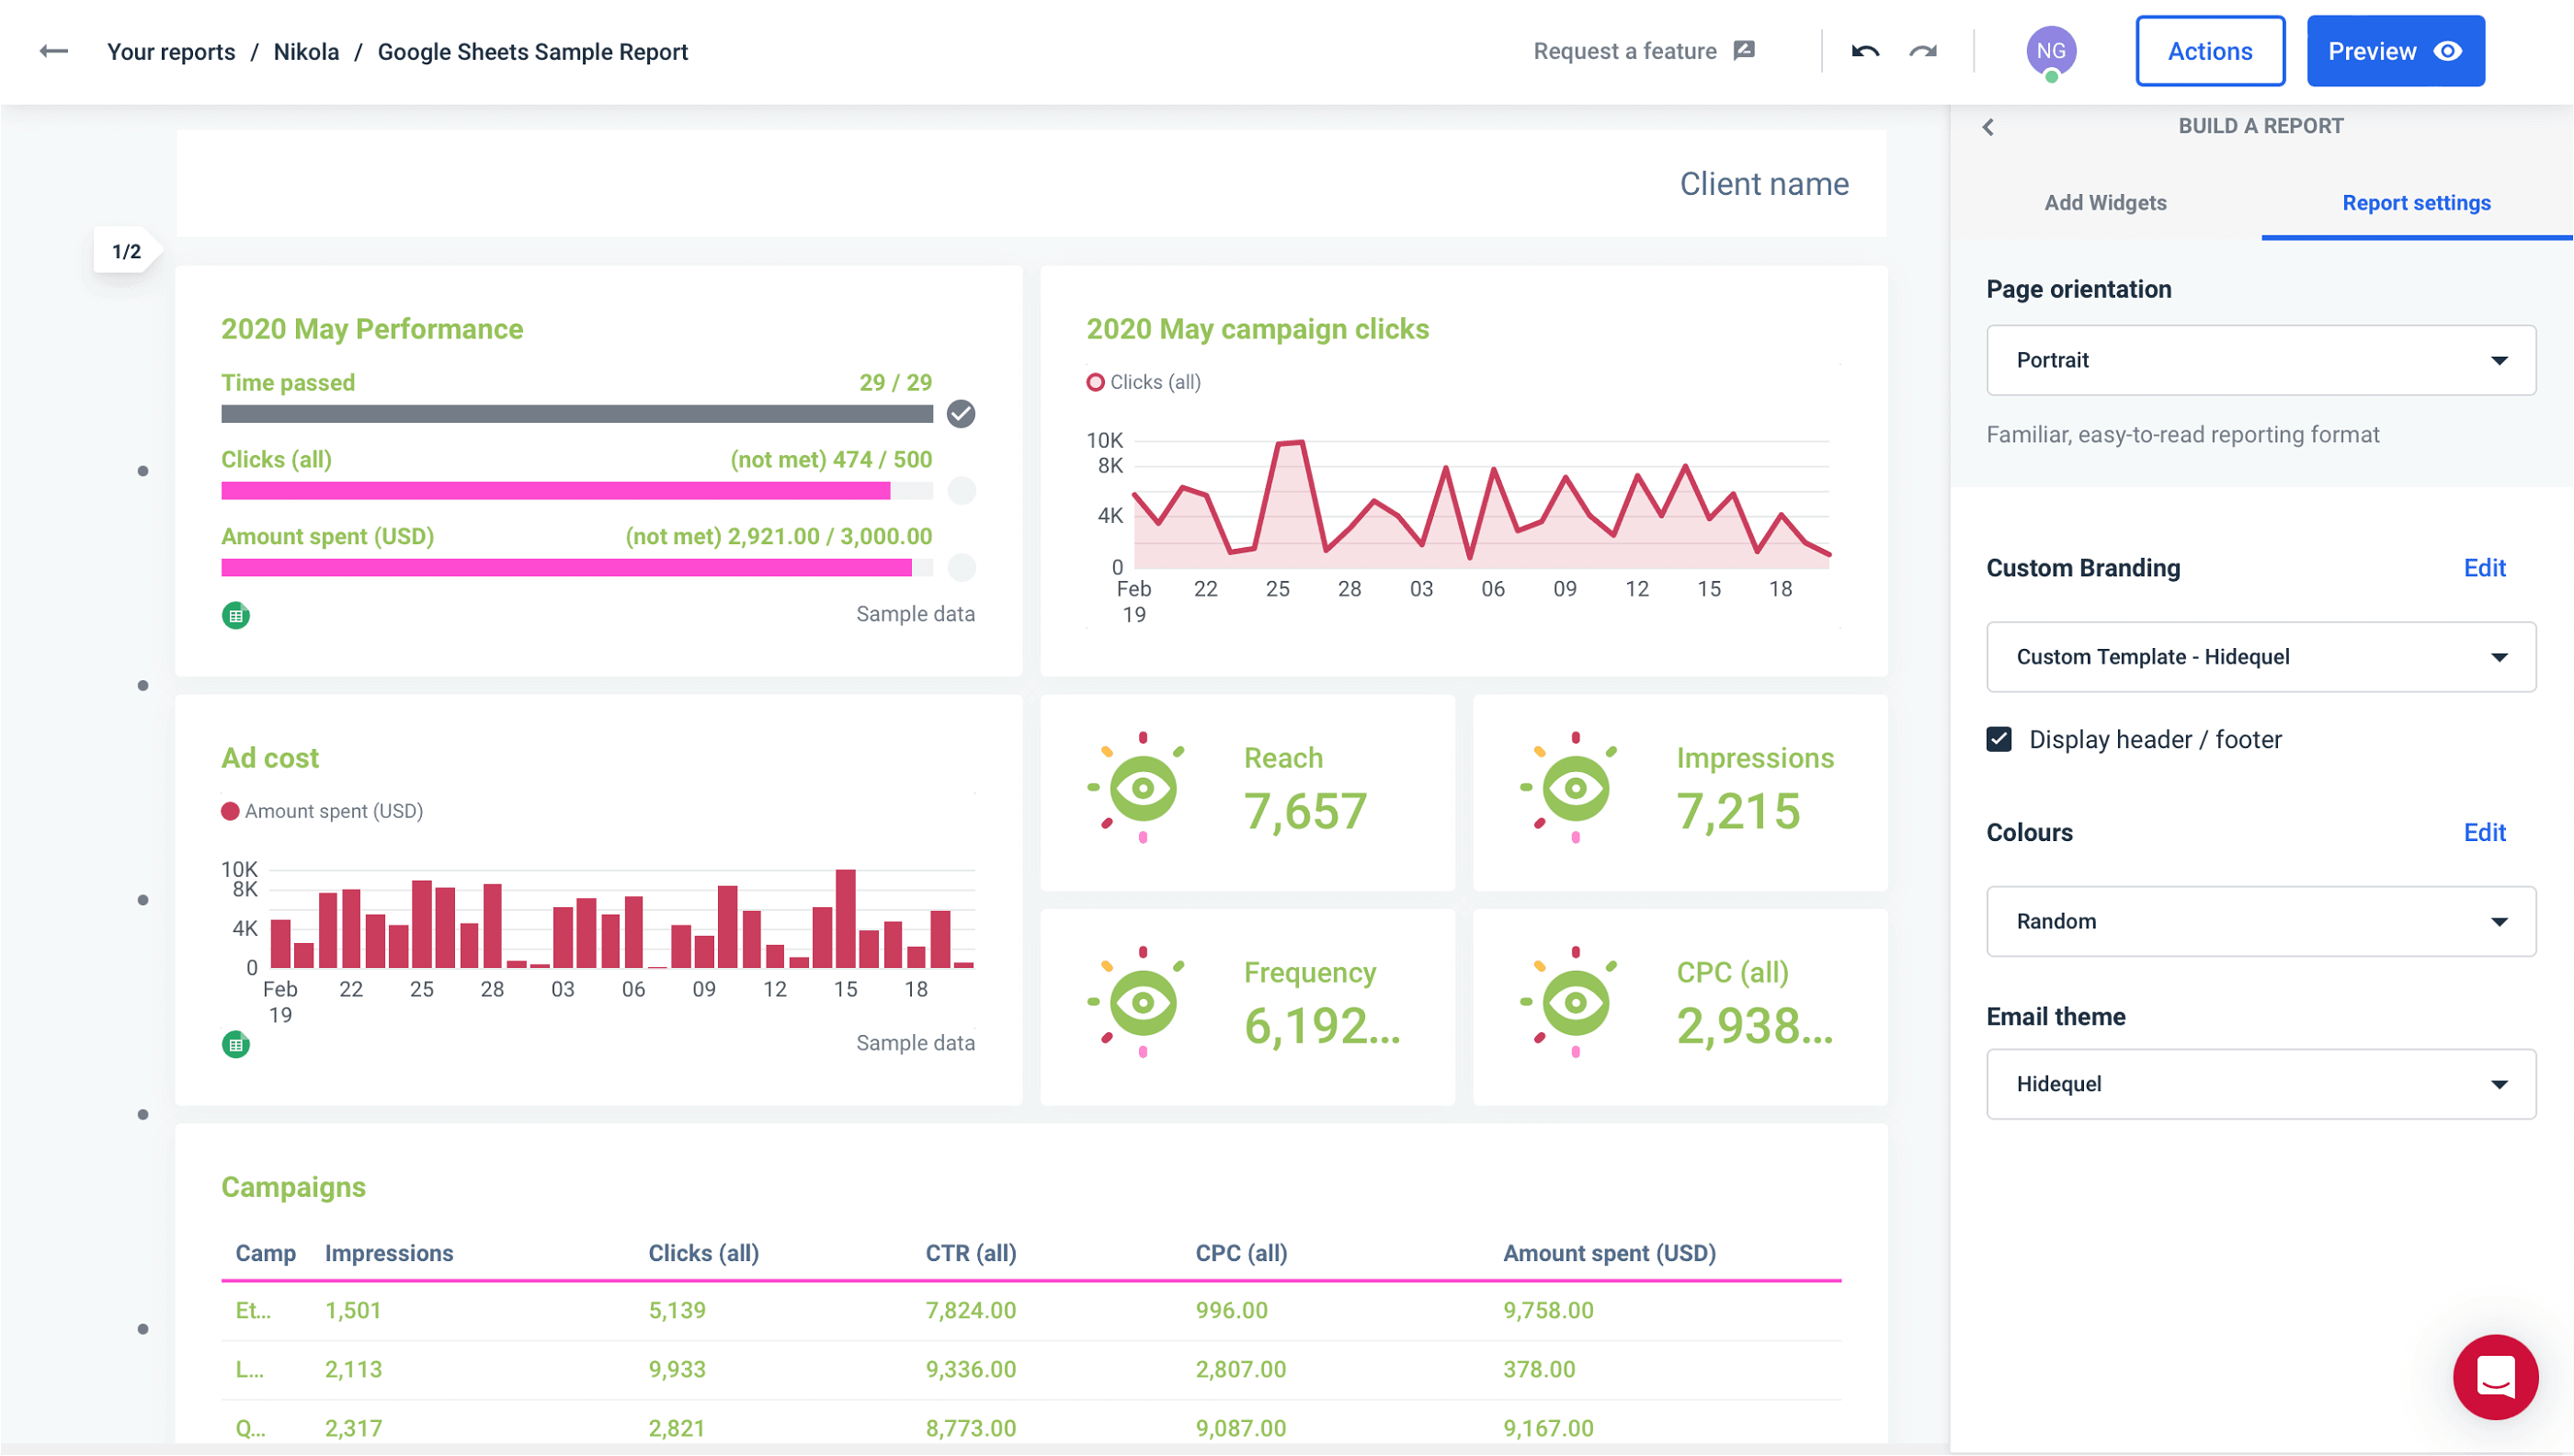
Apart from these drag-and-drop widgets, you can go ahead and customize the dashboard color scheme, so it better reflects your or your client’s branding. Not something you can do in spreadsheets.
And if you want to make it look even more professional, you can white-label your dashboard and remove Whatagraph branding altogether.
Conclusion
Google Sheets is still a popular way of tracking business data, but when it comes to visualization, it can’t stand against modern reporting tools like Whatagraph.
So instead of creating a dashboard in Google Sheets that looks as if it came straight from the 90s, export your GS data to Whatagraph and use the tool’s native visualization to showcase your KPIs.
When compared to Google Sheets, Whatagraph offers an unparalleled degree of dashboard customization and flexibility.
And the best thing is that you don’t need to migrate Google Sheets data every time manually. Connect your spreadsheets once, and the data gets refreshed automatically every hour.
Don’t bother with Google Sheet’s basic visualization.
Grab Whatagraph’s Google Sheets dashboard template and tell us which dashboard you prefer — the one made in Google Sheets or the one you created in Whatagraph.
Published on Mar 22 2023
WRITTEN BY
Nikola GemesNikola is a content marketer at Whatagraph with extensive writing experience in SaaS and tech niches. With a background in content management apps and composable architectures, it's his job to educate readers about the latest developments in the world of marketing data, data warehousing, headless architectures, and federated content platforms.