How to Create Local Marketing Reports for Clients?
Your local marketing game has advanced. You already use many local SEO tools to drive new local searches, traffic, and sales. Now, you need a way to track all the data from those tools, so you can streamline your local advertising efforts.
What you need now is an in-depth local marketing report that will help you pinpoint your client’s message to local audiences.

Mar 22 2023●5 min read


What is a local marketing report?
A local marketing report is a type of digital marketing report that includes local marketing capabilities and performance. The data is ranged for a specific location that coincides with the client’s physical store, warehouse, or customers.
Local marketing reports can showcase the performance of one or several locations with the primary goal of displaying the state of local marketing accurately and helping marketers assess and improve their marketing strategy based on local performance.
3 reasons to create local marketing reports
Local marketing strategy doesn’t only help marketers win business but also improves customer relationships. Marketers who rely on local marketing reports in leading their local marketing campaigns have a better understanding of their customer needs. This, in return, allows them to deliver those needs and boost customer engagement.
However, local marketing reports can bring you other, less-tangible benefits.
1. Streamlined decision-making
Prior to you running a local marketing campaign for your clients, it’s understandable that you’ve agreed upon the KPIs and defined what the success looks like. This is to make sure there are no surprises about what actions to take based on specific results.
But, as the campaign unfolds, it’s easy to get overwhelmed by the influx of data. Local channel marketing offers plenty of inputs that you can use to measure a campaign’s success, especially if you use different landing pages and ads for different locations.
However, your client may not have the time or expertise to crunch all those numbers and come up with actionable insights.
This is where you come to filter all the available data and surface metrics that are most essential to your clients.
For each local marketing metric, you can show how much you’re spending per lead, so your clients can see how their money is used.
Local marketing reports can also identify local-based campaigns that are worth funding. A client might decide to halt a high-cost local campaign that seems unjustified. But if your report includes several local campaigns, you can prove that the more expensive one also brings in more high-quality leads.
2. Upselling your services
A client may hire you to do a specific one-time project, but if you show results, you have a great opportunity to prove you can do much more than that single local campaign.
For example, your main call to action (CTA) is to get a free quote. New leads are filling in a gated form to get access to a free quote, many of whom choose to receive emails on updates and discounts.
This is an excellent opportunity to upsell your client. Offer them to
- Create an automated lead follow-up email that the prospect receives immediately after download, with a sales-focused CTA.
- Create a multi-touch drip campaign where several emails containing valuable resources for users are sent periodically.
- Write a series of blogs on different use cases for the product or service.
- Repurpose the blog content into a whitepaper, a webinar, or a series of social media posts.
- Recommend a Google Ads campaign.
- Run a local marketing campaign on social media.
These are just some of the ways you and your client can monetize the success of your local marketing campaign based on a local marketing report.
3. Improved transparency
In a perfect world, you’d dedicate time and resources to a project which would turn successful. But in reality, there are situations where your results are not on the same page as the client’s expectations.
Although no one desires this scenario, your local marketing report can actually help you stay on the surface.
First of all, make sure you create and send your local marketing report regularly. This will help you identify what’s not working on time.
When your monthly report shows that something’s not right, you can use it to target the issue. If you update your clients regularly, you can both be on the same page about the result and expectations.
A local marketing report can open up several talking points
- Why the results haven’t met expectations
- What we can do as a team to improve this
- Why the results are really good
- What we can do to make them even better
This is a perfect opportunity to show your client that you are their partner and not just a vendor trying to justify your quotes.
Points 3 and 4 are also a great opportunity to upsell your client, as described above, and offer additional services that will make their local marketing campaign even more successful.
11 metrics to use in your local marketing report
To build an actionable local marketing report, you should first decide on a list of KPIs that will help you evaluate your client’s local business.
- Google My Business traffic: Physical locations are often registered on Google My Business (GMB). When you connect this data source to a reporting tool like Whatagraph, you can track the number of visitors that land on your website through Google My Business.
- Reviews on Google My Business: You can also track the number of reviews that people leave under your Google My Business listing. This KPI is essential for building customer trust in your business.
- Location-based phone calls: Digital call-tracking software like CallRail can help you track customer calls in specific locations. This KPI is a good indicator of lead generation performance through phone calls.
- Highest-performing city: This metric allows you to instantly see your best-performing location. Redirect your marketing efforts with accurate insights into the best and worst-performing cities or regions.
- Impression of local queries: Google Search Console integration can help you track impressions that your local search queries had in a chosen period of time.
- Brand and category search: Using Google My Business as a central hub, you can track the number of times your business profile has appeared to users searching for your brand or another brand related to your business.
- Landing page sessions: Using different landing pages for each business location can be difficult to track in terms of marketing performance. A local marketing report that includes these metrics helps you see the internet traffic coming to each of your locations.
- User type-based leads: This KPI provides insightful information about different users and where they’re coming from. It also helps track lead origins, such as contact forms, newsletter signups, etc.
- Sessions from organic: Take a glimpse into the amount of organic traffic your website had over chosen time. This way, you can determine the performance of your PPC vs. organic growth.
- Individual channel performance: With this KPI, you can identify your most cost-effective marketing channels that bring in the most leads to your website and convert them into the best-paying customers.
- eCommerce performance: If your local physical businesses are also available as e-shops, you can connect a platform like Shopify to your report to give you a better sales picture. This way, you can track the entire customer journey from the first ad to the checkout.
How to create a local marketing report in 6 easy steps
1. Consider the client’s needs
Before you get down to writing a report, you need to consider who is the target audience for your report. Depending on the position of the person and their engagement level, the report should have a different structure and content.
In a similar way, you need to consider the frequency at which you’ll send out your reports. The more frequent your reports, the more details you can cover. For example, a weekly local marketing report can cover more details on local marketing trends than a local SEO report you send out every month.
2. Pick a reporting tool
A local marketing report may include a large number of KPIs. If you want to make your report more granular, you should include performance for every local landing page or paid ad. However, visualizing this data manually in your report could take hours and hours of time that is better spent landing more business.
What you need is a reporting tool like Whatagraph. Connect your data sources and get instant insights into your local marketing rankings.
Google My Business, Google Analytics, Google Ads, CallRail, Facebook Ads — or any other major marketing channel that you use in our local marketing efforts — connect the sources once, and every time you create a new report, the data is refreshed.
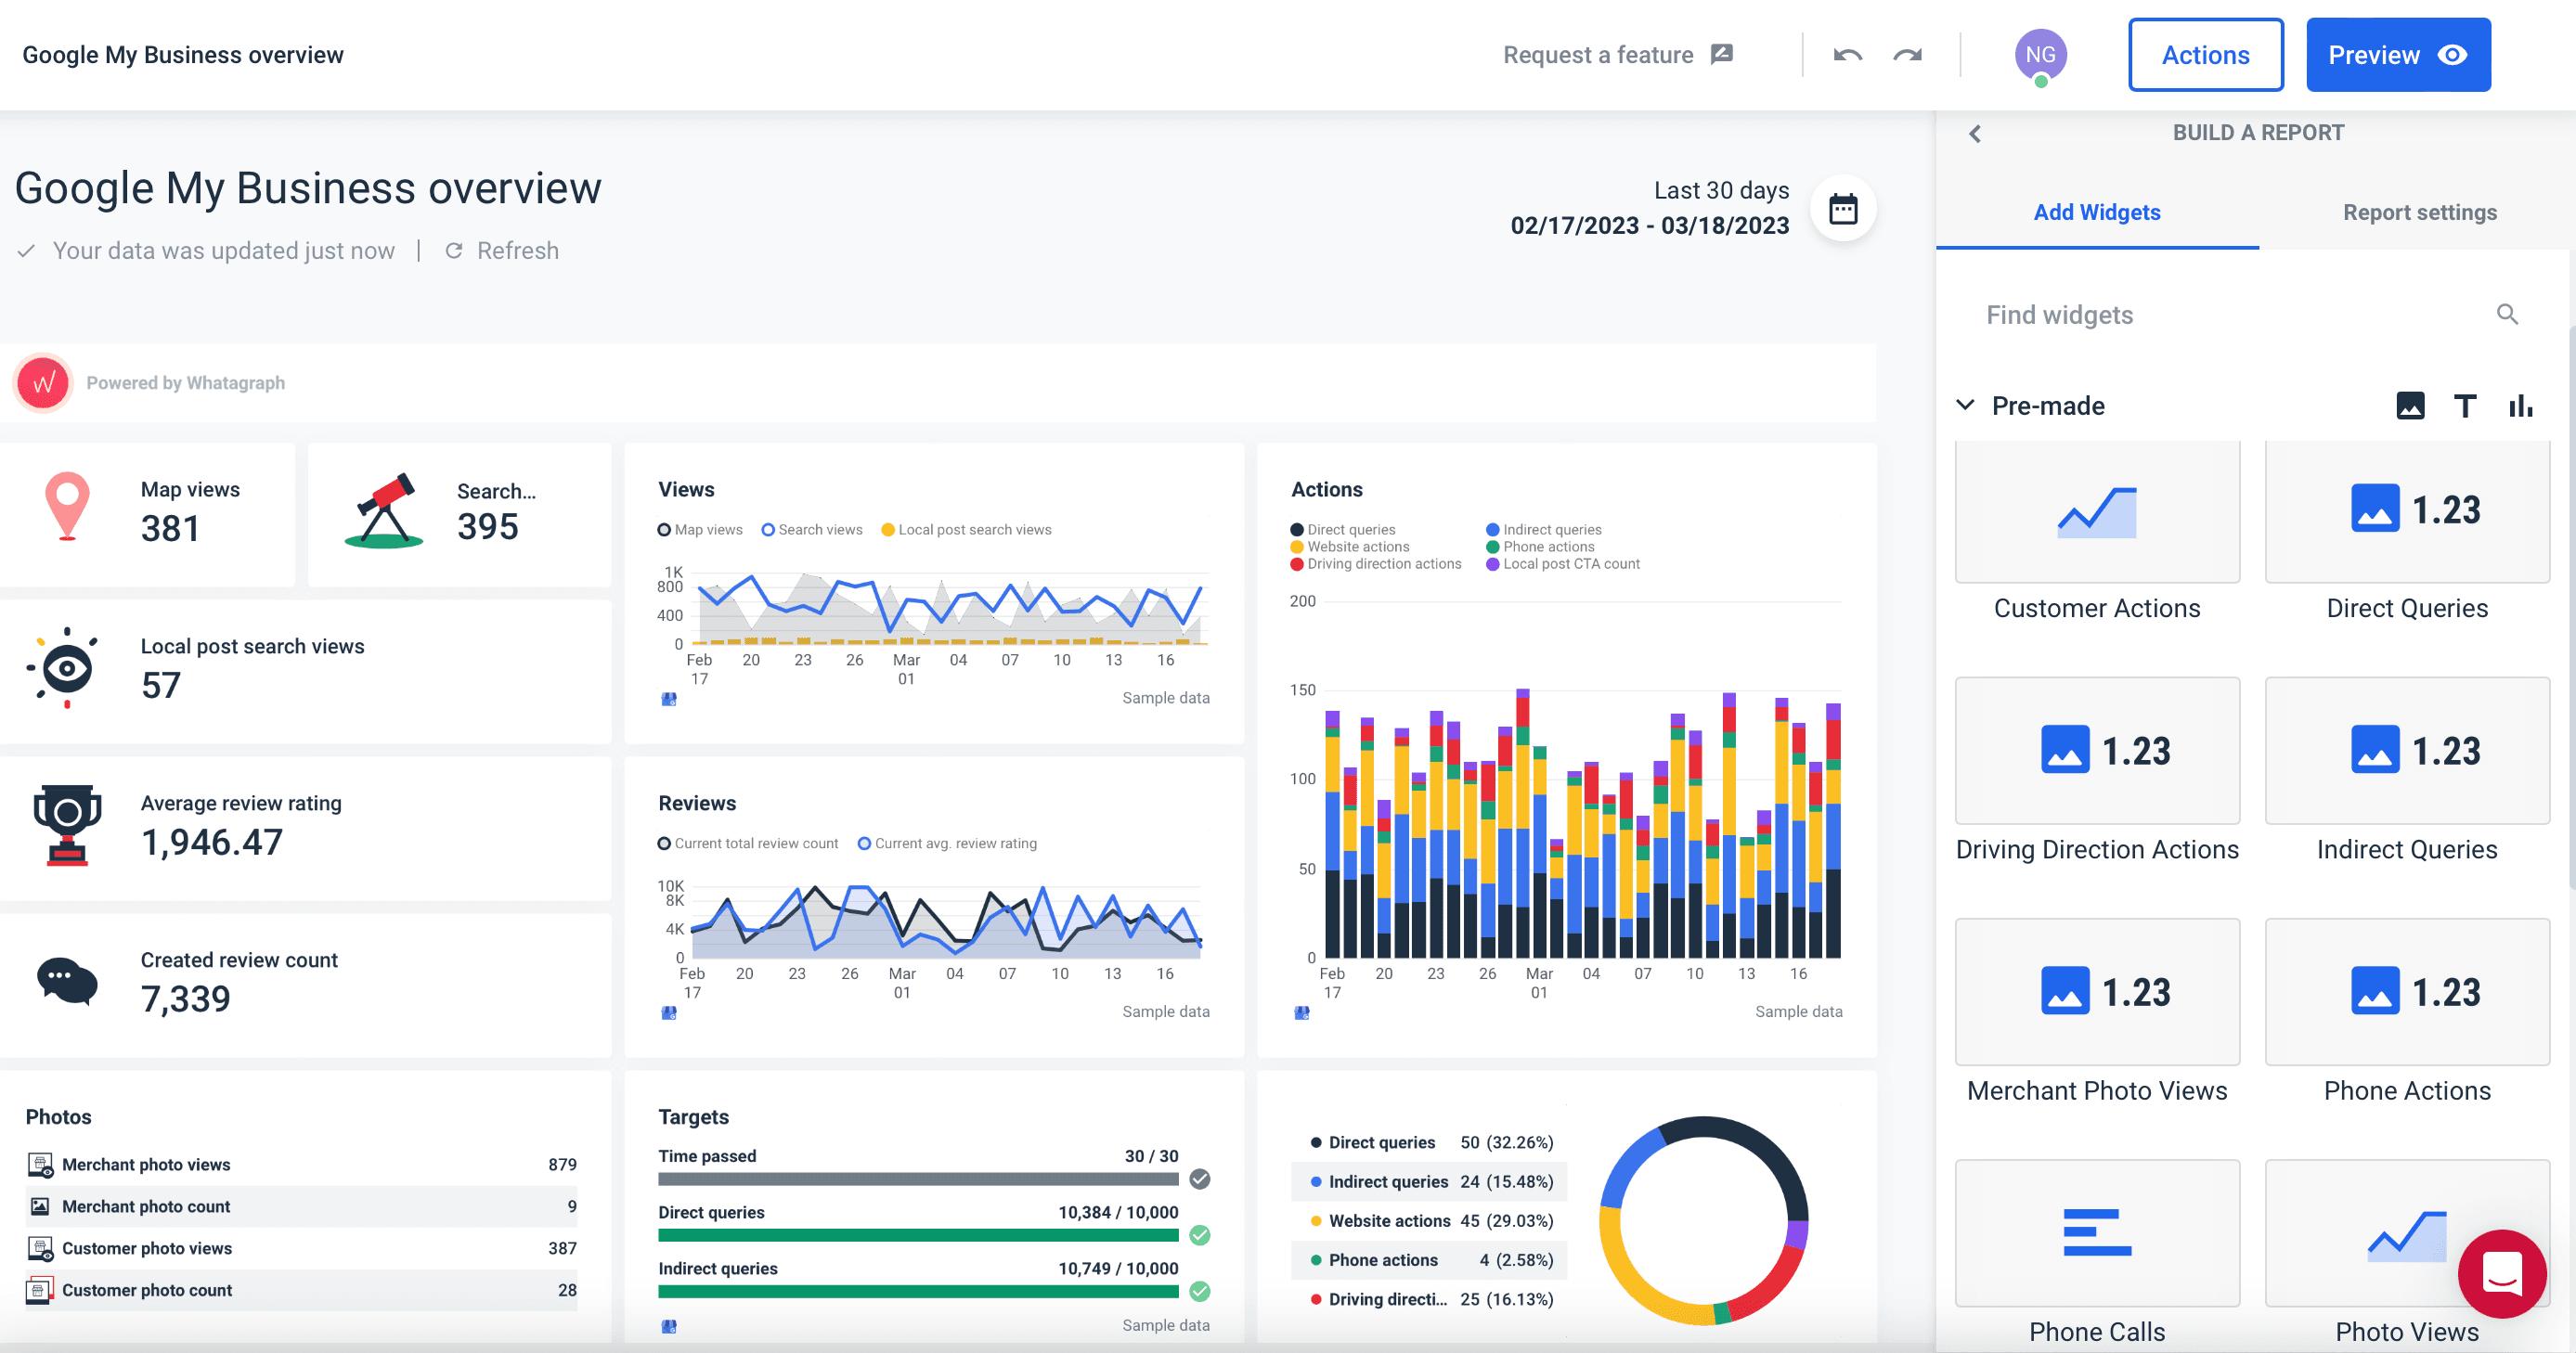
If you don’t know where to start, you can use our Google My Business Dashboard template to quickly aggregate all GMB insights for your local listings, including discovery searches, local search results, photo and map views, and much more.
No more going back and forth through different reports for hours to make the numbers make sense. Connect your accounts once, and the local marketing data fills in and updates automatically in the future.
Whatagraph allows you to create cross-channel analytics reports using data from a variety of social media, web analytics, SEO strategy, PPC, eCommerce, and marketing platforms.
Just connect your sources once and create an unlimited number of reports.
Yes, you heard it right! There’s no limit to the number of reports you can create, edit, and send with Whatagraph.
3. Add the Google My Business account as a source
Now we’ll show you how to add a Google My Business account as a data source.
- Open Whatagraph and click Create new in the top-right corner.
- Choose to Create from template.
- Scroll down to find the Google My Business template and click on it.
- Now you have a local marketing report with basic metrics.
- To add a source, click Actions > Manage Data Sources, and then Browse More Sources.
- Select Google My Business and pick one of the available accounts.
4. Use a report template
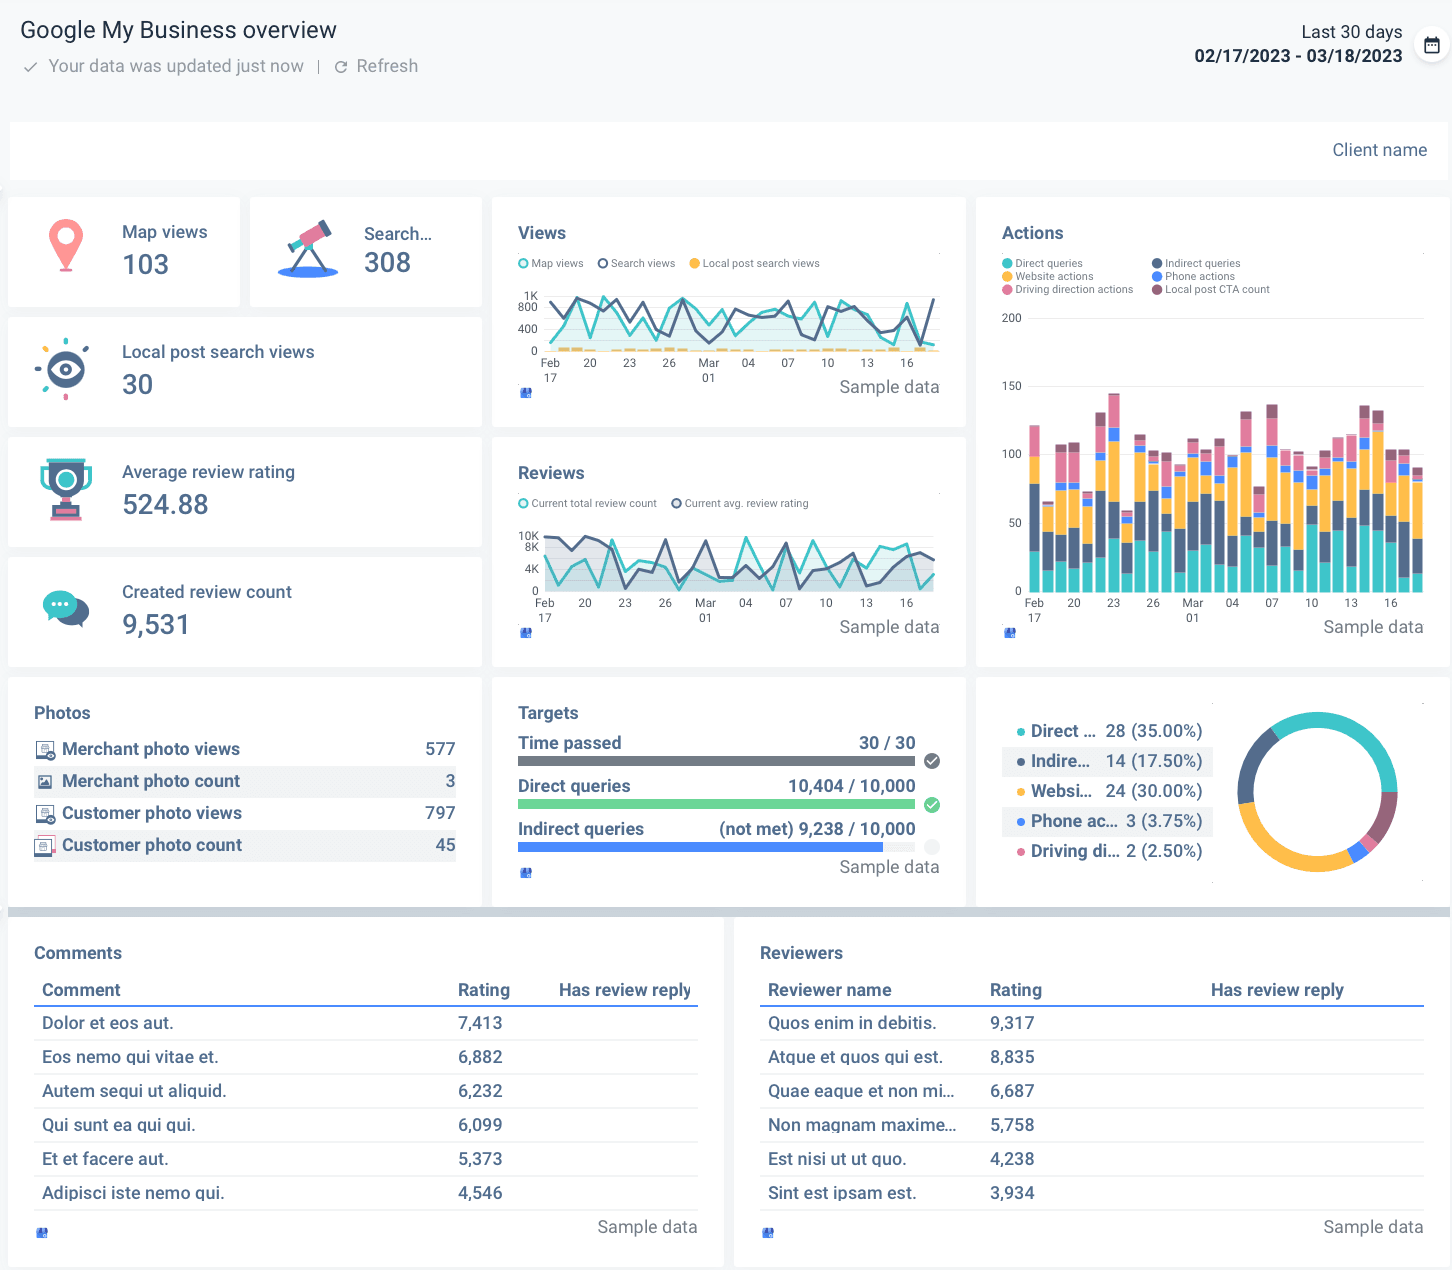
Whatagraph’s Google My Business template is created to meet your client’s needs as the state of local marketing report.
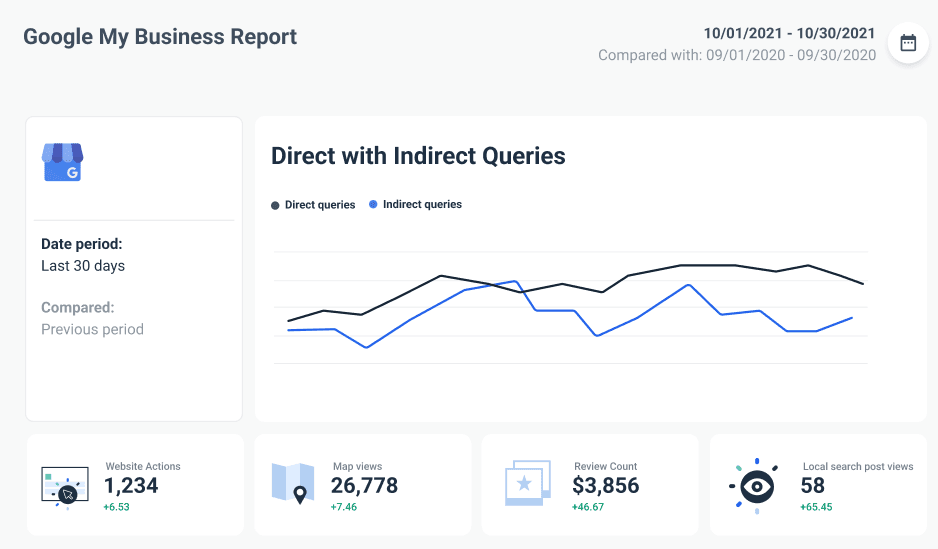
Using this template, you can visualize your local marketing metrics that impact your campaign performance, like map views, search views, direct queries, phone actions, and website actions.
The default Whatagraph Google My Business report template has seven sections:
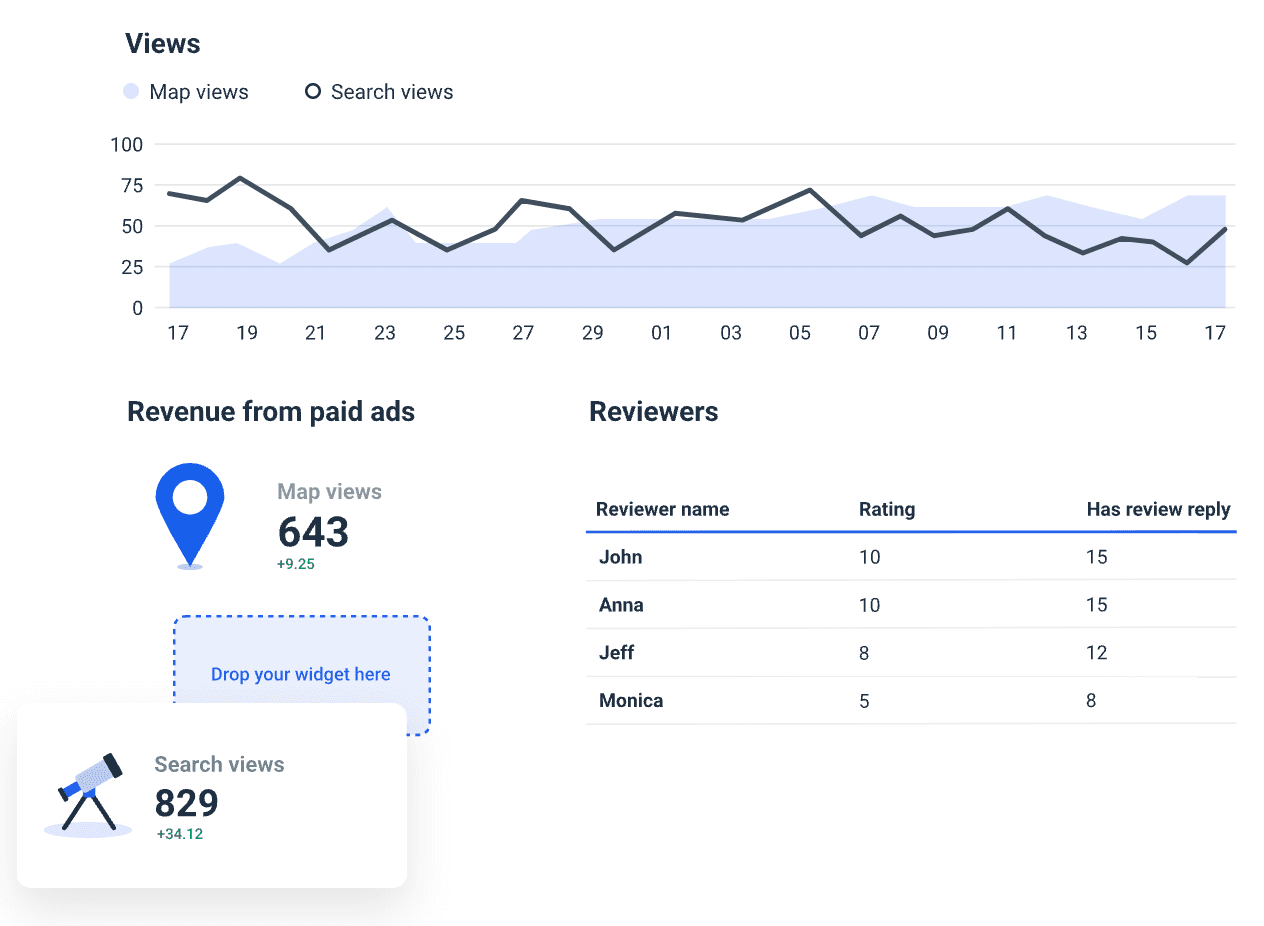
- Views graph: Map views, Search views, Local post search views
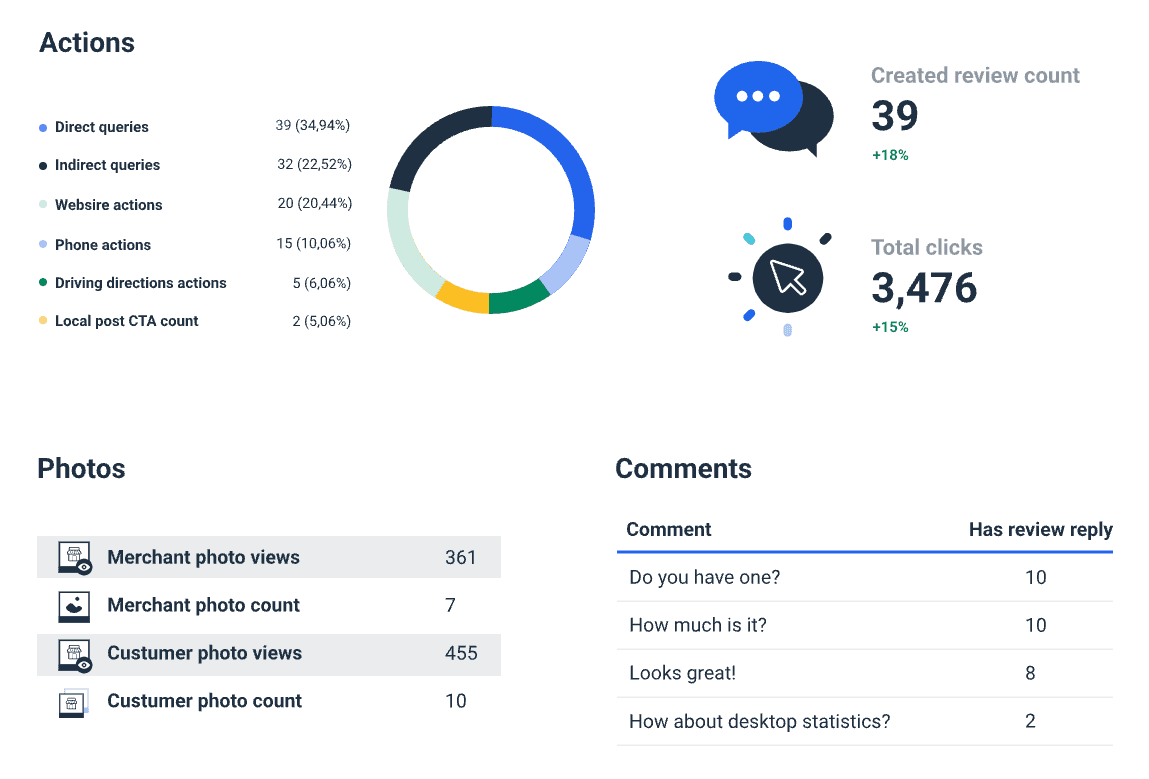
- Actions bar chart: Direct queries, Indirect queries, Driving direction action, Local post CTA count, Website actions, and Phone actions.
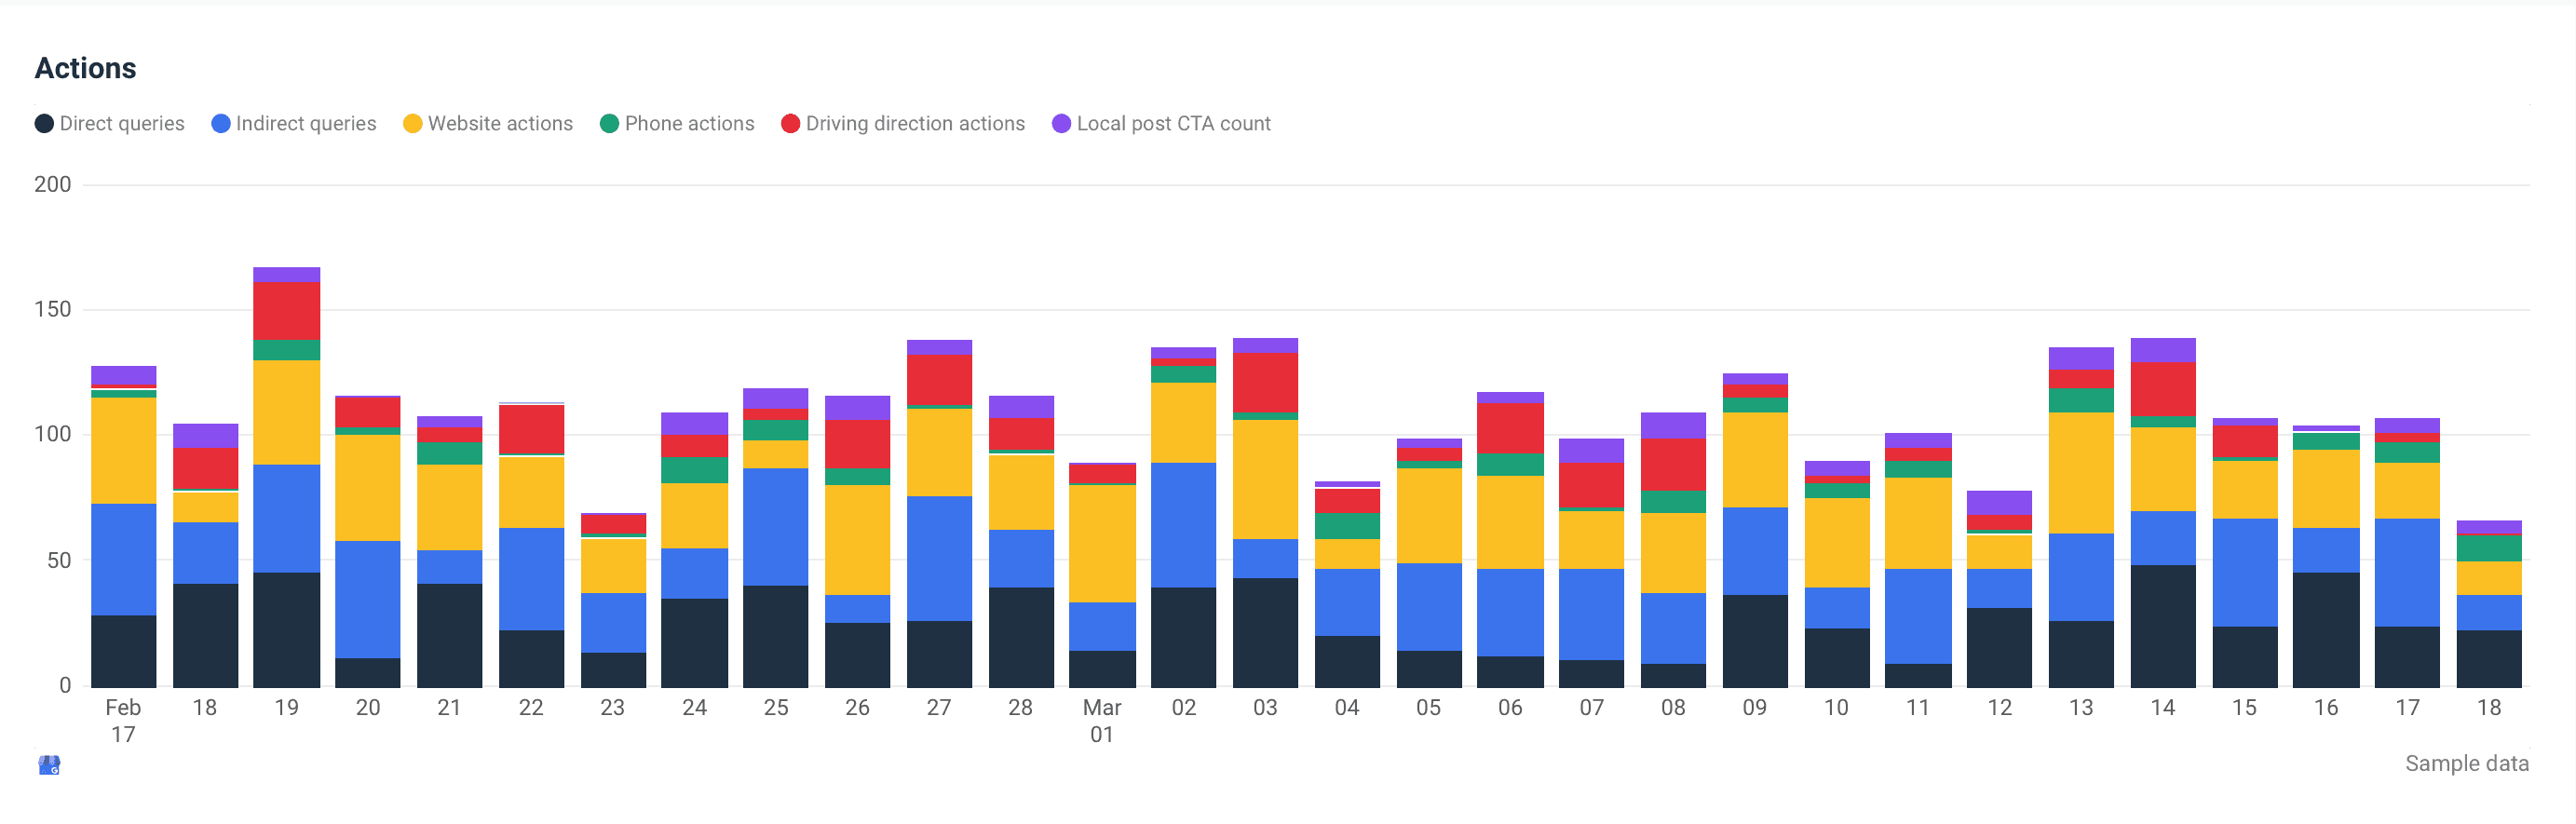
- Reviews graph: Current total review count and Current avg. review rating.
- Photos: Photo views and counts.
- Targets: Time passed, Direct queries, Indirect queries.
- Comments
- Reviewers
Keep in mind that you can easily edit this report layout, which we’ll explain in the next section.
5. Edit the report to your client’s liking
When you create a basic local marketing report, you can choose to edit it by introducing additional widgets for different dimensions and metrics.
Feel free to customize your local marketing report template by adding graphs and charts, images, text boxes, calendars, and more.
Change the name of your report, add your or your client’s logo, or change the color scheme of the design elements and make the report look more like your or your client’s branded paper.
But Whatagraph allows you to go one step ahead and impress the clients by making the report look like you created it from scratch.
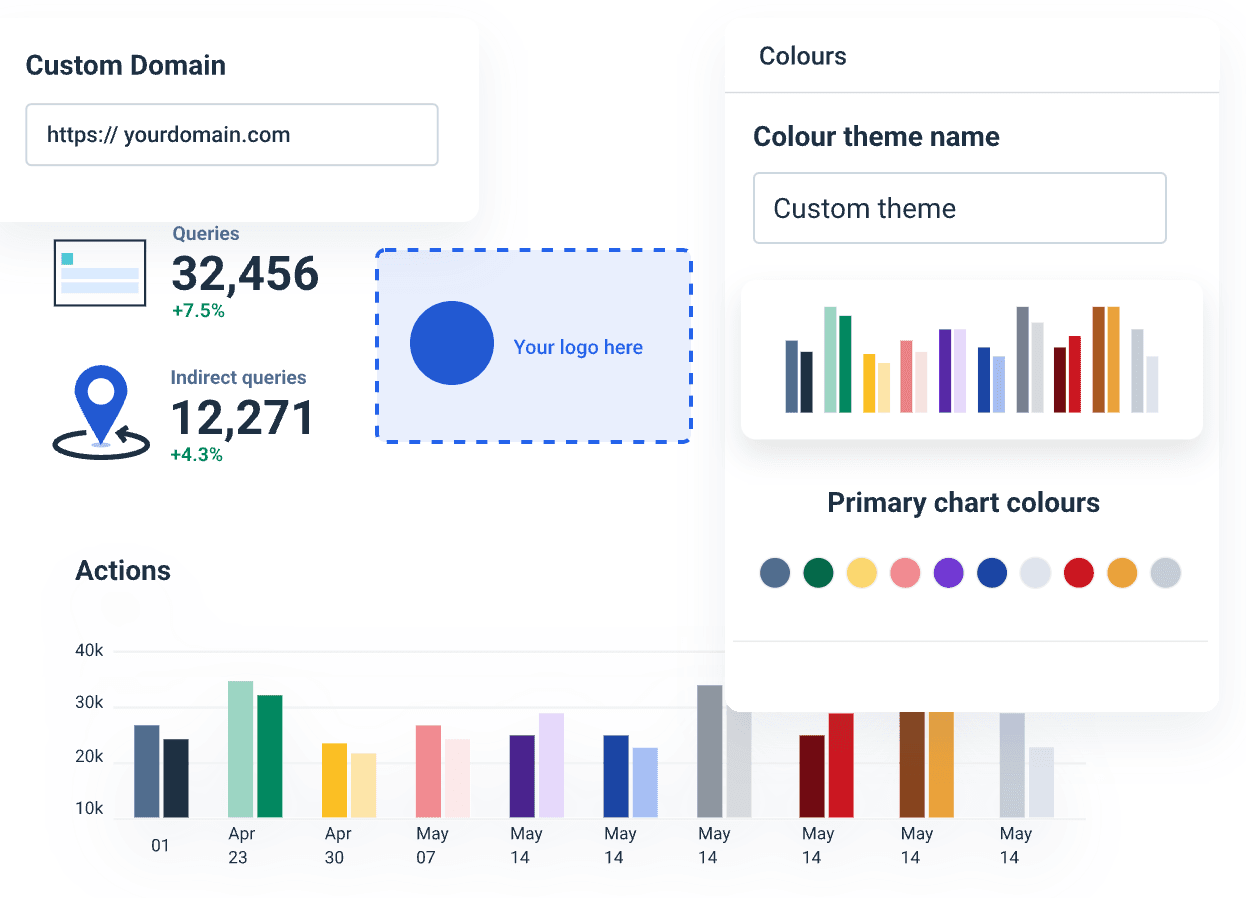
Use the white-labeling option to remove the Whatagraph logo from your reports for good.
6. Automate the report delivery
When you customize your local marketing report to your client’s liking, the only thing that remains is to automate the delivery. This allows you to set up your report and schedule it for delivery in just minutes.
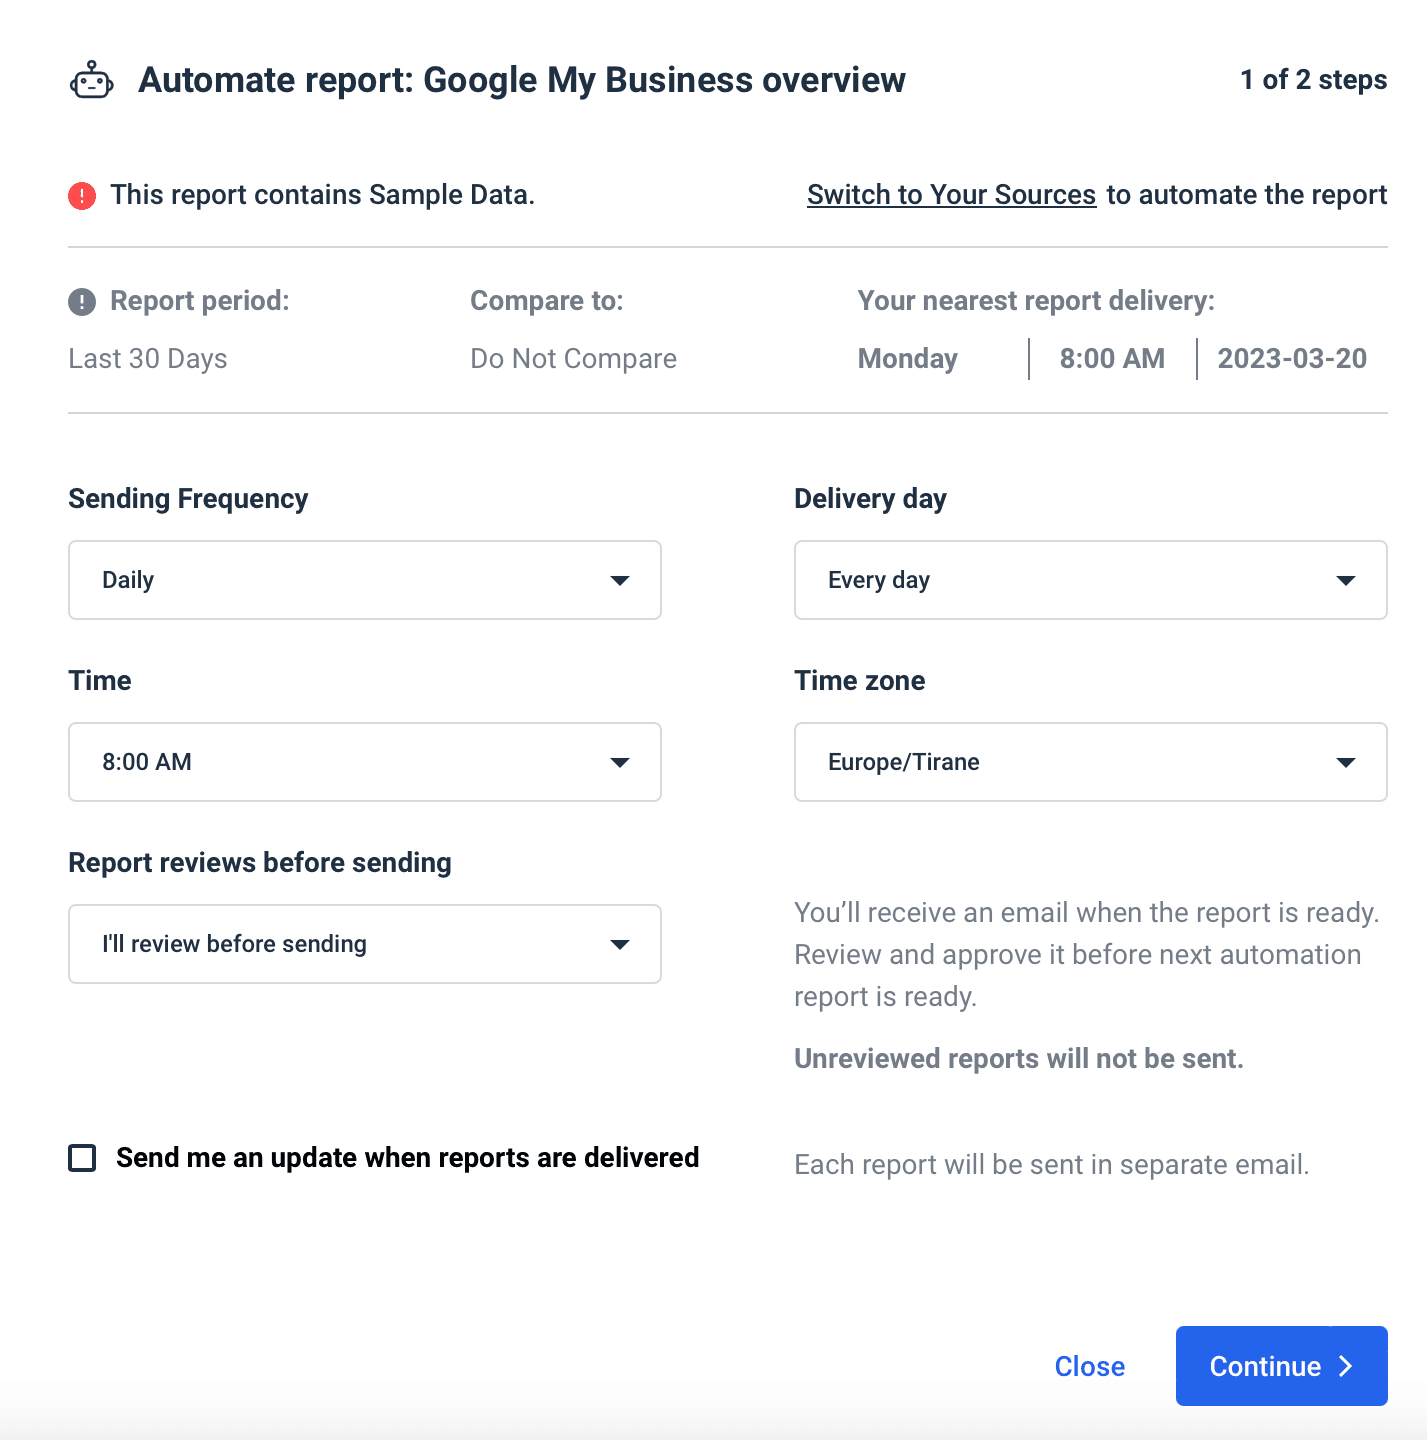
It makes no difference if clients want your report once a month or every week. Set the sending interval for each account, the period you want to report on, and the number of recipients, and every report will be delivered on autopilot.
Get ready for local marketing campaign wins
Local marketing tools collect a large amount of data on your client’s small business potential and current customers. However, the number of metrics and inbound traffic makes it impossible to draw any sensible insight from local marketing data without a capable reporting tool.
Whatagraph helps you create insightful local marketing reports in just minutes and set up automated delivery so that every client receives their report on time and without your intervention.
Use our Google My Business template or create your own local marketing report by choosing sources with localized data from over 40 platforms, including social media marketing, SEO, paid media, CRM, and eCommerce apps.
Any other marketing report or dashboard you’d like to create? Sign up for a free trial to take Whatagraph for a spin today.
Published on Mar 22 2023
WRITTEN BY
Nikola GemesNikola is a content marketer at Whatagraph with extensive writing experience in SaaS and tech niches. With a background in content management apps and composable architectures, it's his job to educate readers about the latest developments in the world of marketing data, data warehousing, headless architectures, and federated content platforms.