Google Ads to Remove Average Position: Here’s What You Need to Know
On September 30, 2019, Google will deprecate Average Position and replace it with four new metrics. Learn how to adjust your reporting and bid management once the changes take place.

Aug 23 2019 ● 5 min read
What exactly is the Average Position?
The official definition of Google Ads Average Position (Avg. Pos.) is “a statistic that describes how your ad typically ranks against other ads. This rank determines in which order ads appear on the page.”
It is determined in part by Ad Rank, which is based on your bid and Quality Score. This way Google rewards advertisers with high-quality ads, keywords, landing pages, and historical CTR as opposed to the ones with the most money in their pockets.
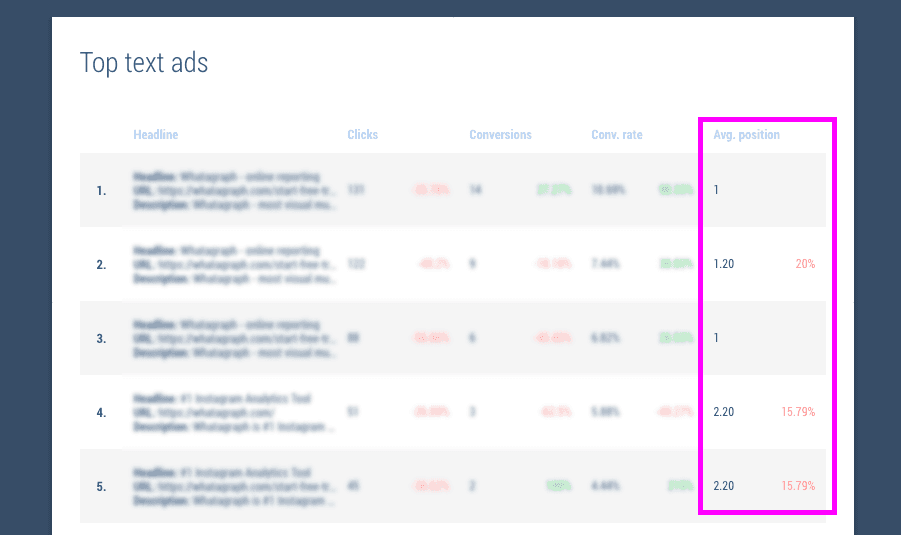
The highest position is “1” with no bottom. If you’re seeing something like “1.7”, it means your ads usually appear in positions 1 or 2, with “usually” being an important keyword here. See, the catch with Average Position is that it’s a mean average calculation, and doesn’t necessarily reflect the actual position your ads were served on.
Why is Average Position going away?
Average Position was one of Google Ads key performance indicators for many years, and it served its purpose rather well all until 2016. That’s when Google changed its layout removing right rail ads and started serving ads above and below the organic results.
What happened is perfectly illustrated by this screenshot from WordStream: Both of these ads are considered to be in the 4th position on the SERP. But which one would you prefer as an advertiser?
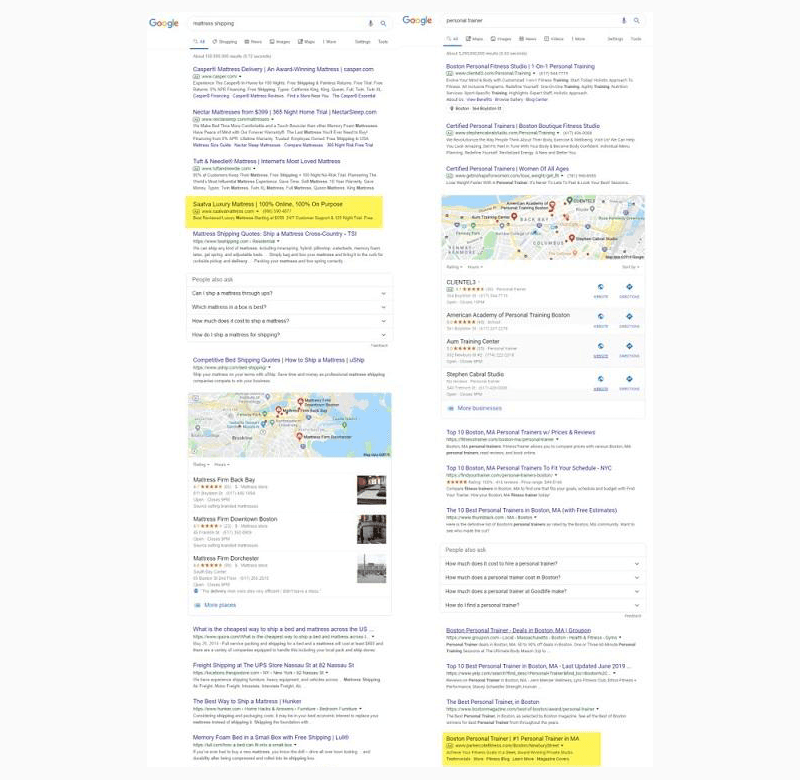
So the lingering perception that Average Position indicates where on the page your ads have appeared was fully shattered. And without being able to tell how often your ads appear above the organic results, bid optimization has become a real struggle for digital marketers.
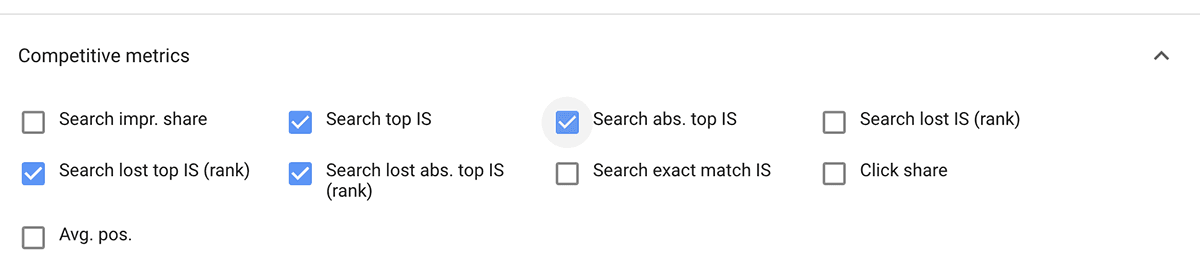
To bring in some clarity, Google decided the Average Position will be no more, and created four new metrics: Absolute top impression rate, Top impression rate, Search absolute top impression share and Search top impression share. Learn more about them below.
The new metrics explained
The new metrics were initially introduced back in November 2018. Their main purpose is to clearly indicate the percentage of impressions and impression share that your ads received in the absolute top (1) and top of the page (above organic results) ad slots.

According to Google Ads product manager Pallavi Naresh, “These new metrics give you a much clearer view of your prominence on the page than average position does.”
- Absolute top impression rate (Impr. Abs. Top %) shows the percentage of your ad impressions that were delivered at the very first slot on the page (formula: Impressions on absolute top / Impressions).
- Top impression rate (Impr. Top %) shows the percentage of your ad impressions that were delivered anywhere above organic search results (formula: Impressions on top / Impressions).
These above metrics allow advertisers to better understand where exactly on the SERP their ads are showing, as opposed to before when the ad position was relative to competitors’ ads. In short, it's what you got.
- Search absolute top impression share (Search abs. top IS) shows the impressions you received on the absolute top of SERP, compared to how many you were eligible to receive in the same location (formula: Impressions on absolute top / Eligible impressions on absolute top).
- Search top impressions share (Search top IS) shows the impressions you received on top of the SERP, compared to how many you were eligible to receive in the same location (formula: Impressions on top / Eligible impressions on top).
These two metrics provide valuable insight into how often your ads could be served in the top positions if you optimize your keyword bidding strategy and budget. In short, it's what you could've gotten.
In your Google Ads dashboard, you'll also see lost impression shares based on budget and rank. These metrics estimate how often your ads weren't at the top of the absolute top due to low budget or poor ad rank.
What should I do next?
As mentioned before, the Average Position metric will be deprecated on September 30, 2019. There are several steps you should take prior to that date to make sure nothing gets broken in your Google Ads reports.
Here’s what will be disabled:
- Rules using average position;
- Custom columns using average position;
- Saved reports that filter on average position;
- Saved filters with average position {adposition} parameter will begin returning an empty string.
Make sure you adopt the new metrics not only in Google Ads but any other third-party platform (like Whatagraph) that may be reporting on Average Position. Otherwise, you will see empty fields or inaccurate data. As for Whatagraph, the new marketing metrics are already available so go ahead and change them in your reports!
Published on Aug 23 2019
WRITTEN BY
Gintaras BaltusevičiusGintaras is an experienced marketing professional who is always eager to explore the most up-to-date issues in data marketing. Having worked as an SEO manager at several companies, he's a valuable addition to the Whatagraph writers' pool.