How to Create an Insightful YouTube Analytics Report
YouTube is by far the biggest video content hosting platform. It can also be a formidable marketing tool for those willing to create great visual content for their audience. However, today, there are more than 4 billion videos on YouTube, so the fight for subscribers' attention is tough in every industry.
So, if you want to make the most out of your video marketing efforts, make sure that:
- Your videos are optimized to be found on YouTube and search engines
- You post content that is interesting to your audience
If you or your clients are not sure about whether YouTube is a channel worth investing in, keep in mind that Google's research on advertising found that 70% of viewers have made a purchase after seeing a brand on YouTube. It all boils down to getting the captivating ad content in front of the right audience.
But how do you measure the impact of your marketing efforts on YouTube? Create your own YouTube Analytics reports that provide insight into the effectiveness of your campaigns and help you streamline future content creation.

Aug 12 2024●10 min read


Apart from surface-level metrics, YouTube Analytics can give you data-driven insights, such as demographics and video watch times, informing you about what is happening with your videos after publishing and pointing out any hotspots.
In any case, creating a comprehensive YouTube channel analytics report is the only timeproof way to monitor trends, identify areas of improvement, and make data-informed decisions.
But where do you start? How can you be sure that your YouTube data analytics makes sense?
In this article, we’ll show you how to create a stunning YouTube Analytics report in under 10 minutes.
To better understand the data we need for your report, let’s see what YT Analytics is made of.
What is YouTube Analytics?
YouTube video analytics provides a torrent of data about user interactions with your client’s channel. This data goes much beyond views and likes. YouTube Analytics in advanced mode lets you see more specific data about your channels, assets, and audience. From audience demographics to watch time and other viewing behaviors, these insights provide information that can shape your content strategies in months to come.
Yet, it would be wrong to think that YouTube Analytics is only about numbers. It’s about the stories of your content. About viewer preferences, ways of engagement, and content effectiveness. As you explore YouTube marketing analytics, you are putting together a puzzle of your client’s digital presence.
The essence of any YouTube Analytics report is the user behavior patterns and content performance. A YouTube Analytics tool allows you to go deeper behind surface-level metrics and uncover what interests the audience and drives engagement.
But how to read YouTube Analytics?
Understanding YouTube Analytics is a skill that can turn YouTube Analytics data into a strategic asset that gives you the confidence to advise your clients. Let’s explore in more depth how to use it to measure clients' success.
10 most impactful YouTube Analytics KPIs to measure
When it comes to selecting the YouTube metrics and KPIs you want to track, the more you track, the messier it can get. Choose a few metrics that are consistent with your priorities and help you define what success for your marketing team looks like. In other words, these metrics should:
- Tell you if you have accomplished your targets.
- Tell you what you can do to improve your results.
- Tell you if your YouTube thumbnail is getting clicks.
Performance metrics, such as video views, average view length, and subscriber growth are good metrics if you want to quantify knowledge. You also want to pay attention to likes, comments, and shares if you want to quantify engagement. To calculate revenue, use projected sales or estimated revenue as the best metrics.
But let’s give more context to the 10 most important YouTube KPIs.
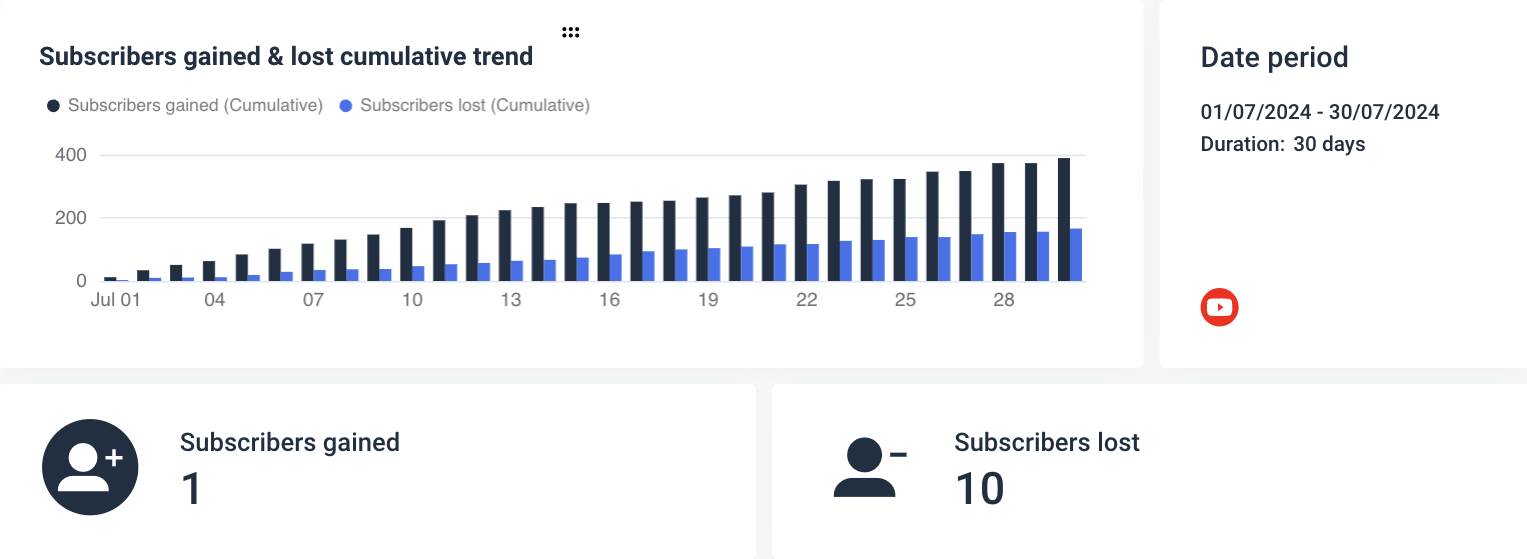
1. Subscribers: the essential audience metric
Subscriber data is the base of your client’s YouTube success. Subscribers are the viewers who have declared they are eagerly awaiting new content similar to the one that made them subscribe in the first place. Tracking subscriber count helps you estimate the long-term growth and loyalty of your client’s viewer base. Any video that has improved subscriber number is worth examining in more depth because it’s an indicator of interesting content.
2. Top video performers: what content your viewers prefer
When YouTube Analytics identified a specific video as the most popular by the number of views and other levels of engagement. Analyzing these videos helps you understand which content resonates most with viewers. Maybe you realize that Shorts get the most engagement, or maybe those are 2-minute videos. Or videos with a specific set of keywords in the title. All this data is essential for replicating successful content and optimizing posting schedules. Social Shepherd has gathered an interesting collection of YouTube statistics, which reveal that YouTube video ads targeted by intent have a 100% higher lift in purchase intent.
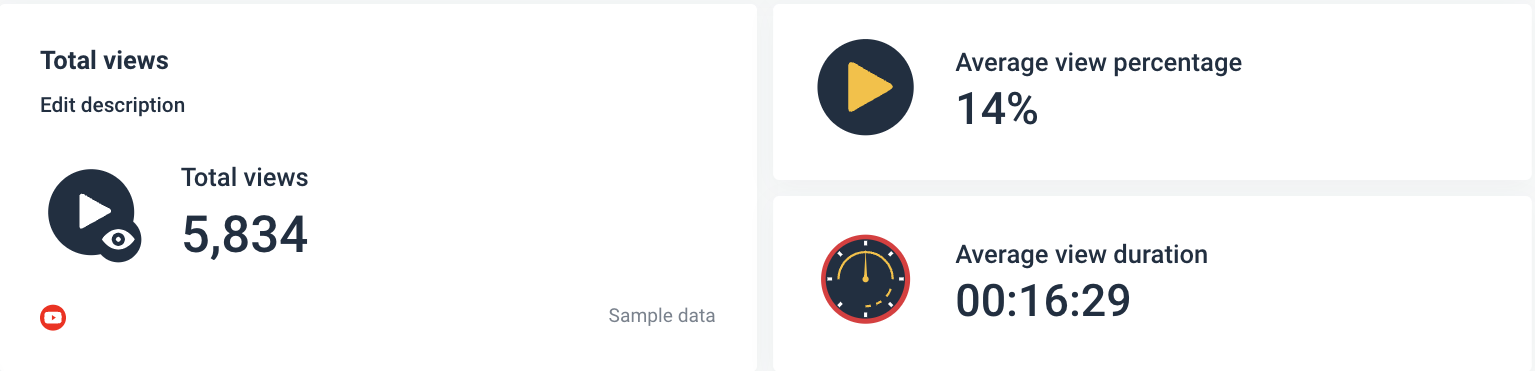
3. Views: the basic engagement metric
The YouTube views analytics tell you how popular your content is in the broadest terms. And it’s quite simple: If something is interesting, more people will watch it. However, to understand their effectiveness, you need to put video views in context with other metrics, such as average watch time and total number of people who watched your video.
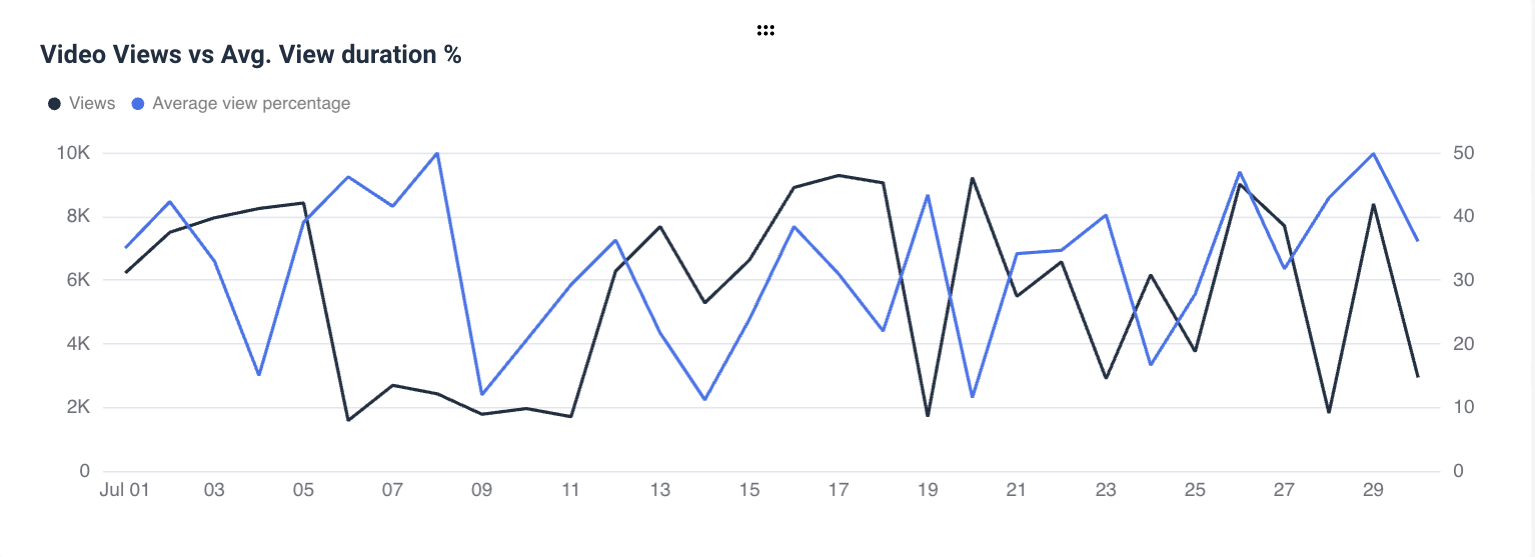
In the example above, we’ve chosen a line graph to showcase video view numbers in relation to the average view percentage. This helps you better understand how specific videos captivate the viewer’s attention long enough for them to view the entire video.
4. Unique viewers: measuring new audience reach
Unique viewers in YouTube Studio Analytics are similar to unique website visitors in Google Analytics. This metric provides insight into the new audience your content reaches over time. YouTube Analytics can help you track this metric alongside other KPIs to measure how your videos perform with both subscribers and new viewers.
5. Traffic sources: analyzing content discovery
YouTube is the second largest search engine. If someone is looking for a video on a topic that interests them, they are likely to go straight to YouTube and start their search there. Traffic source data tells you where viewers find your client videos — through YouTube searches, playlists, or external URLs. This metric can point to growth opportunities and a better understanding of viewer discovery journeys.
6. Audience retention: viewer engagement over time
Audience retention metrics such as rewatches, viewer drop-off points and segments with high engagement show you how long viewers stay engaged with a video. Benchmarked against similar content, it provides information on content performance and helps identify what topics engage or disengage viewers.
7. Watch time: proof of content value
Watch time is a key metric in YouTube’s algorithm for evaluating the effectiveness of your YouTube content. High average watch times indicate that your videos are engaging and meeting viewer expectations, while low watch times suggest that improvements are needed.
8. Likes, dislikes, and comments: measuring viewer perception of your video content
Likes, dislikes, and comments are the key metrics that assess viewer perception of your content. These engagement metrics tell you if your audience enjoys the content and if you're also establishing audience retention. This is a direct feedback of your content engagement. Although the number of likes and dislikes should not be a foundation of your YouTube video strategy, engagement metrics give you contextual data for understanding the overall content relevance for a specific target audience.
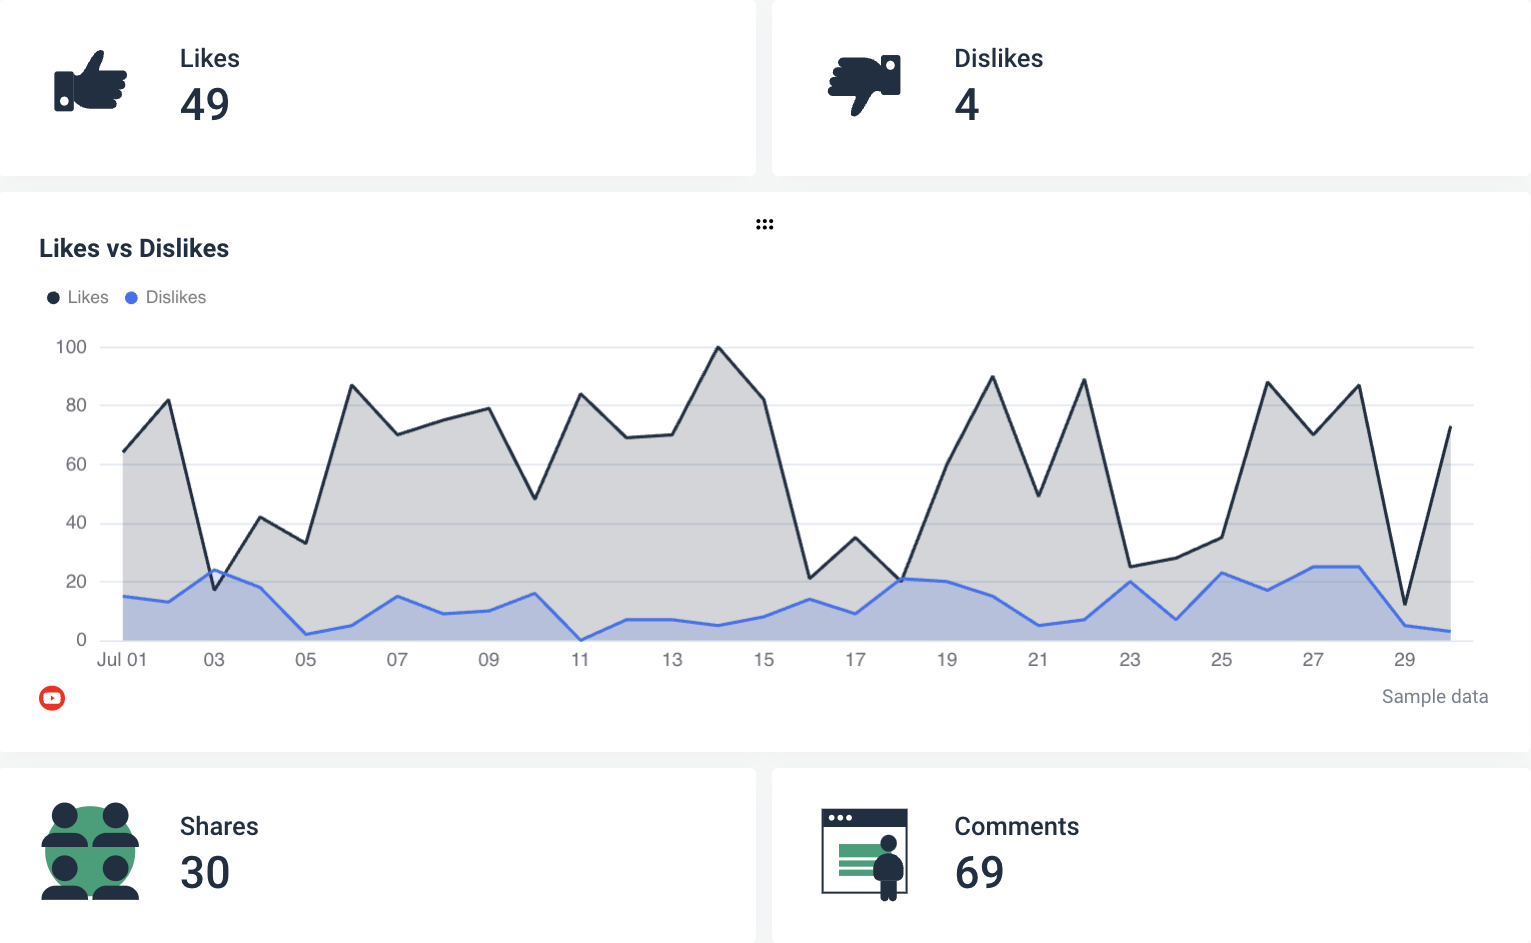
We advise using a line graph to show the growth of likes and dislikes over a certain time period. Pictured above, you can clearly see the fluctuation in likes and dislikes over an entire month.
Chances are, you may also need to provide comparison data within the same report. It makes assessing progress and channel performance much easier.
9. Videos published: showing your agency’s impact
The number of videos published is one of the base metrics that show your team’s impact on the client’s YouTube channel performance. It is direct proof of your agency’s effectiveness in executing the video content strategy. The number and frequency of new videos released stand as your agency’s proof of commitment to boosting your client’s presence on YouTube.
10. Overall engagement: consolidated interaction overview
This segment of YouTube Analytics consolidated likes, dislikes, comments, and shares to give you a high-level view of viewer interaction. Other favorable KPIs, such as subscriber growth, click-through rate, and views per unique viewer, often accompany high engagement and can improve organic visibility on YouTube.
By closely monitoring these 10 top YouTube Analytics, your agency can provide clients with informed, data-driven insights for more consistent YouTube presence and performance.
What makes a great YouTube Analytics report?
One of the biggest client retention challenges for marketing agencies is that clients don’t understand or don’t care about reports that the agency sends them regularly.
Reports that are too technical or that don’t add any tangible outputs will not be seen as valuable by clients. More than analysing the numbers, we need to be able to reach an action plan that can improve results.
And they might be right. No one has time to read extensive reports packed with metrics and data that require extensive contextual explanation to make sense to a non-marketer.
A useful YouTube client report should present information in a way that is easy to understand and offer a clear explanation of how your video marketing efforts contribute to the client’s business goals. Luckily, today, there are plenty of great YouTube analytics tools that can help you take the most impactful data and shape it into actionable insights.
YouTube reports should benefit both your agency and clients. There’s no purpose in making two separate reports. You need a YouTube report or dashboard that is easy to share, provides all important insights, and saves you time on reporting each month.
All in all, a truly useful YouTube report should:
- Include visual representations of data, such as historical trends, graphs, and charts, with textual annotations where more explanations are needed.
- Include a goal widget to show how YouTube correlates to your client’s overall business goals.
- Have customizable date ranges to provide insights on historical trends and key analytics over time.
- Offer insights from other marketing channels that show a bigger picture of your YouTube efforts.
- Be scalable and automatable to reduce manual work as much as possible.
Whatagraph’s YouTube Analytics Report Template, for example, comes with an array of features such as bulk report edits, saving anything as a template, a way to organize reports in tabs, and automating how it’s shared.
6 strategies to create amazing YouTube Analytics reports
Now, when we know how to get YouTube Analytics, it's time to put them together in a report using analytics tools. Think about what types of charts are best suited for presenting each data set (we’ll provide you with some visual examples throughout.)
1. Base your report around client’s objectives
A generic one-size-fits-all report won’t impress anyone. Your clients are eager to see marketing ROI as soon as possible, so the first thing they’ll ask is how close you’ve brought them to their goals. This is why it’s essential to determine your clients' goals beforehand and tailor the report around them.
It’s pivotal that agencies don’t take a ‘one-size-fits-all’ approach to their service. While they can have some type of ‘template’ for how their processes work or a general list of what they can offer, every client should have a personalised approach.
For example, let’s say your client launches a YouTube ad campaign and sets an optimistic target of 3000 new subscribers by the end of the quarter. To conclude this goal in your report, you need to:
- Show YouTube subscriber growth at regular intervals for the reporting period.
- Track goal progress so your clients know how close they are to achieving that target.
- Provide context for any spikes or dips in subscriber growth that are worth mentioning. In reports created in Whatagraph, this is easy. Just drag and drop a text widget next to a graph or chart to explain the events in simple English.
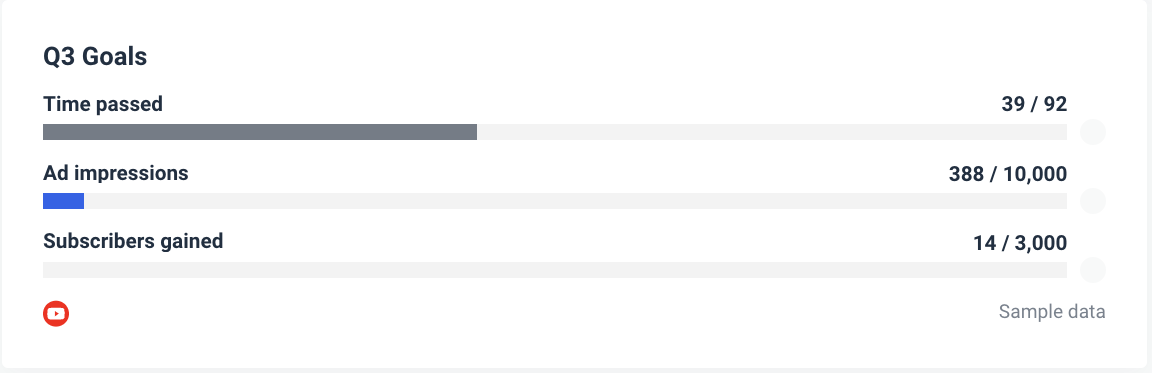
Pro tip: Use Whatagraph’s goal widget to decide what’s worth focusing on. For example, a client who wishes to grow the channel will likely ask to see new subscriptions, overall reach, and subscribers won vs. lost at the beginning of their report. Changing these in our goal widget takes a couple of clicks.
2. Track their data automatically with live reports
Saving precious billable hours and streamlining agency processes should be top priorities for any agency. Taking screenshot after screenshot of data or exporting YouTube Analytics files in spreadsheets is no one’s idea of efficient reporting.
This approach may work in the short term, but in the end, it will slow your agency down, especially when you begin to onboard new clients or move further down the digital agency life cycle. That’s where automated reports come in handy.
Whatagraph’s YouTube Reporting Tool allows you to create reports that automatically populate with your client’s most important metrics, and then save them as a custom template for other client projects.
If you decide to build your report from scratch, make sure to add widgets that display:
Subscriber rate (accompanied by explanations of any significant rise or drop in that period)
Total number of video views
Watch times (including the average view duration and the number of seconds or minutes watched)
Video views: The number of times people have watched your videos—the bigger the number of views, the higher your YouTube SEO rating would be and the better you perform in YouTube searches.
Average view duration: this is determined by total view time/total video playback (including replays.) A higher average viewing time means that your viewer finds your specific video useful.
Estimated watch time: how much time the audience spends viewing individual videos.
Engagement metrics (i.e., likes, dislikes, shares, and comments)
Audience demographics (i.e., age, gender, geographical location, and device type)
Pro tip: When onboarding a new client, consider using Whatagraph reports with live sample data. This way, you can easily show how data populates automatically with every data source you add.
3. Create custom metrics to align with your client’s goals.
If you’re running multiple marketing campaigns for your client, there’s a good chance you’d post the same video you used in the YouTube campaign on Facebook as well. You may also send an email to promote the new video. As a marketing agency, you want to exceed client expectations and show the big picture of what is happening in your marketing strategy. However, vanilla analytics may not be enough.
To measure the overall impact of your agency’s efforts, you should use custom metrics. In Whatagraph, you can easily create formulas based on your client’s unique YouTube goals, bring together data from cross-campaign activities and show that your agency holds all the strings.
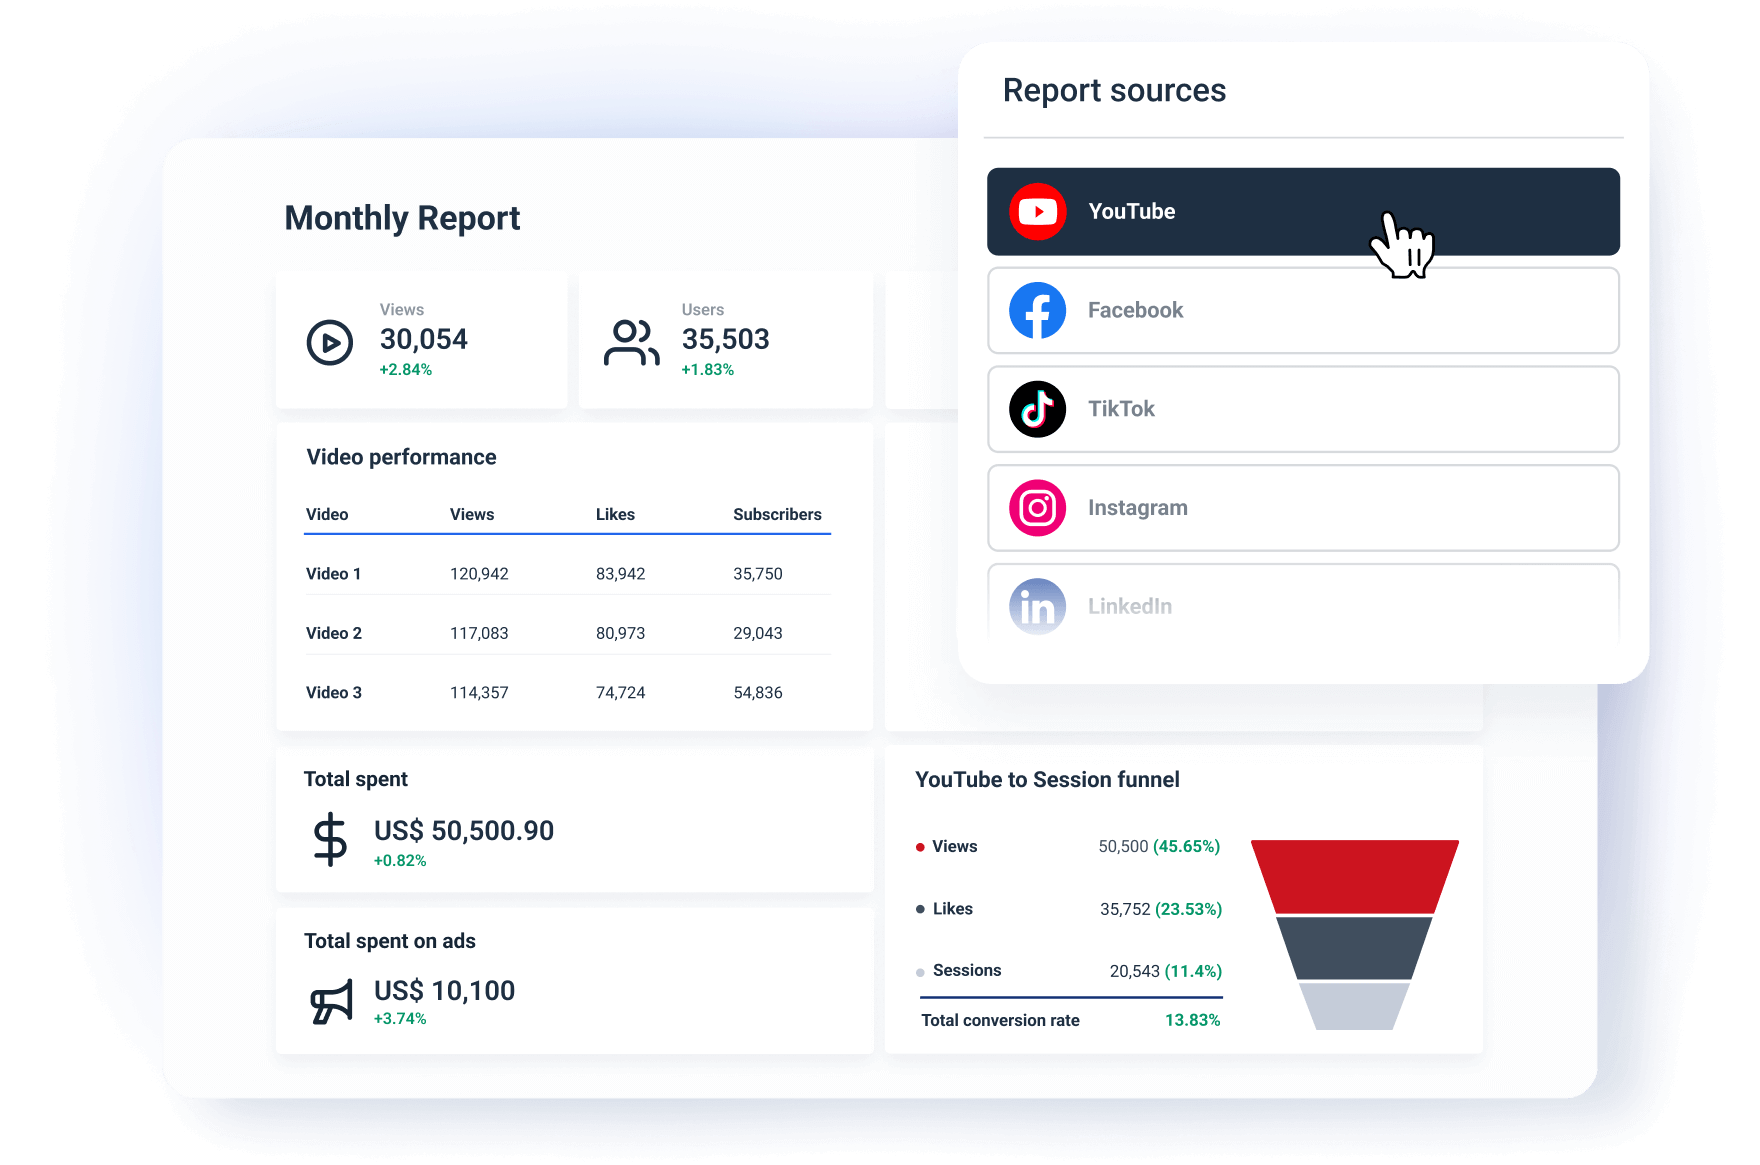
4. Use cross-channel reporting to show the big picture
Let’s explore the scenario where your agency is charged with improving the client’s website traffic and overall brand visibility. You are aware that the best course is to take a multi-sided approach that includes optimizing your client’s YouTube SEO, doubling down on Facebook content, or investing in other inbound strategies that can reverse the trends.
But how can you demonstrate earned media value when so many platforms are involved? Apart from traffic source data from the YouTube Analytics site, Whatagraph allows you to incorporate insights from other channels. By adding data points from other relevant platforms, such as Google Ads or Google Analytics, you can show their relation to your client’s YouTube content.
For example, a high click-through rate on a certain YouTube video ad might stand behind increased website traffic and conversions. In that case, it’s easy to drag and drop Google Analytics widgets next to those from YouTube to show the big picture. Web analytics insights become even more important if your client decides to embed their YouTube channel on their website.
You can also apply data aggregation to YouTube Analytics and group insights by regions, campaigns, or even different social media pages to see the overall impact of your efforts on specific global KPIs.
It doesn’t matter which multi-channel approach you choose and which channel is in the focus. Whatagraph has over 50 integrations with popular marketing platforms. In the same way, you connected the YouTube integration, you can bring data from any other integration into any report you create.
If you can’t find your marketing source among current Whatagraph connectors, you can build a connection to Whatagraph Custom API and connect your data this way as well.
5. Tell the story with data
YouTube content performance might be difficult to quantify at first glance. That’s why you need to tell the story of data. Through the clever use of visual widgets and custom comments, you can explain to your clients what’s happening on their YouTube channel. For example, if your client had a webinar that resulted in higher brand visibility and increased follower count across all social media platforms, their monthly YouTube report will show a noticeable spike in the number of video impressions.
At first it might not be clear why the spike happened. However if you add a text widget with an annotation directly to that data point, you can tell the story behind that spike in a way that is easy to understand.
Pro tip: Add an executive summary at the beginning of your client’s YouTube report to set the stage. This will create a high-level sneak peek of your YouTube insights without wading deeper into the report. To be honest, most busy clients and executives won’t go any deeper than this.
6. Share the report in the most convenient way
When you’ve created your YouTube Analytics report, discuss with your client what’s the best way to send it. Whatagraph makes this step of your job easy as well. If your clients prefer periodical PDF reports that they can print, schedule the automated send-out so that reports automatically update and get sent every week, month, quarter, etc... always at the same time.
While convenient to some, this method might be a hassle for other clients. In that case, offer to give them 24/7 client access to a live report. This way, they can always check their YouTube channel metrics in real time without calling you every time. Whatagraph live reports also have the data range feature, so clients can change the reporting period themselves and see how data has changed over time.
If you need to process it further, you can always export YouTube Analytics data from Whatagraph as CSV or Excel files.
Wrapping up
To answer questions like “How many subscribers do we get each month?” or “How engaged are the viewers with our videos?” You need a scalable way to use YouTube Analytics and a replicable way to share the actionable insights it provides.
However, to ensure that the KPIs you measure align with clients’ goals, you must take every “metrics you must track” advice with a reserve. What works for some clients may not work for others, so what you measure ultimately depends on your client's objectives.
So whenever you create a YouTube Analytics report for your clients, make sure to:
- Report only what’s important.
- Include context and explanations to visuals to tell the story.
- Prove your agency’s value by tracking against goals.
- Be transparent about your updates.
- Give the clients 24/7 access to your report.
An easy way to achieve all five is to use an all-in-one platform for monitoring and reporting in-depth YouTube Analytics and all other marketing analytics sources you have.
Just connect your YouTube account and your data is extracted automatically into a custom-made report.
Start a free trial of Whatagraph and start putting hours back into your day while adding more value to your clients.
Published on Jan 26 2021
WRITTEN BY
Nikola GemesNikola is a content marketer at Whatagraph with extensive writing experience in SaaS and tech niches. With a background in content management apps and composable architectures, it's his job to educate readers about the latest developments in the world of marketing data, data warehousing, headless architectures, and federated content platforms.