How to Build an Instagram Insights Report - The Ultimate Guide
Conveying Instagram Insights data to others is a lot easier said than done. To make the most of data and to effectively relay vital information to others, you need to use visual Instagram Insights reports.

Jan 18 2021 ● min read

Instagram is one of the most popular marketing platforms today, with over a billion active users every month. This makes it a great
In today’s article, we’ll show you how to build an insightful Instagram Insights report. All you need is access to your account - we'll take care of the rest.
In addition to covering the report creation process, you’ll get acquainted with the right metrics to track that help you gauge the effectiveness of your marketing strategy. As you probably know, Instagram insights boast a lot of data and KPIs – we want to make sure you have set your sights on the metrics that matter the most.
Let's get to it.
Measuring the performance of your Instagram content
Starting to post to Instagram from Mac (or any other device) and creating content on Instagram that generates value for your business is no easy feat. As you create and upload content, you need to measure its performance. Social media marketing is all about measuring performance and its benefit to your business.
Content improvements and further strategy development can only be done effectively with data and important metrics that you can measure. Here’s what metric analysis helps with:
- Understanding who your followers are.
- Seeing what types of content they prefer.
- Gauging the effectiveness of individual Instagram posts.
A well-structured Instagram analytics report will provide insights into the questions above all the while improving future campaign performance.
The ideal structure of your Instagram Insights report
Your report needs to effectively convey the performance of Instagram content. Having a layout that guides the audience from a concrete profile overview to individual content performance is imperative.
To achieve it, your report should consist of 3 sections:
- A general overview of performance insights;
- Your audience demographics;
- Performance insights of individual posts.
Why don't we dive deeper into each section of an Instagram Insights report? Let's see how you can leverage these insights to improve your content strategy.
In essence, a comprehensive Instagram insights report contains essential performance indicators that will showcase the effectiveness of your Instagram content. This could consist of top-performing posts, audience demographic data, and impressions. Your Instagram story analytics - if you use stories - should include impression metrics, reach, replies, and possible CTR.
1. Account performance insights at the top
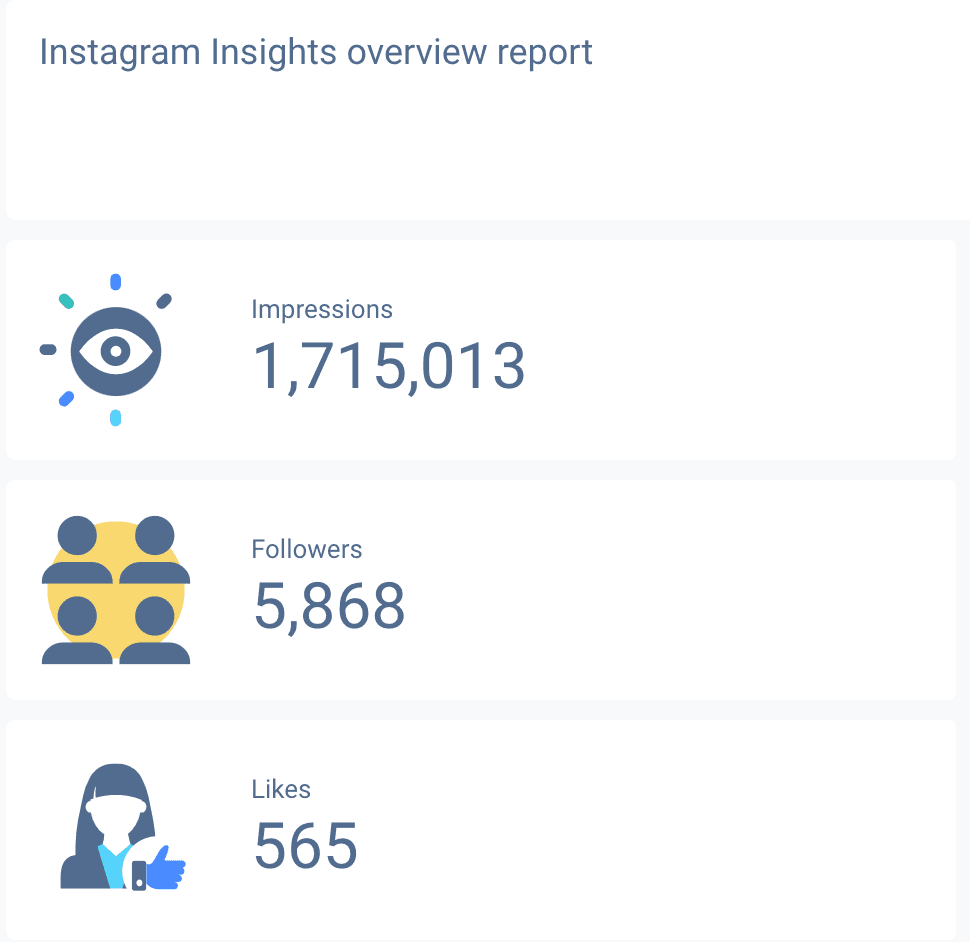
Account (or profile) insights should typically be placed at the top of the report. It gives a detailed summary of how your audience interacts with your profile.
At the top of your report, you’ll see impression count, follower numbers, growth, and overall content likes. This makes social media management and understanding overall trends a bit easier for you and those viewing the report.
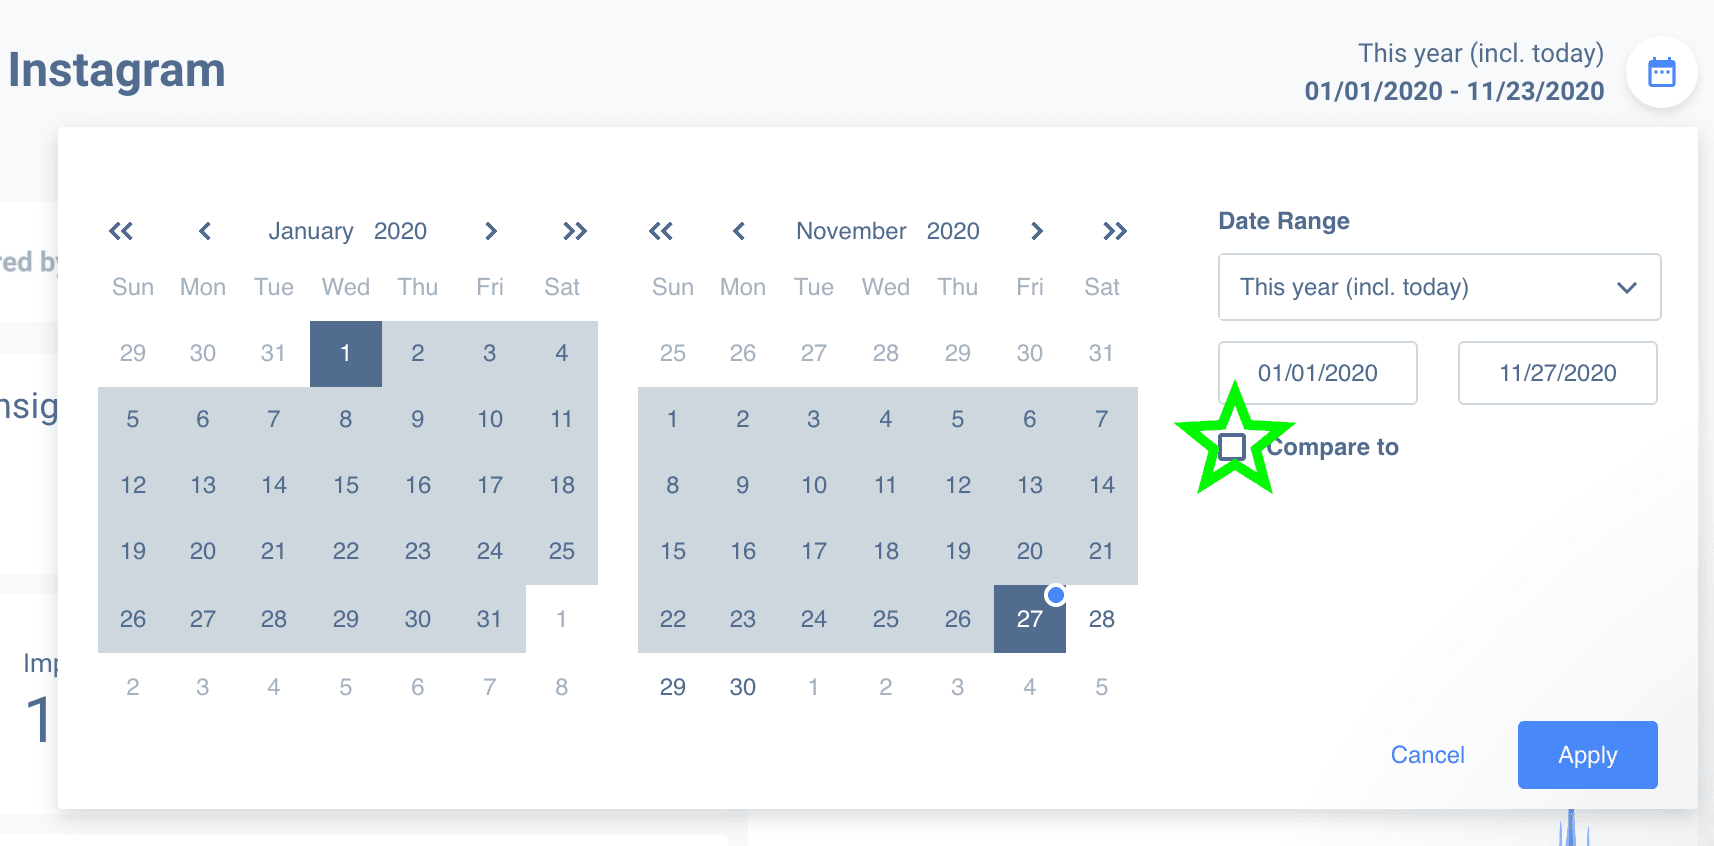
(Tip: You can use the calendar to set comparison dates to see how your account has grown over a particular timeframe.)
Up next, you’ll see a glorious line graph. It depicts the evolution of profile reach and profile views and other key metrics over your specified period of time.
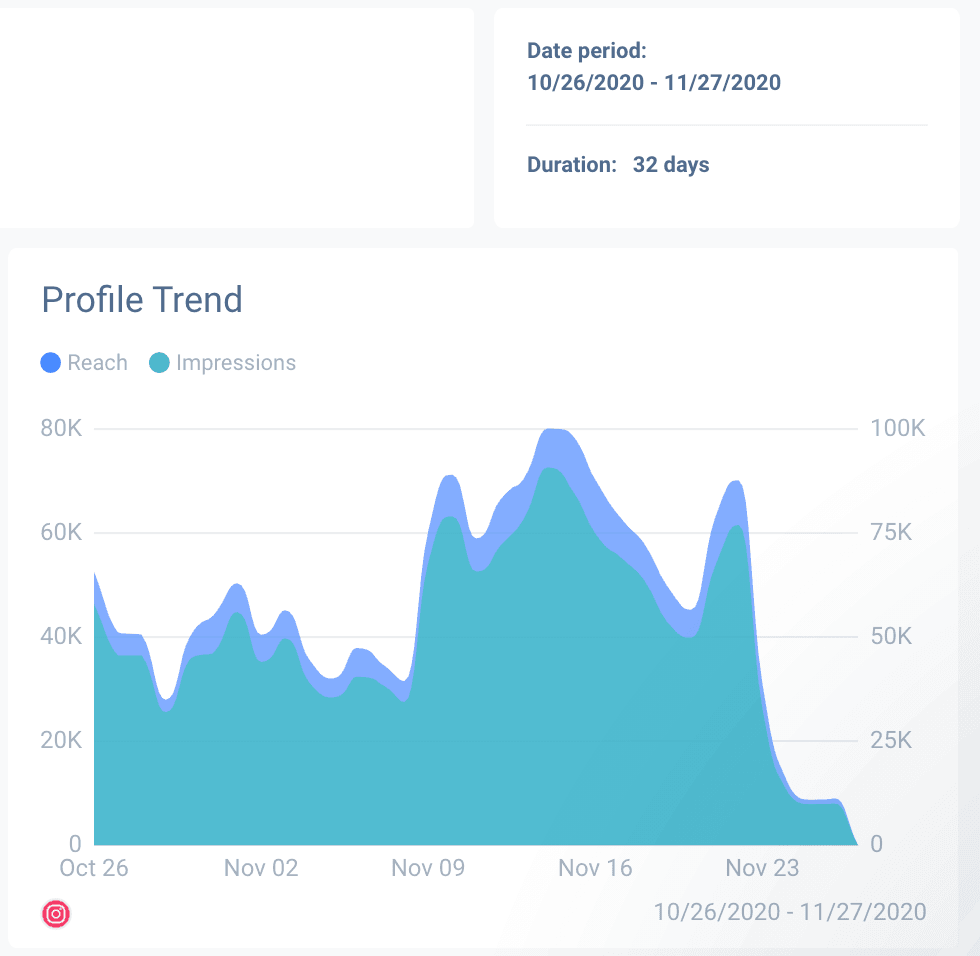
Although Instagram post impressions and reach are seen as a vanity metric – they don't necessarily translate to sales – seeing these trends helps bolster future Instagram campaigns with actionable insights.
If your profile reach and engagement are low, or decreasing, or perhaps you’re just starting out – you have the option to quickly bolster reach with paid ads or alter your hashtags to get some real-time changes in your Instagram performance.
Also, keep an eye on how the reach, impressions, and engagement metrics grow. If reach/impressions grow disproportionally to engagement (ie. likes, shares), that means your content may not resonate with your audience and you might need to use the help of an influencer or a new strategy.
Profile views can disclose the audience's desire to want to learn more about your company or product. This is especially true if you’re showing different products in your feed. Or, if you’ve released a new collection, you’ll want people to visit your profile to learn more, which should ultimately lead to conversions.
2. Audience demographics
Now let's dive deeper into the type of audience you're attracting with Instagram content.
The second portion of an Instagram Insights report will house demographic data and categorize your followers by age, gender, and location.
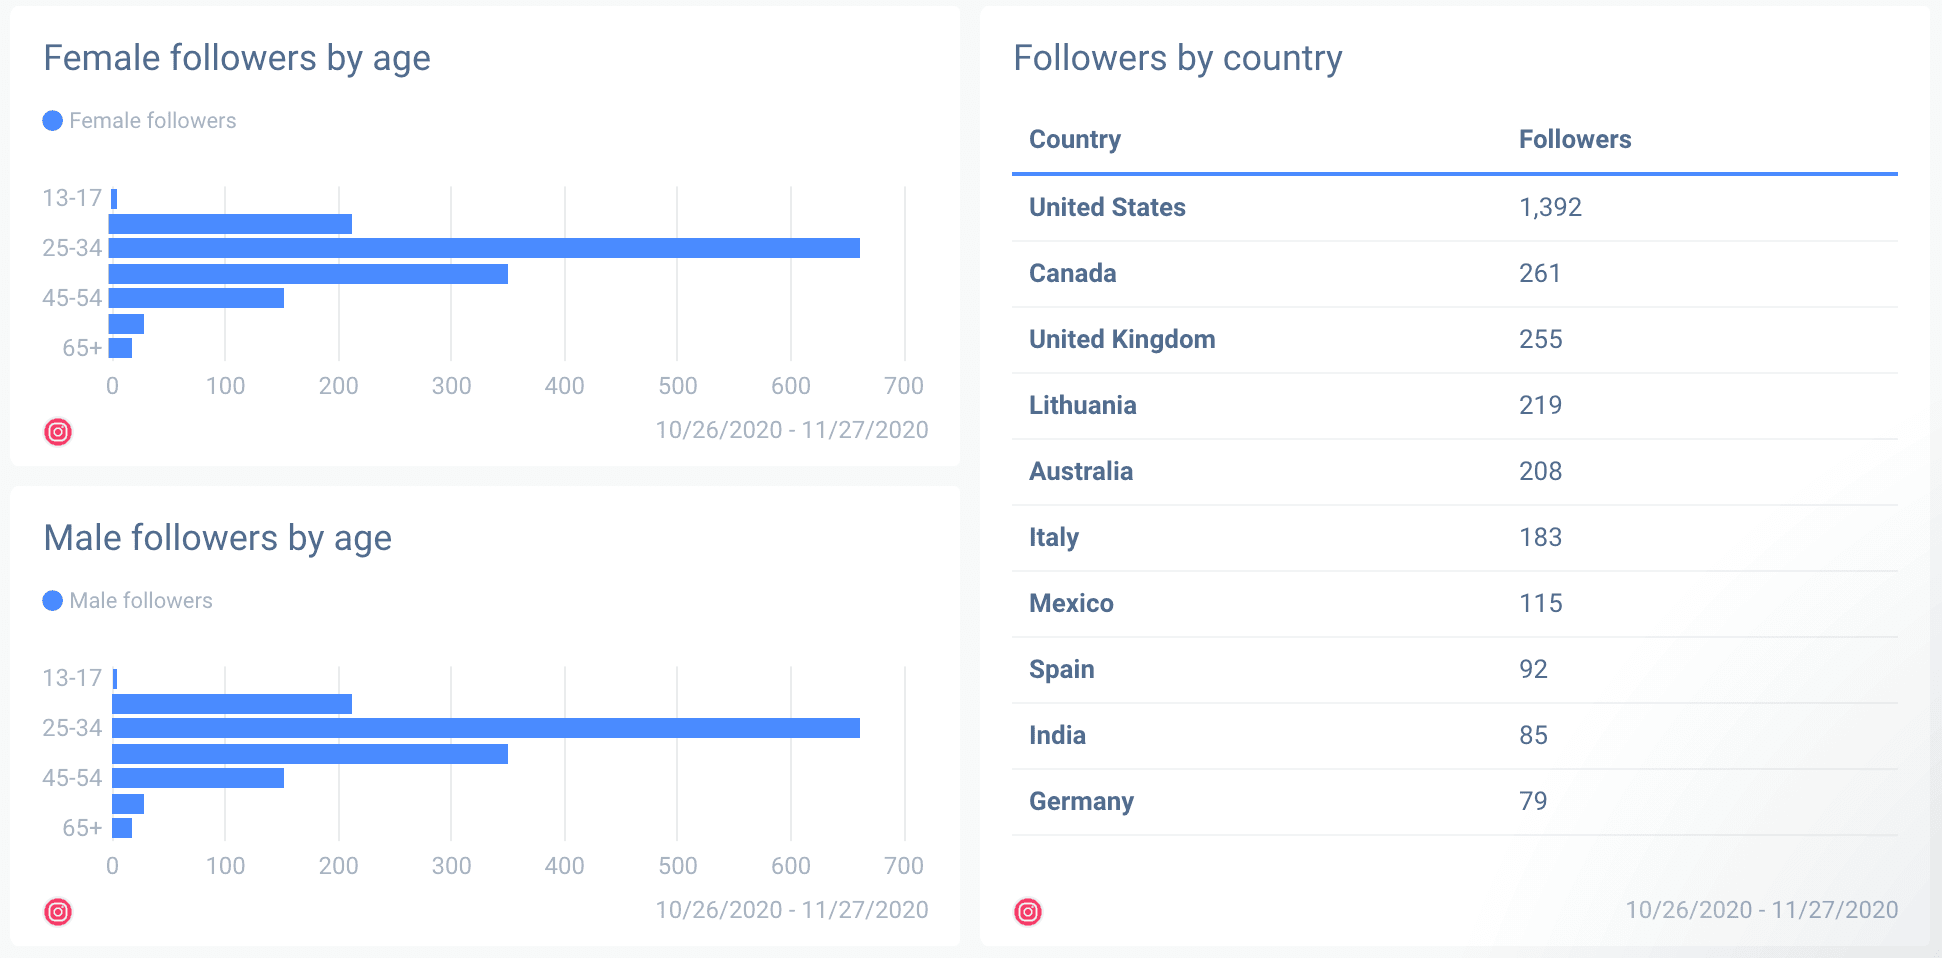
Here’s why having audience demographic data on your report is important. It's a phenomenal way to give yourself some clear structure as to what audience you are reaching. This way, you can relay this data effectively to your clients or superiors to show information about the follower growth and more and similar.
Demographic data helps:
- Improve content scheduling to maximize performance metrics (based on the most prevalent user location);
- To see if your follower type matches up with your intended target demographic (it doesn't make sense for you to create content that doesn't entice the desired audience);
- Adjust ad targeting on Instagram/Facebook (create more effective audience segments for Ads that adhere to the current demographic patterns);
3. Individual post performance
Since people have shown interest in your Instagram profile, they may be keen on seeing more great content.
The trick here is creating content that reflects your brand, while enticing your old and new audiences and Instagram followers. That's what makes Instagram marketing challenging yet so fun.
As we've previously mentioned, there’s a ton of different content that can be hosted on Instagram. From photos to videos, and from carousels to IGTV and reels, how can you be sure about which content does your audience enjoys the most?
Well, the good news is that a comprehensive Instagram Insights report will contain an in-depth look at individual content pieces that have performed exceptionally well.
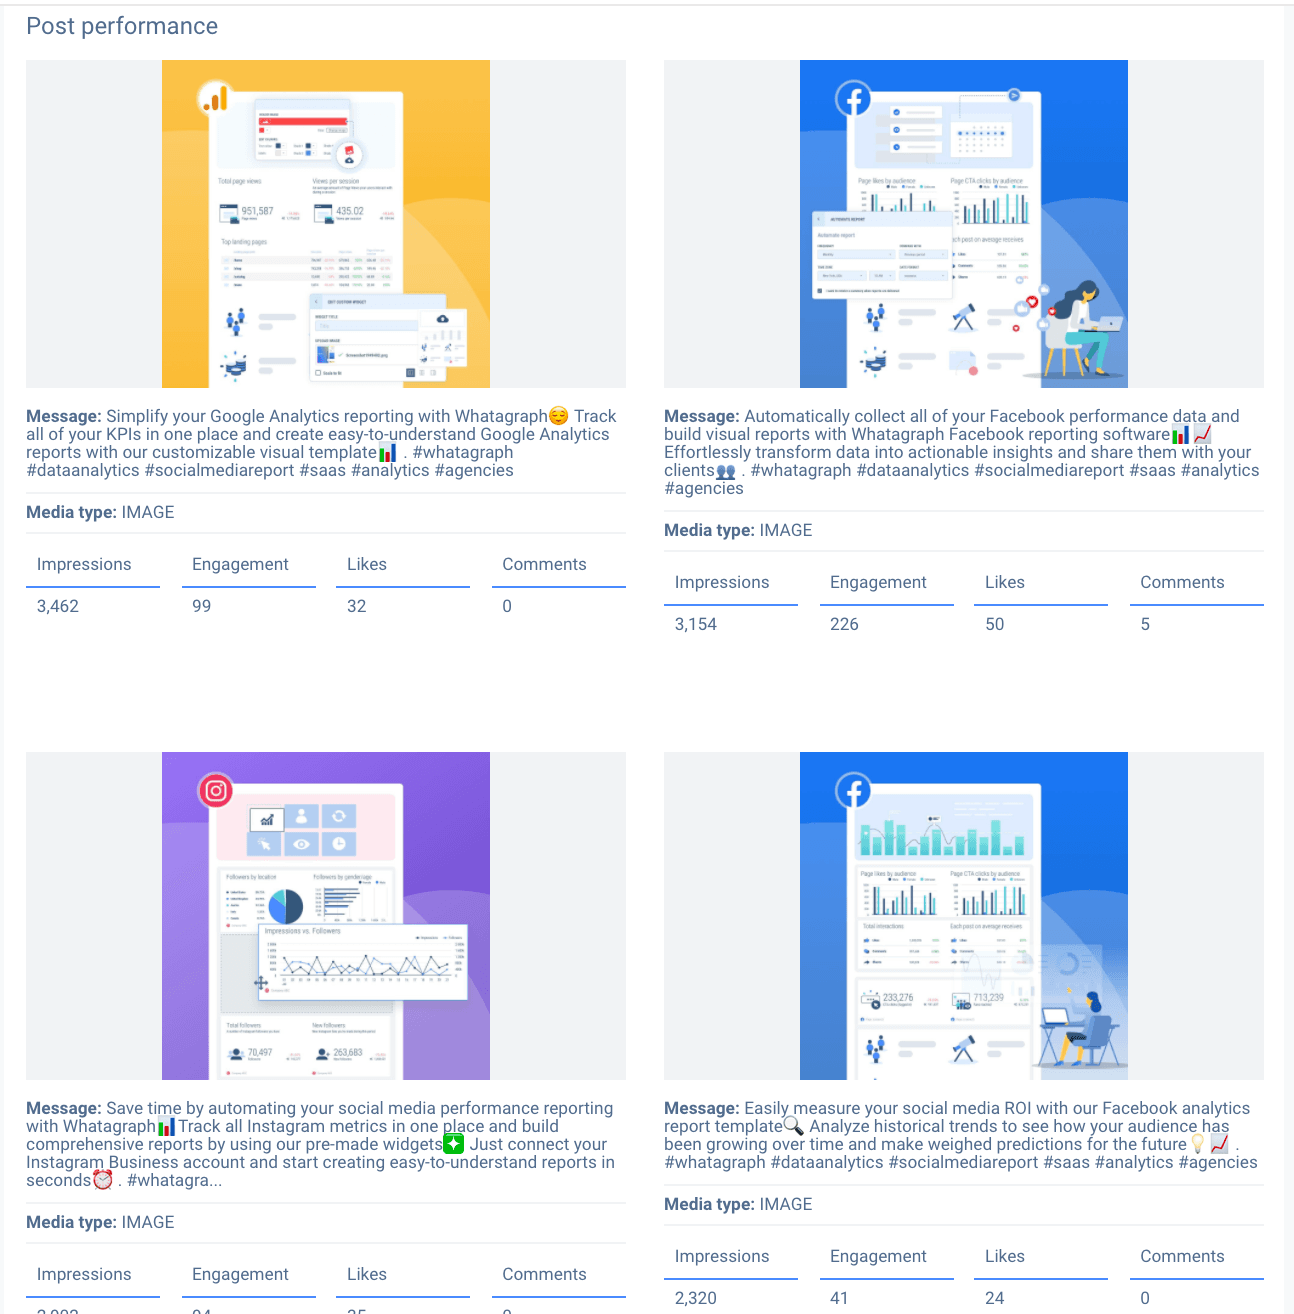
In the report, you can quickly deduce the types of content your audience prefers over others. An Instagram reporting tool such as Whatagraph will help you do that quickly.
If you want to get a more granular view of your content performance, take a look at the table that shows you your reach, follower count growth, the number of impressions, saves, and engagement rates per post.
You can use this data to:
- Further invest in content types and creatives that are performing well;
- Boost posts that are performing the best to get even more reach and engagement.
That's it – your analytics report is ready to be delivered!
We have finally come to an end - your 3 page Instagram Insights report is done and ready to go. You could also apply a similar process to other social media reports.
We covered the essential Instagram metrics - what they mean and what should be tracked - and what must be showcased in the report. These 3 pages are essential for effective data dissemination without overburdening your audience with unnecessary numbers that can create confusion rather than insight.
Whatagraph is the leader of Instagram analytics tools. If you'd like, try out our pre-built Instagram analytics report template for free. The report is already built for you - just connect your Instagram account and your data will be extracted automatically. Tweak and optimize and you're good to go. Enjoy!
Published on Jan 18 2021
WRITTEN BY
Mindaugas SkurvydasMindaugas is the SEO specialist at Whatagraph with experience in driving organic traffic and improving SERP visibility for industries like B2B martech, B2B and B2C finance. He loves to be at the edge of new developments by maintaining numerous contacts with other publishers in the SaaS niche. When he’s not writing he’s pushing our technical SEO strategies into implementation.