What Is a Report Generator
Using a valid, reliable report generator ensures a clean and consistent availability of information and eliminates the need to manually create reports.

Jun 22 2020●3 min read


After publishing your content, you’ll want to know some types of information about the action and habits of your visitors, such as their country of origin, their most visited pages, your views per day, and other types of information based on your business.
All this information can help you create strategic decisions to improve your business performance. But, creating your reports manually takes a lot of time and effort – a time you or your employees can spend on more important tasks.
However, automating the process with the right reporting tool can make things a lot easier. This is called report generation and is extremely beneficial for business users.
What is Report Generation
Report generation means using software to create marketing reports for clients or company stakeholders. To generate the report, you need to connect data sources, set organizational rules, select metrics you want to display, and choose the way you want to share it.
Report generation eliminates the need for manually creating reports, lowering the risk of errors, and allowing you or your employees to do what you do best – to analyze the data.
It uses a report generator – a tool that requires defining the report, including the type of data to retrieve, the location of data, and the method of displaying it.
This allows you to run a report with the report processor extracting the information with the given report definition and combining them with the report layout to produce the report.
Your reports can be previewed in the report generator tool, as well as published to the report server for sharing or administration in the future. After that, you can report the data to your team members, managers, or partners.
What Is a Report Generator?
A report generator is software used for report generation — the process in which reports are automatically created using insights from various data sources. You can present generated reports online or export reports to different formats that enable quick and easy sharing.
Companies have used Excel for generating reports for years, but a report generator is more professional and convenient, from data entry to data display. Even non-technical users can use it to retrieve data with a few simple clicks.
Features of a report generator include:
• Supporting retrieving data from various data sources and combining them;
• Exporting or printing the reports to CSV, PDF, Excel, images, and other document formats;
• Supporting access control, which means administrators can configure who gets access to the whole server, a single report, folders of reports, or specific cells;
• Allowing users to view the reports on the web and mobile anytime, anywhere.
Whatagraph report example: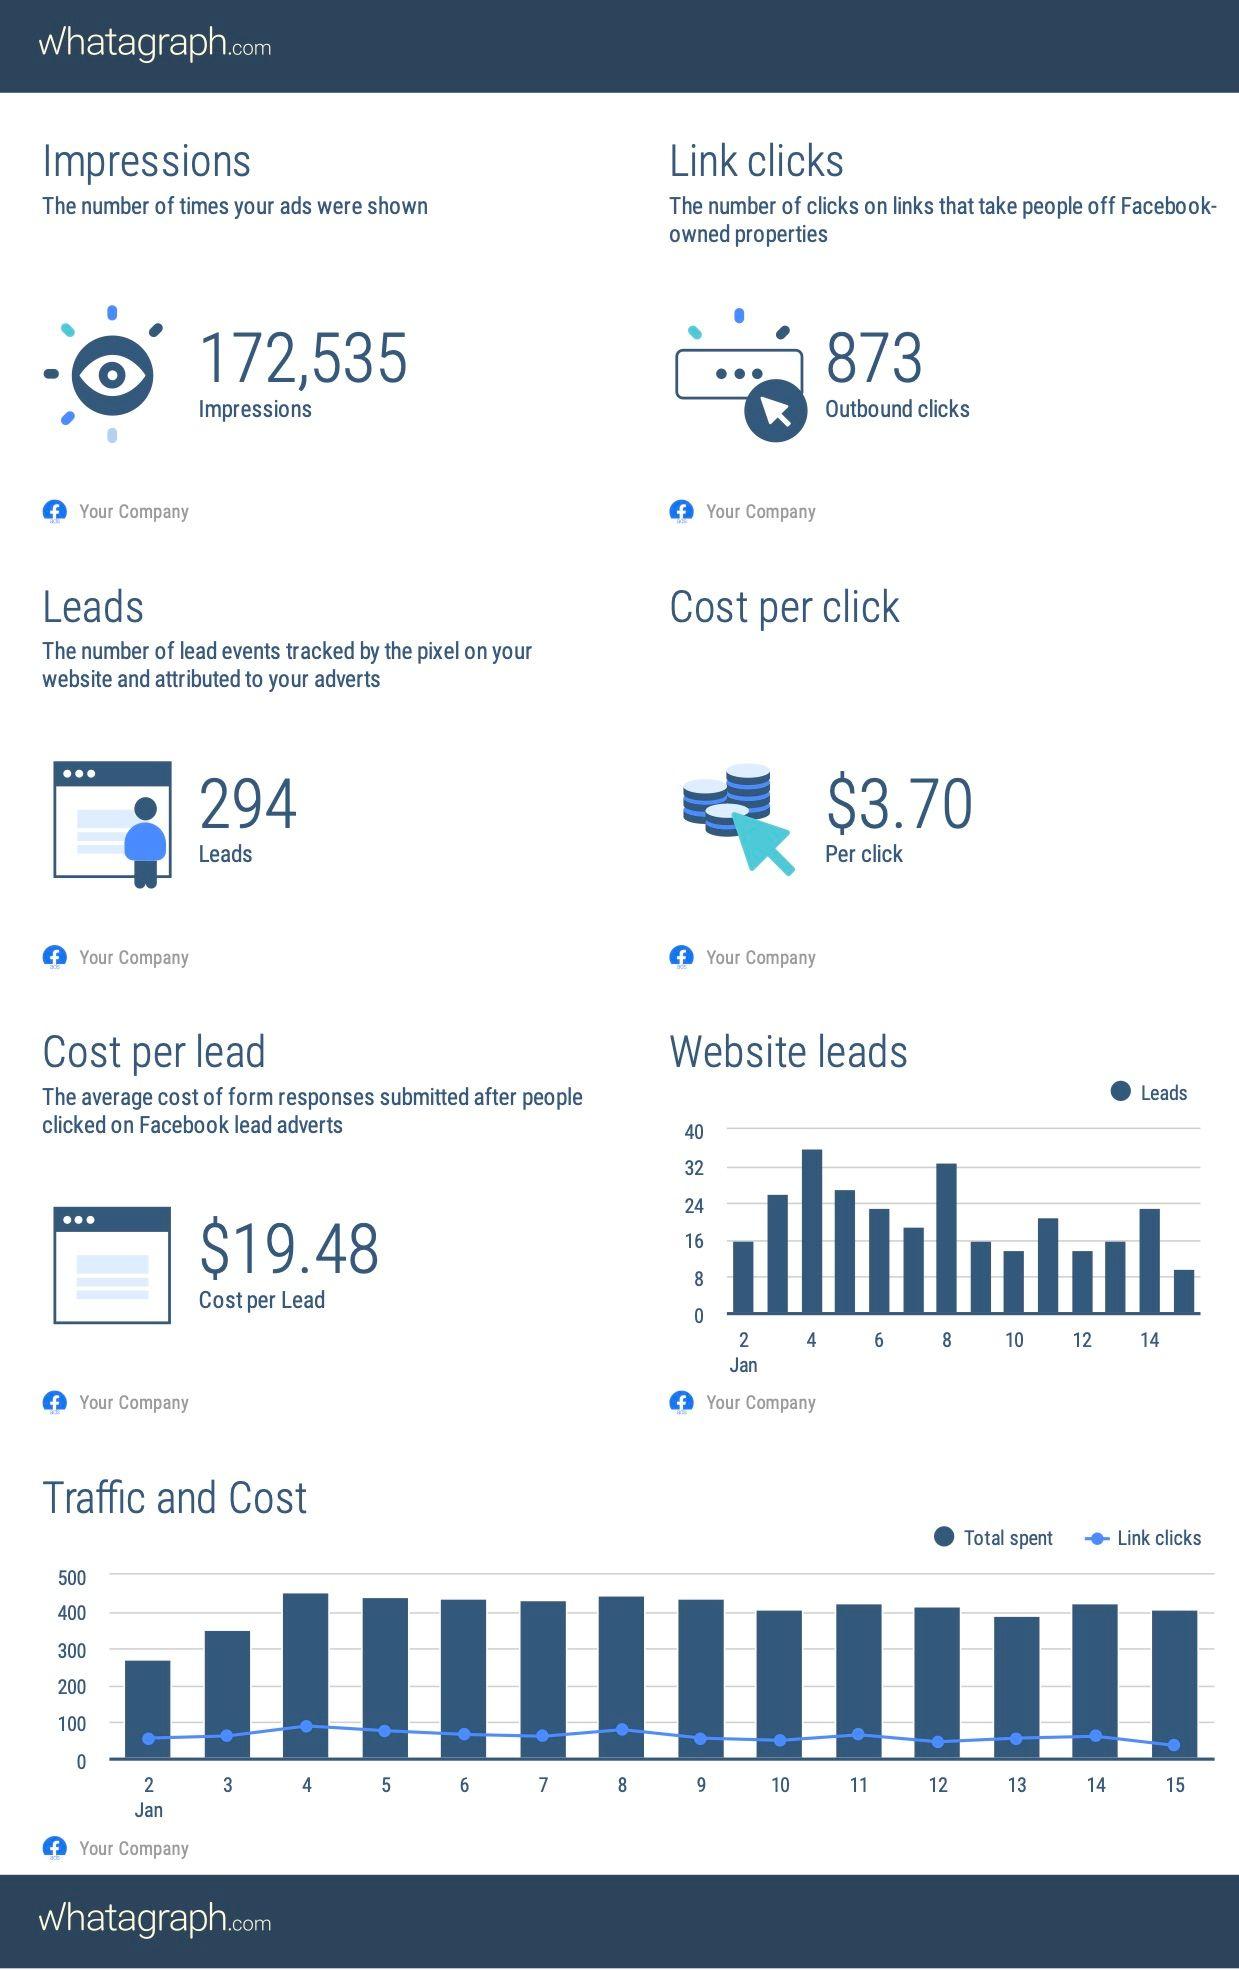
How to Generate a Report?
You can make your standard reports by setting specific criteria of who you would like to report on.
Today, there’s a wide range of report generator software that allows you to create clear and beautiful reports in minutes, such as the Whatagraph data reporting tool that lets you build reports for all areas of your business. Thanks to these tools, you can easily create reports using a drag and drop interface, without any coding.
With report generators, you can create reports using different charts like line, bar, column, doughnut, area, funnel, stacked charts, multi-series, etc. They allow you to see the latest information in real-time by updating automatically, which means no need to upload or sync data regularly.
After exporting the report in the appropriate format, you can securely share it with others.
Generally, there are two ways to generate a report, full-automatic report generation, or semi-automatic report generation.
Full-automatic generation uses tools that usually have convenient and attractive built-in templates that save valuable time. It requires connecting to the database and dragging the data to the appropriate cell.
Semi-automatic generation is more common than full-automatic report generation and can better meet your personalized needs.
In general, the complete process of creating a report is divided into three steps:
• Connection to database – including opening designers, configuring data sources, designing a new report, and configuring private data sources.
• Report design – including generating new reports, specifying data sources, binding data columns, summarizing, and formatting reports.
• Publishing and browsing reports – including viewing, saving, and publishing reports.
Conclusion
Report generators connect with data sources, collect information, and offer insights in the form of charts or graphs based on the input data so that you can find useful and meaningful information.
These tools provide detailed insights and more visibility over data which helps users make better-informed decisions. They present data clearly and attractively, thus making it more presentable, readable, and useful. After building the report, you can extract it in the appropriate format and share it with whomever it may concern.
A report generator makes things simpler for almost all types of businesses.
Published on Jun 22 2020
WRITTEN BY
Gintaras BaltusevičiusGintaras is an experienced marketing professional who is always eager to explore the most up-to-date issues in data marketing. Having worked as an SEO manager at several companies, he's a valuable addition to the Whatagraph writers' pool.