The Ultimate Guide to Sales Analysis
Any business that wants to grow, improve, and just generate revenue needs to have good sales numbers. Sales are one of the KPIs, and lots of sales performance metrics are crucial for business intelligence. Since an optimized sales process can lead to more closed deals, more efficient sales teams, and a more impactful sales strategy, performing sales analysis is essential for facilitating these goals.

May 03 2021●9 min read


Here we will go over why sales data analysis is important, different types of sales analysis, how to perform sales analysis, and generate sales reports. Hopefully, this will help your product sales and sales goals, and it will give you some ideas on how to organize your sales team within the company.
What Is Sales Data Analysis
Sales analysis is a complex process of examining sales data. It is then followed by a drill-down analysis for a better understanding of both successful and less successful sales efforts, in order to make better business decisions. It is also about generating sales reports and tracking sales performance across different channels and throughout different time periods.
The obtained information is used to create new theories on how to increase the revenue of your company, and how to improve the performance of your sales team. In other words, the idea is to get overall results, break them down into different time frames, and examine them within different contexts, to gain accurate business intelligence.
Importance of Sales Analysis
The importance or benefits of product sales analysis really all boils down to insight. You get the information on your monthly/weekly/daily revenue, the number of goods sold for that month or per week, how does it compare to last year, or how it compares to estimates or sales projections. Of course, it does not sound too impressive like this, but believe it or not, this can tell you a lot.
First of all, you have a realistic picture of what to expect when it comes to future product sales. Second, you can isolate the data where the sales numbers were at the lowest, and figure out whether that had to do with you, or other external factors. You get to know which marketing campaigns are with investing in, or where you can cut costs.
There are really lots of sales metrics that you need to look into, and we will address them later on. In general, the main benefit is going to be better business decisions, which on its own speaks volumes of the importance of sales analysis.
How Sales Team and Sales Reps Benefit from It
When it comes to your sales team and sales reps the sales analysis will tell you a lot of useful things.
- They can figure out which demographic is more responsive to your product. They can then target specific age groups, or specific regions, etc. In other words, you get a better understanding of the target audience profile.
- They know where not to focus their efforts or how to adjust their sales pitch. So long as the sales team is focused on the right demographic, the sales numbers will go higher. Moreover, maybe they did not present the strengths of your product or service adequately to a different target audience, so a change in sales pitch might improve the sales numbers on those demographics that were underperforming.
- It will help them isolate more relevant sales channels. Your target customers might act differently depending on the approach. Some trust email marketing, others SMS marketing, there are those who prefer to talk directly via phone, or simply chat on social networks. Knowing which of these approaches generates the best results, helps the sales team and sales reps focus on those channels.
Different Types of Sales Analysis
Basically, there are 4 main types of sales analysis and these types, or sales analysis methods, are used in conjunction with one another.
Sales trend Analysis
This is one of the sales analysis methods that rely on historical data in order to compare increase and decrease in revenue and detect patterns. It is also used to check if the company successfully meets its goal.
The idea is to compare the current month with previous months, as well as to compare those same time frames to last year's performance. If things have taken a turn for the worse, it implies you need to come up with a new strategy.
Sales performance analysis
The goal of sales performance analysis is to create a sales report that tells you how your company is performing currently. Additionally, it needs to show how it needs to perform in order to meet the sales goals.
Sales pipeline analysis
Sales pipeline analysis is all about monitoring the conversion rate of potential customers in your sales pipeline. It tracks the number of prospects that reach the finish line or make the purchase and the number of those that change their mind and don't go through with the purchase. In other words, it helps you identify gaps in your approach to sales.
Predictive sales analysis
This sales analysis method is commonly used with pipeline analysis since it analyzes users' behavior and helps determine who among these prospects is likely to become a new customer. Moreover, it detects relevant user groups, so that you can focus on onboarding those leads who are more likely to become customers in the future.
Typically businesses use different analytical tools or data visualization tools in order to generate these sales analysis reports.
A tool like Whatagraph is a good example, as it can be integrated with different sales channels and marketing platforms, and then collect the data in order to generate the report. It's all about visualizing KPIs and providing relevant analytics, and Whatagraph really shines in this department. You can also use sales force, as it boasts some robust features, but it's not as nearly as user-friendly. Example below: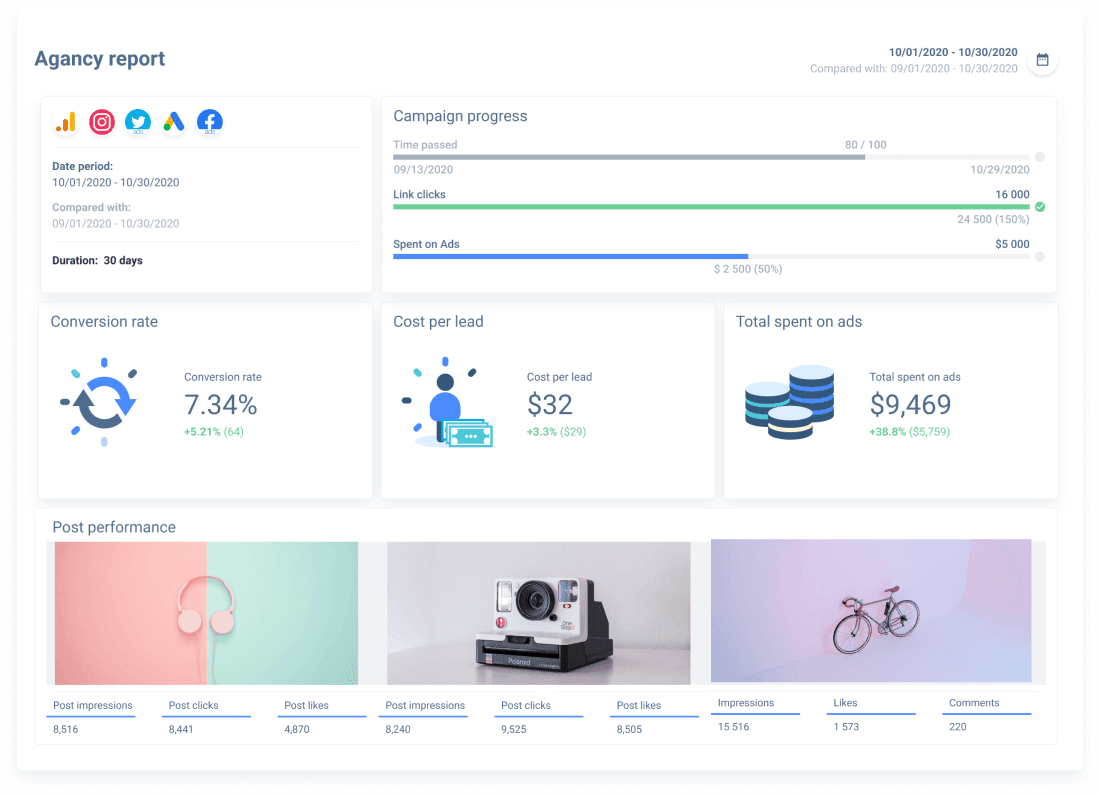
How to Perform Sales Analysis
Here we will go over an example of how to perform sales analysis and what you will need in order to do so. For starters, you will have to determine what you wish to track or which type of sales analysis report you wish to generate. Moreover, do you wish to focus on overall sales numbers or perhaps on your top-selling product?
Let's say you want to do a sales performance analysis for one of your products. You need to isolate a dataset that is only related to that product and export the daily/weekly/monthly sales numbers from its release until the current date. When you have a whole timeline isolate those segments that had really high sales and those when the product underperformed.
Now try to get more context for each of those periods.
- Was the product recently released at that time
- Did you have an active social media or email sales campaign
- Who was the focus group of the marketing campaign
- Was it a period when you offered discounts
- Do low or high sales number occur during the first, second, or third week of any given month
- Do sales number have anything to do with holidays
- How many people were on your sales time at those times
- How experienced were your sales team
- How many products you were competing with during those time frames
The idea is not just to look at the analysis independently but to use that feedback with the potentially relevant context in order to formulate theories on what to do, or what not to do. A sales report on its own just tells you the outcomes, but you need to figure out what is the best course of action. This is why having a data pipeline and analysis tools is so important, it can help you get more context regarding the phenomenon you wish to analyze.
Once you have a sales report and analysis report on other KPIs, you can present those to the stakeholders. So long as they have multiple relevant factors, their decision-making capabilities will drastically increase.
Relevant Metrics
In order to perform accurate sales analysis and create realistic sales goals, you should make sure that you keep an eye on the following metrics:
- Monthly sales performance - Let's you know whether your sales numbers are going up or down, compared to the previous months or years.
- Sales opportunities - Lets you know how many leads are in the sales pipeline or the number of opportunities sales teams generate. It can be also used to predict how likely any of those leads are to actually make the purchase.
- Lead conversion rate - This tells you the percentage of leads that are converted to sales, and in a way showcases how the sales teams are performing.
- Average conversion time - This tells you the length of the onboarding process or how long it takes for a lead to become a customer.
- Sales targets - This metric relies on historic data and team performance data in order to generate realistic goals for sales and revenue growth.
- Customer lifetime value - This sales analysis metric lets you know the average lifetime of a customer or how much money an individual is likely to spend over that period of time. If you have good loyalty programs the lifetime and frequency of shopping are likely to be higher, therefore each customer will help you generate more revenue.
- Monthly expenses - Finally you need to be up to date with your upkeep costs, and knowing where you can cut costs, also helps generate revenue on a monthly basis.
There are multiple other metrics that you can also follow or regard as your KPIs, but they will depend on the type of business you are running. Some can be only valuable for e-commerce business owners, others for subscription-based services, etc.
FAQ
What is a sales analysis report?
A sales analysis report is a detailed overview of your sales activities. It shows sales trends, the conversion rates of your leads, the number of leads in the pipeline, historic sales data, average time of onboarding a new customer, and performance of sales team members. It also helps you set realistic goals, identify unnecessary costs, or less effective sales techniques and channels.
What do you mean by sales analysis? Explain with a suitable example?
It means collecting the data that pertains to the effectiveness of your sales team and then comparing that data with your sales goals, in order to gauge if your financial projections were accurate. For example, based on the number of sales you had during the same month last year, and based on an average increase in sales number recently, you project that the revenue you will generate from sales in the next month will be 30% higher than last year. This calculation is often done with an aid of a data analyst or a tool that you use to aggregate and analyze data.
If you do another analysis only after the first week of the month and see that at the same rate you will not meet the goal, you might have to make a decision on a new strategy in order to be successful. This can include means of how to reduce the conversion time of leads in the sales pipeline, launch an ad campaign, or cut some costs in order to increase the revenue for that month.
How do you analyze sales forecasts?
To do a sales forecast you typically need to analyze or examine multiple factors. In general historic data is used to set the bottom line in terms of expectations. Then you add other variables like customer lifetime value, sales trend analysis, average conversion time, the recent average performance of the sales team, product reputation, as well as any other metric that you have identified as relevant (eg. holiday, discount, target ads, etc.).
You can use a tool that has an algorithm for calculating sales performance, and that is preferably customized to do that for your business model. Then you need to set a specific time period for which the analysis is going to be performed, and the software should give you realistic outcomes, or sales goals.
Published on May 03 2021
WRITTEN BY
Indrė Jankutė-CarmaciuIndrė is a copywriter at Whatagraph with extensive experience in search engine optimization and public relations. She holds a degree in International Relations, while her professional background includes different marketing and advertising niches. She manages to merge marketing strategy and public speaking while educating readers on how to automate their businesses.