


What Should an SEO Analysis Report Template Contain?
The best SEO progress report template should be easy to read and help your team understand how your website is doing in search engines.
In Whatagraph’s sample SEO report template, we included four main tabs:
- Performance Summary
- Organic Visibility
- Organic Traffic
- Organic Conversions
Whatagraph’s website SEO report template is designed to not only give the full picture of your website performance to stakeholders but also to show the impact of SEO on the bottomline. It visualizes:
- Organic search traffic
- Keyword rankings
- Conversion rates
- Leads and conversions
- Bounce rates
…and more.
Want to skip templates entirely? You can create a SEO report from scratch with AI on Whatagraph. See how Ben Goodey, Founder at Spicy Magarita SEO agency did it here:
That being said, let’s look into the SEO report template in detail:
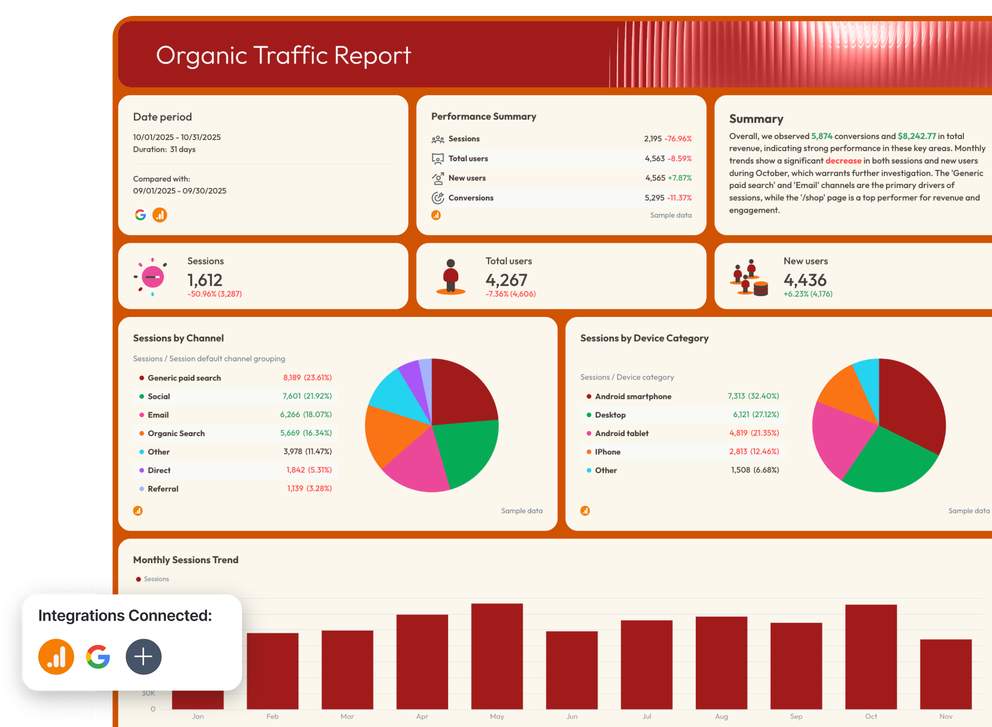
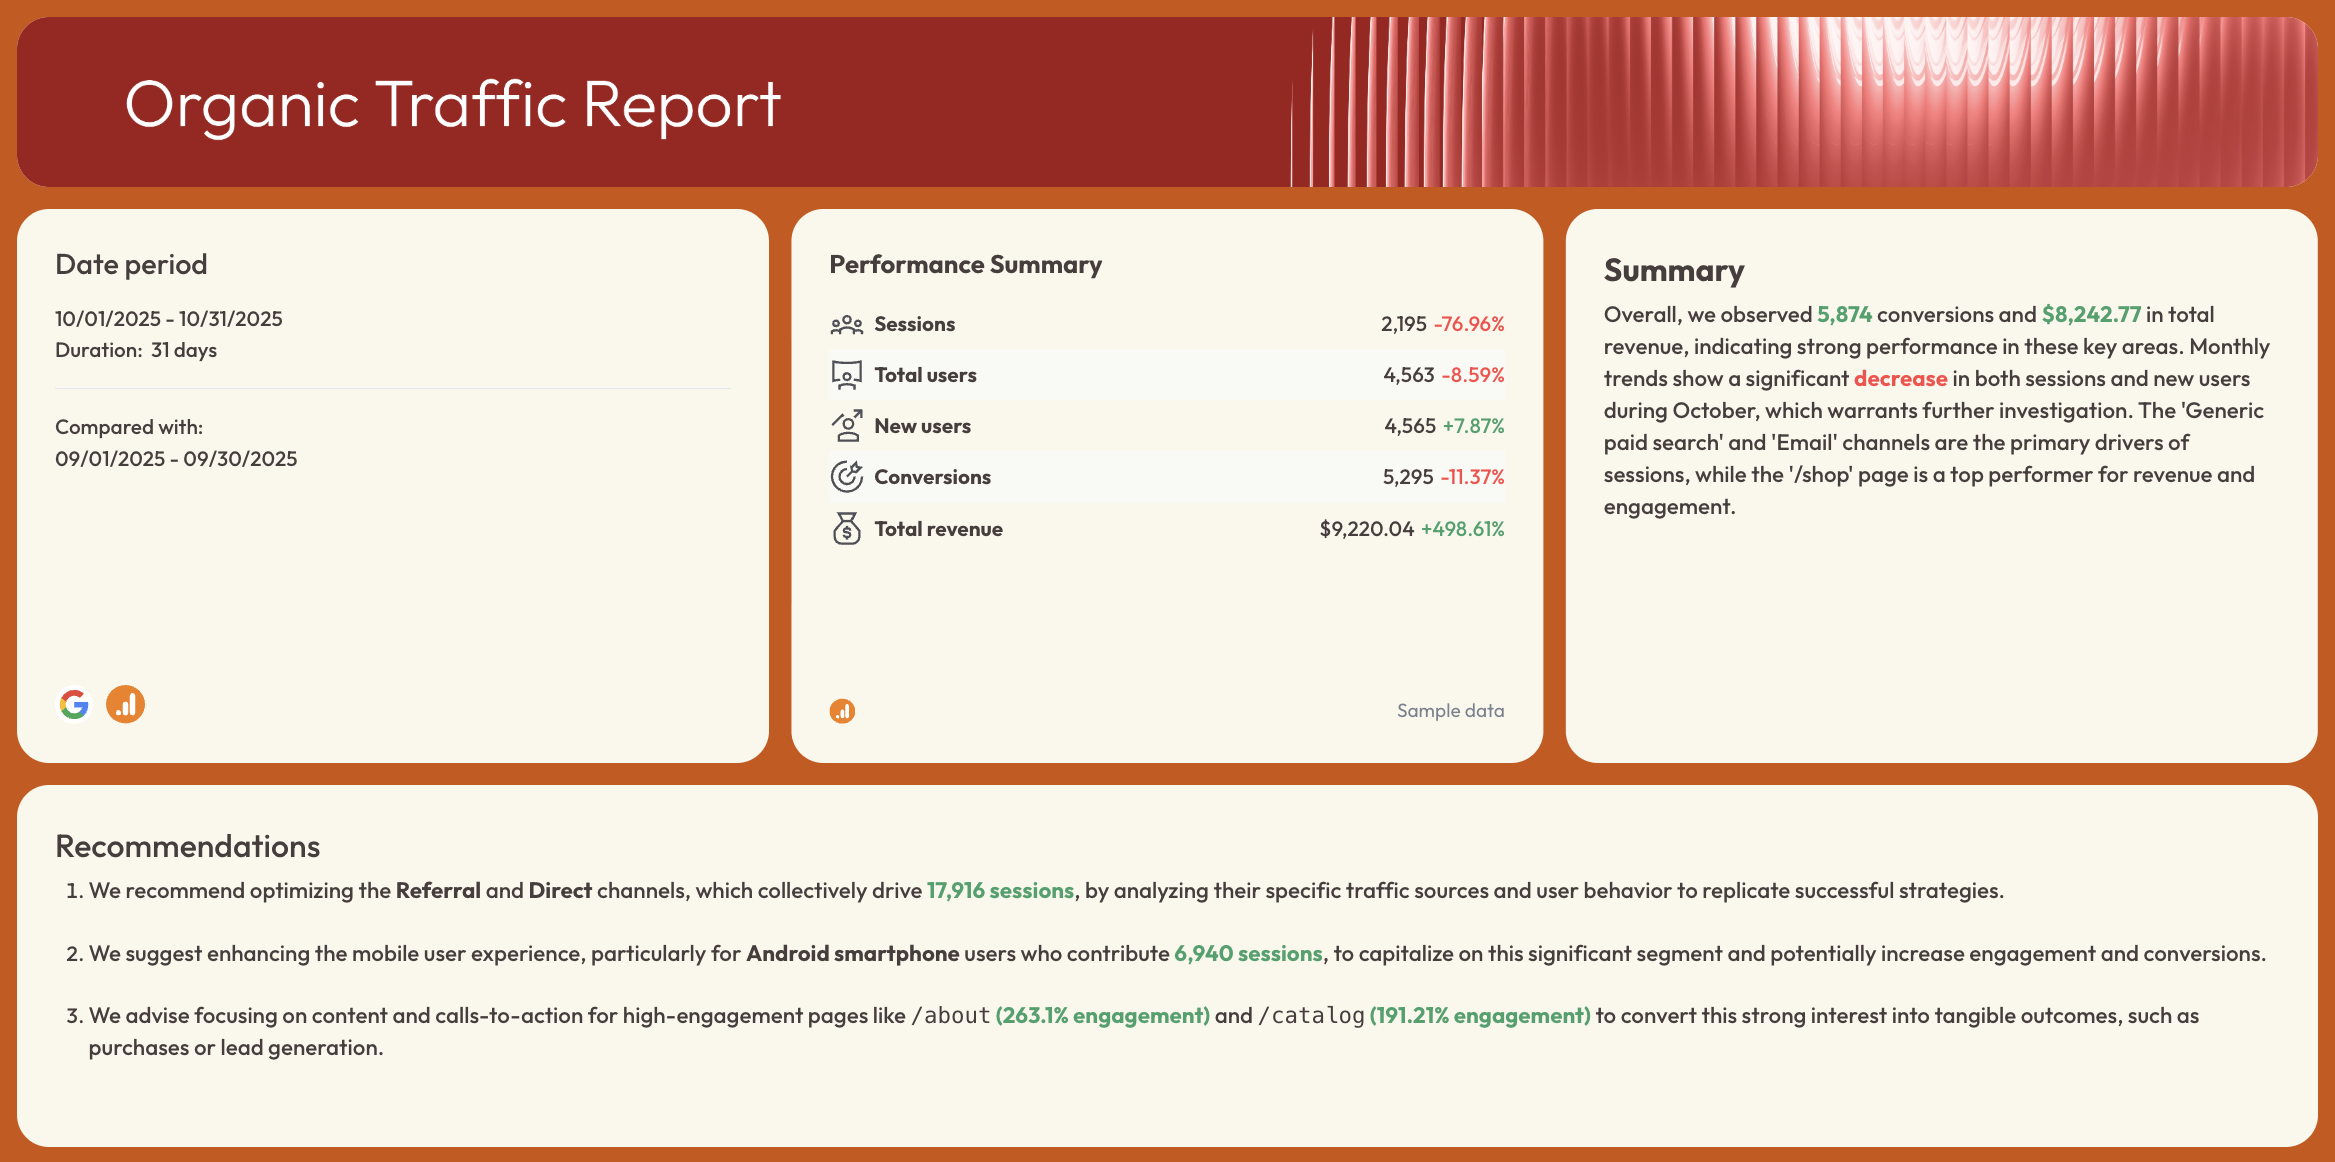
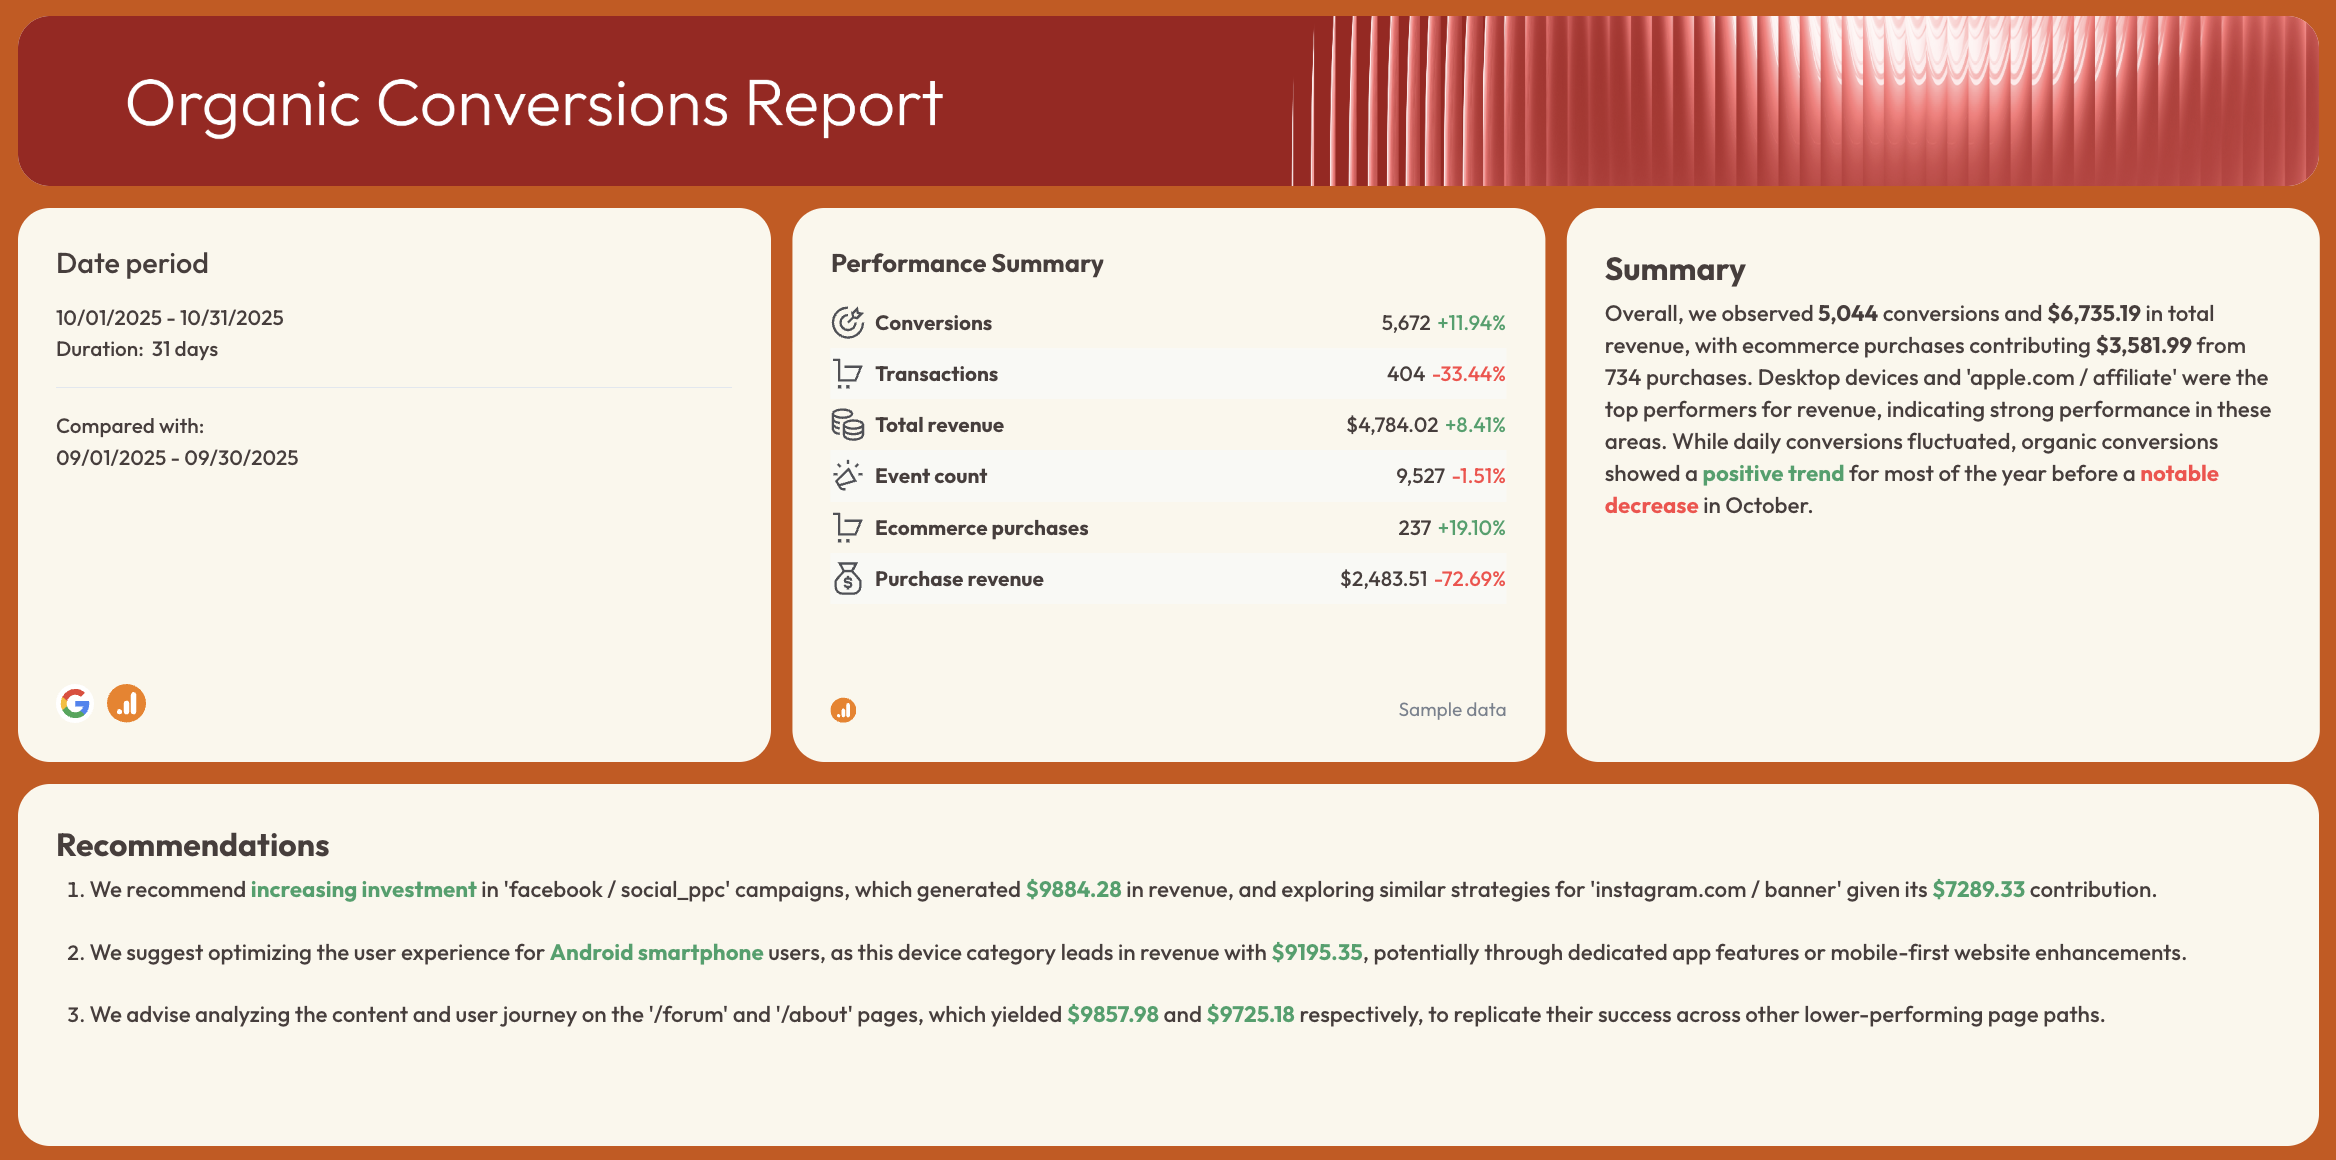
1. Performance Summary Tab
The Summary tab gives an overview of what’s going on with your search engine optimization efforts to stakeholders without overwhelming them with the specifics.
It should include:
- Date period you are reporting on
- A summary list showing all the KPIs for that date period + a comparison with the previous month
- Performance summary written with Whatagraph IQ based on your real SEO data – no need to write it yourself manually
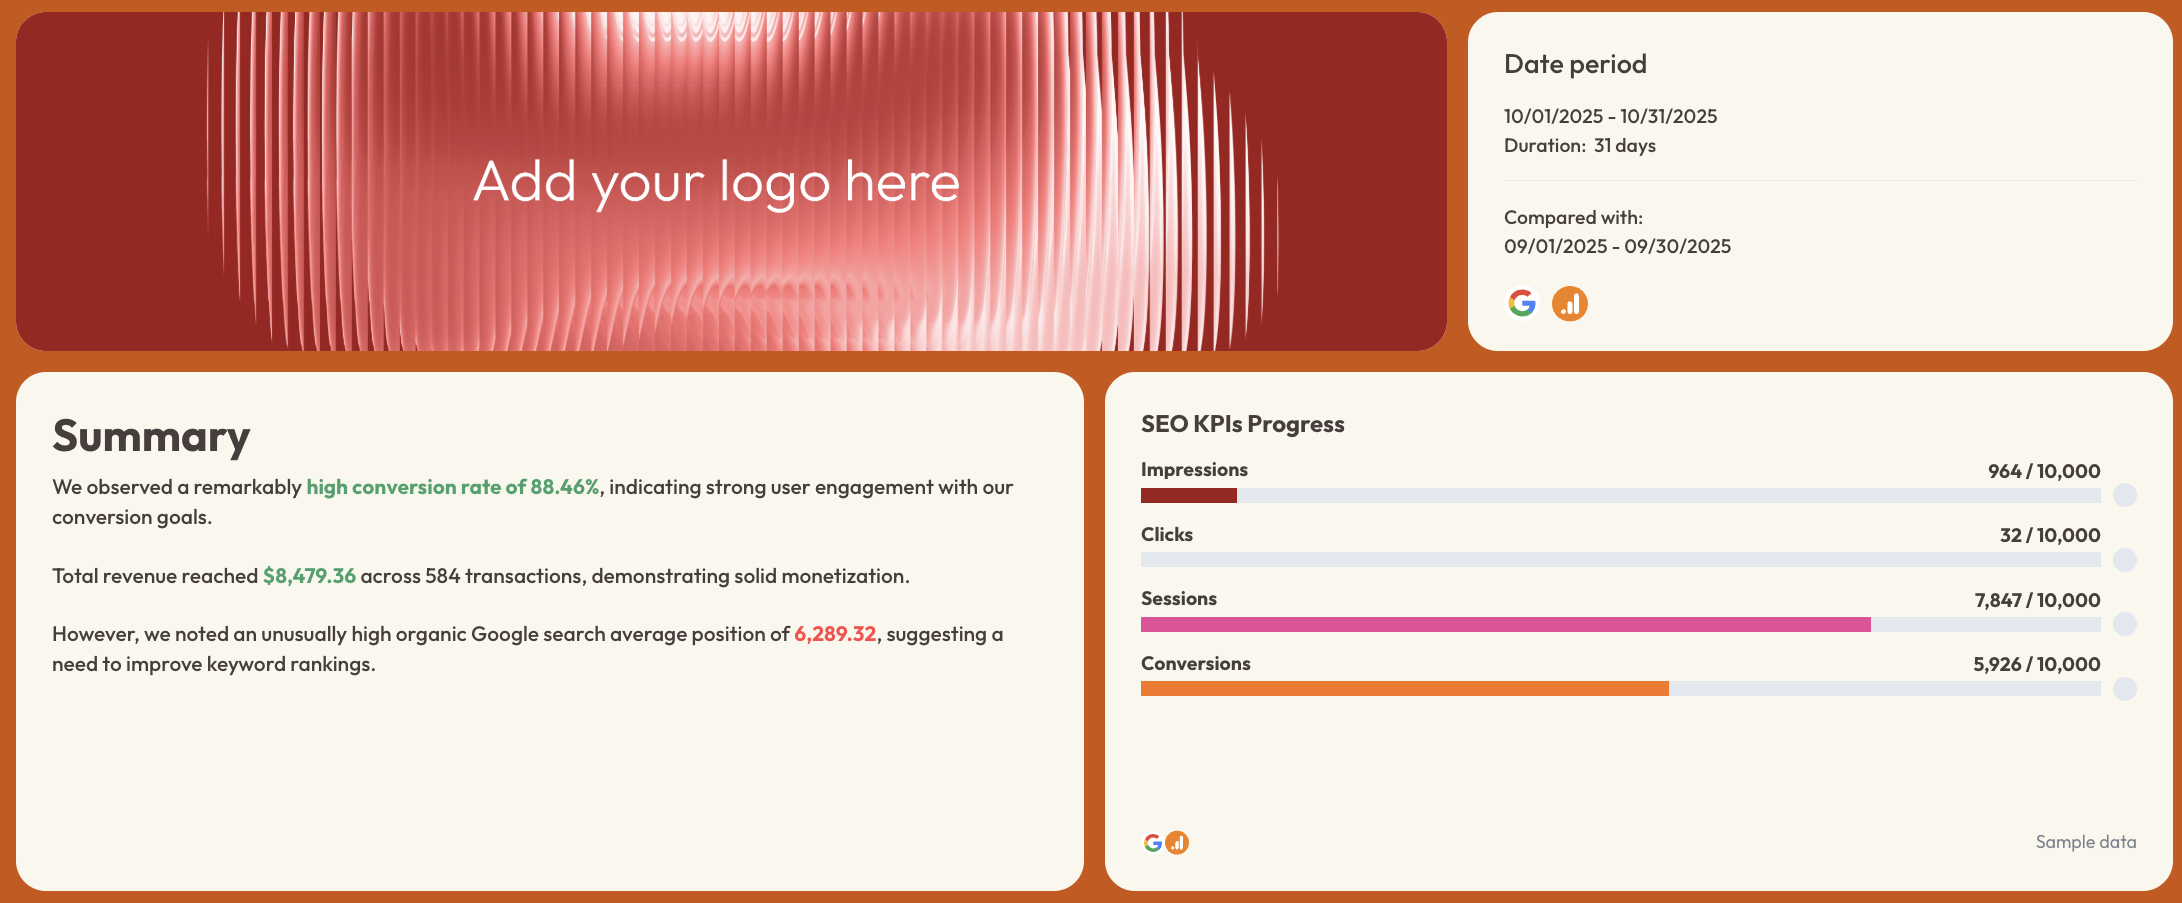
- Single-value widgets showing the most important SEO KPIs like:
- Sessions
- Impressions
- Clicks
- Total users and new users
- Keyword rankings
- Conversions
- Recommendations: Short notes on what to fix, what to improve, and what to do next to help your SEO strategy.
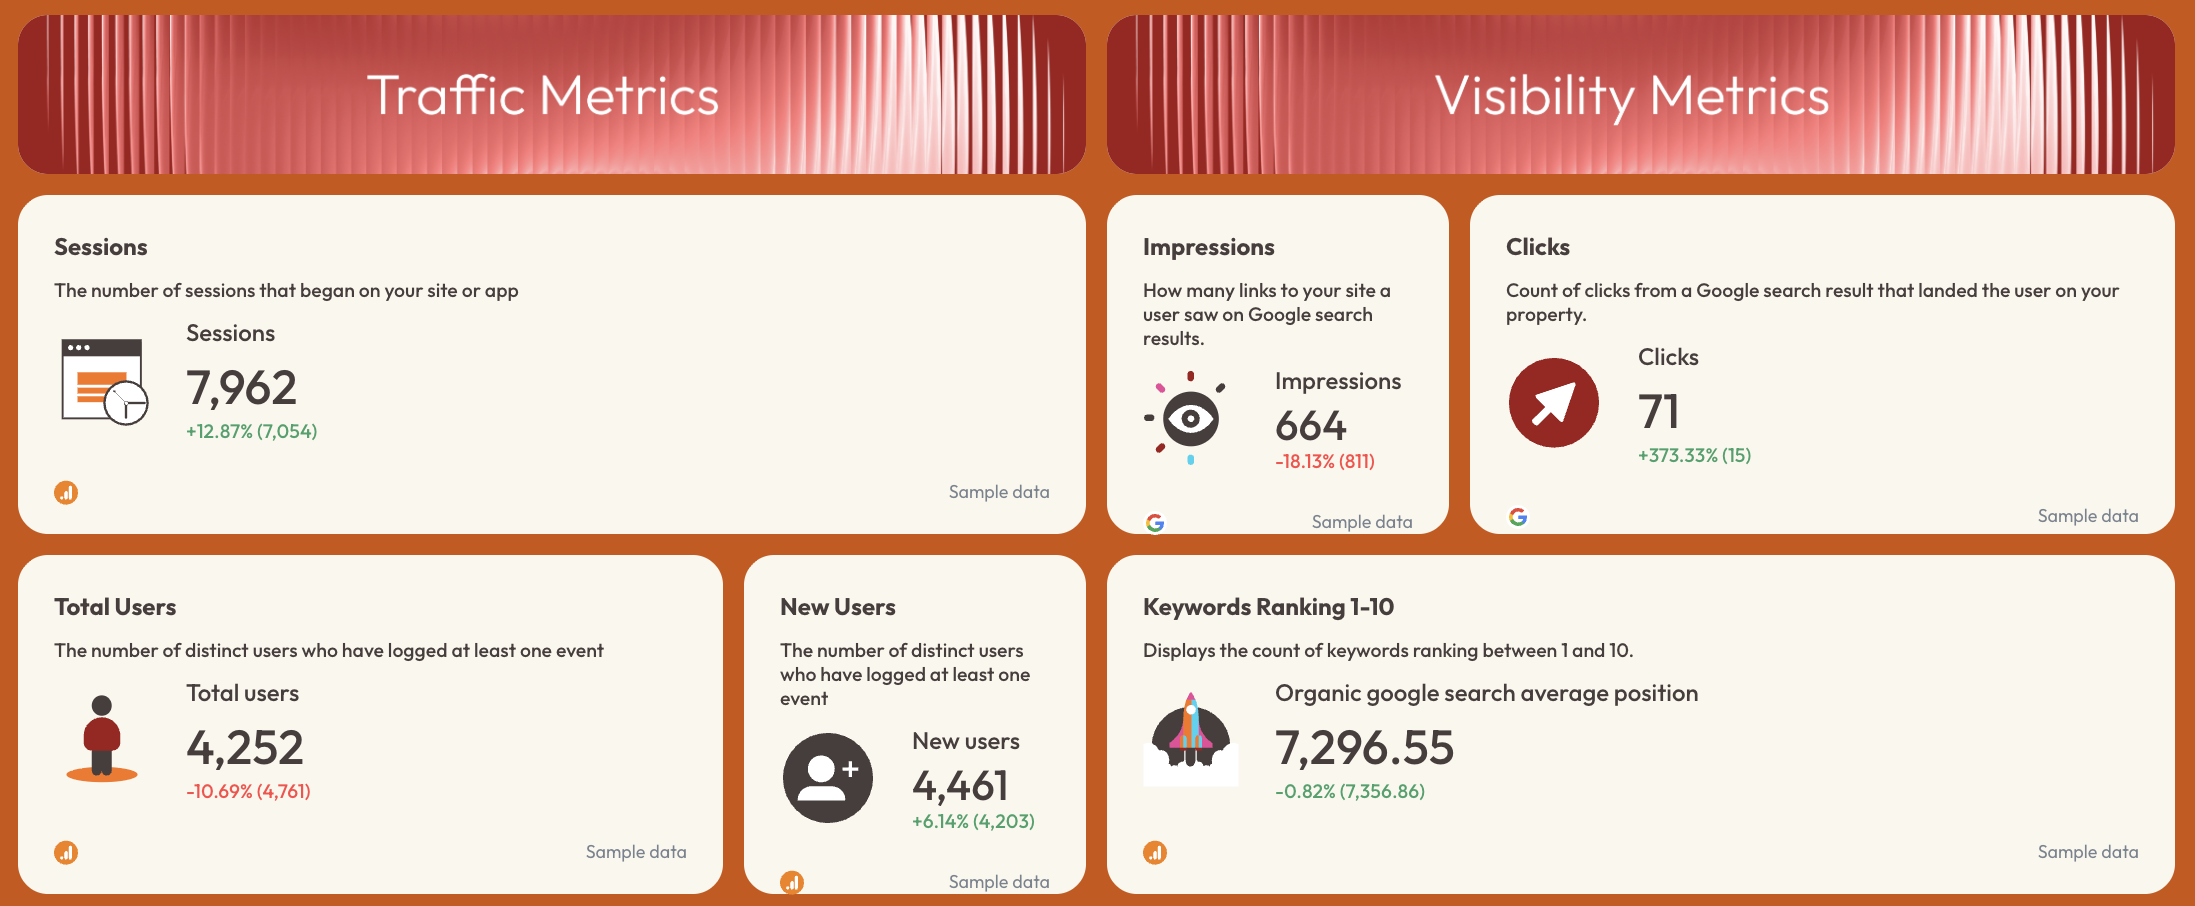
2. Organic Visibility Tab
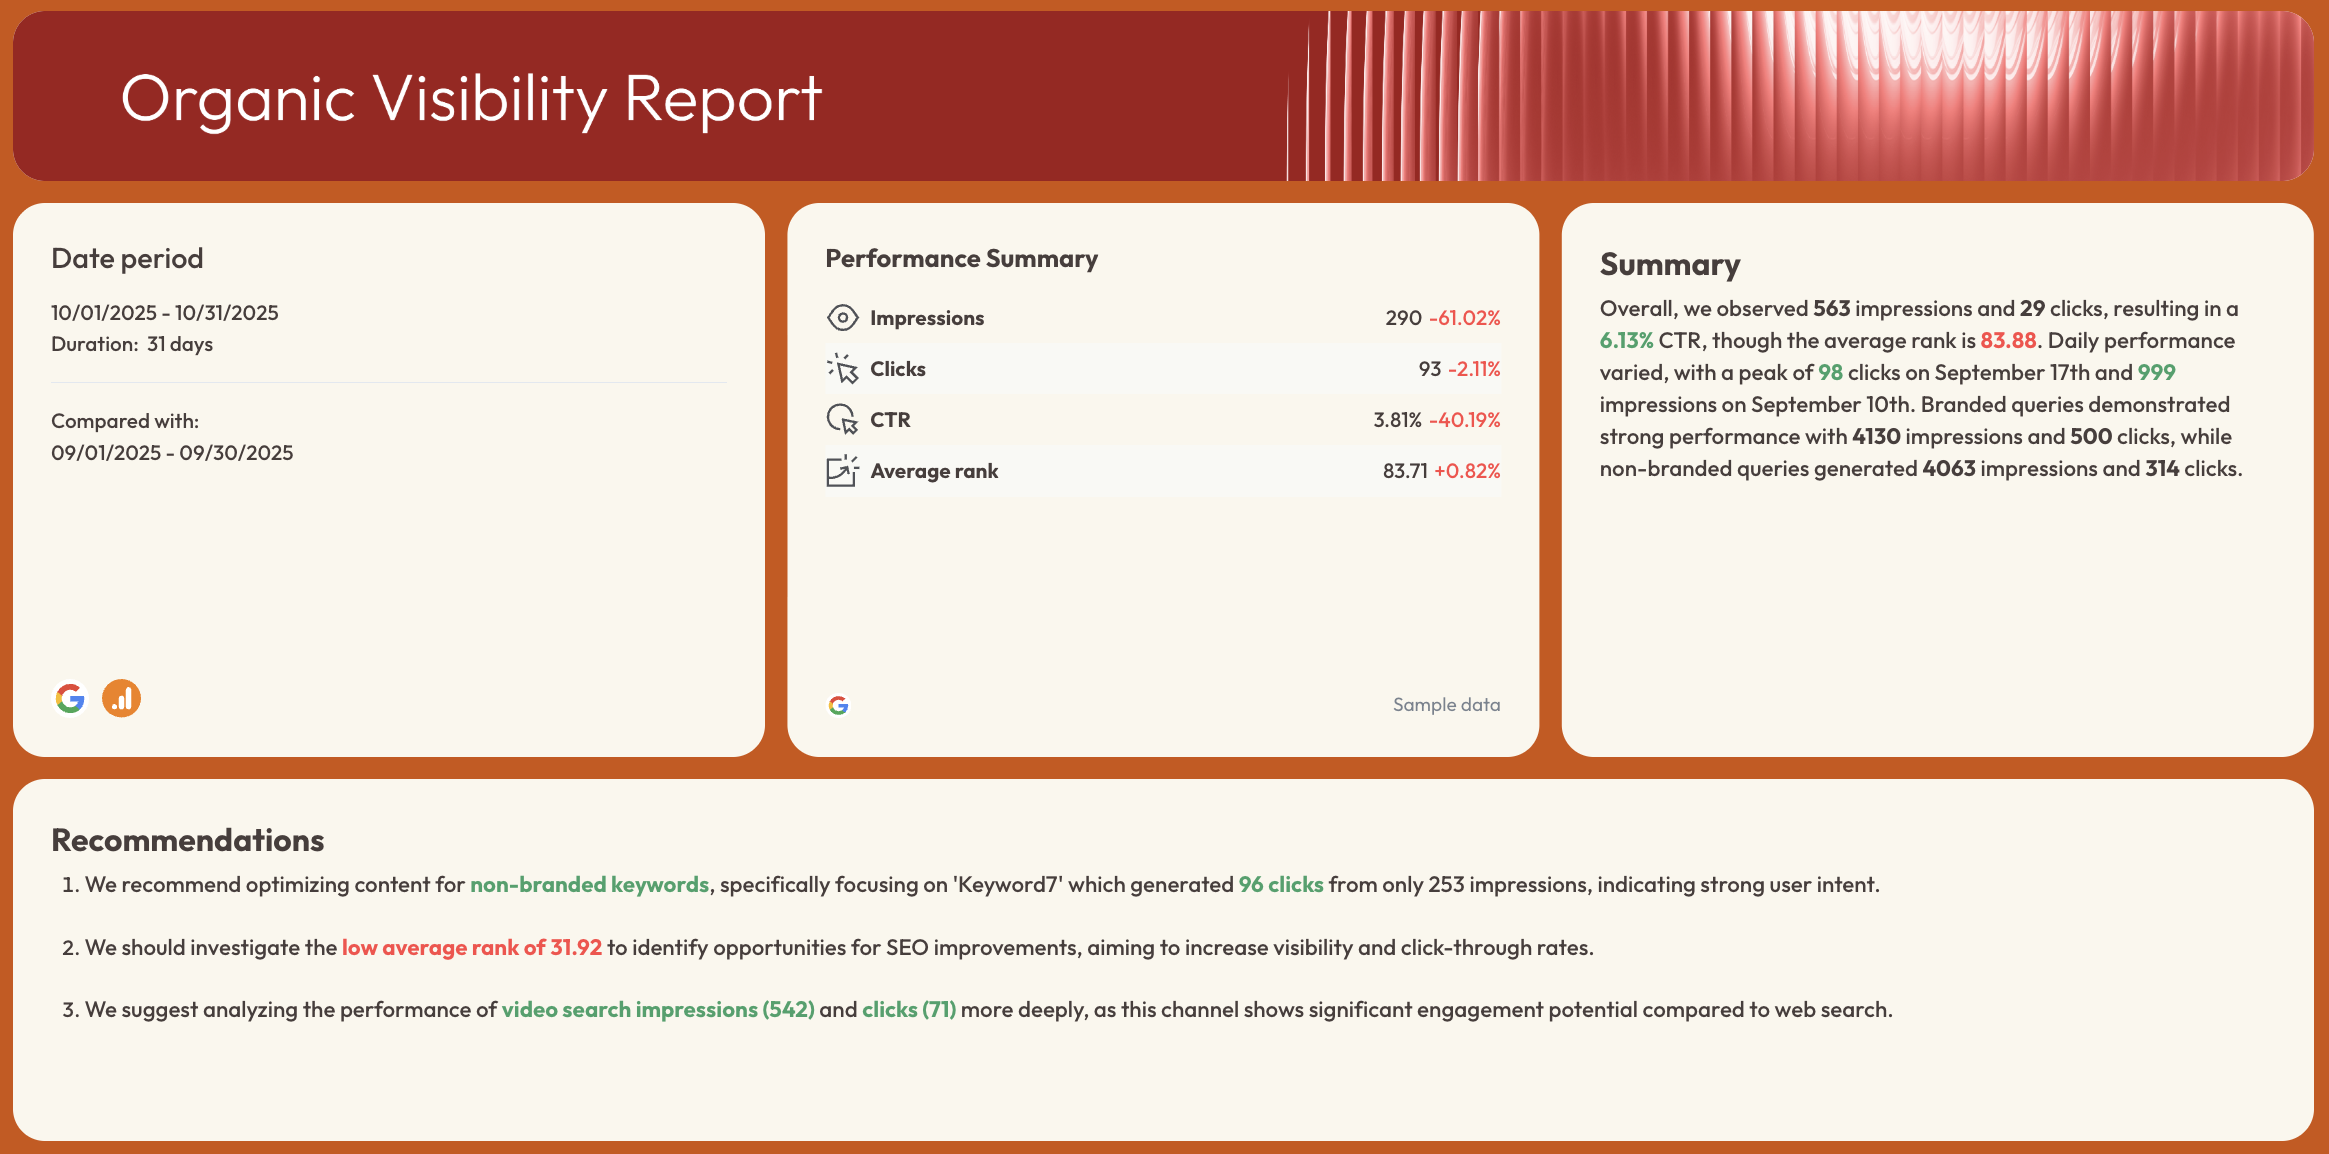
This tab shows how well your website appears in search engines.
It should include:
1. Visibility Summary
Key metrics from Google Search Console (GSC) such as:
- Impressions
- Clicks
- CTR
- Average position
These help you see how often people see and click your website in Google.
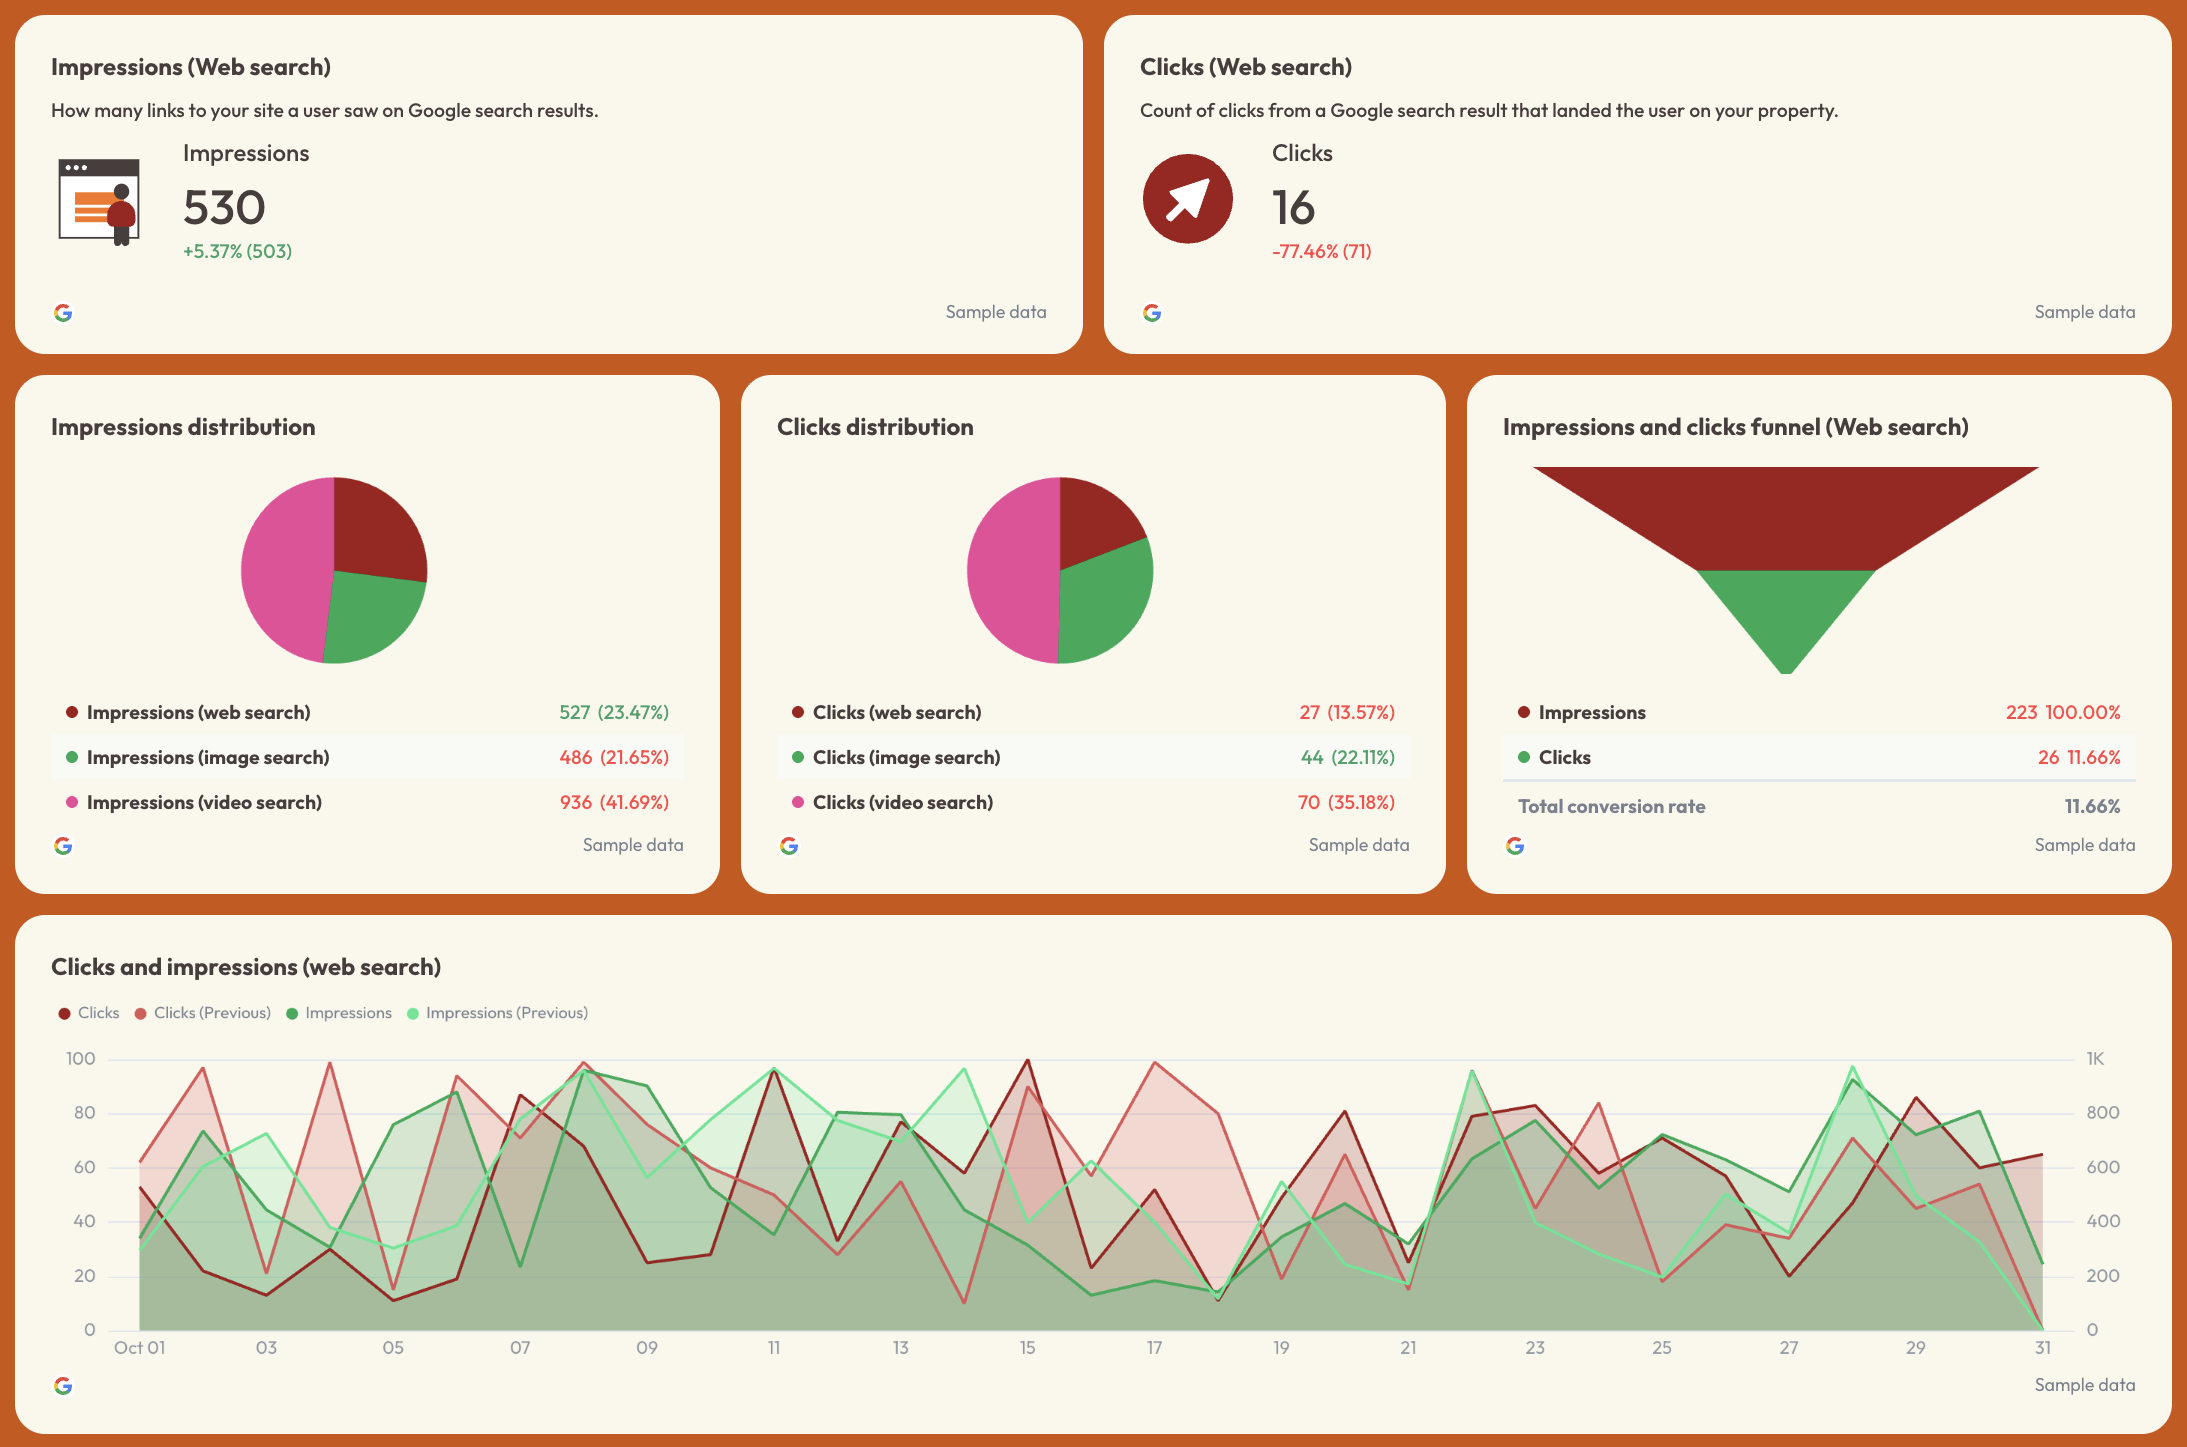
2. Daily Impressions and Clicks
- A simple line graph showing how these numbers change each day. This makes it easy to spot patterns.
3. Search Funnel
A chart that shows:
- Impressions
- Clicks
- Click-through rate
This helps you see how well your pages turn views into clicks.
4. Keyword Tables (Branded and Non-Branded)
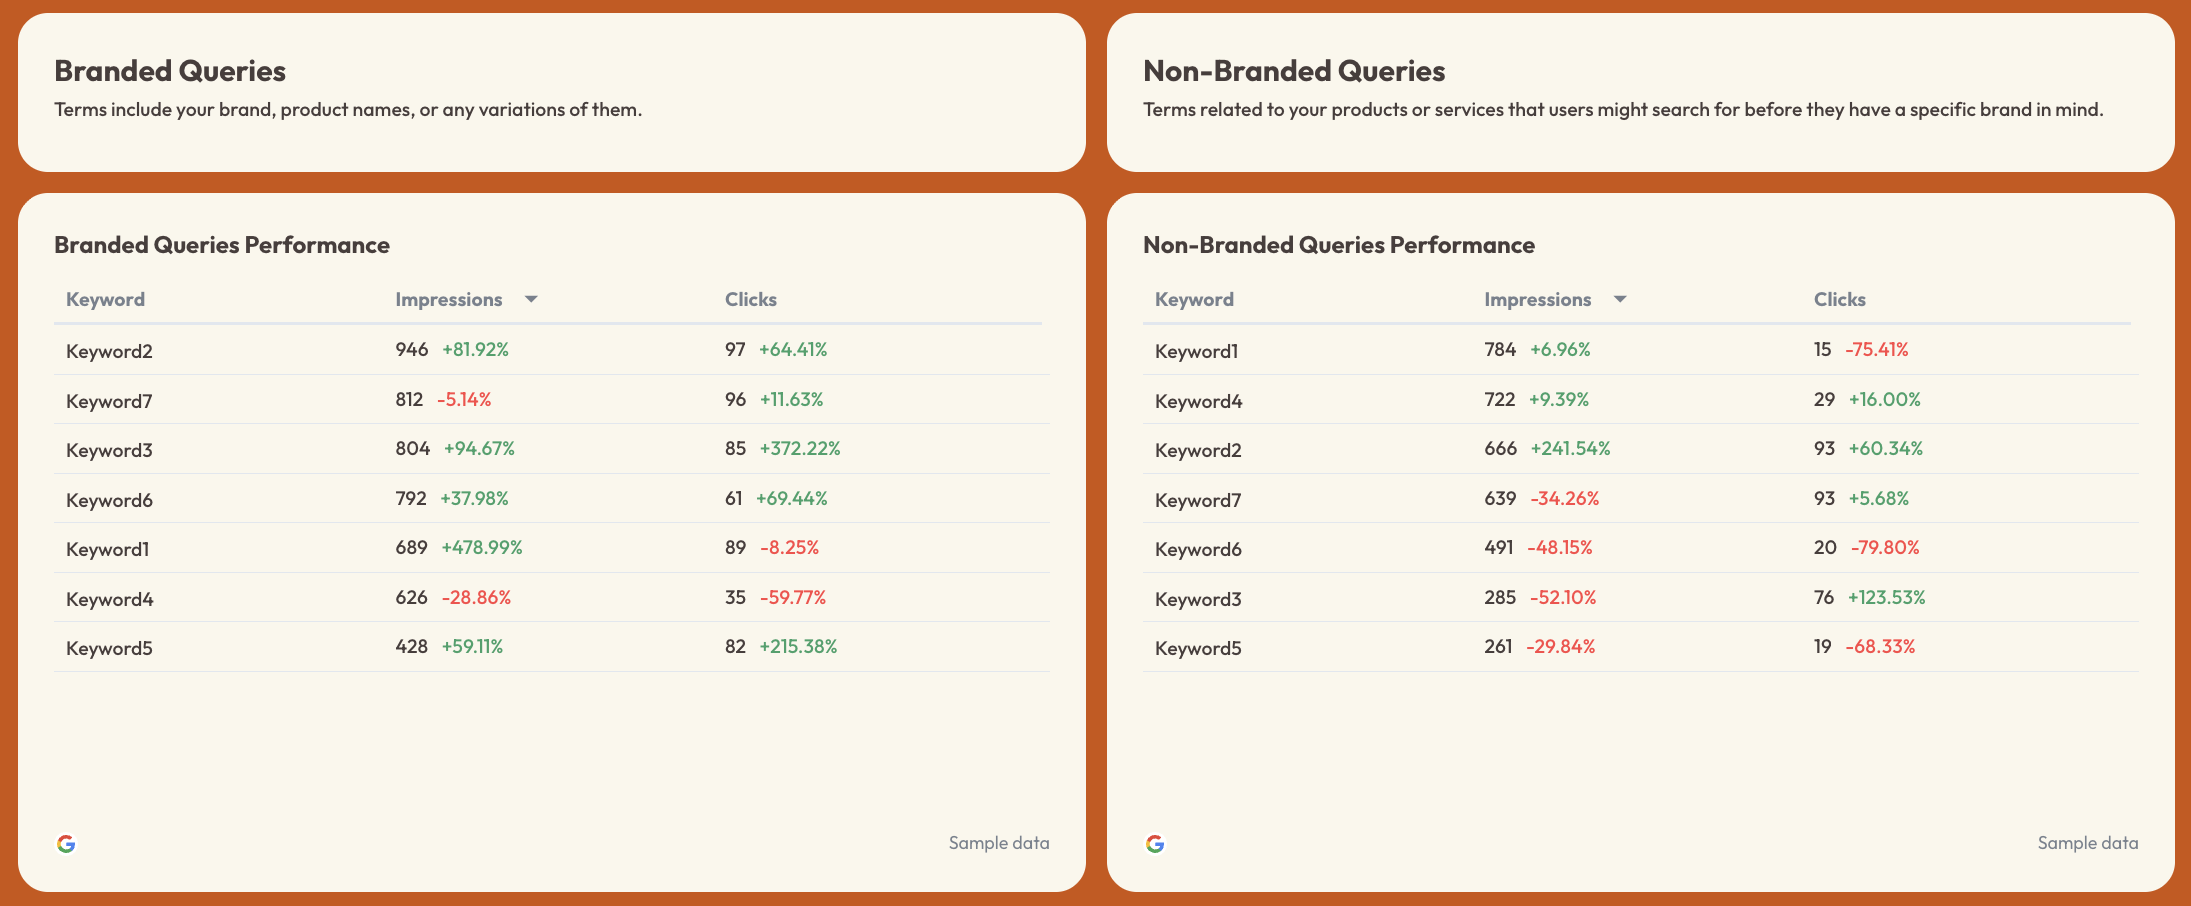
Tables that show:
- Keywords
- Impressions
- Clicks
- Month-over-month changes
This helps you understand which keywords bring traffic and which ones need more work.
3. Organic Traffic Tab
This tab explains where your traffic comes from and what users do on your site.
It should include:
1. Traffic Summary
Numbers that show:
- Sessions
- Users
- New users
- Conversions
- Revenue
2. Sessions by Channel
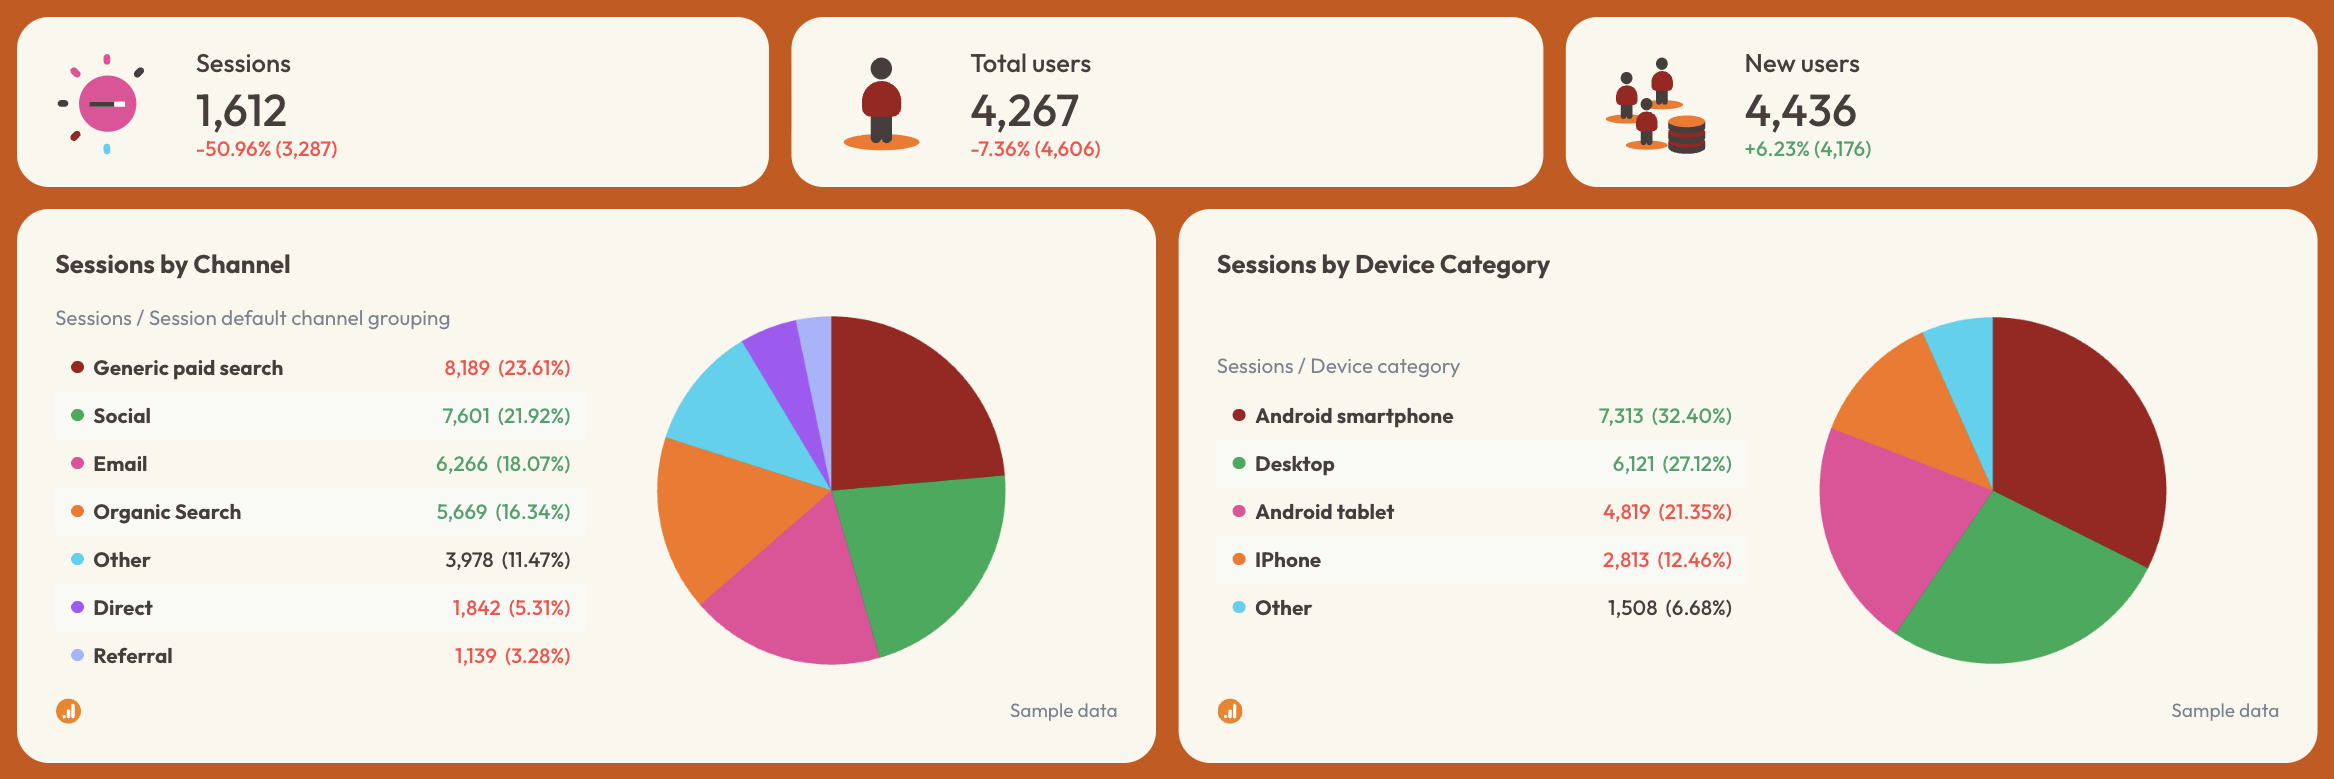
A chart that shows where your traffic comes from, such as:
- Organic search
- Direct
- Social media
- Referral
- Paid traffic
3. Sessions by Device
A breakdown of traffic from:
- Desktop
- Mobile
- Tablet
4. Monthly Trends
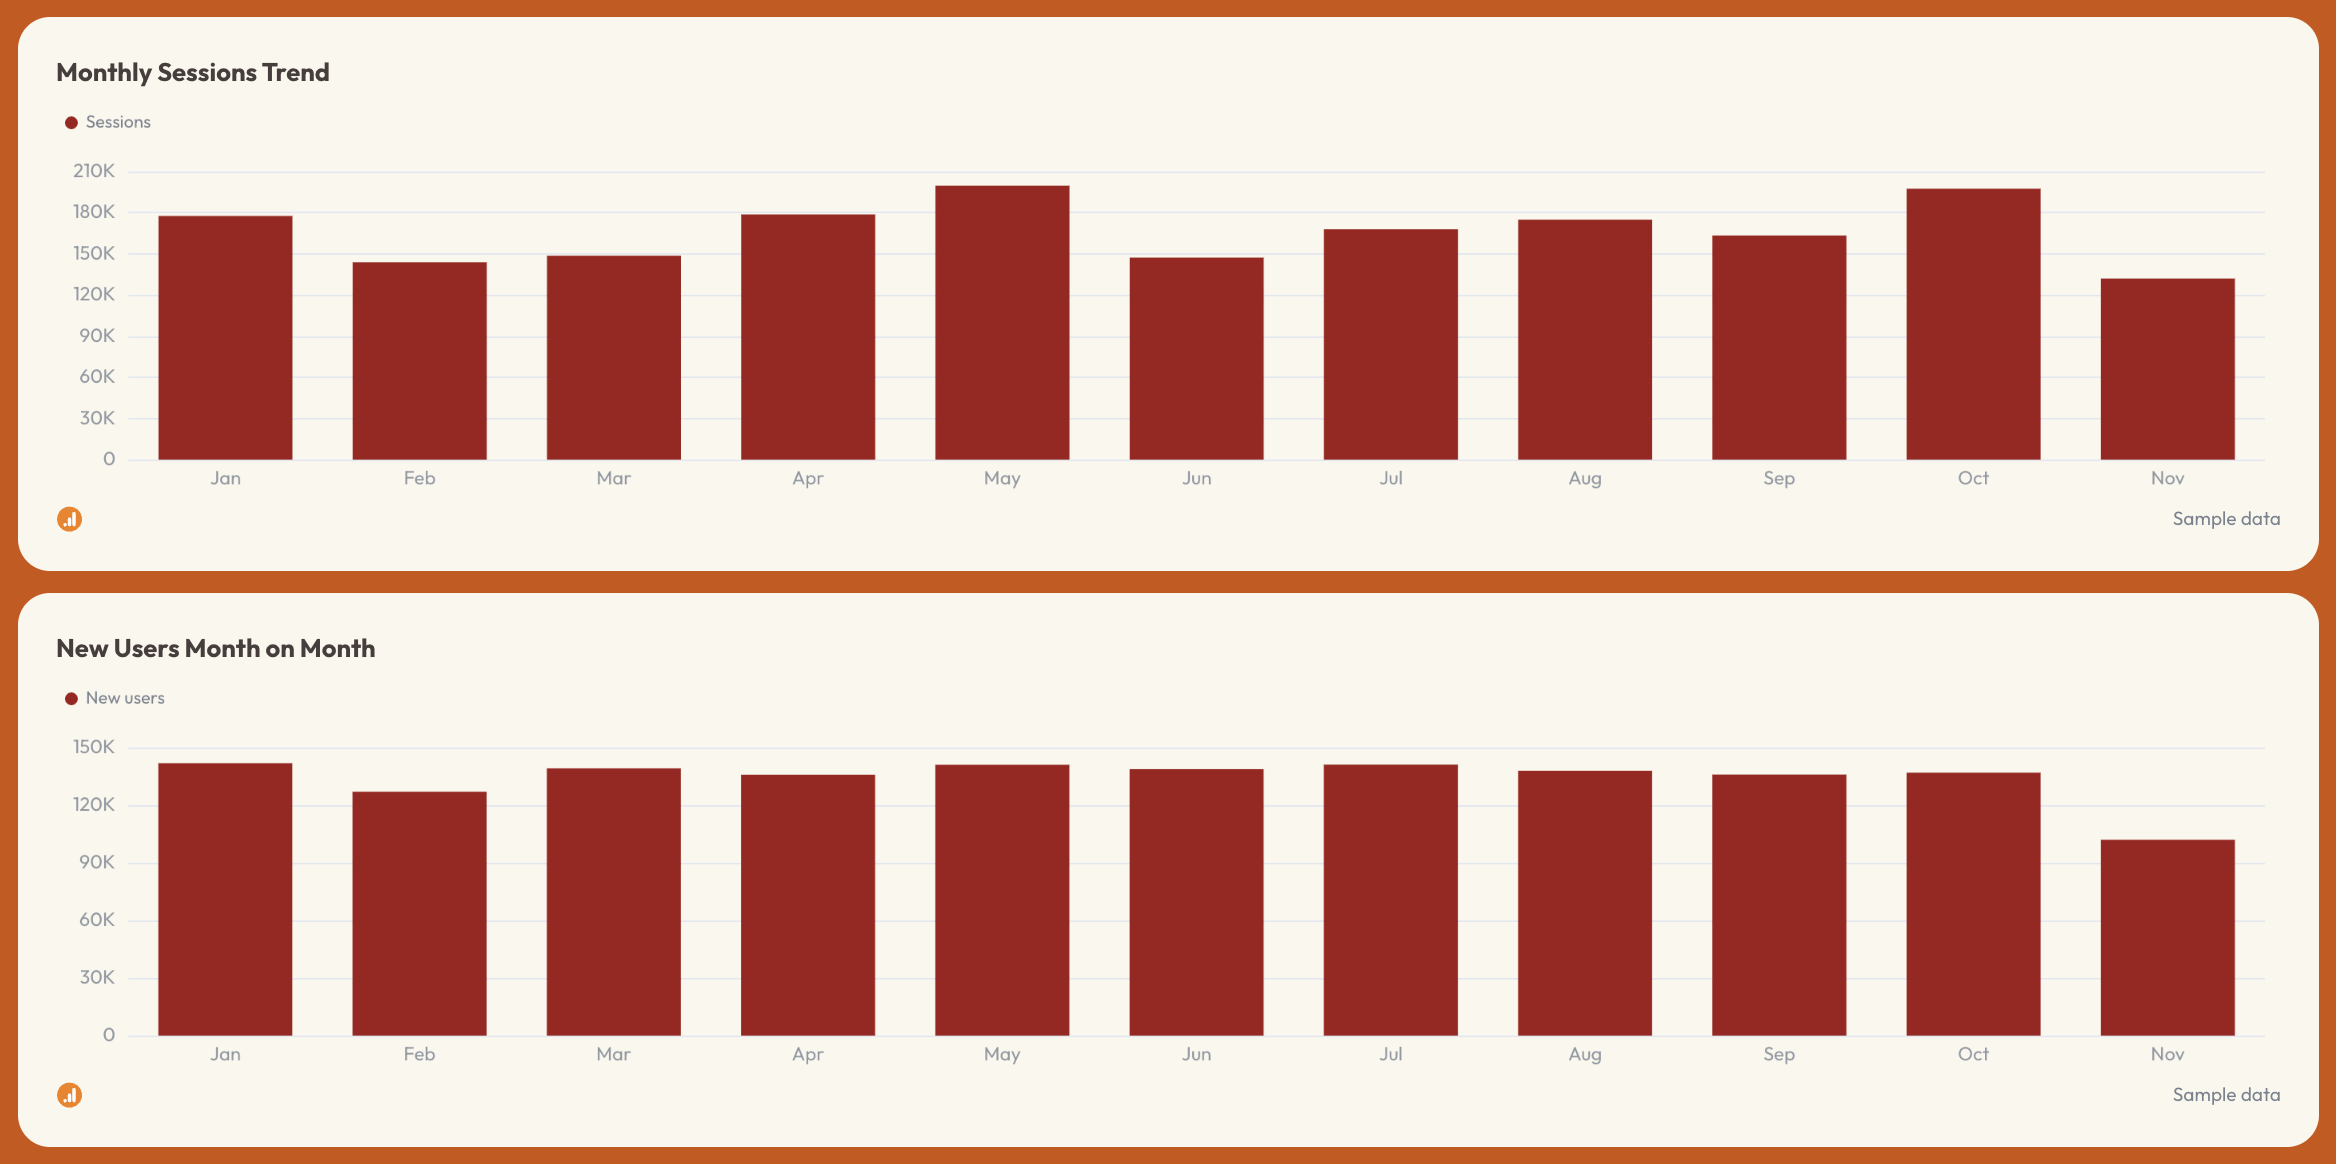
Clear bar charts showing:
- Monthly sessions
- Monthly new users
These help you compare performance from month to month.
5. Landing Page Performance
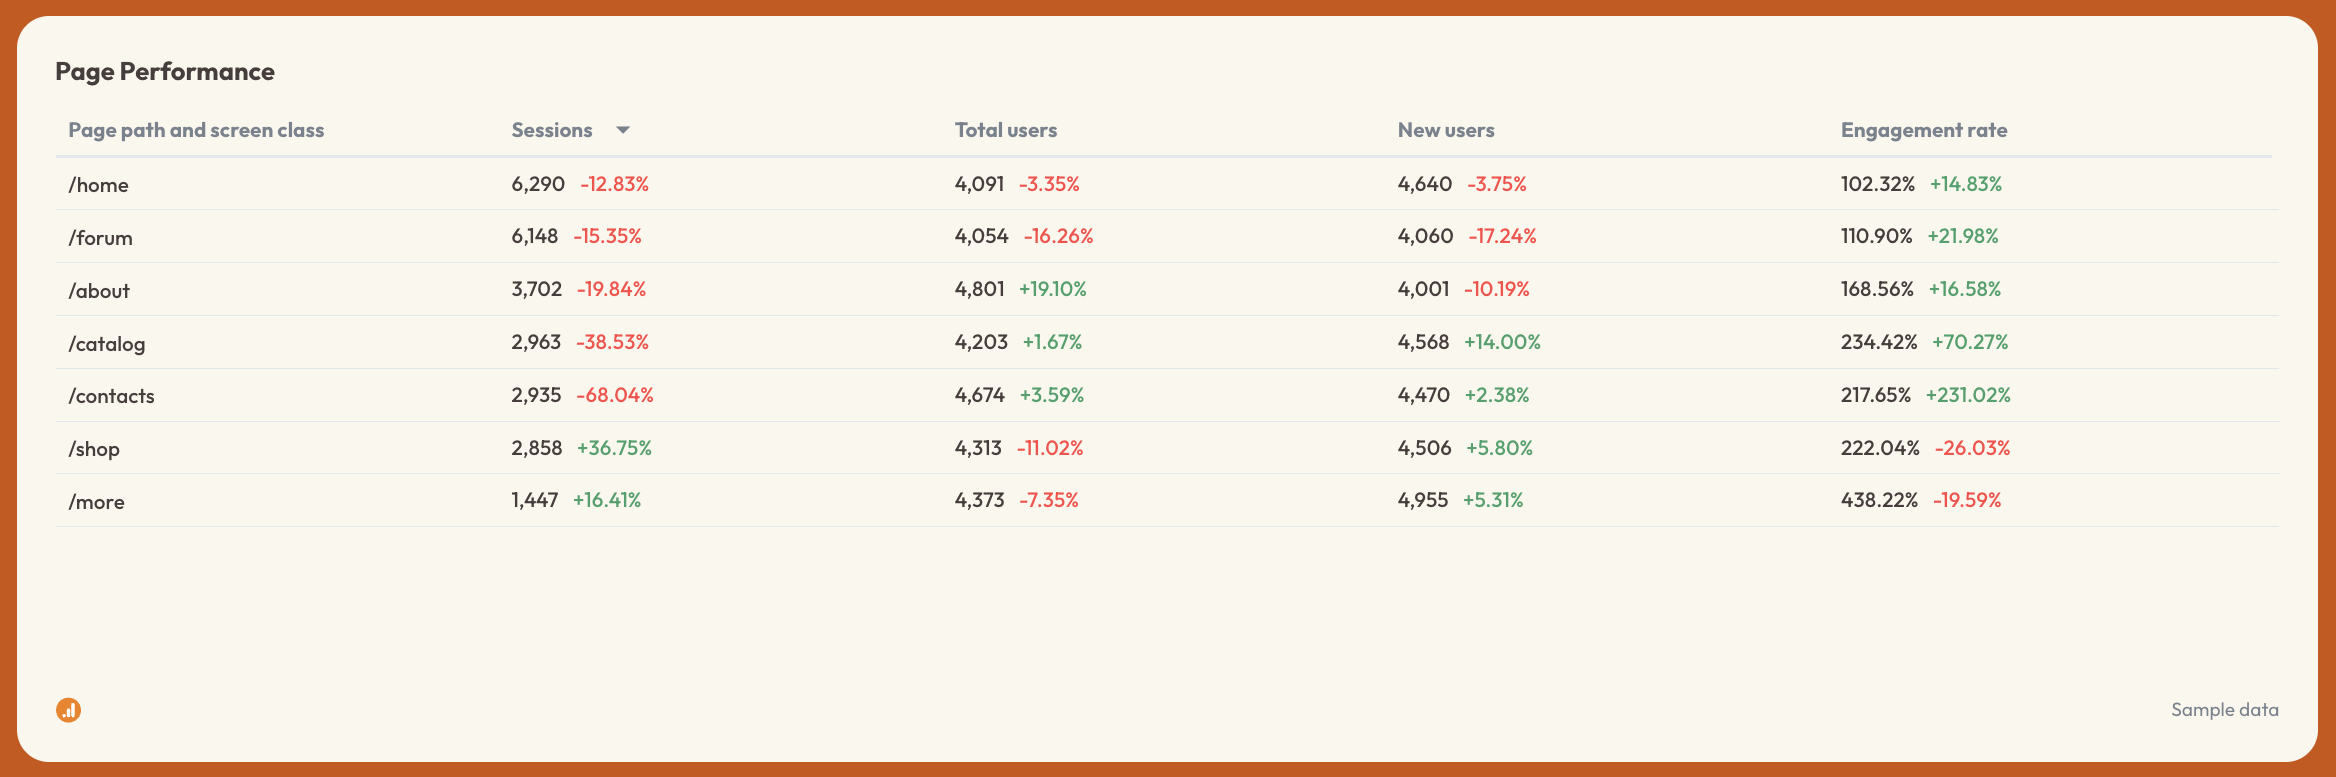
A table showing:
- Top landing pages
- Sessions
- Users
- Engagement
This helps you see which pages bring in the most valuable traffic.
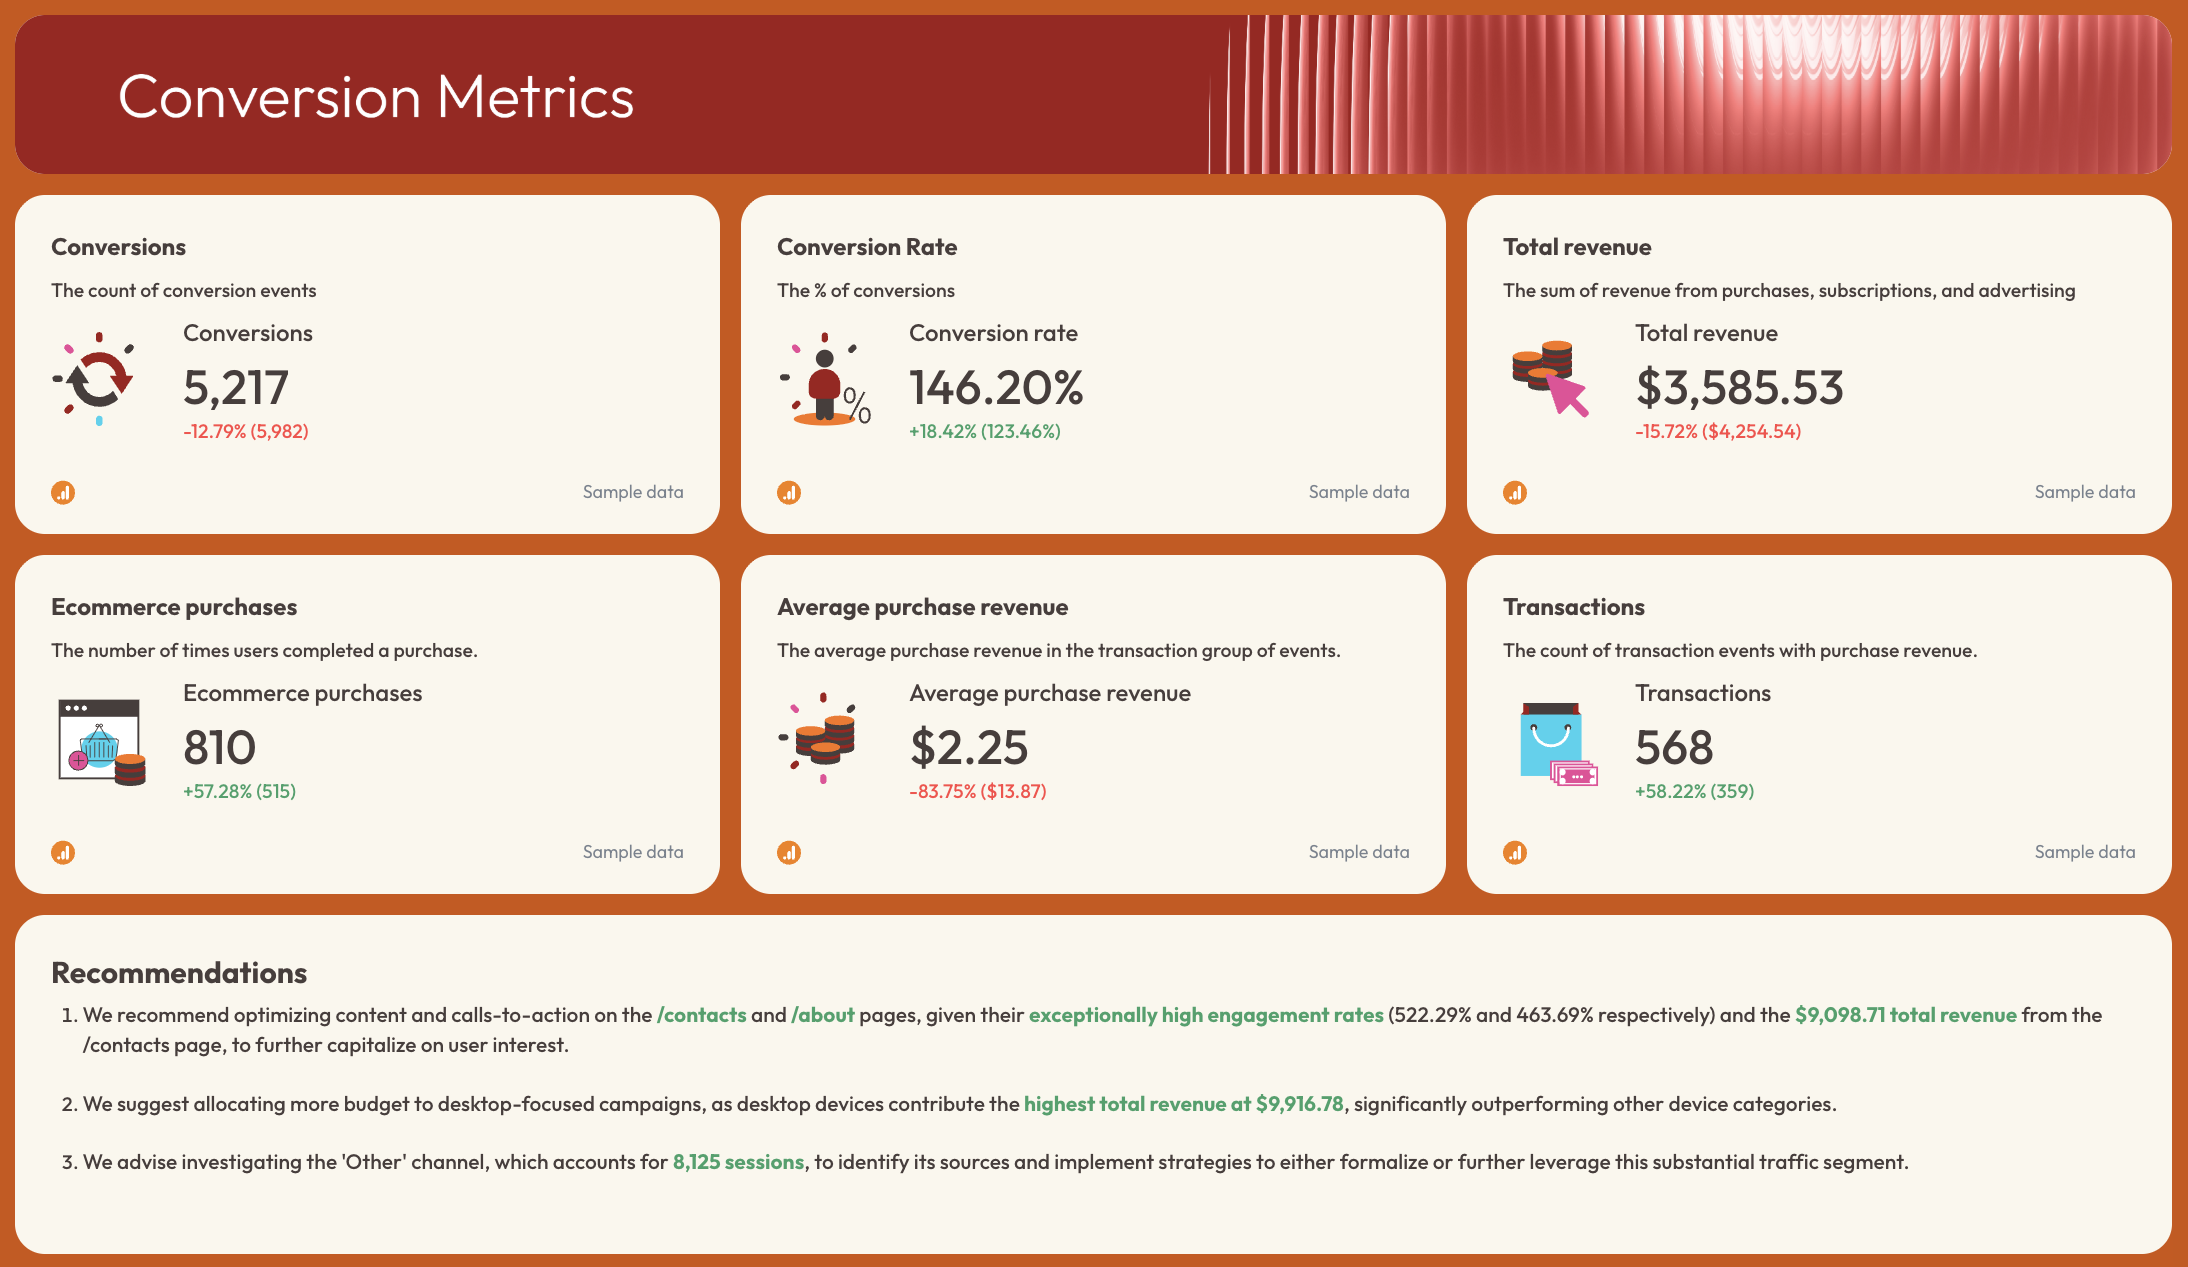
4. Organic Conversions Tab
This tab shows the tangible results SEO brings to your business, taken from Google Analytics (GA4):
It should include:
1. Conversion Summary
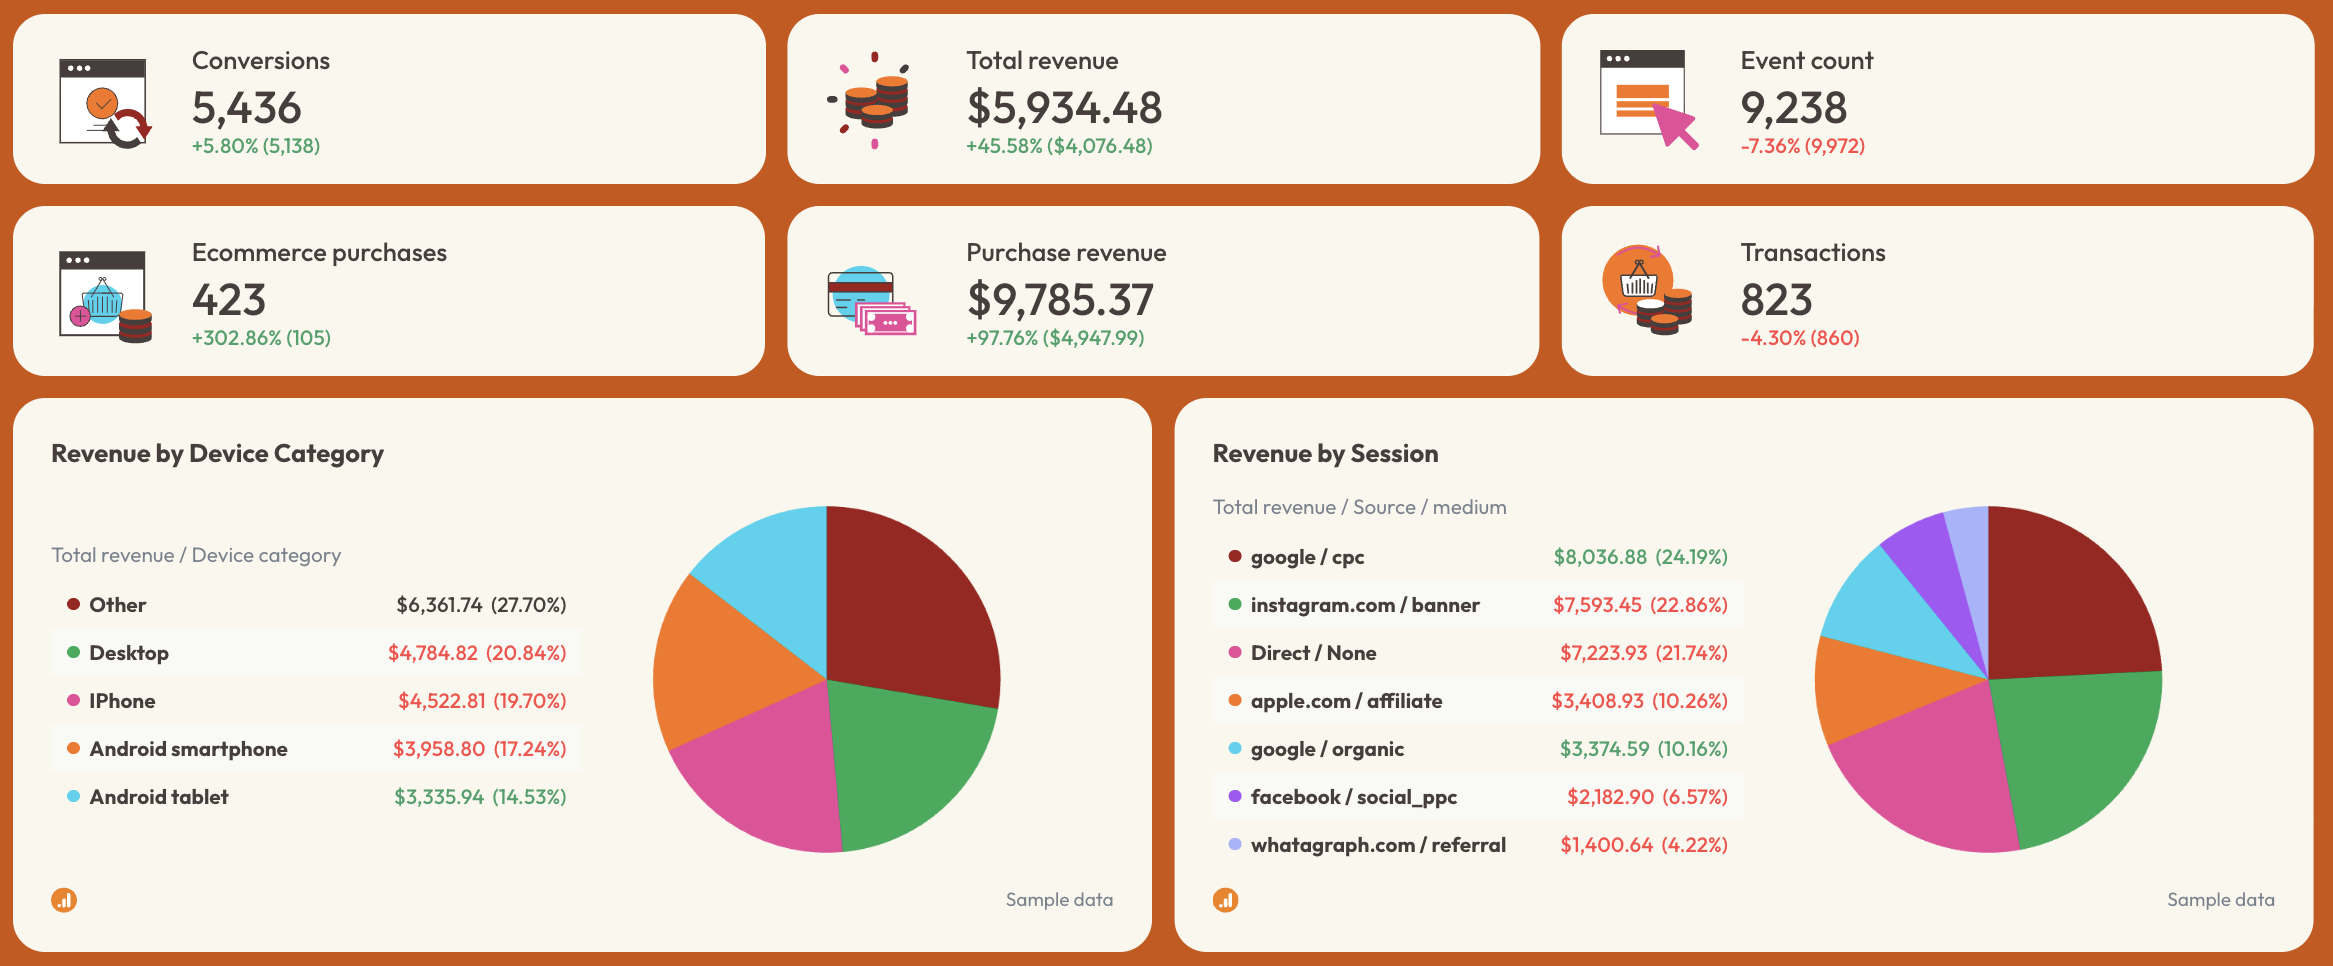
Key numbers such as:
- Conversions
- Transactions
- Ecommerce purchases
- Revenue
These numbers show how well your SEO efforts drive business results.
2. Conversion Trends
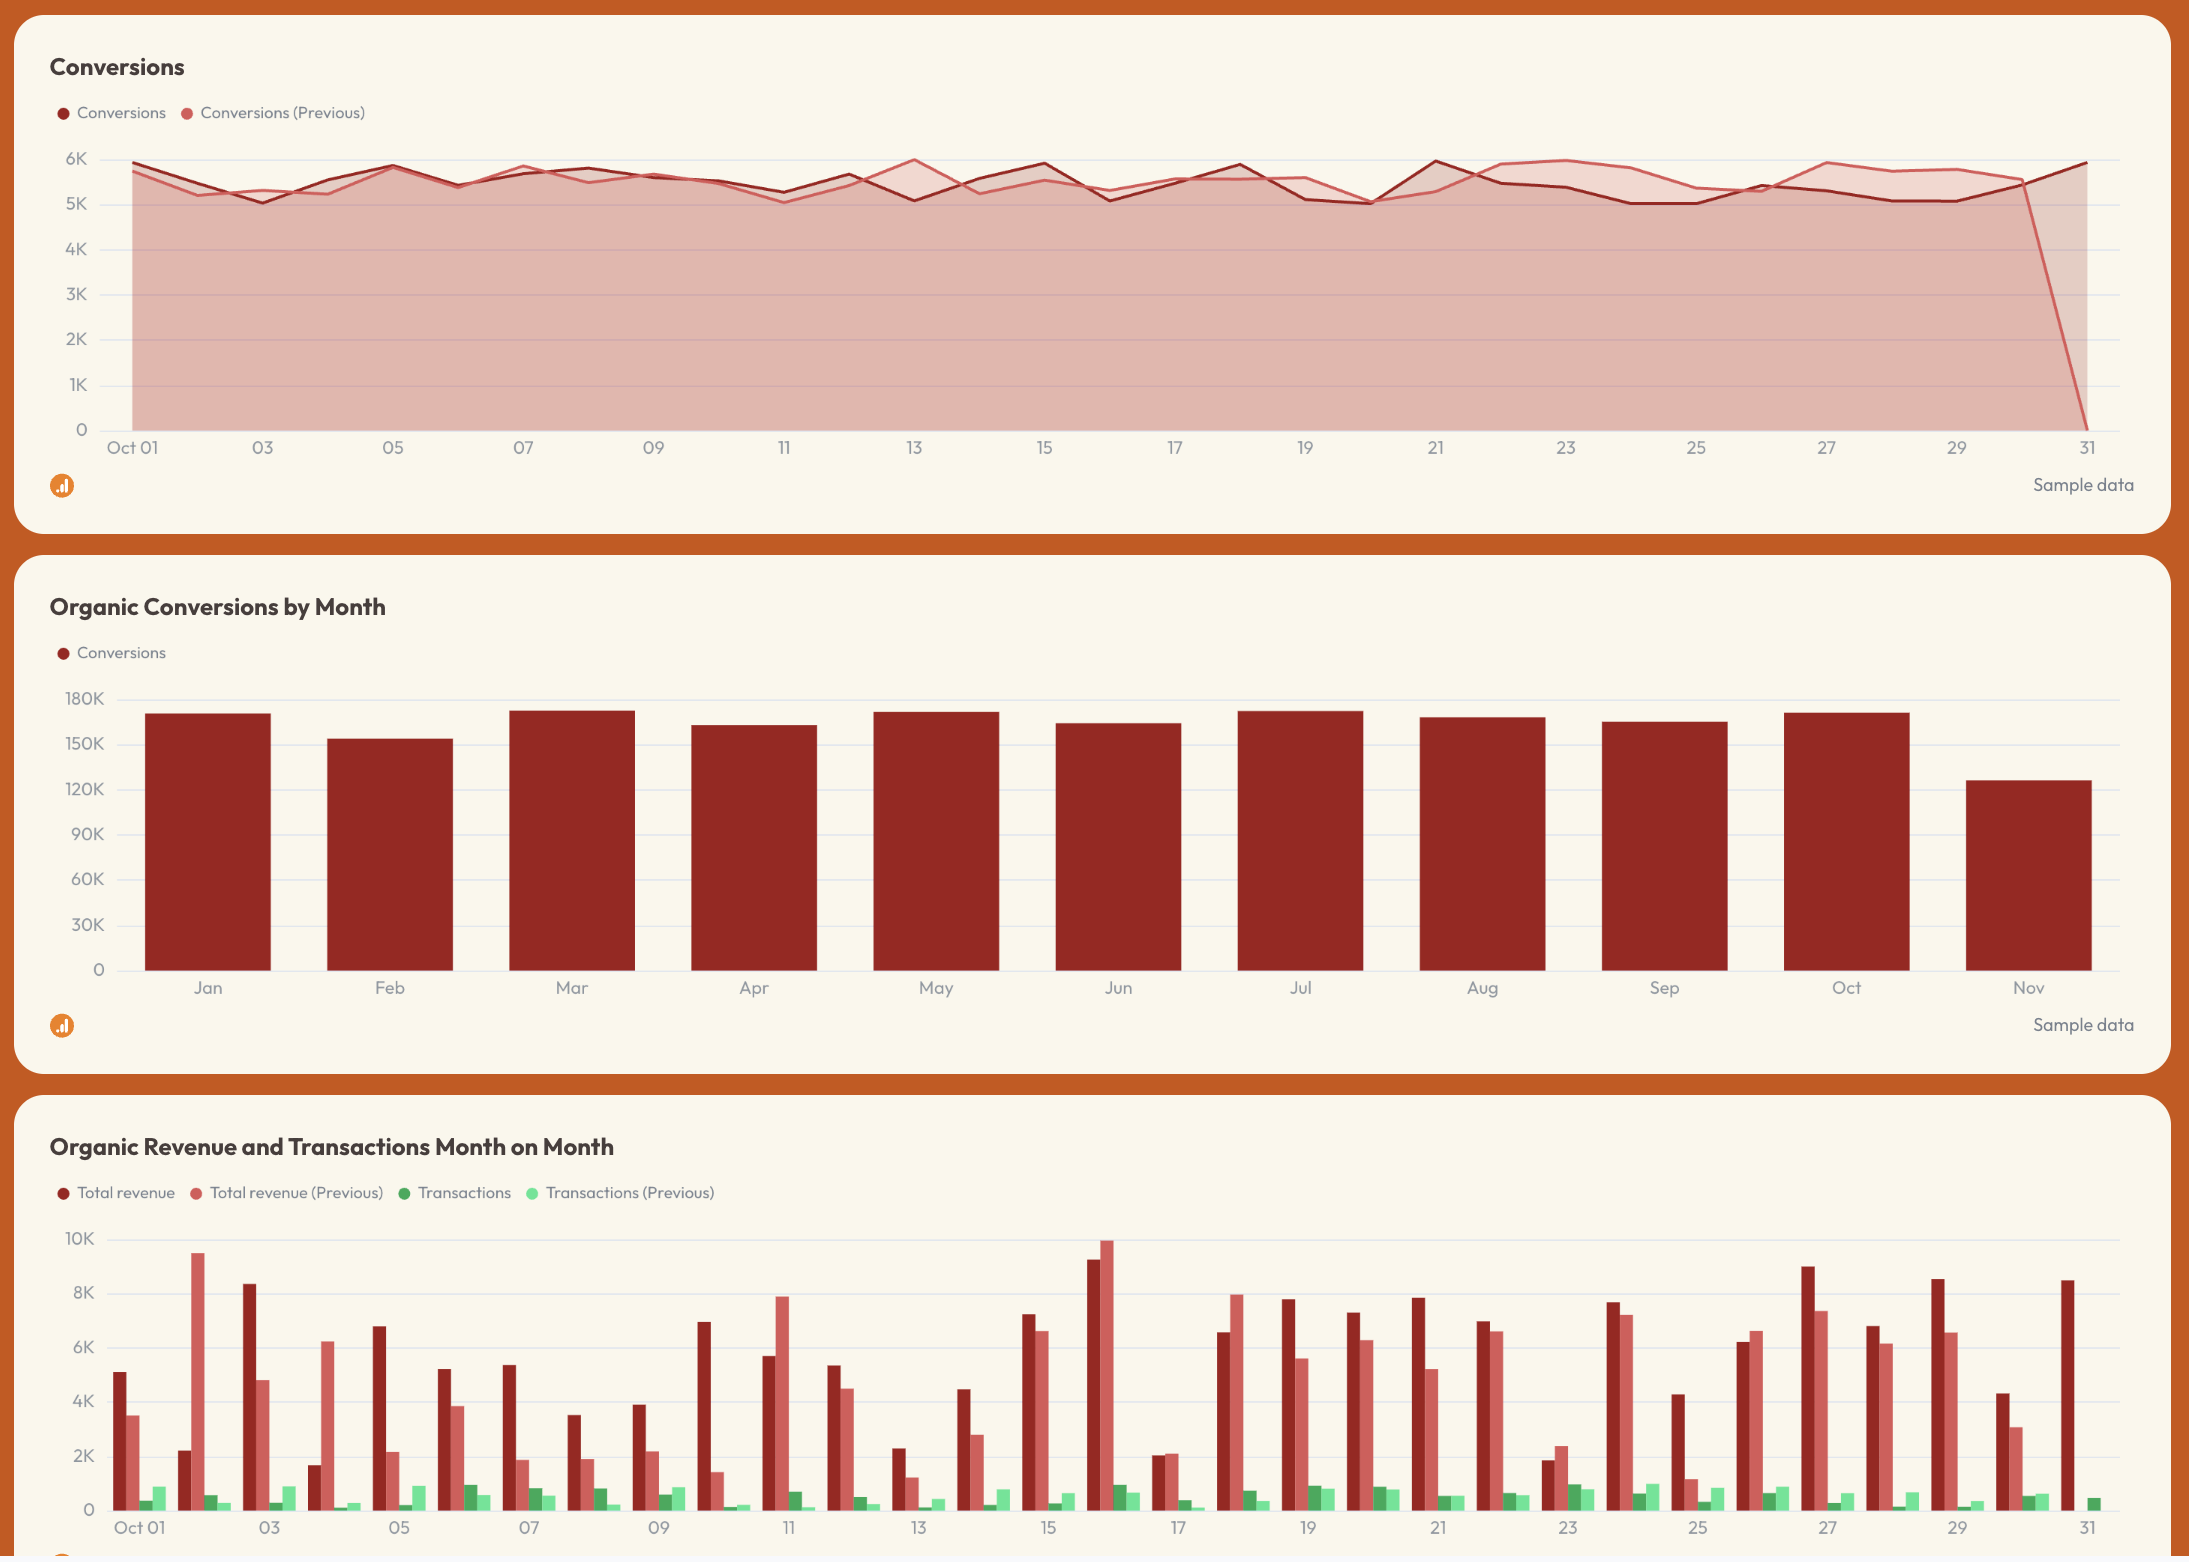
Charts showing:
- Daily conversions
- Monthly conversions
- Revenue and transactions over time
- Page Path Performance
A simple table showing which pages help lead to conversions and revenue.
3. Traffic Source Conversions
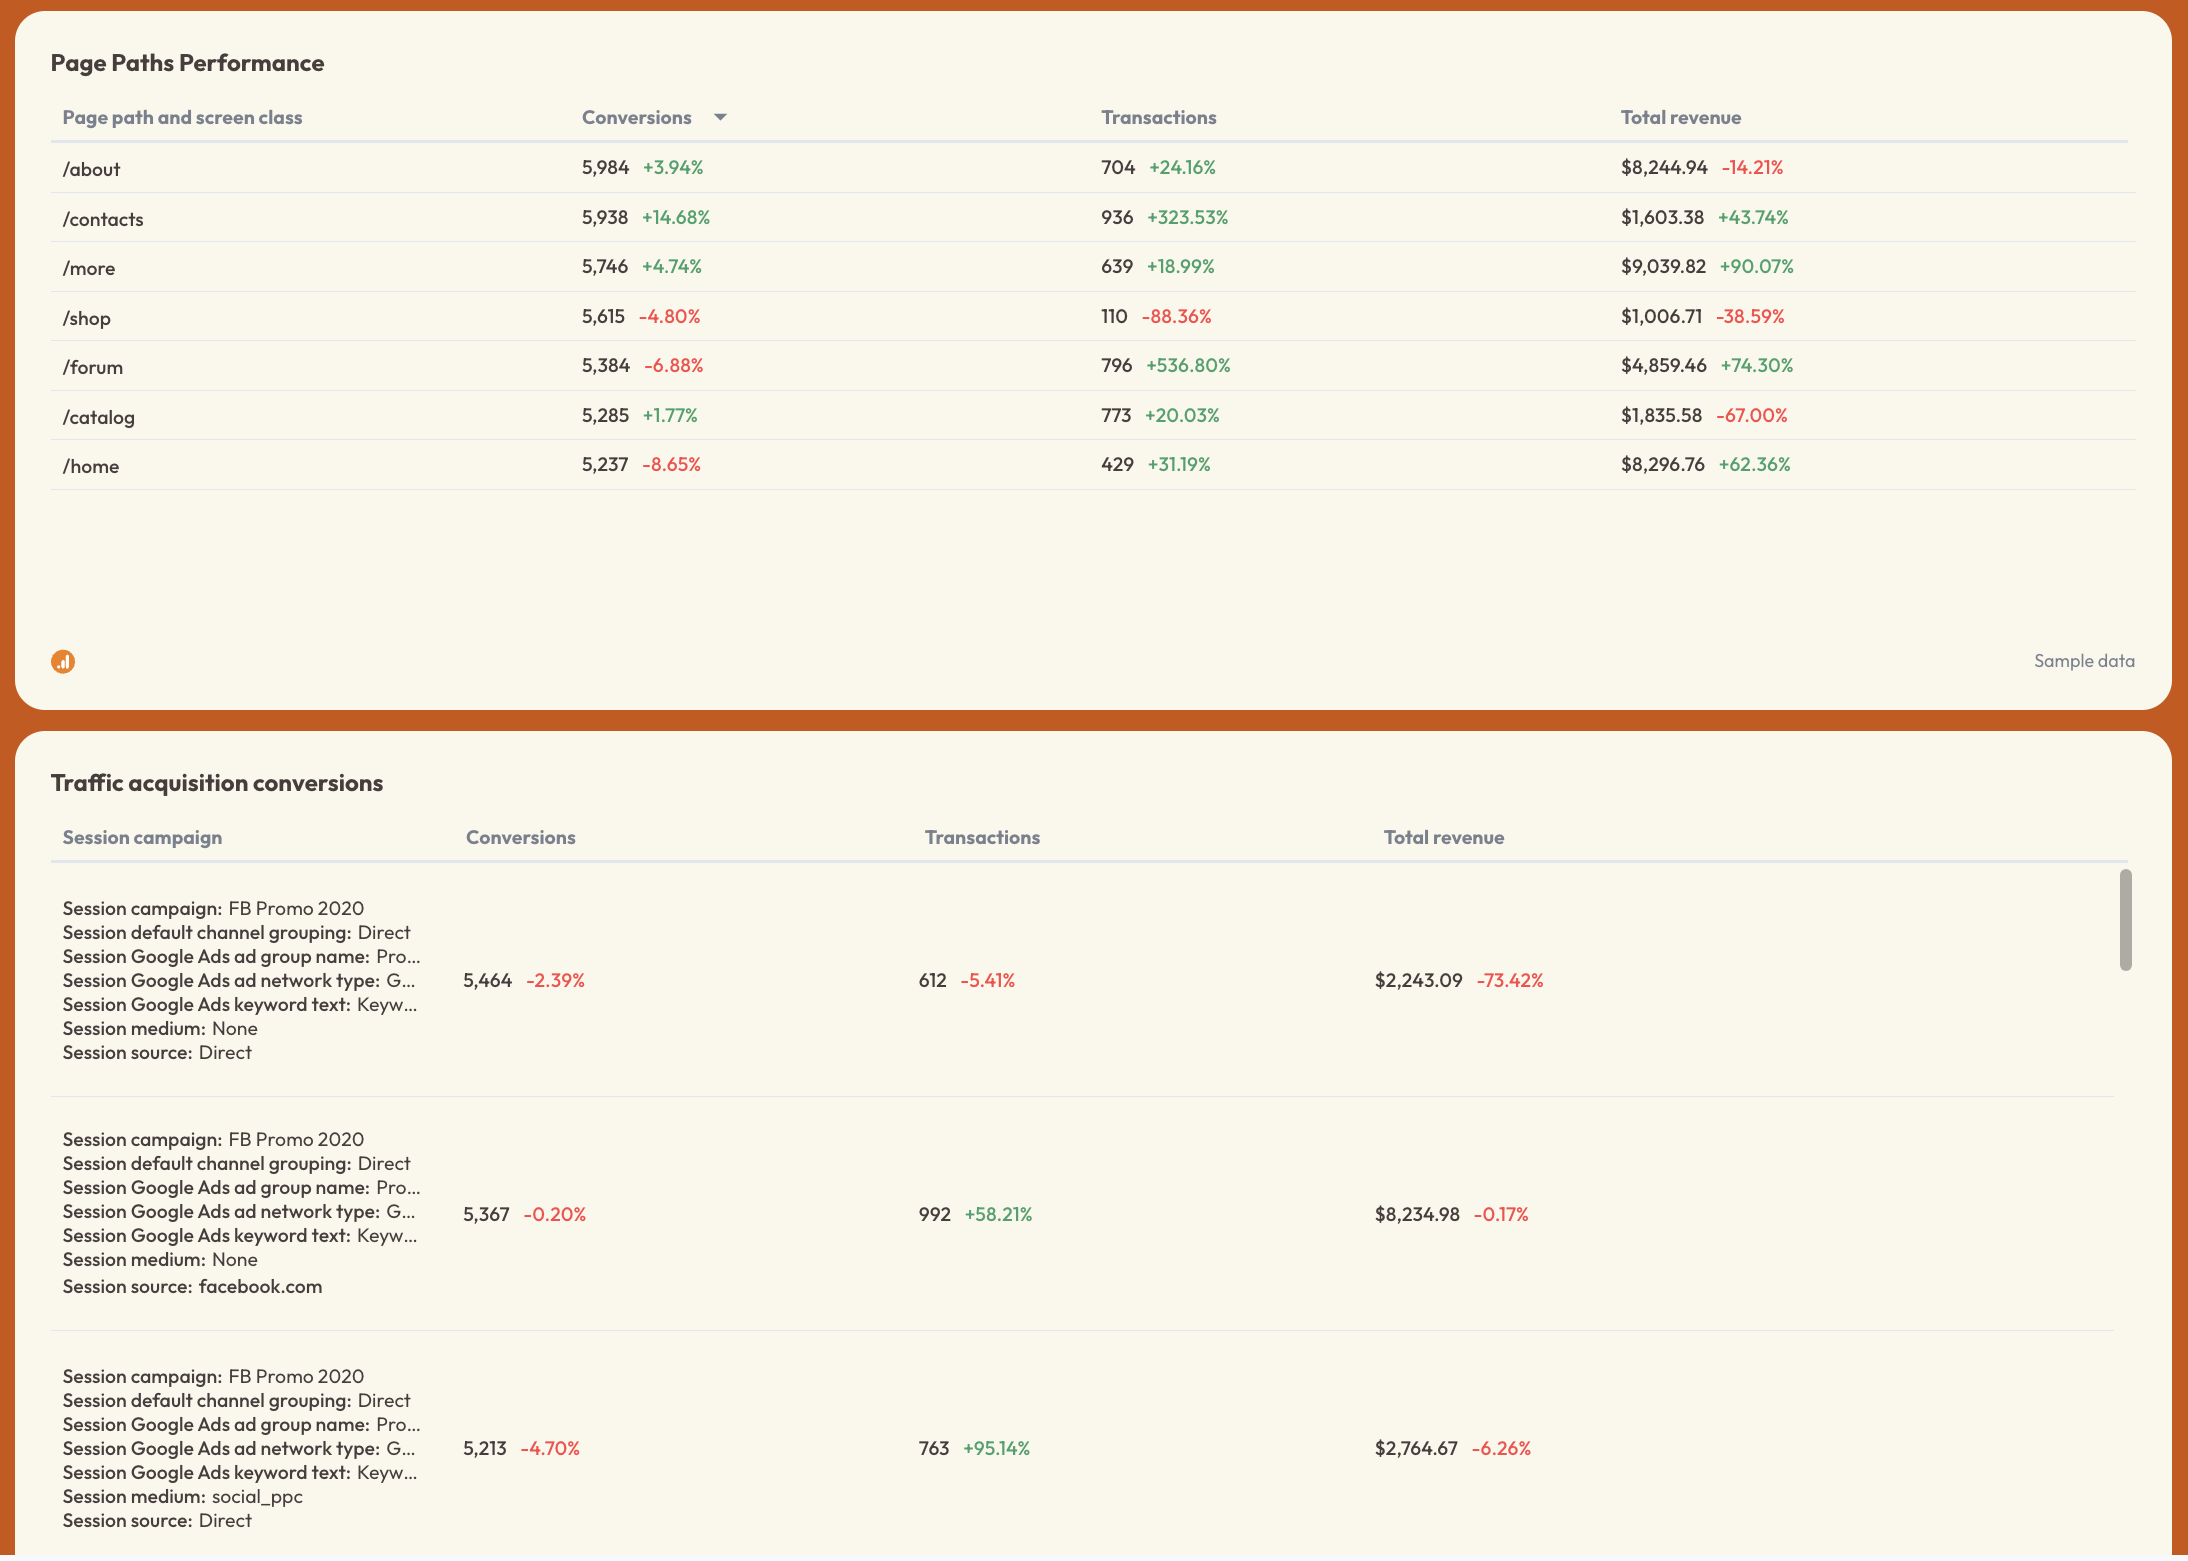
Tables showing:
- Which channels or campaigns lead to conversions
- How many conversions they bring
- Revenue from each source