Dashboard vs Report: Why You Need Both for Data Monitoring
Dashboards give you a quick summary of the most important information that updates in real-time. This makes them great for monitoring key metrics and strategic KPIs. Reports, on the other hand, focus on specific areas and provide deeper insights over a period of time.
However, this it's not that simple. Marketers must distinguish between the two and use them appropriately to get the full benefits of data monitoring without wasting resources. Keep reading to find out the differences between a dashboard and a report, and when to use each of them.

Jan 10 2022●8 min read


What are Dashboards?
Dashboards represent the most important metrics by using data visualization. Almost always, metrics, KPIs, or any data whatsoever is being updated in real-time and displays the activity of what is happening right this second. Not only that, but dashboards are short, one-page, and single-screen. Longer than that would be considered a report. Moreover, dashboards focus on the problems, issues, or any relevant information in line with the marketing agency's priorities. They clearly communicate marketing objectives and allow anyone to see progress towards goals.
When you think of dashboard design, think of simplicity, to-the-point information, and up-to-date data in the form of:
- Tables;
- Graphs;
- Charts.
To get a clearer image, think of what you do when you want to find out the temperature of the weather. You open your phone or use search engines to search for information. And how is this data displayed? Short, simple, and to the point: '3°C; 72% humidity; 5 m/s wind, and so on'. And that's all you need to know.

The same goes for any business or marketing campaign. Sometimes there is a need to know how many sales were generated, what the current revenue or registration number is. So business intelligence dashboards, or any other dashboards, are really a must for anyone requiring data analysis.
Advantages of dashboards:
- Actionable. Dashboards contain only relevant metrics and KPIs. Due to this feature, they provide immediate insights into what actions need to be taken to improve the current situation;
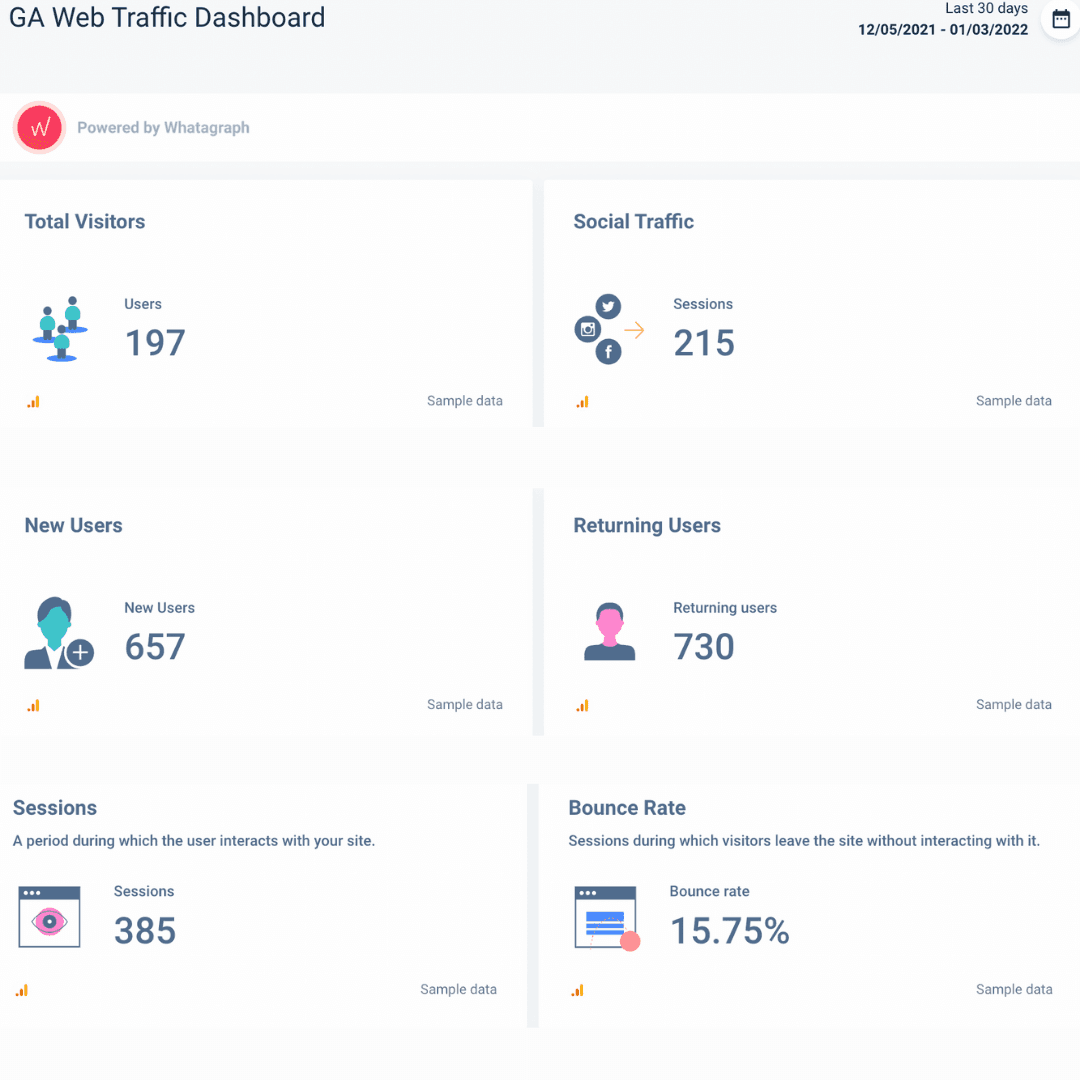
Here's an example of a Google Analytics web traffic dashboard. You may be tracking different metrics depending on your goals, but here is an example of what a GA dashboard should ideally look like. It is clear what is currently happening within the GA web traffic without the need to examine the data.
- Real-time info from multiple data sources. Clear, consistent, and visually appealing dashboards center on key performance indicators and allow for data-driven decision-making;
- Sales and marketing alignment. As dashboards provide an at-a-glance picture of data, imagine the advantages of sharing this data between the departments. Especially between marketing and sales. They usually have an effect on one another. Sending dashboards with marketing KPIs that affect sales teams in any manner prevents errors or damages while also keeping them informed about what's going on in the marketing department.
What are Reports?
A marketing report collects data on how marketing campaigns have been progressing and growing in a particular time. They are usually created to showcase or analyze certain periods' work and its improvement. Whilst dashboards only focus on real-time data, reports can focus on real-time data and historical data. This is an important feature when conducting analyses of marketing or business efforts.
Think of a report as an overview of all the work you've done, let's say, last month. Reports will not only tell you how you are currently doing, but it will also tell you:
- What saw a decrease;
- How much x increased in the past month;
- Which marketing channel performed the best;
- How your investments are paying off.
There are many different reports and types you can create. It all depends on your goals and objectives. Take a typical marketing agency and a client's rapport. Even if the aims were the same, the marketing agency would sometimes provide a more thorough report for itself, but a more focused and to-the-point report for the client.
Advantages of reports:
- Cross-platform monitoring. Most data analytics tools can pull data from multiple data channels and present it on a single page. This feature is particularly useful when comparing channel performance or measuring the investment's payoff;
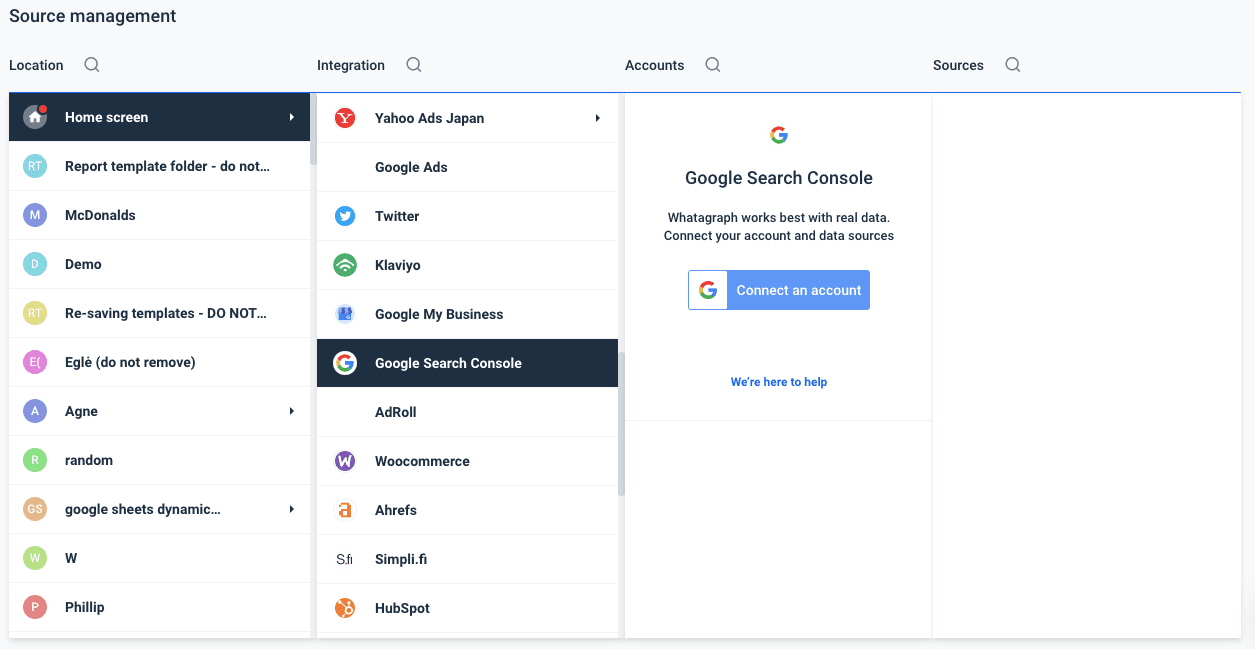
Whatagraph has more than 40 most popular integrations. Meaning, that with this feature, cross-platform monitoring will be easier than ever. Connect any data source and pull data from multiple sources to learn about your marketing's overall health.
- Spot customer trends and patterns. Analyzing data sets from a specific time period will help you to see how customers interact with the website, what behavioral patterns they have, and even when they are most interested in your products.
- Identify the causes of errors and damages. Reports are useful in determining the cause of some faults or unforeseen damages that occur during a marketing campaign. This information may be used to not only identify what happened but also to determine its frequency and predict if it will occur again in the future.
What are the Differences Between a Dashboard and a Report?
Reports are usually longer and hold information about how business has performed over a specific period. Use them to keep high-stakeholders in the loop. Dashboards provide dynamic, real-time information for C-suite executives and team members who need quick updates without much context.
Let's explain the main three differences between dashboards and reports.
1. Data Visualization
The dashboard's purpose, as previously said, is to be brief and to the point. The importance of design in achieving that goal cannot be overstated. Dashboards are often designed in a simple and minimalistic manner to avoid overcomplicating the procedure. Another important characteristic is the dashboard's length. This data must fit on one page because only critical metrics are required.
Reports, on the other hand, can be as long as necessary to examine the performance of any activity. The visual displays of the reports could, of course, vary depending on the demands of the meeting or the requirements. Reports may also be brief in some cases. However, because the aim of the report is to track and analyze marketing efforts, it can easily exceed two pages in most circumstances.
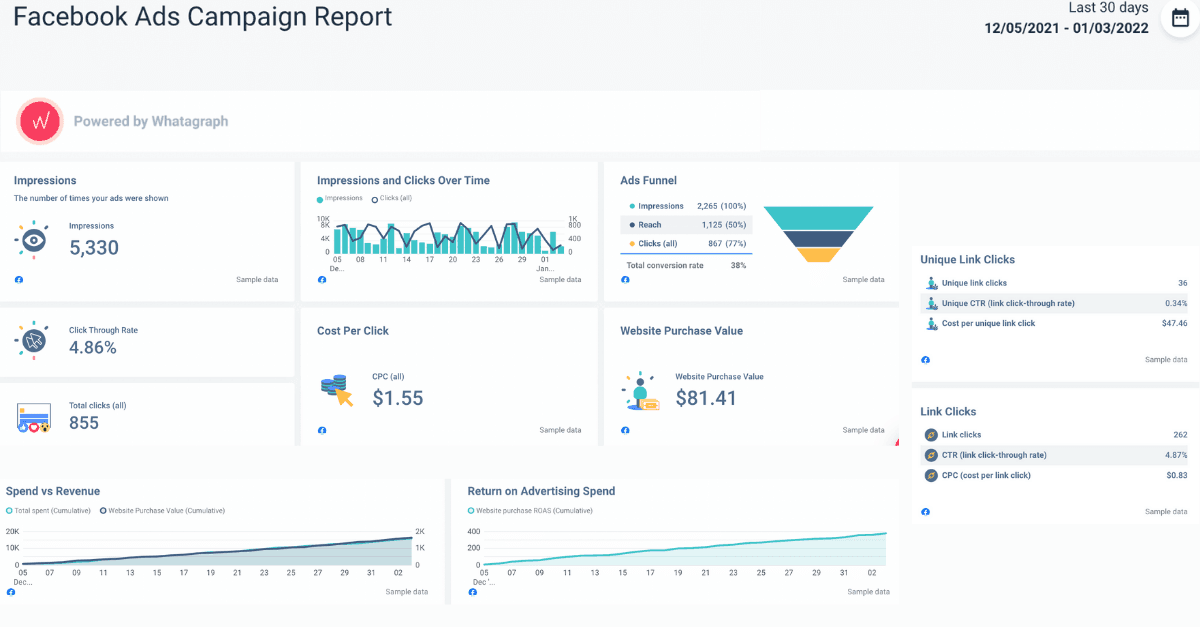
Here, for example, you can see a detailed Facebook Ads report with the main KPIs. The report is minimalistic, not overcrowded, and visually appealing. As you can see, even comparing data such as impressions and clicks over time is simple and easy to understand.
2. Depth of Data
Dashboards are used to keep track of and provide an overview of any activity. You won't find a long list of metrics or KPIs here; instead, you'll find five crucial ones that tell you everything you need to know. While dashboards provide a high level of overview, reports are more data-dense. Reports contain so much information that they can provide insight into the overall health of marketing initiatives.
3. Data's Volatility
Dashboards showcase real-time data. When you generate any kind of dashboard, it will show you a high-level view of the latest information. As a result, dashboards are ideal for everyday analytics and business intelligence demands.
However, if historical data is needed as much as live information, reports are the way to go. In most cases, reports can refer to the data in the excel sheet or digital (or printed) PDF files. Reports have stagnant info that simply won't change when something occurs.
3 Similarities Between a Dashboard and a Report?
1. Data
Both, a report and a dashboard display data. No matter how much of it there is, they still provide information on which to base decisions.
2. Customization
A tutorial is not required to generate a report or a dashboard. All you have to do is figure out what you want to achieve, set some targets, and optimize them to match your needs.
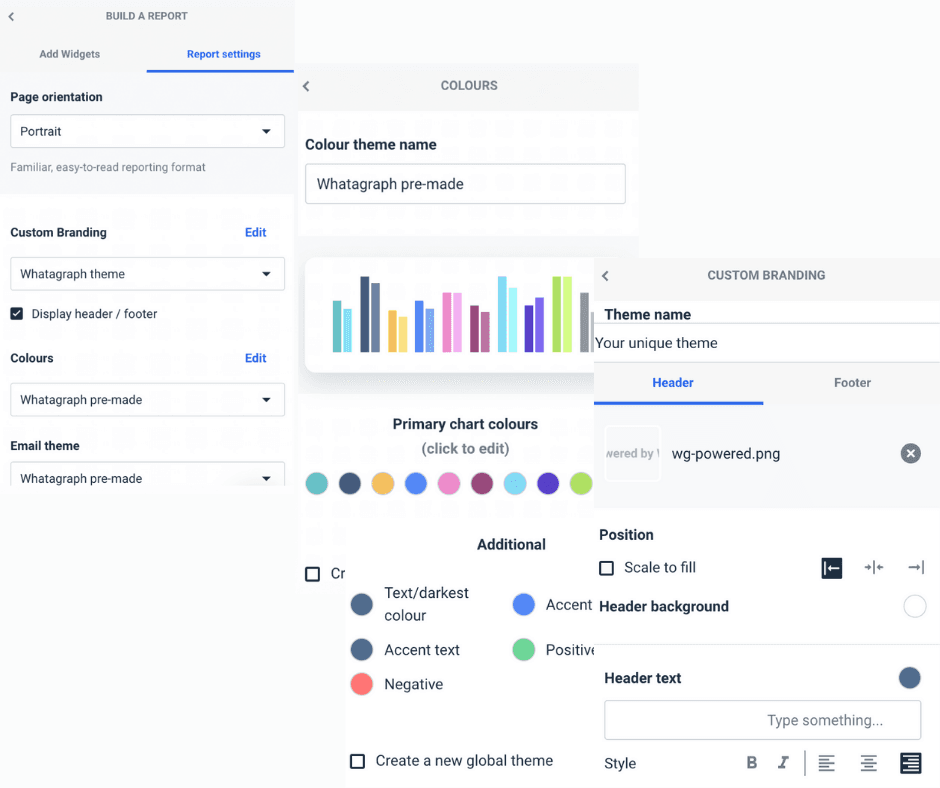
Whatagraph, for example, has a drag-and-drop capability that allows you to display any metric on a report or dashboard. More importantly, if you need to change colors, fonts, or sources to better represent your brand and marketing objectives, you can and should do so. Usually, this feature is the most helpful when creating reports for clients. However, for that client reporting software is needed.
3. Sharing Functions
A dashboard and a report can both be shared with anyone on the team, depending on the analytics tools you use and the permissions you have. The only thing to bear in mind is that a dashboard should never be sent as a PDF. If we take Whatagraph as an example again, you can generate a link that gives access to anyone that has it.
When to Use Which (Why You Need Both Ultimately)
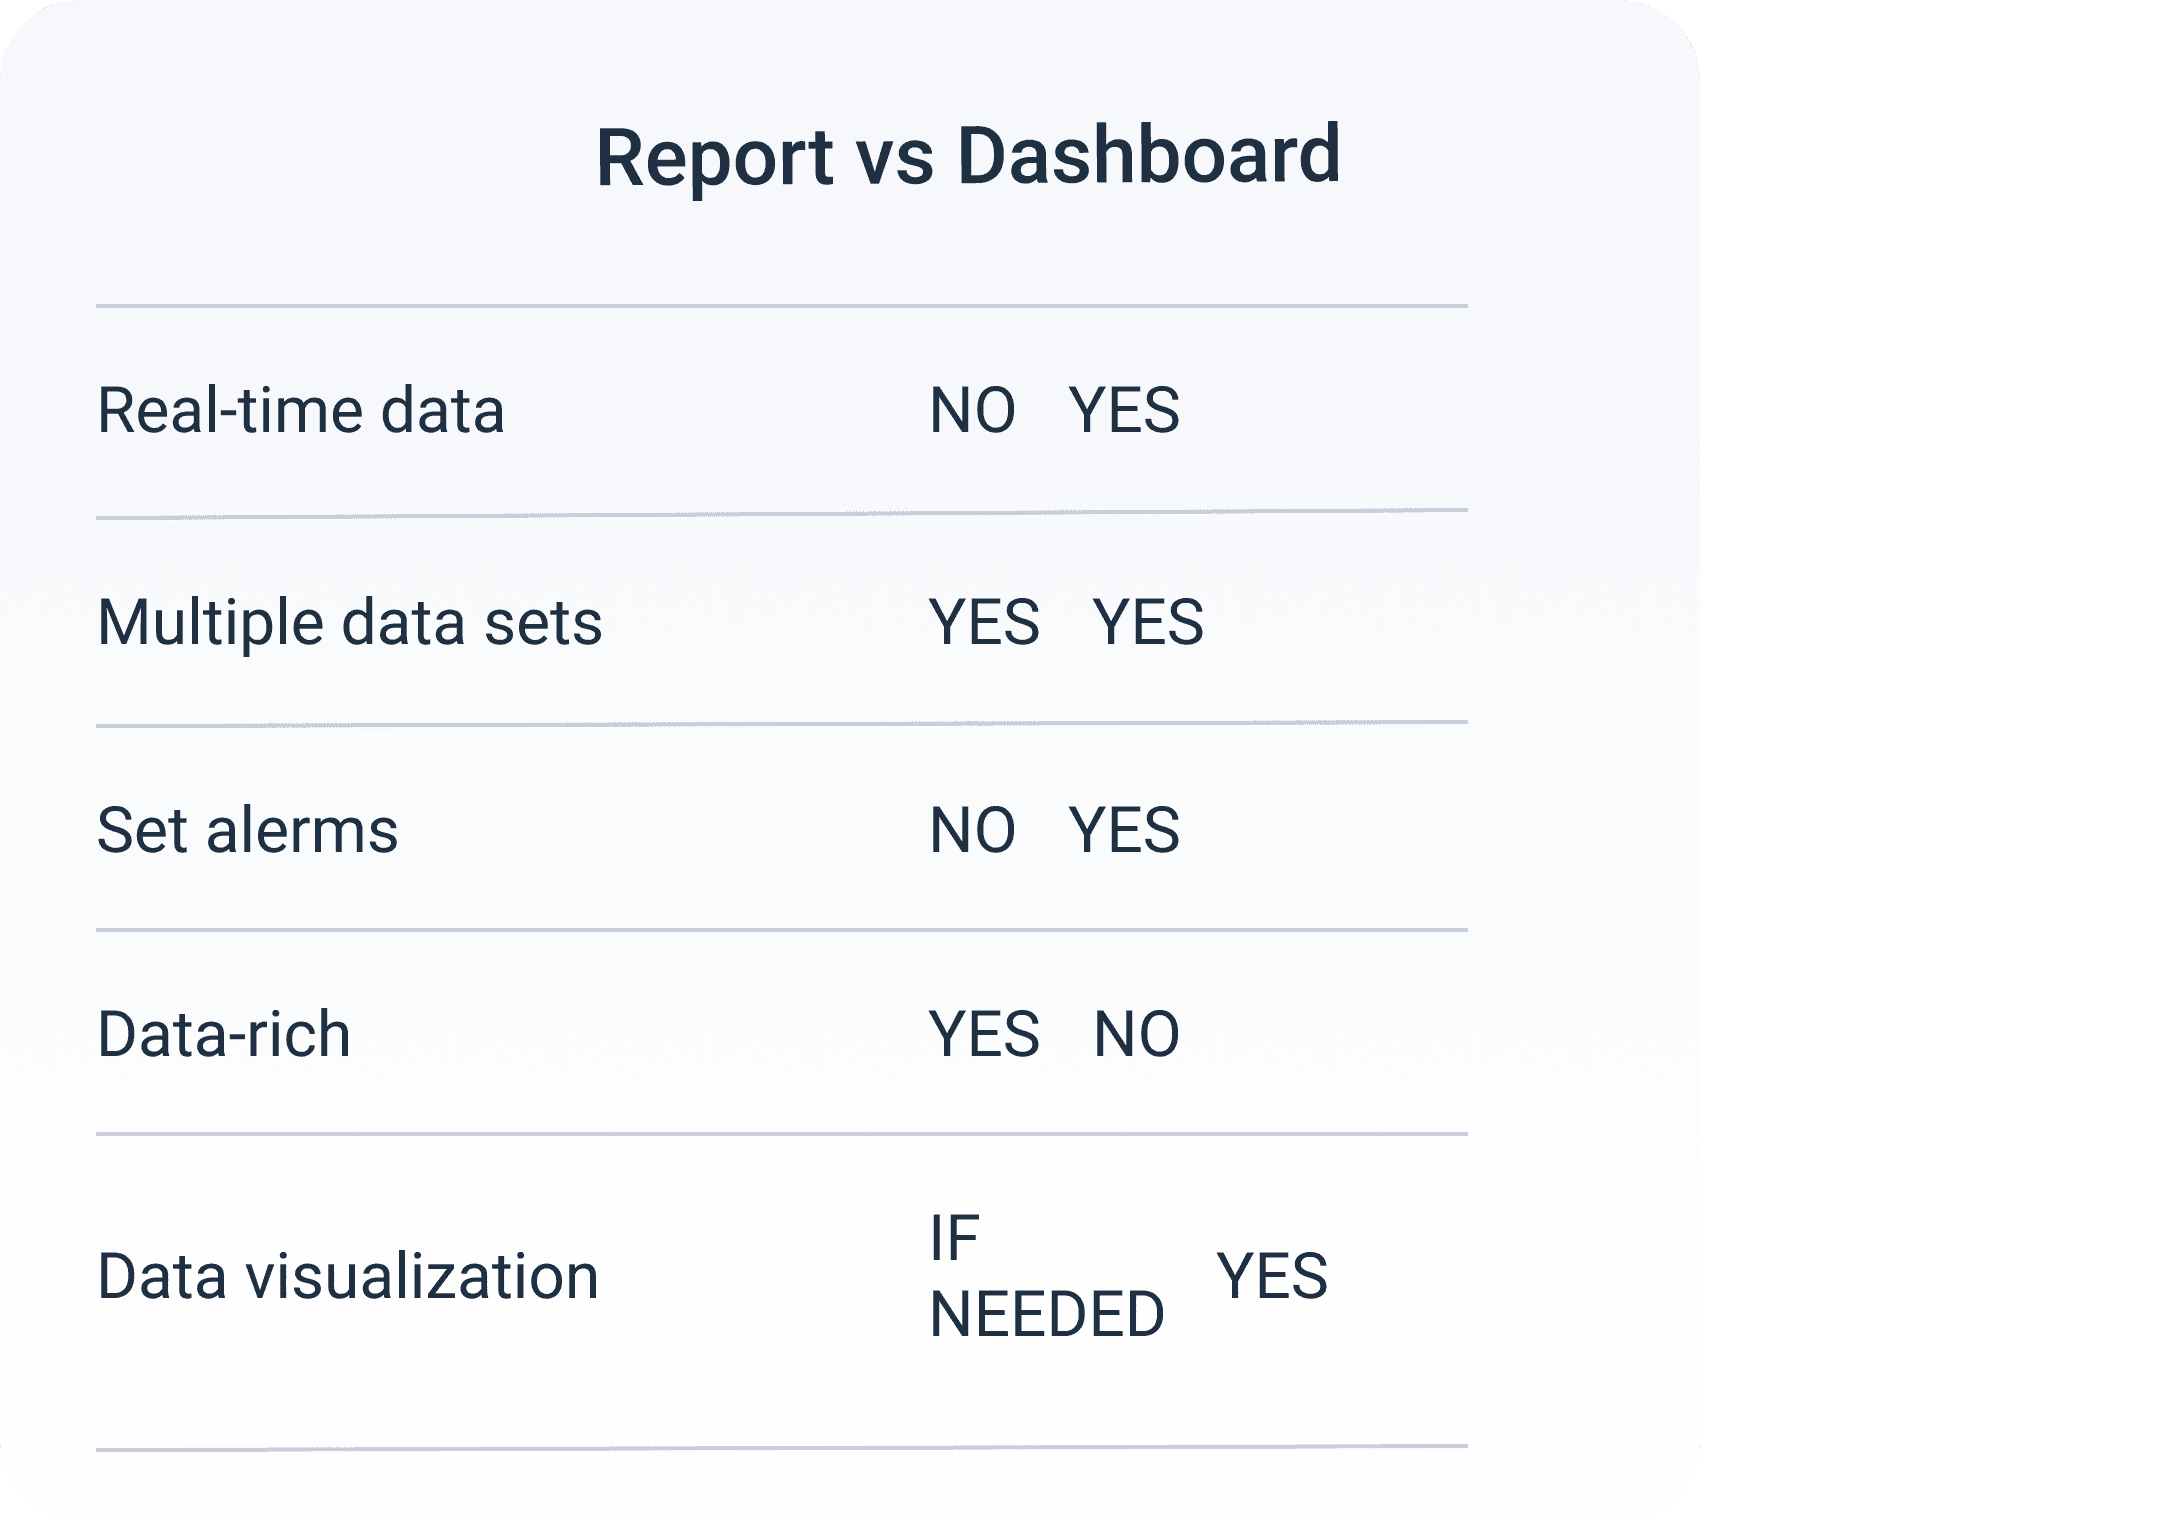
By now you should have a clear understanding of what is dashboard and report. Even this image should tell you when to use either of them. Just to make sure that you really get it here are the instances when each of them is required:
Dashboards - when making quick decisions.
Some specific examples of cases where you'd use a dashboard include:
- Team meetings. The dashboard will tell you how your team is doing and what has been achieved right this second. For team meetings, marketing leads often bring metrics dashboards with the most up-to-date data; visual
- Projects. Every day some businesses look at business dashboards to see how has the project progressed; visual
- Quality assurance. During meetings where the quality of the project and its progress is being discussed, dashboards are usually a go-to tool. It identifies how many bugs there are, where do they usually occur or even how many bugs were closed.
Reports - when you need to study a specific area more in-depth.
- Monthly marketing close-offs. Reports will detail how the team's efforts fared, how particular indicators and KPIs fluctuated, and what needs to be improved or changed;
- Annual marketing reviews. Annual reports are detailed and thorough on a company's accomplishments and financial records for the previous year. visual
- When there is a need to analyze business data performance. These business reports usually have big data and huge amounts of it to analyze the progress.
Even though we determined when to use a report or a dashboard, you'll need both in the end. All of the aforementioned scenarios are common in businesses and marketing organizations. That is, neither of them is superior to the other. They're both required at different times.
Bottom line
It's just as vital to know when to use a dashboard and when to utilize a report as it is to find a tool that can offer you both. Whatagraph is ideal for businesses and marketing agencies as it has all the features mentioned and more! It's a great monitoring and reporting tool that already had pre-made templates for anyone to get started now.
Invest in your company's future by implementing Whatagraph's data analytics platform today. Contact us and receive a 14-day free trial to test our services and features, as well as a personalized half-hour demo tour!
Published on Jan 10 2022
WRITTEN BY
Dominyka VaičiūnaitėDominyka is a copywriter at Whatagraph with a background in product marketing and customer success. Her degree in Mass Communications/Media Studies helps her to use simple words to explain complex ideas. In addition to adding value to our landing pages, you can find her name behind numerous product releases, in-app notifications, and guides in our help center.