10 Best Marketing Dashboard Examples to Get Inspiration From
Looking for marketing dashboard examples that are actually useful?
Here you’ll find 10 inspiring marketing dashboard examples—divided into categories, like social media, email marketing, white-label, and marketing KPIs.

Jan 06 2026●5 min read


- 10 Marketing Dashboard Examples To Steal (+ Templates To Use)
- 1. White Label Marketing Dashboard Example
- 2. Marketing KPI Dashboard Example
- 3. Digital Marketing Dashboard Example
- 4. Social Media Dashboard Example
- 5. Email Marketing Dashboard Example
- 6. E-commerce Marketing Dashboard Example
- 7. Google Ads Dashboard Example
- 8. Google Analytics Dashboard Example
- 9. Facebook Ads Dashboard Example
- 10. Small Business Dashboard Example
- Create marketing dashboards that help to prove ROI to clients
The problem with most marketing dashboards is that they’re filled with data, but they don’t tell a clear story. This leaves clients more confused than informed.
The best marketing dashboards highlight the KPIs that truly matter, show trends over time, and explain what actionable steps clients can take next.
In this article, I’ll show you the best examples of marketing dashboards. For each marketing dashboard, I’ll cover:
1. What is it best for?
2. What key metrics should you include?
3. How to structure it?
I’ll also share marketing dashboard templates and best practices collected from agency leaders and marketing experts.
Let’s begin.
10 Marketing Dashboard Examples To Steal (+ Templates To Use)
Here’s a list of the digital marketing dashboard examples I’ll go through today:
- White-label dashboard
- Marketing KPI dashboard
- Digital marketing dashboard
- Social media dashboard
- Email marketing dashboard
- e-Commerce marketing dashboard
- Google Ads dashboard
- Google Analytics dashboard
- Facebook Ads dashboard
- Small business dashboard
These marketing dashboards are meant to be used as inspiration, but Whatagraph gives you a shortcut for building dashboards—instantly.
You can use Whatagraph IQ to create reports, color schemes, and widgets—all without any manual work.
It works in three simple steps:
- Choose “Create with IQ” under New Report.
- Select your data sources
- Type in your prompt and explain what type of report you want to create. For example, a prompt could be, “Create a cross-channel report highlighting the top channels and ad campaigns.”
And that’s literally it. Wait a few seconds and you’ll have a full report.
See how it works in this video:
1. White Label Marketing Dashboard Example
A white-label marketing dashboard lets you fully customize the look and feel of your dashboards and reports. You can add your agency's name, logo, brand colors, text style, and more.
Best for: Agencies with 10+ clients that want to match their clients' branding.
Use this dashboard for free with your data
Key metrics to include:
- Conversions
- Total users, new users, sessions
- KPIs for each channel (e.g. Google Ads, Facebook Ads)
- ROAS
- Top performing ads and social posts
- Revenue
How to structure it:
- Branded visuals: Start by modifying your dashboard name and adding your logo. Add new color themes, branded subdomain, footer texts, comments, and more.
- Performance overview: Show marketing goals reached, new followers, likes, sessions, and impressions across all channels.
- Device breakdown: Break down performance by devices. Show if desktops, tablets, or mobile devices are bringing the most results.
- Ad creative breakdown: Visually display the best-performing ad creatives. Show the engagement metrics, such as likes, shares, and comments.
- Recommendations: Clients want to hear what’s working, what needs attention, and where to pivot. Add a section with actionable steps focusing on these factors.
On the topic of structuring your white-label dashboard, this is what Odi Caspi, the founder of Happy PPC, recommended doing:
We’ll often include short notes or examples alongside metrics to demonstrate what they mean, highlight successes, or describe what actions we are taking where there are issues. It helps make reading the reports more reassuring for clients, rather than risk leaving anything open to interpretation.
One “hack” for adding notes for metrics is using Whatagraph’s AI performance summaries.
Ask Whatagraph’s AI to summarize the available data. After this, you can simply add it to your Text Widget.
You can always modify the text further to add a bit of a human touch.
2. Marketing KPI Dashboard Example
A marketing KPI dashboard aggregates data from multiple sources, such as PPC, social media, and email—to show a 360-degree view of marketing performance.
Best for: A comprehensive snapshot of clients’ campaign performance across multiple channels.
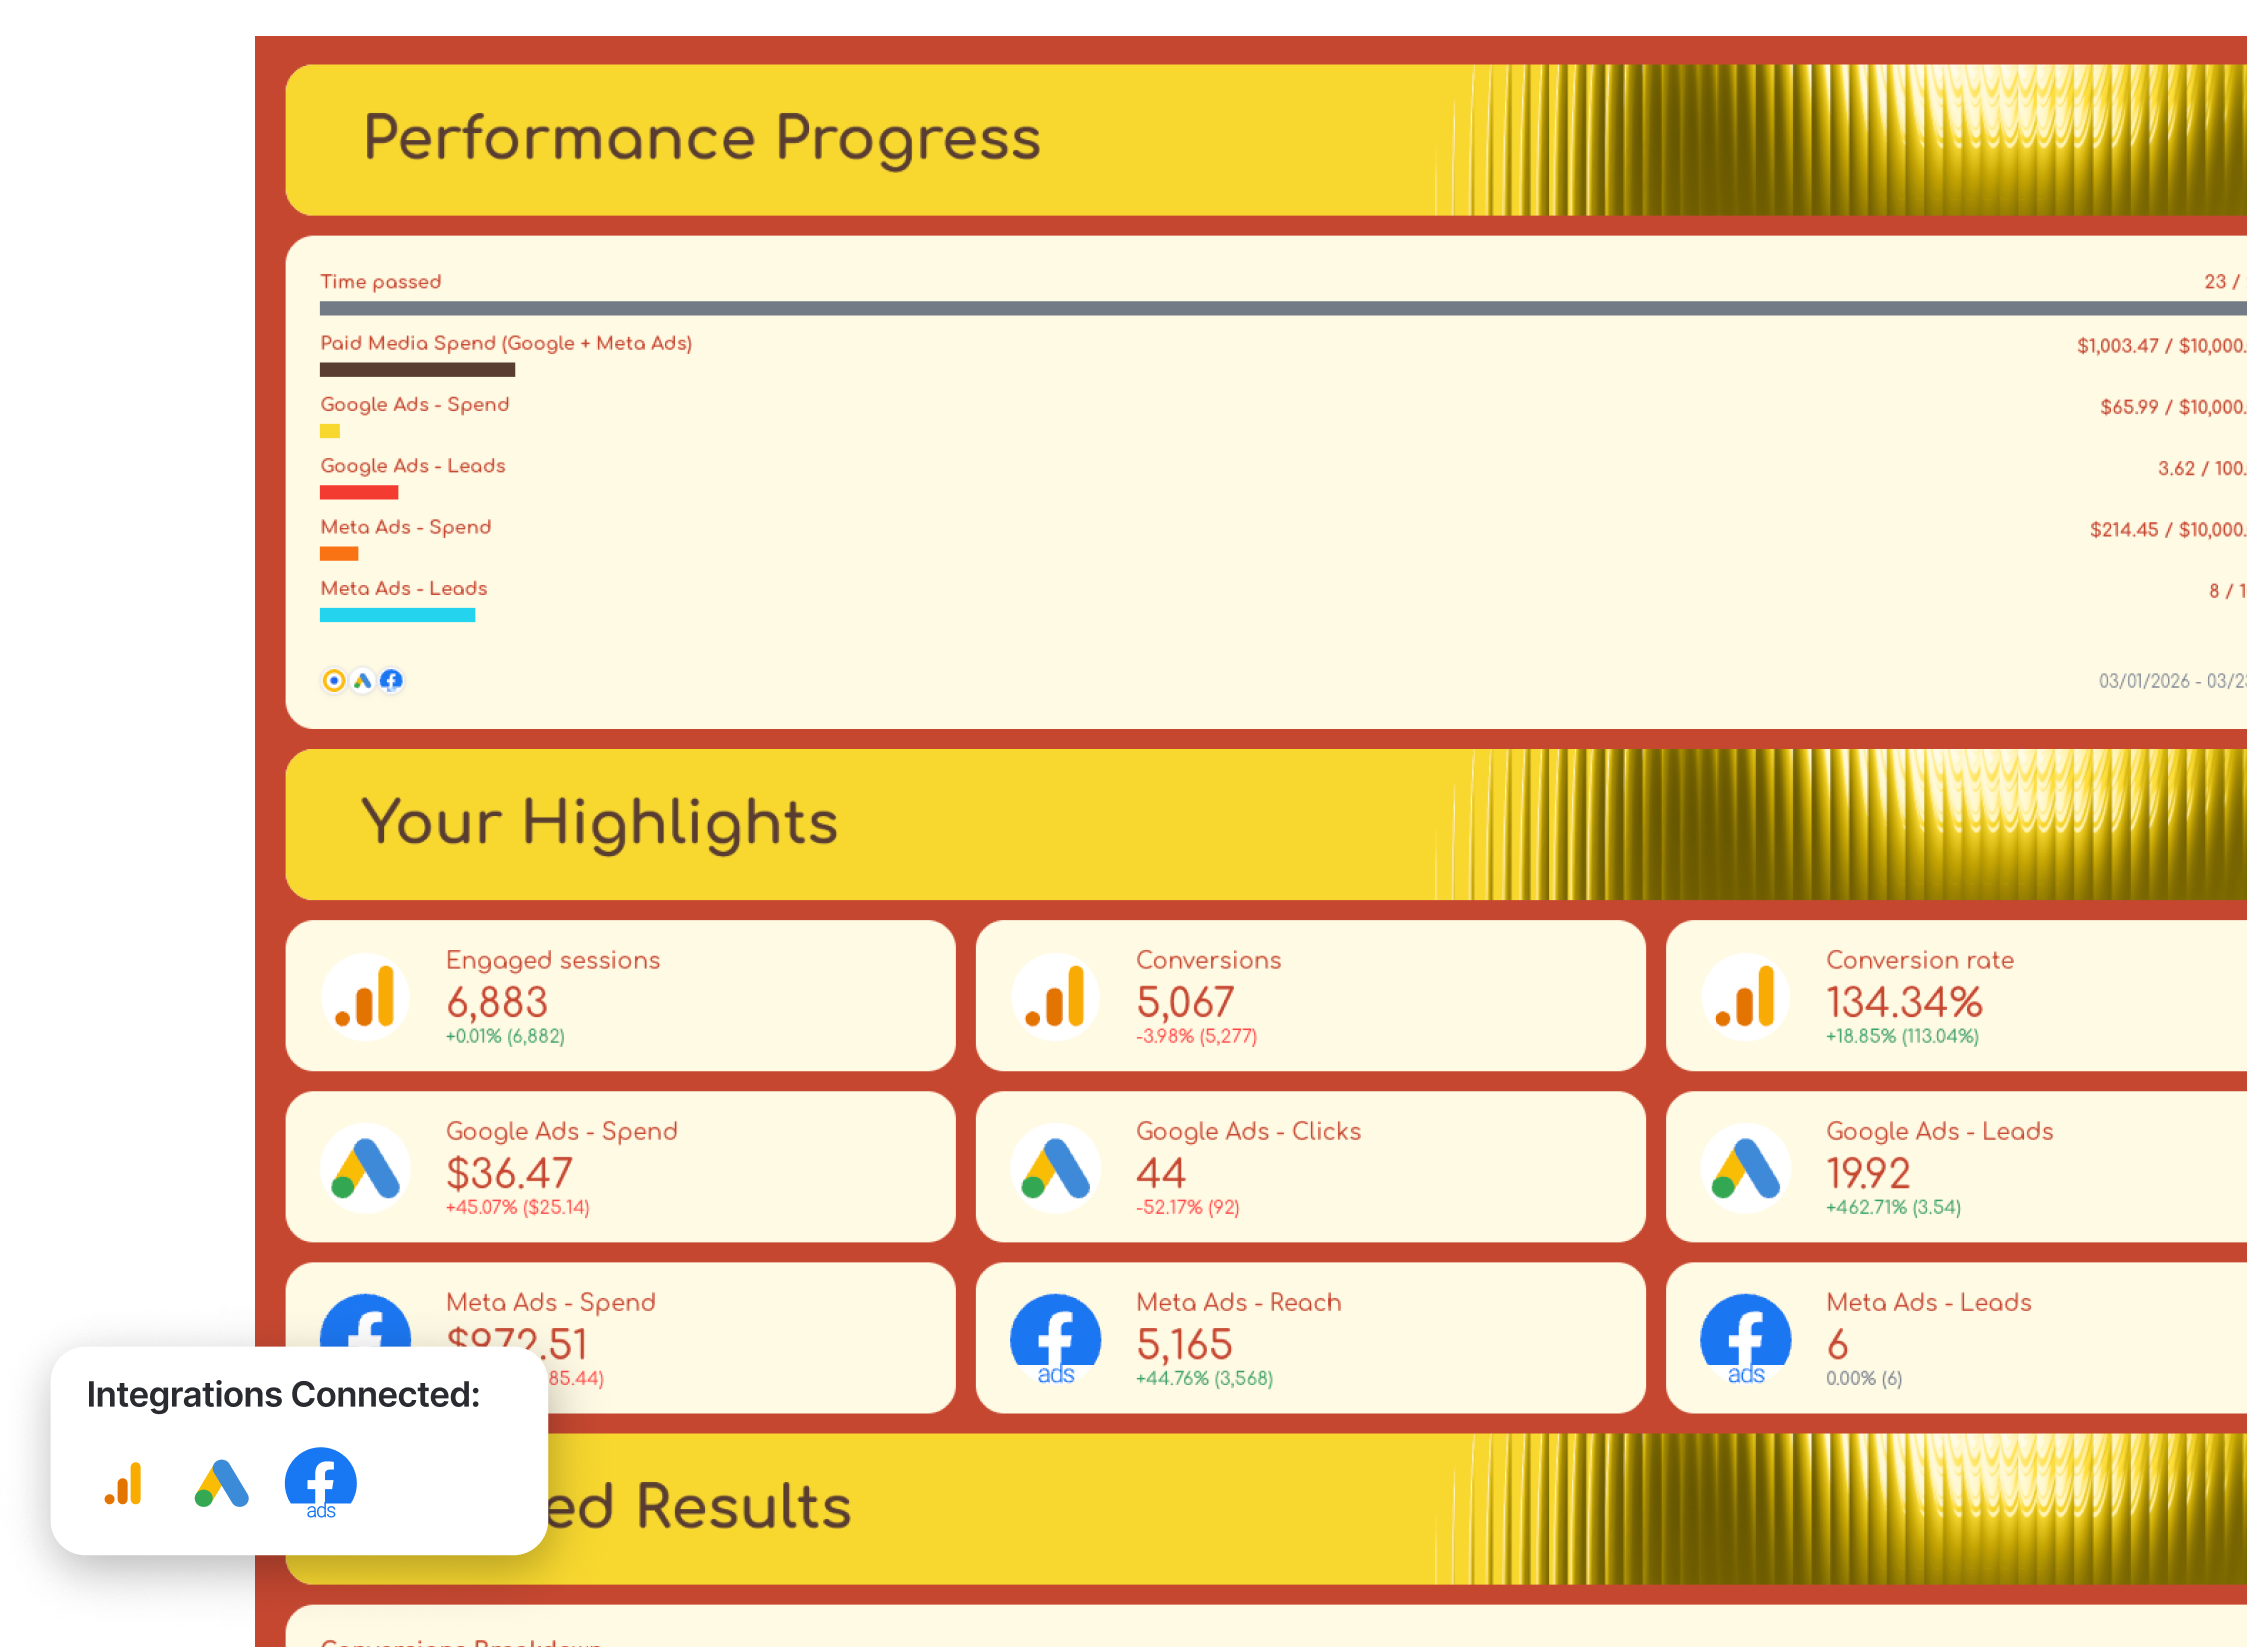
Use this dashboard for free with your data
Key metrics to include:
- Conversion rate
- Average order value
- Website traffic and sources
- Leads by date
- Top performing ads
- Revenue
How to structure it:
- Executive Summary: Write out key insights and recommendations for the next month. Use Whatagraph IQ to write the first draft based on the data on your report, then tweak later.
- KPI overview: Display the 3-5 main KPIs at the beginning. These can be the number of new users, average order value, item quantity, CTR, and more.
- Monthly performance: Create a chart showing performance by month—the total spend, impressions, link clicks, ROAS, and more.
- Campaign overview: List the top campaigns by new leads, impressions, CTR, bounce rate, and more.
- Performance funnel overview: Display your sales funnel and each of its steps. Outline where improvements can be made and what needs further work.
- Secondary KPIs: Show any secondary KPIs in simple graphs or charts. Like one Reddit user said, you can go into deeper insights if your clients, marketing, or sales team requires that:
One thing our team wanted to know is where to invest marketing $$ to get more downloads. It is a simple question, but the answer is deeper than you might think. We need to combine product usage and retention data with the associated marketing channel that we acquired.
- Recommendations: Suggest the next steps with simple bullet points. What’s working? What’s not? How can we improve our campaigns?
3. Digital Marketing Dashboard Example
Digital marketing dashboards pull performance data from all digital channels (e.g., website, social media, and email marketing) into one view.
Best for: Understanding return on investment across channels, tracking performance goals, and identifying conversion trends over time.

Use this example for free with your data
Key metrics to include:
- Conversions
- Total spend
- Cost per conversion
- Key metrics for each channel (e.g. Google Ads, Facebook Ads)
- Return on ad spend (ROAS)
Data accuracy is key to online marketing metrics. You’ll most likely pull data from multiple sources and want accurate cross-channel insights.
This is what Odi from Happy PPC had to say about it:
As a PPC agency, the accuracy of the data coming into the dashboard is critical; if the numbers aren’t reliable, then we cannot get accurate insights into how campaigns are performing. We also rely on real-time data syncing, having flexible filtering options, and the ability to pull information from multiple ad platforms into one report.
At Whatagraph, our integrations are fully managed, which means they’re more reliable than third-party connectors you’d get from different vendors.
We also offer a 30-minute consistent data refresh rate across all data sources and blends—meaning your cross-channel insights are always up-to-date every 30 minutes.
How to structure it:
- Performance overview: What are your clients’ or marketing teams' 3-5 key performance metrics? List them at the beginning of your digital marketing dashboard.
- Traffic overview: Show which channels bring in the most traffic. Highlight direct, paid, referral, organic traffic, and more.
- Cross-channel performance: Break down organic, paid ads, and email marketing performance side-by-side.
- Conversion insights: Create a chart showing the number of conversions per day. This gives a quick overview of how conversions are evolving overtime.
- Custom filters: Make it possible for users to adjust the view by date, campaign, or region.
4. Social Media Dashboard Example
A social media dashboard lets you bring all of your social media data—Facebook, LinkedIn, TikTok, Instagram, and more—into one place.
Best for: Blending similar metrics from all social media channels together to see the big picture of the performance.

Use this dashboard for free with your data
Key metrics to include:
- Conversions by platform
- Click-through rate
- Likes, comments, shares (all engagements)
- Country activity
- Follower growth
How to structure it:
Start with an overview, so clients can quickly see what’s going on in the social media campaigns.
This is what Caleb Johnstone, the SEO Director at Paperstack, also recommended:
I personalize the dashboard to ensure that I only add the most important metrics. I use simple explanations and do not use jargon.
- Cross-channel campaign performance: Display how your campaigns are performing across all channels. Show conversion rate, new users, target progress, and total sessions.
- Performance by channel: Divide each channel into its own section for deeper insights. Show each channels key metrics—for example total followers, clicks, likes, and comments for LinkedIn.
- Actionable tips: Create a performance summary using AI and explain actionable steps you can take.
5. Email Marketing Dashboard Example
An email marketing dashboard gives you an overview of your most important email marketing metrics, like open rate, click-through rate, and bounce rate.
Best for: Tracking and optimizing email campaigns and comparing the performance to other channels, like social media or PPC.
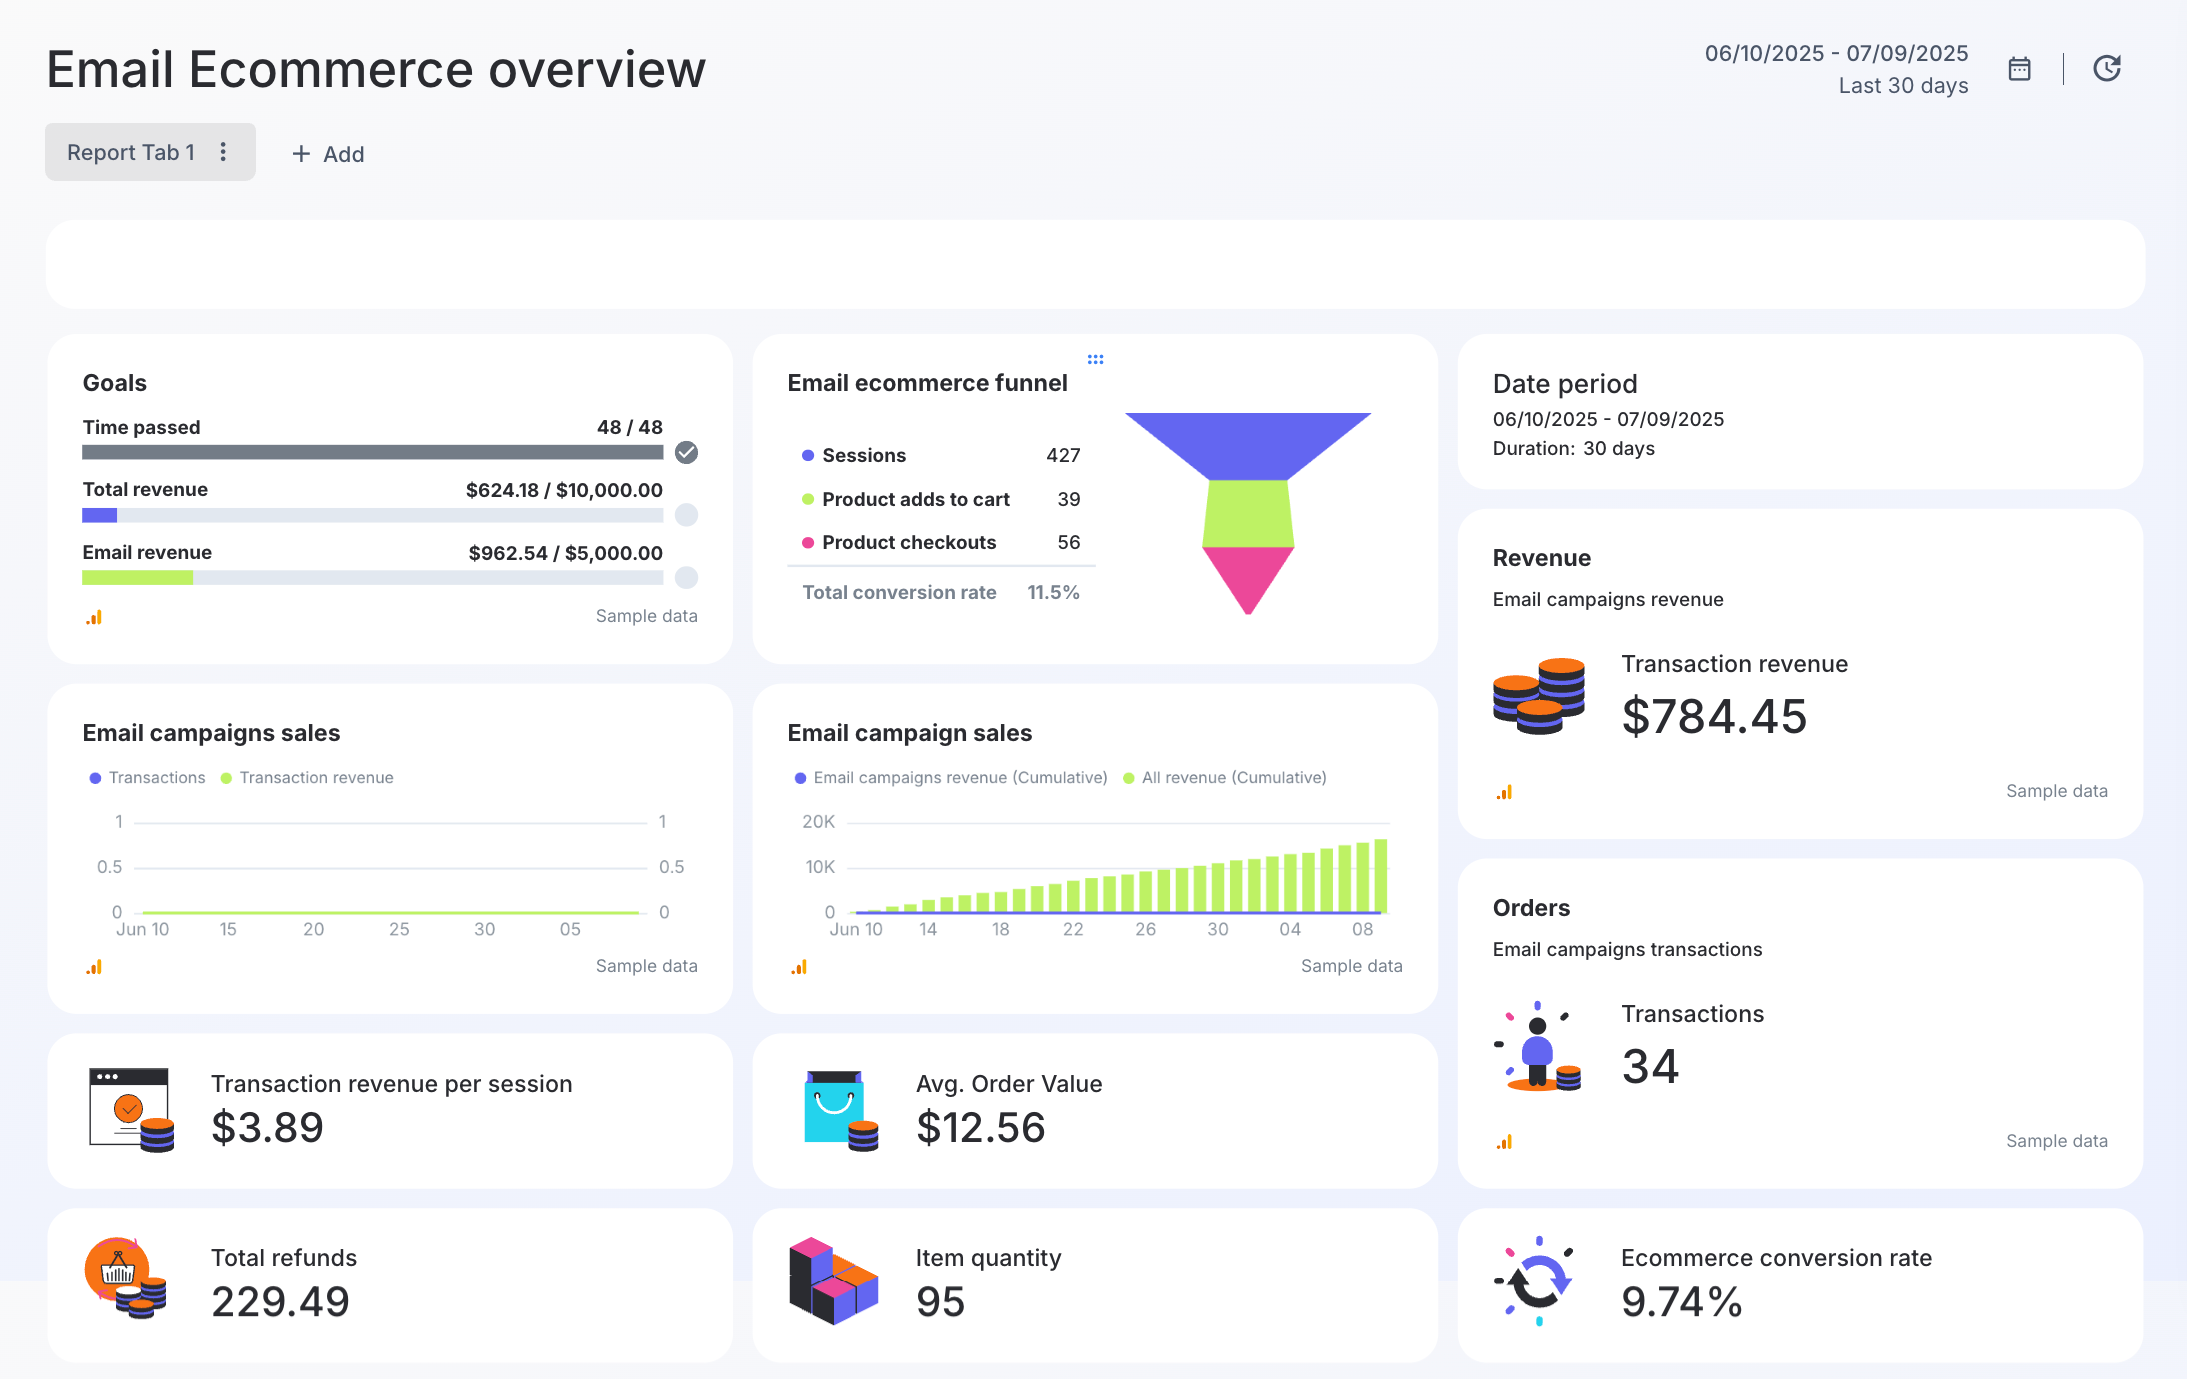
Key metrics to include:
- Transaction revenue
- Emails sent
- Open rate
- Reply rate
- Bounce rate
- Unsubscribe rate
- CTR
How to structure it:
- Performance summary: Transaction revenue, email campaign sales, conversion rate, and average order value are all key metrics to include here. According to this user, focusing on key metrics is key for simplicity:
Most stakeholders want answers, not the ability or time required to slice and dice data.
- Campaign table: Show the top email campaigns—ranked by the number of transactions, average order value, and transaction value.
- Sales channel overview: Compare email marketing performance with paid ads, organic, referral, and other channels.
- Acquisition overview: Create a table listing products and categories with the most sales from the email campaigns.
6. E-commerce Marketing Dashboard Example
No matter the ecommerce platform you use, an ecommerce marketing dashboard shows you real-time sales data across all marketing data sources.
Best for: Ecommerce businesses that need to understand which products, channels, or campaigns drive most of the revenue.
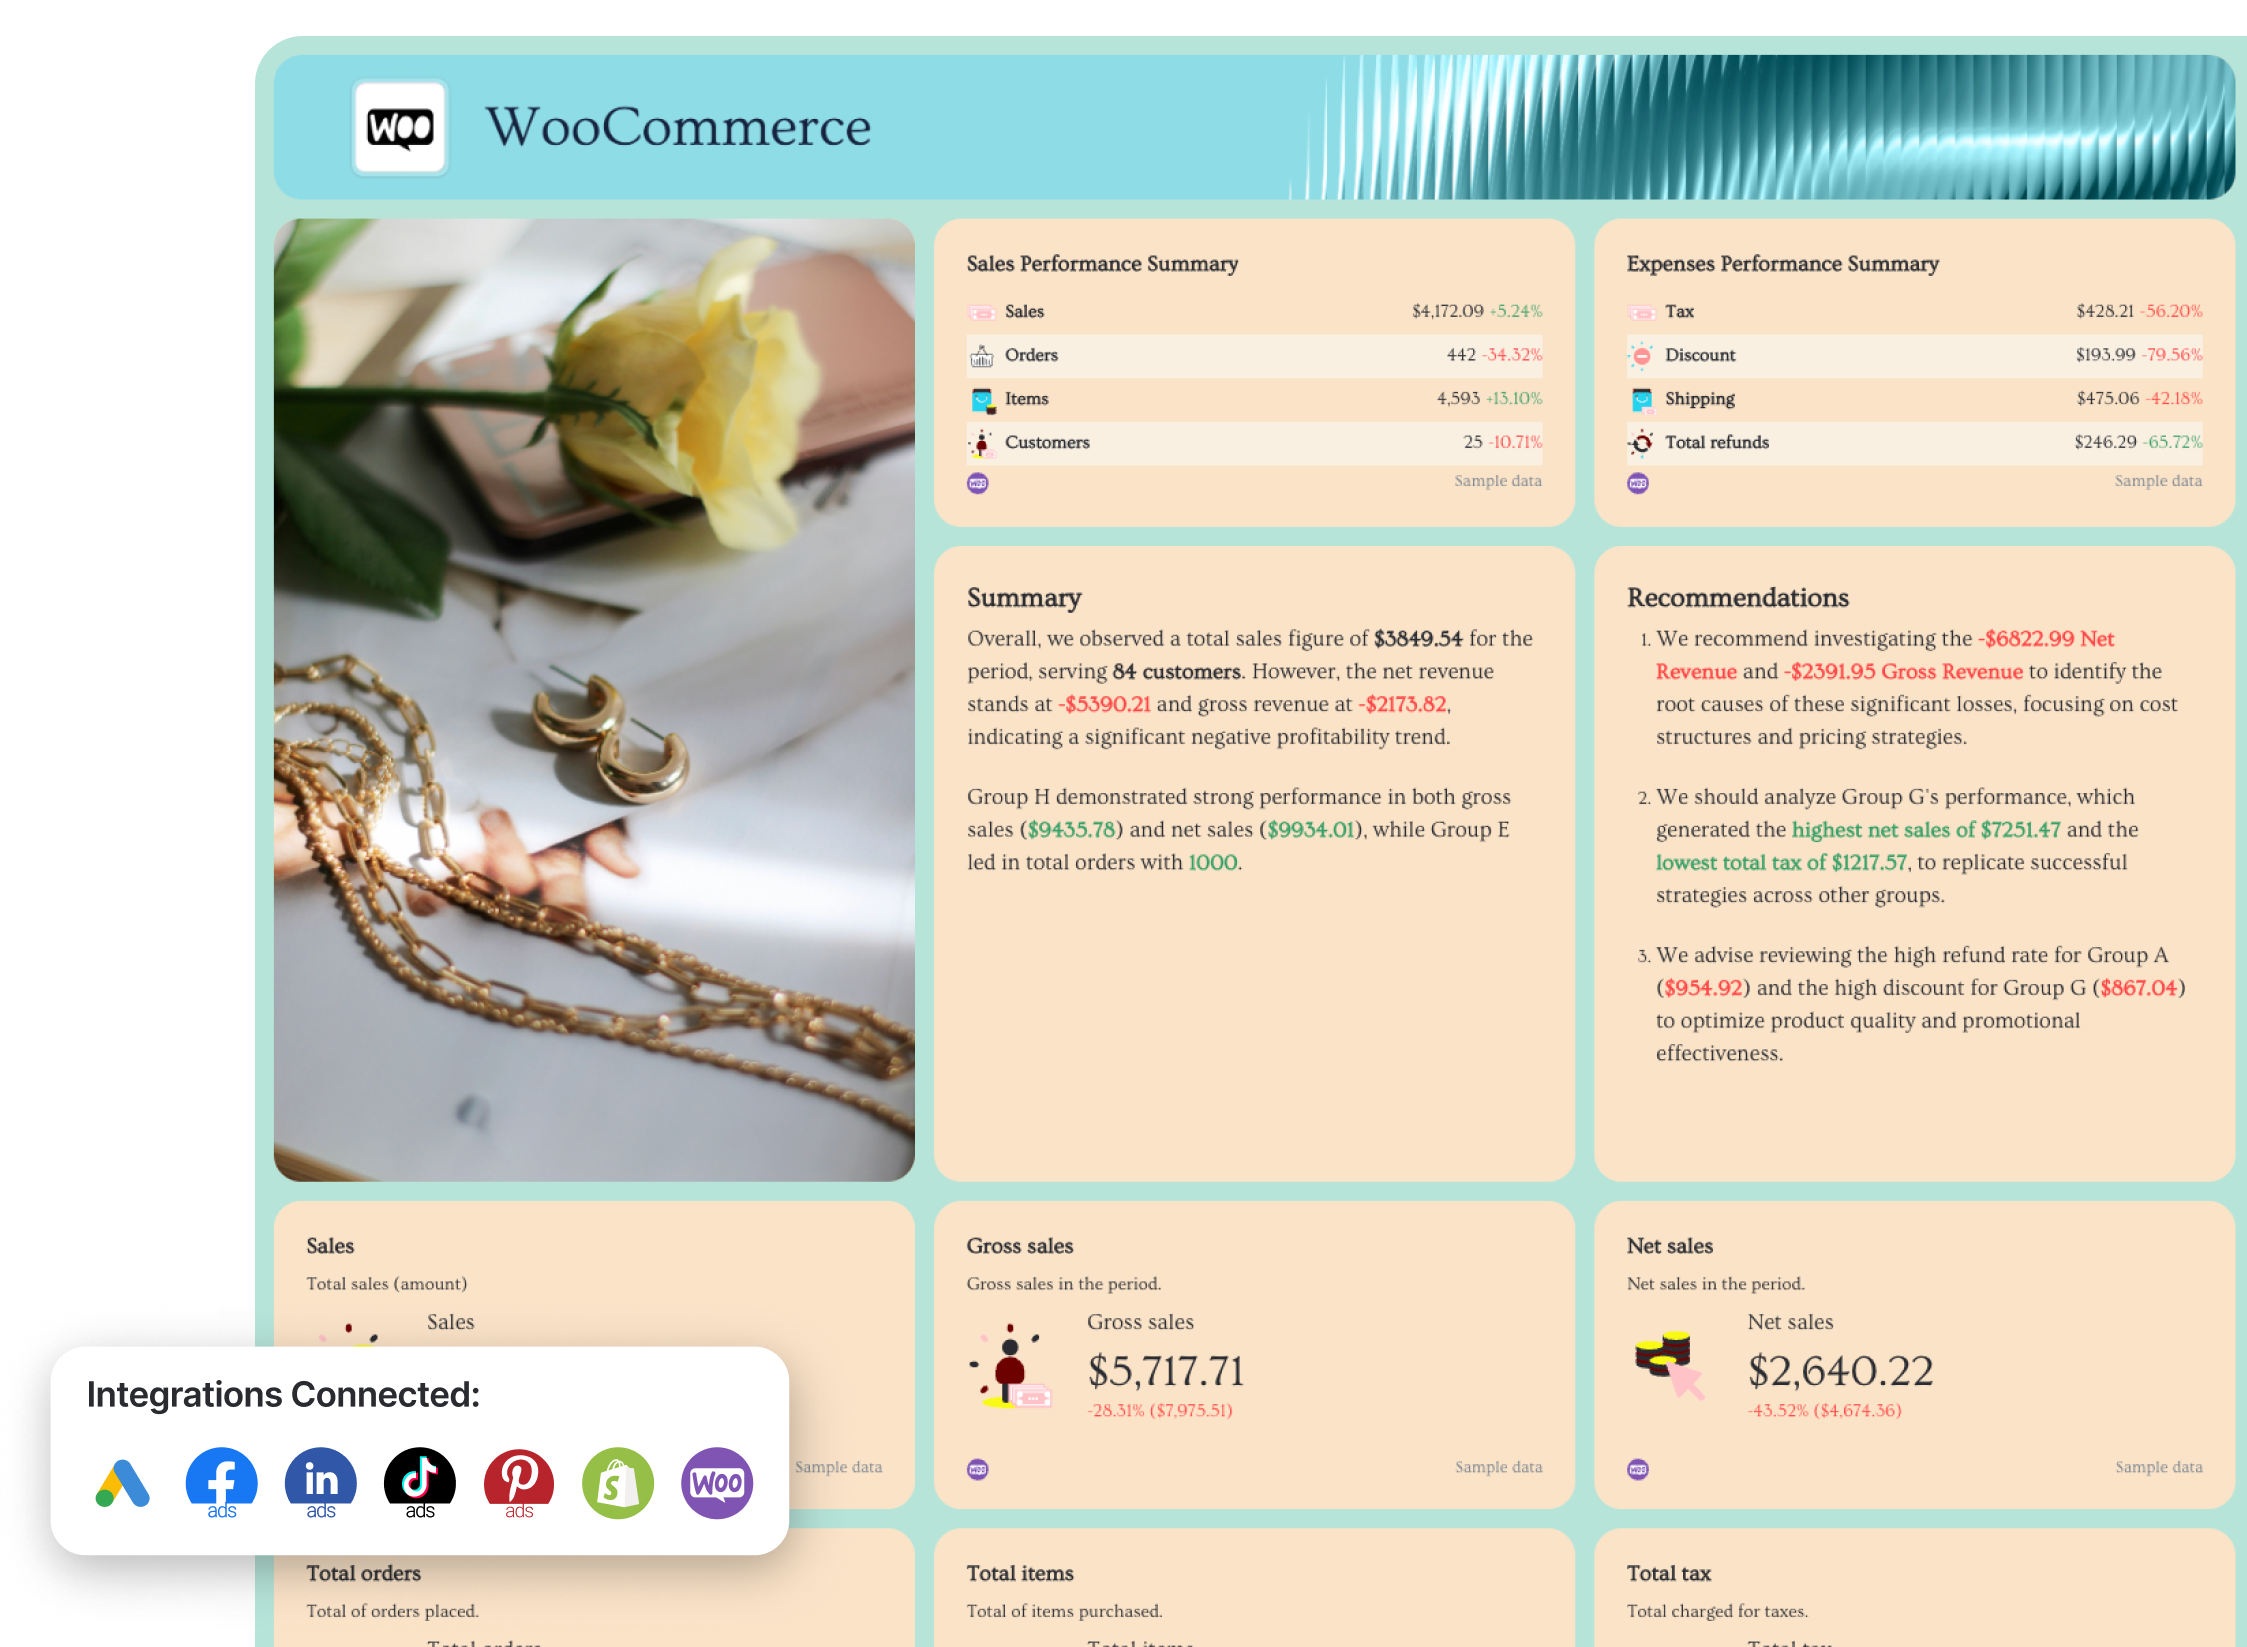
Use this dashboard for free with your data
Key metrics to include:
- Total revenue
- Average order value
- Amount spent
- Website traffic
- Item quantity
How to structure it:
- Campaign overview: Highlight revenue, average order value, amount spent, total revenue, and sales goals.
- Revenue source overview: Clearly show the highest revenue sources—whether they’re paid ad, organic, or email campaigns.
- Acquisition cost: Create a chart comparing ad cost and revenue over time.
- Product performance table: Create a table listing the products that bring the most revenue. Track the item quantity to make sure you have enough stock.
- Ecommerce sales funnel: Visualize drop-off from sessions to checkout and transactions.
- Audience performance: List the countries bringing the most conversions, sales by customer type, devices used, and hours when sales are highest.
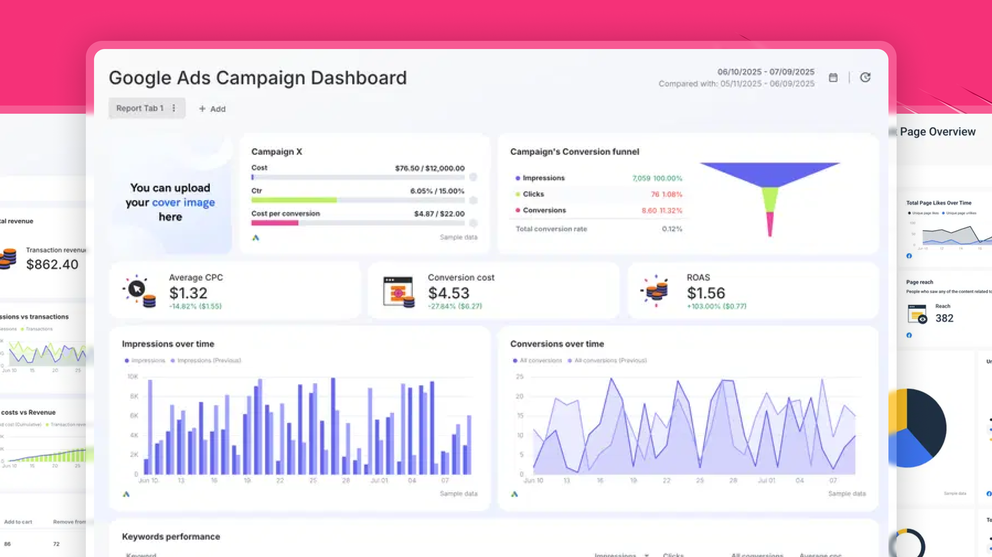
7. Google Ads Dashboard Example
A Google Ads dashboard helps to track your Google Ads performance. You can combine Google Ads data with other channels, like TikTok or Meta Ads, to get a holistic view of the performance.
Best for: Understanding the ROI of your Google Ads campaigns, the best-performing ad campaigns, and which parts of your marketing funnel are broken or working.
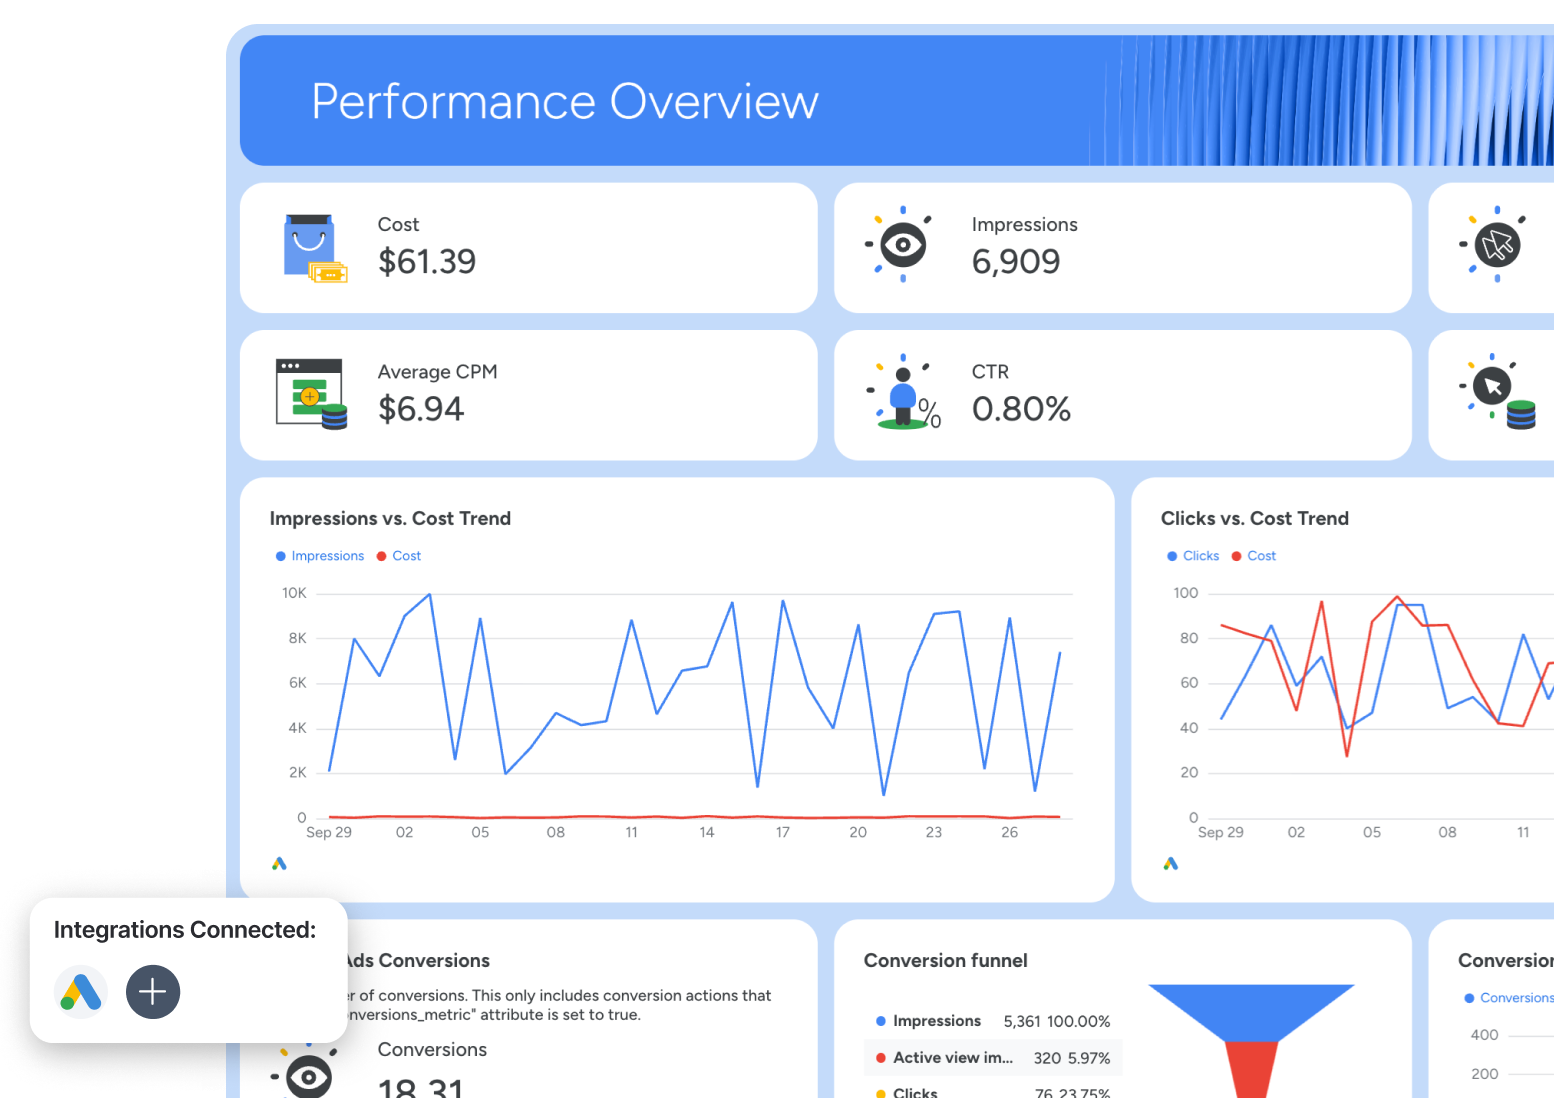
Use this dashboard for free with your data
Key metrics to include:
- Total spent
- Average CPM
- Clicks and impressions
- Cost per click (CPC)
- Click-through rate (CTR)
- Return on ad spend (ROAS)
- Average order value
How to structure it:
- Performance overview: Show average CPC, conversion cost, ROAS, conversion funnel, CTR, and campaign cost.
- Acquisition overview: Identify which keywords are bringing in the most conversions. Highlight each keyword's impressions, clicks, conversions, and CPC.
- Recommendations: Summarize actionable steps based on your insights. Focus on boosting ROI, optimizing spend, and improving Google Ads effectiveness.
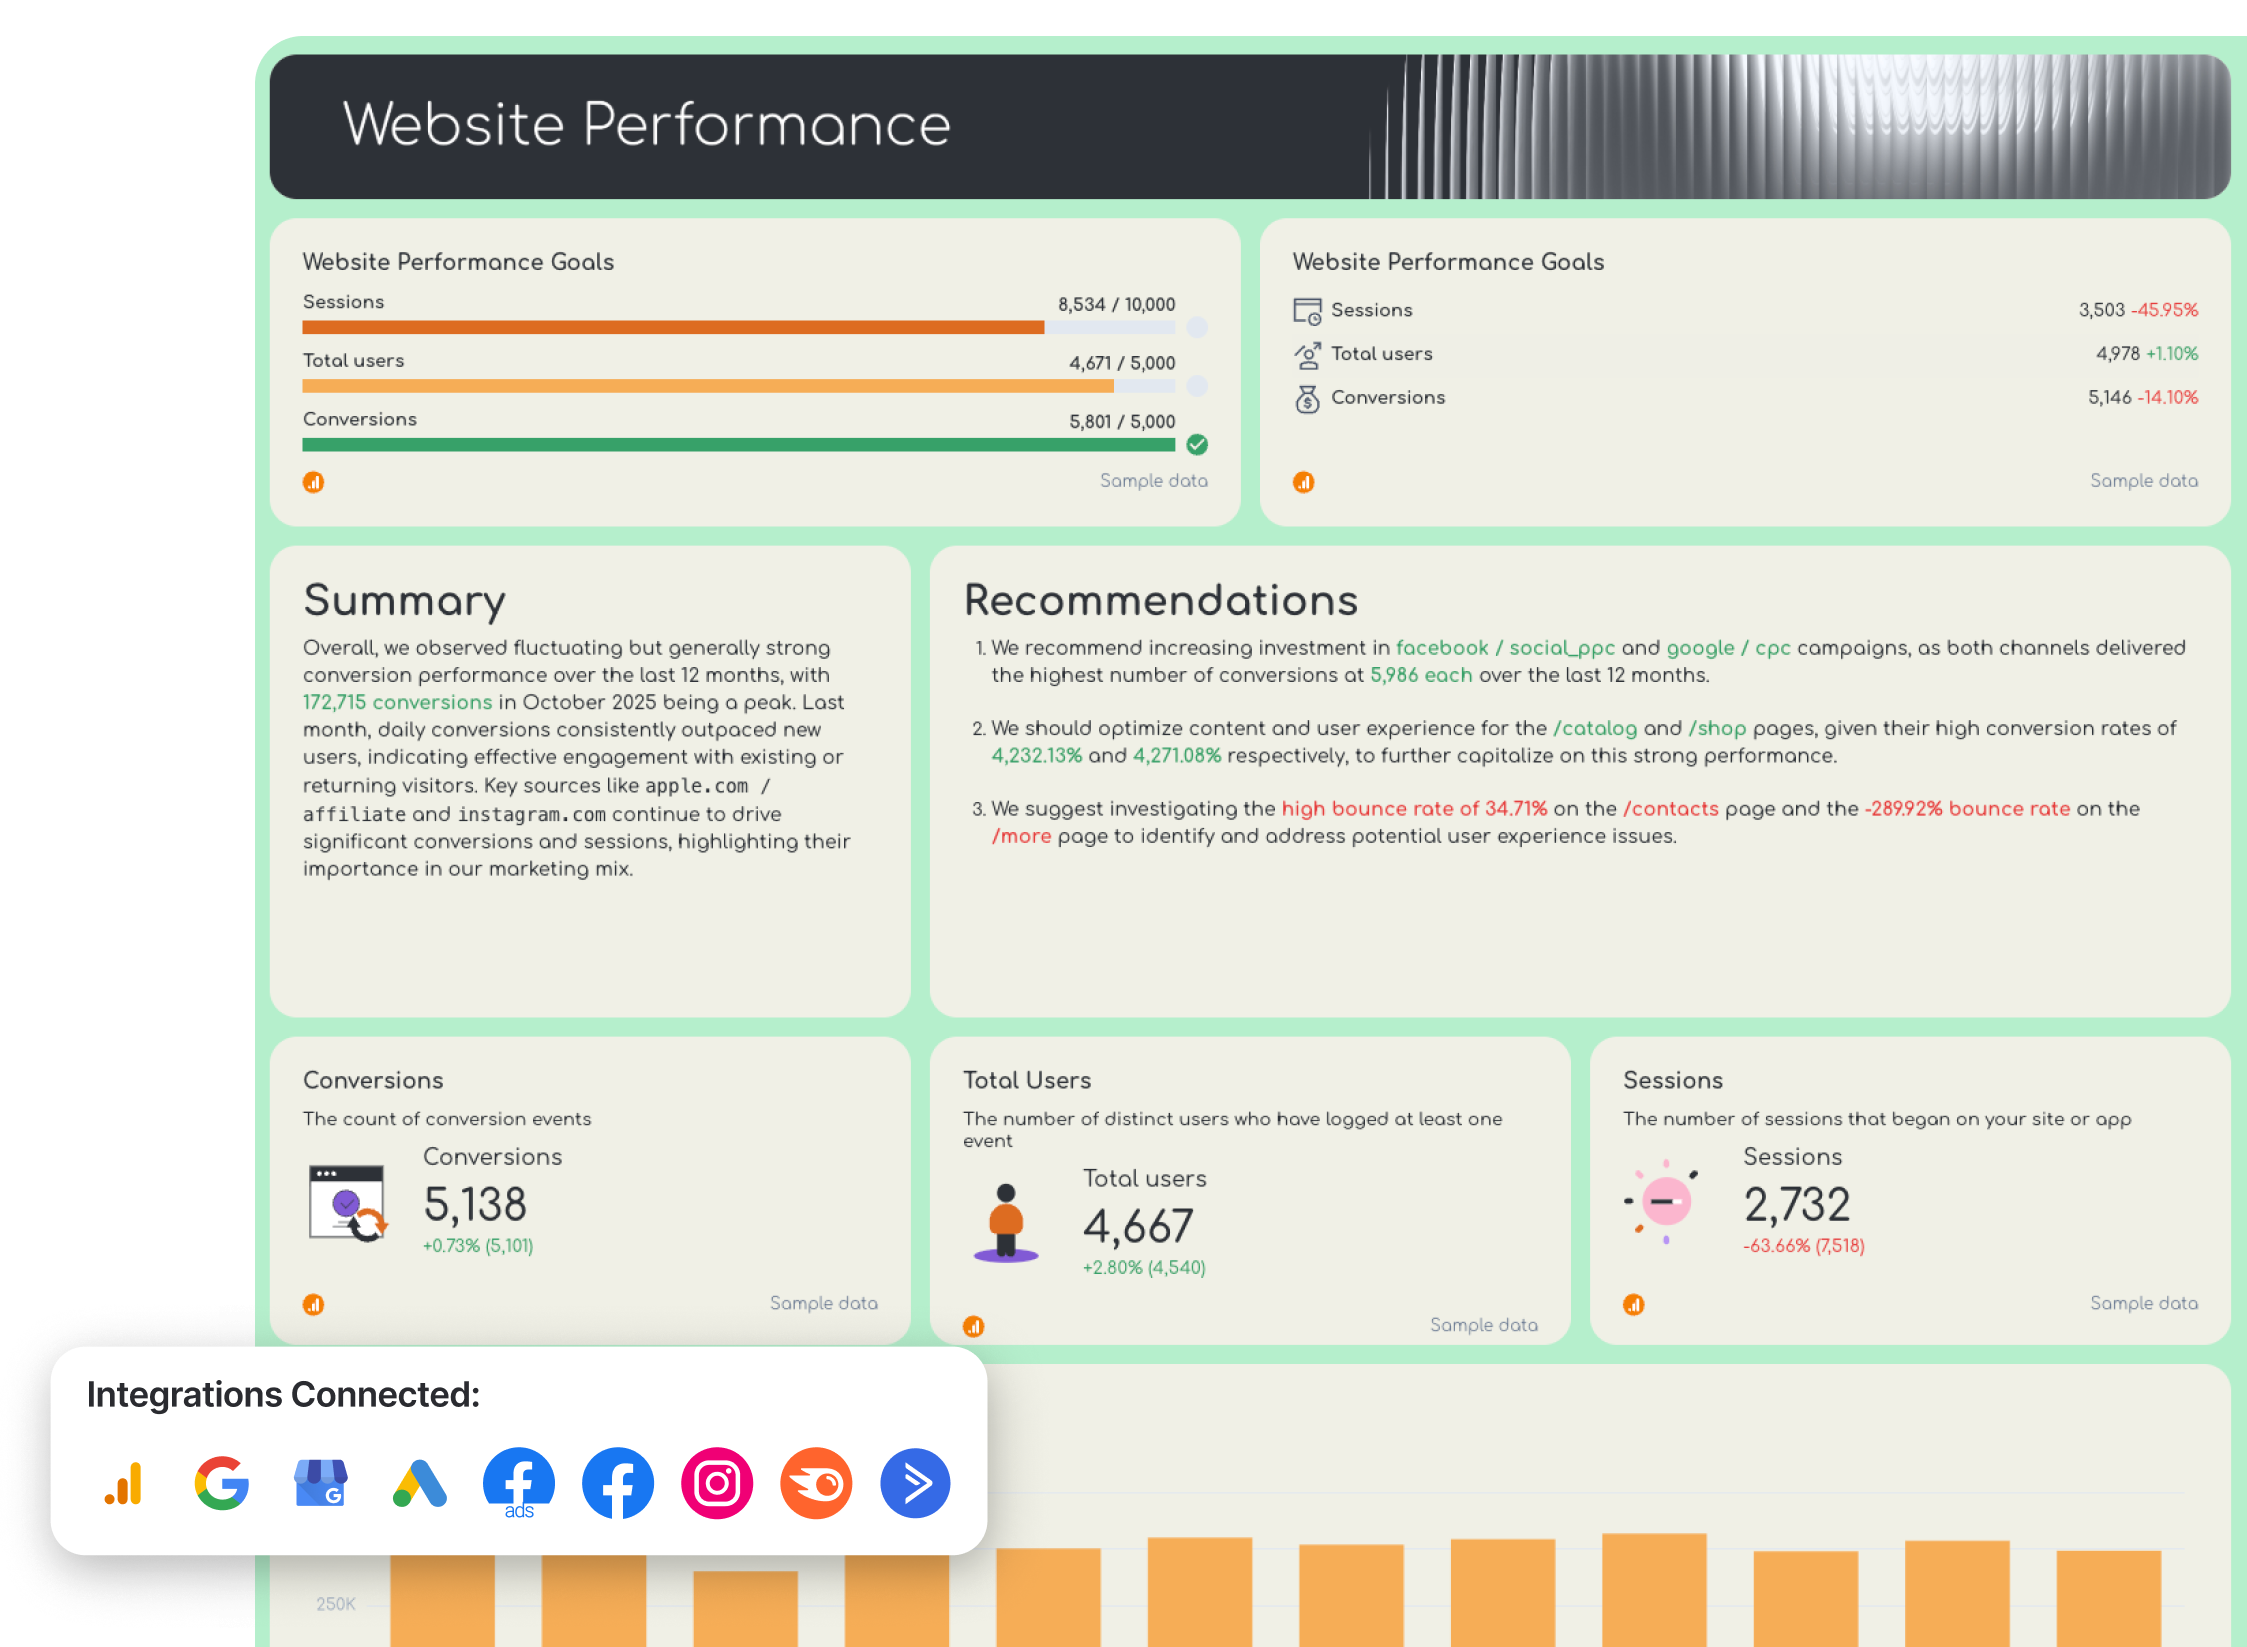
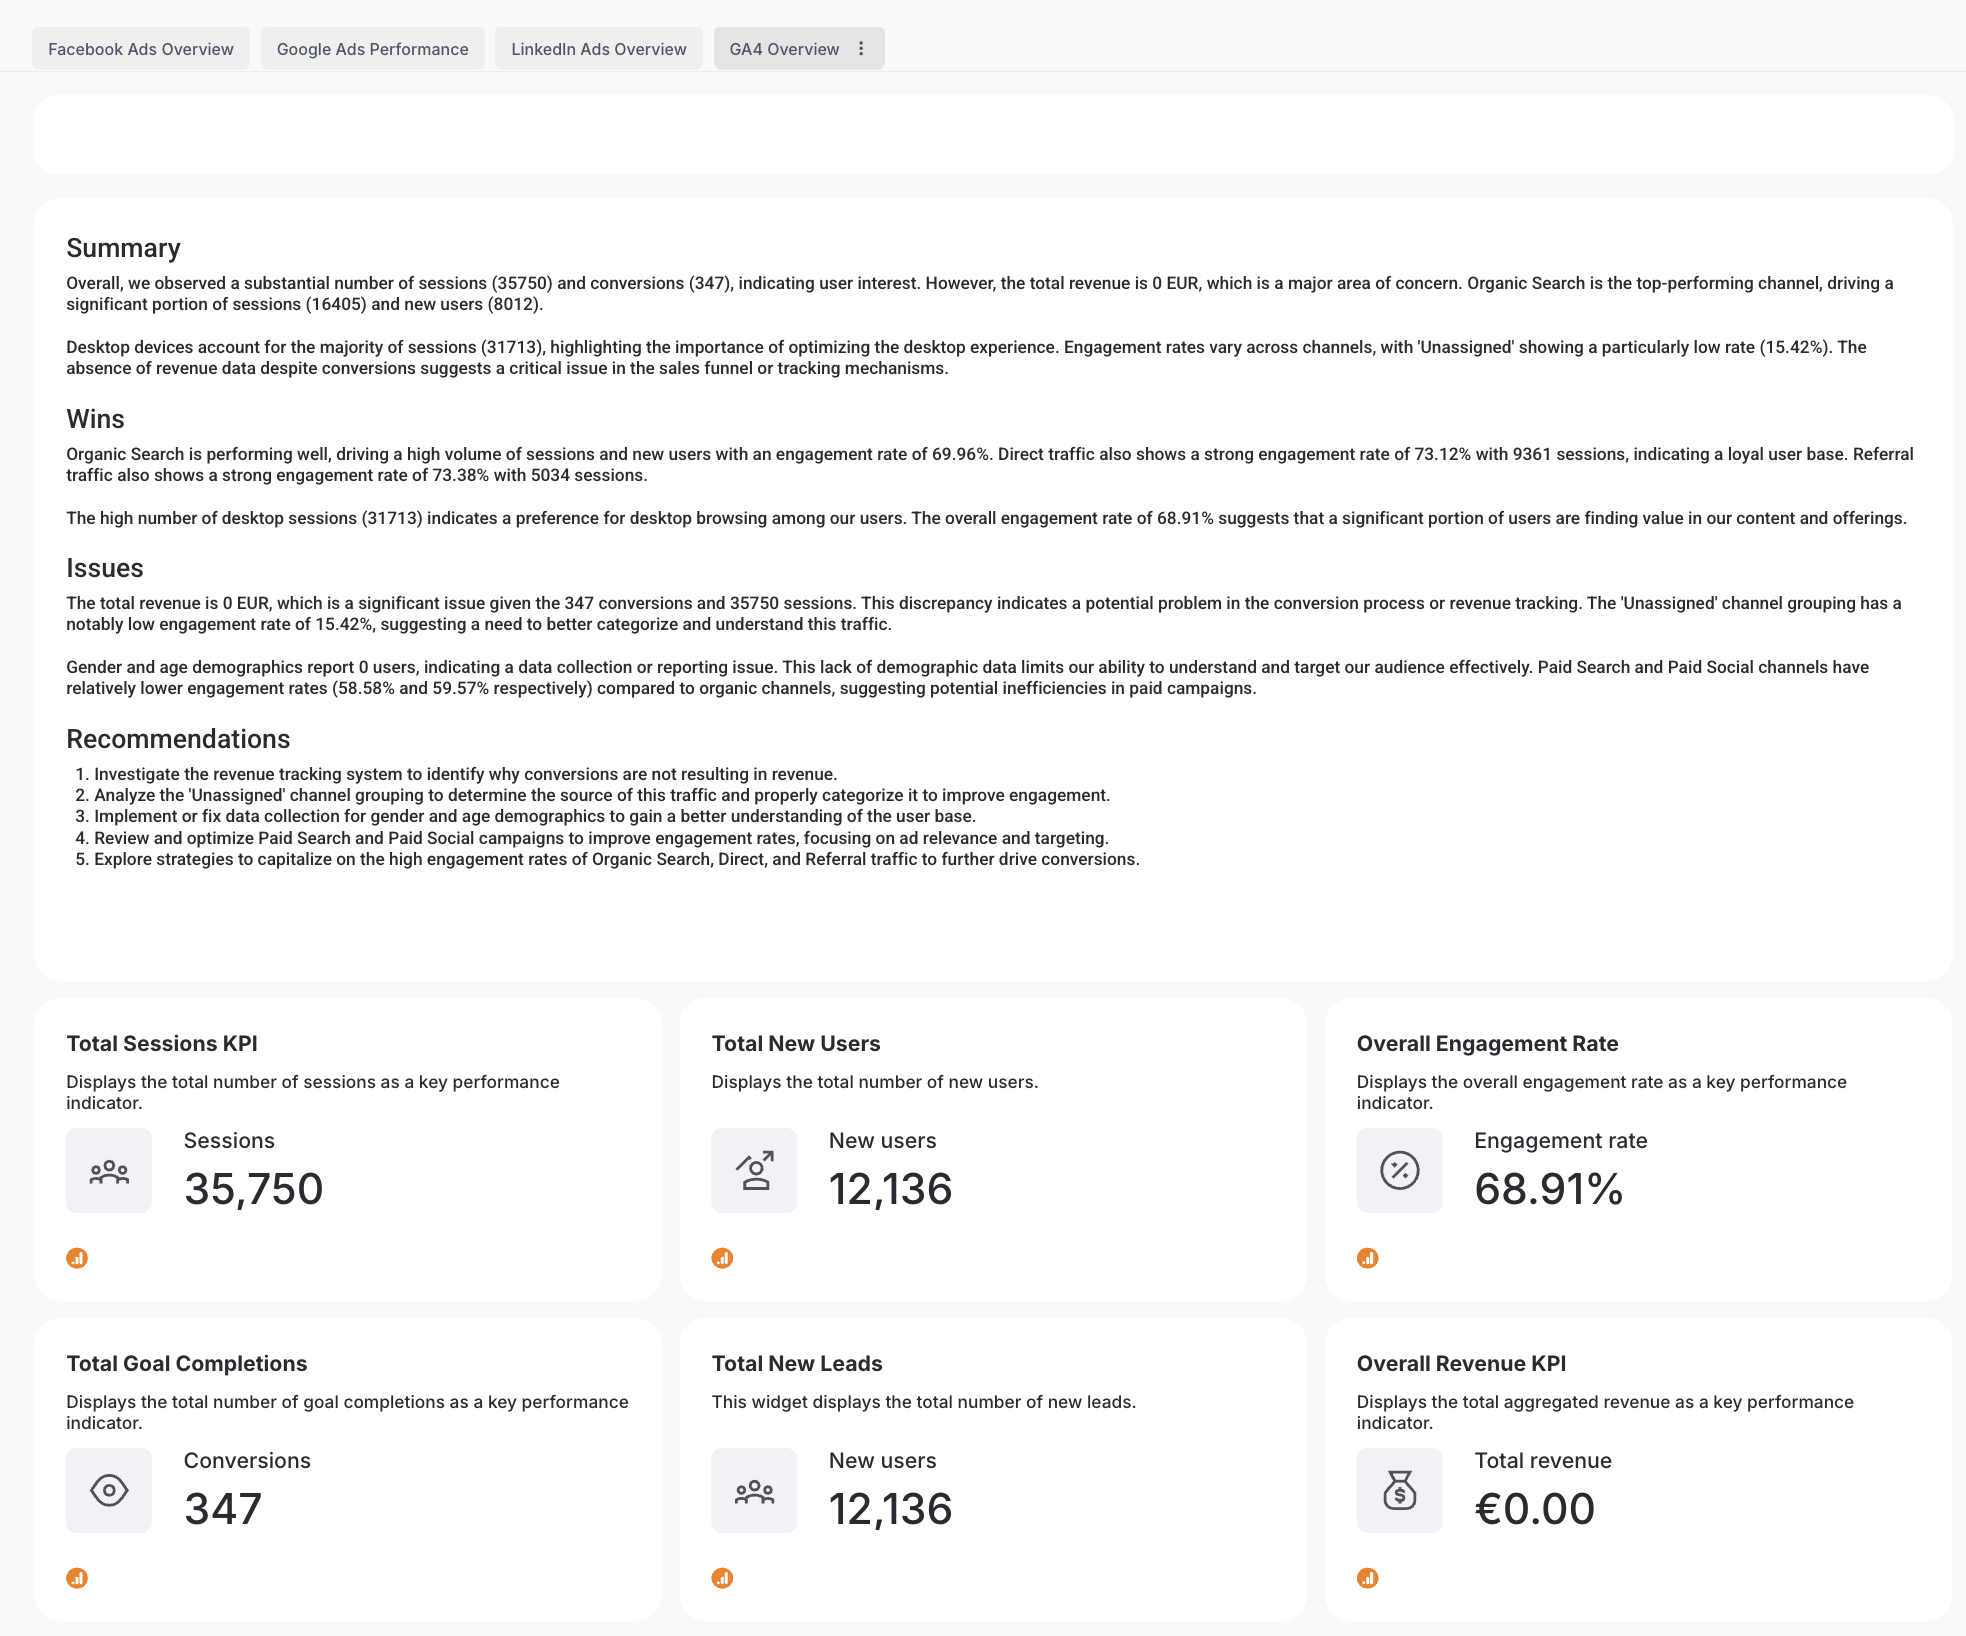
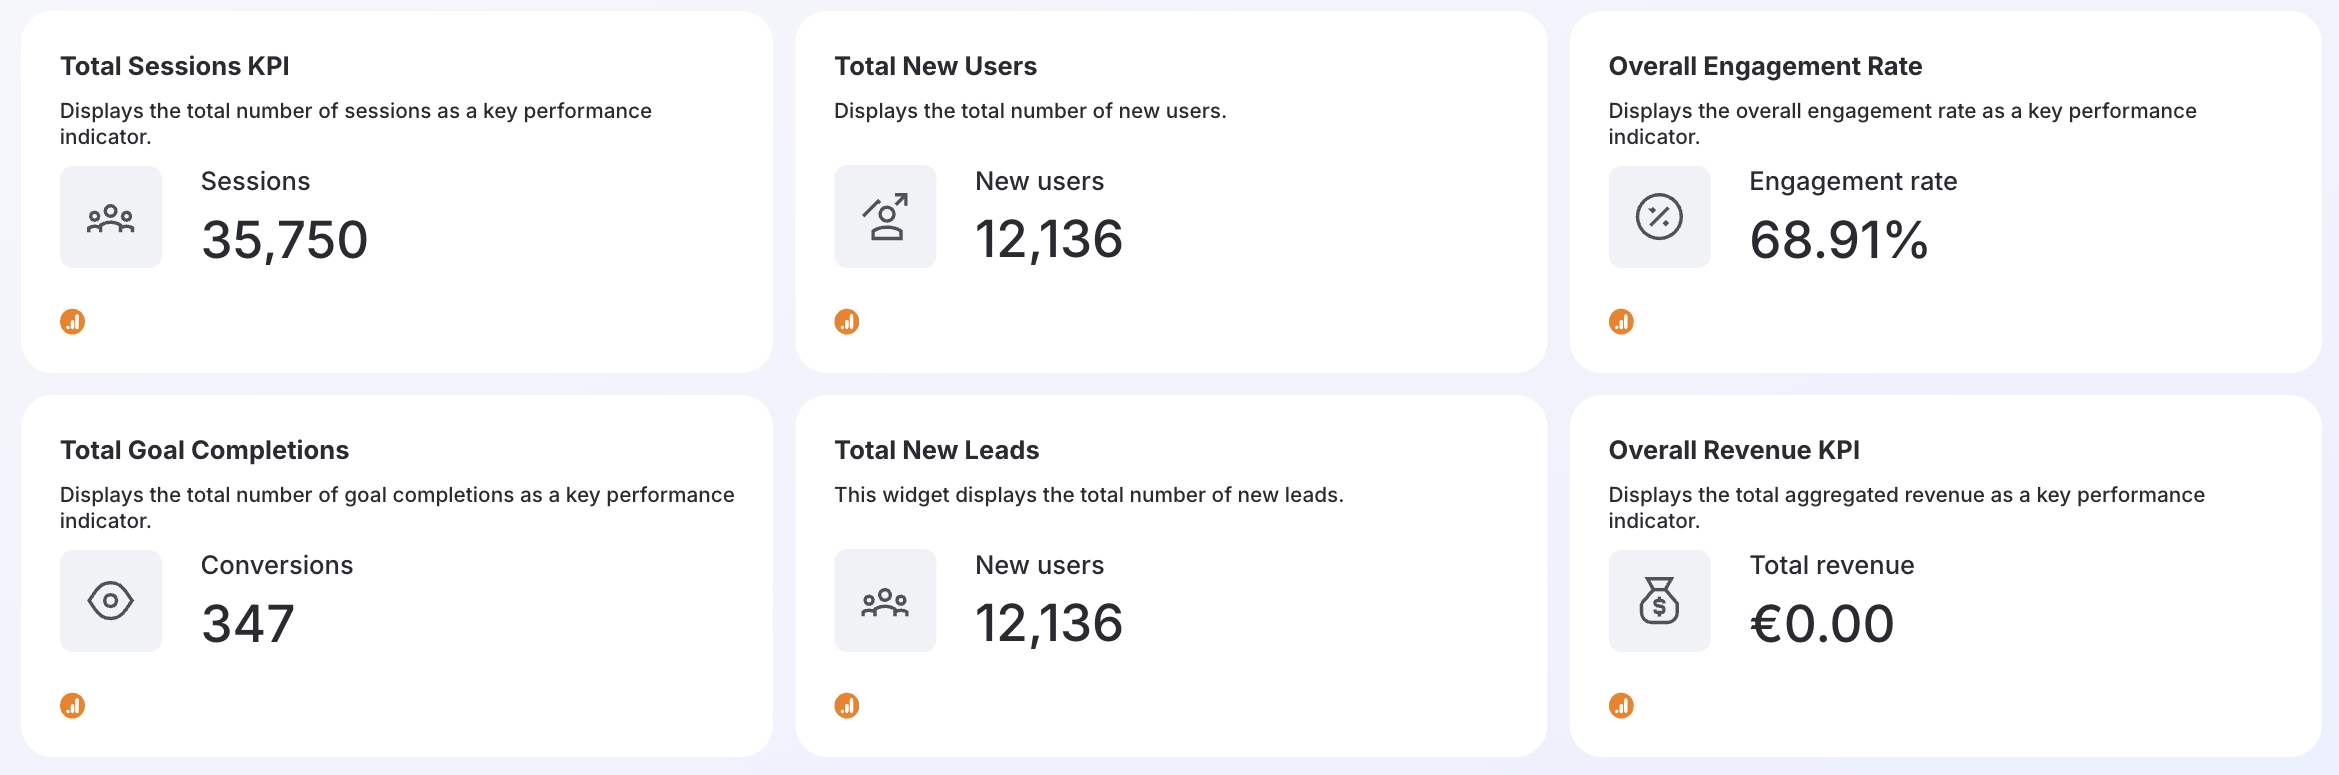
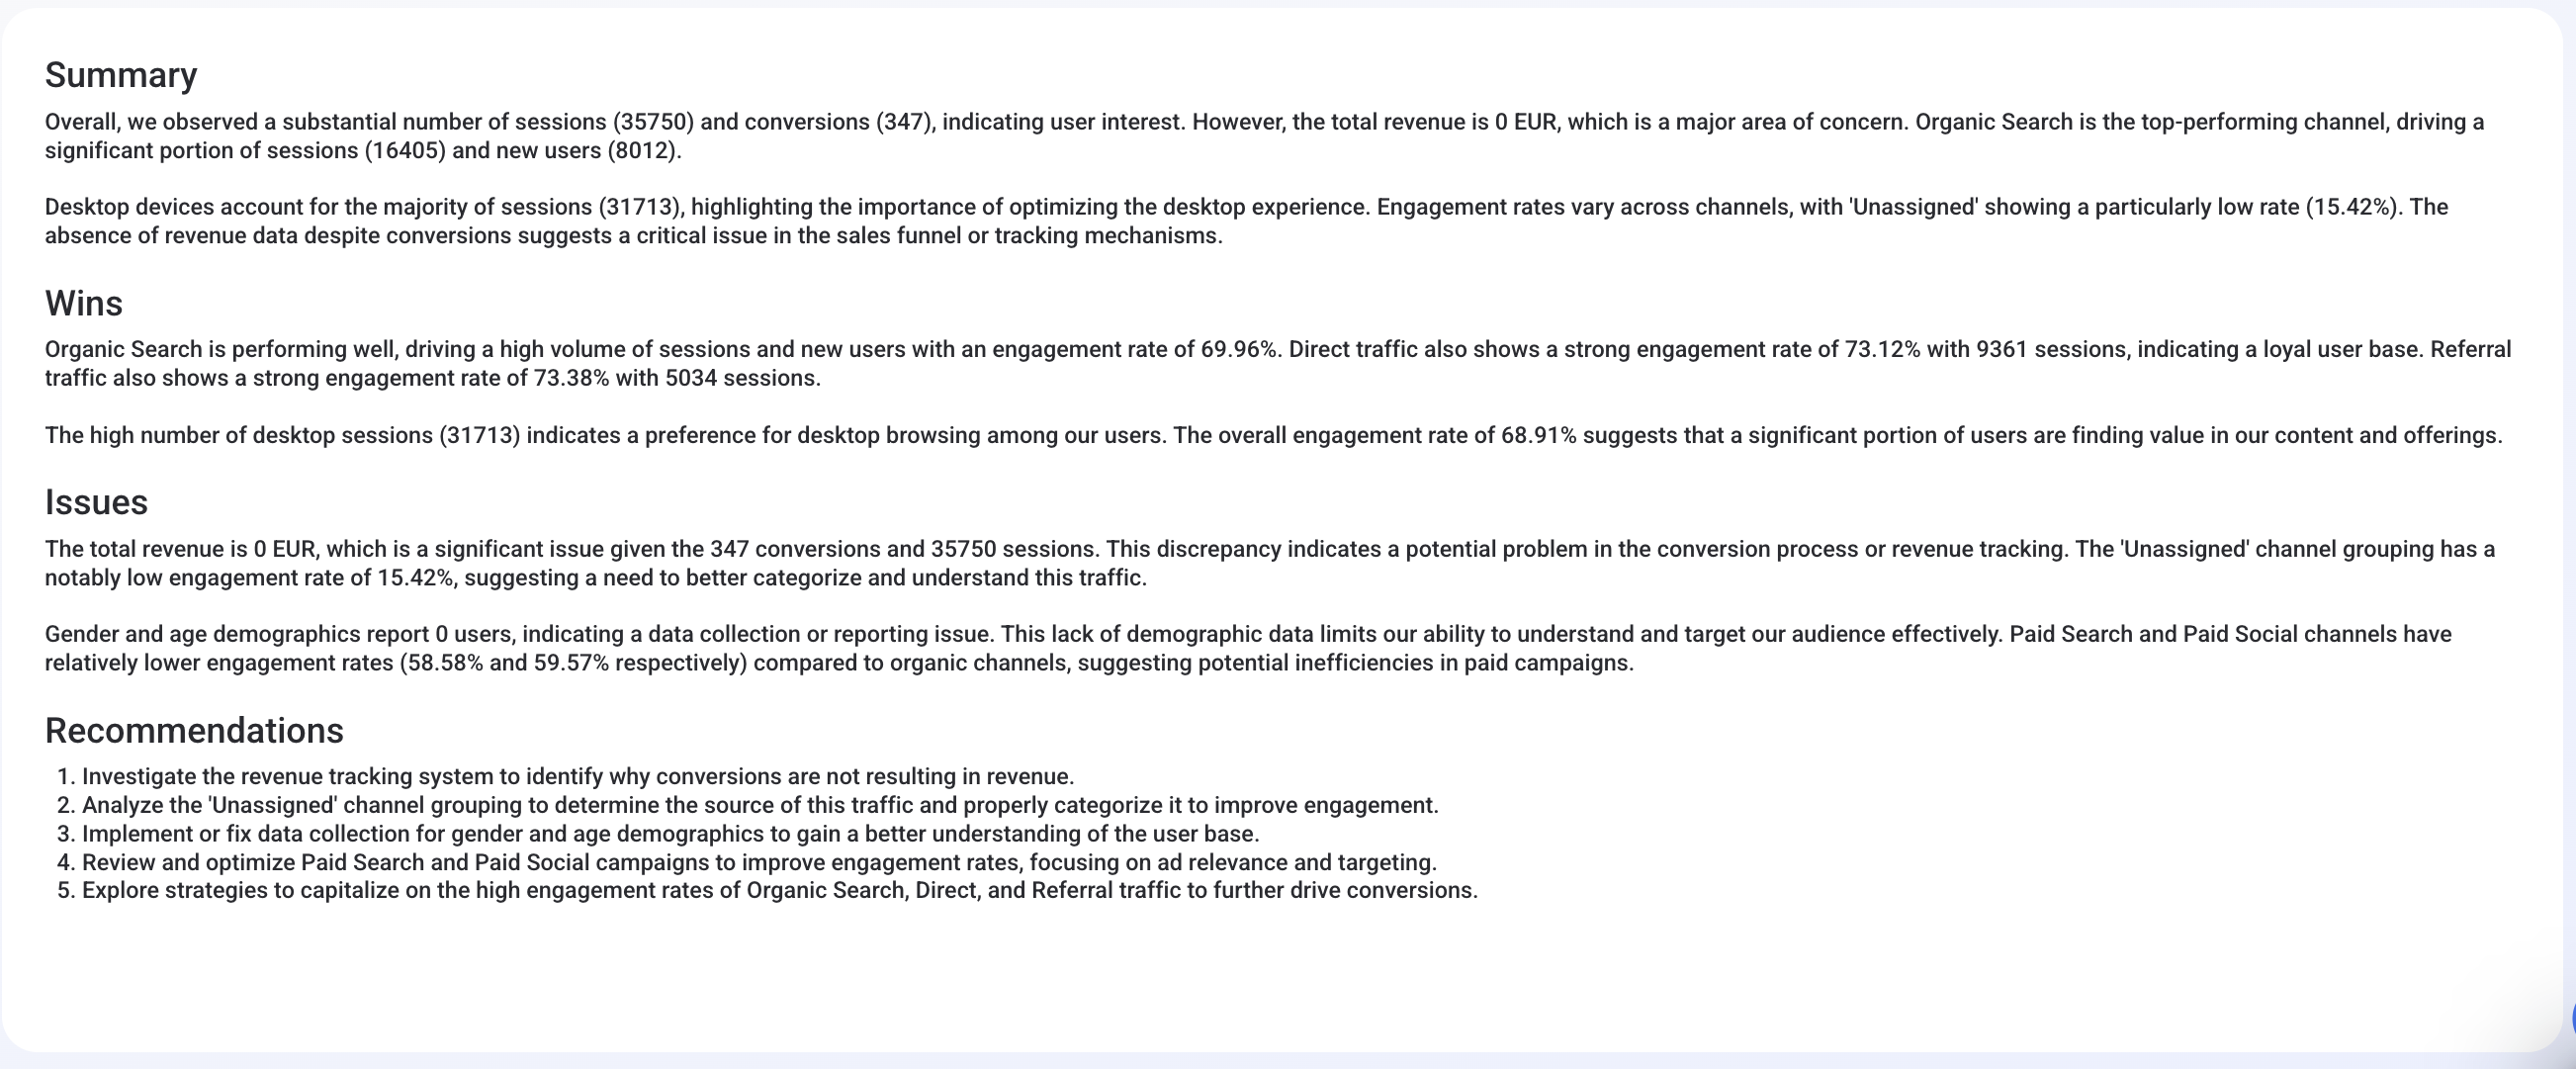
8. Google Analytics Dashboard Example
A Google Analytics dashboard gives you deeper insights into your entire customer journey. It reveals who clicks on what, when they bounce, and why they convert (or don’t).
Best for: Understanding user behavior and for better decision making on whether to double down or pivot your marketing strategy.
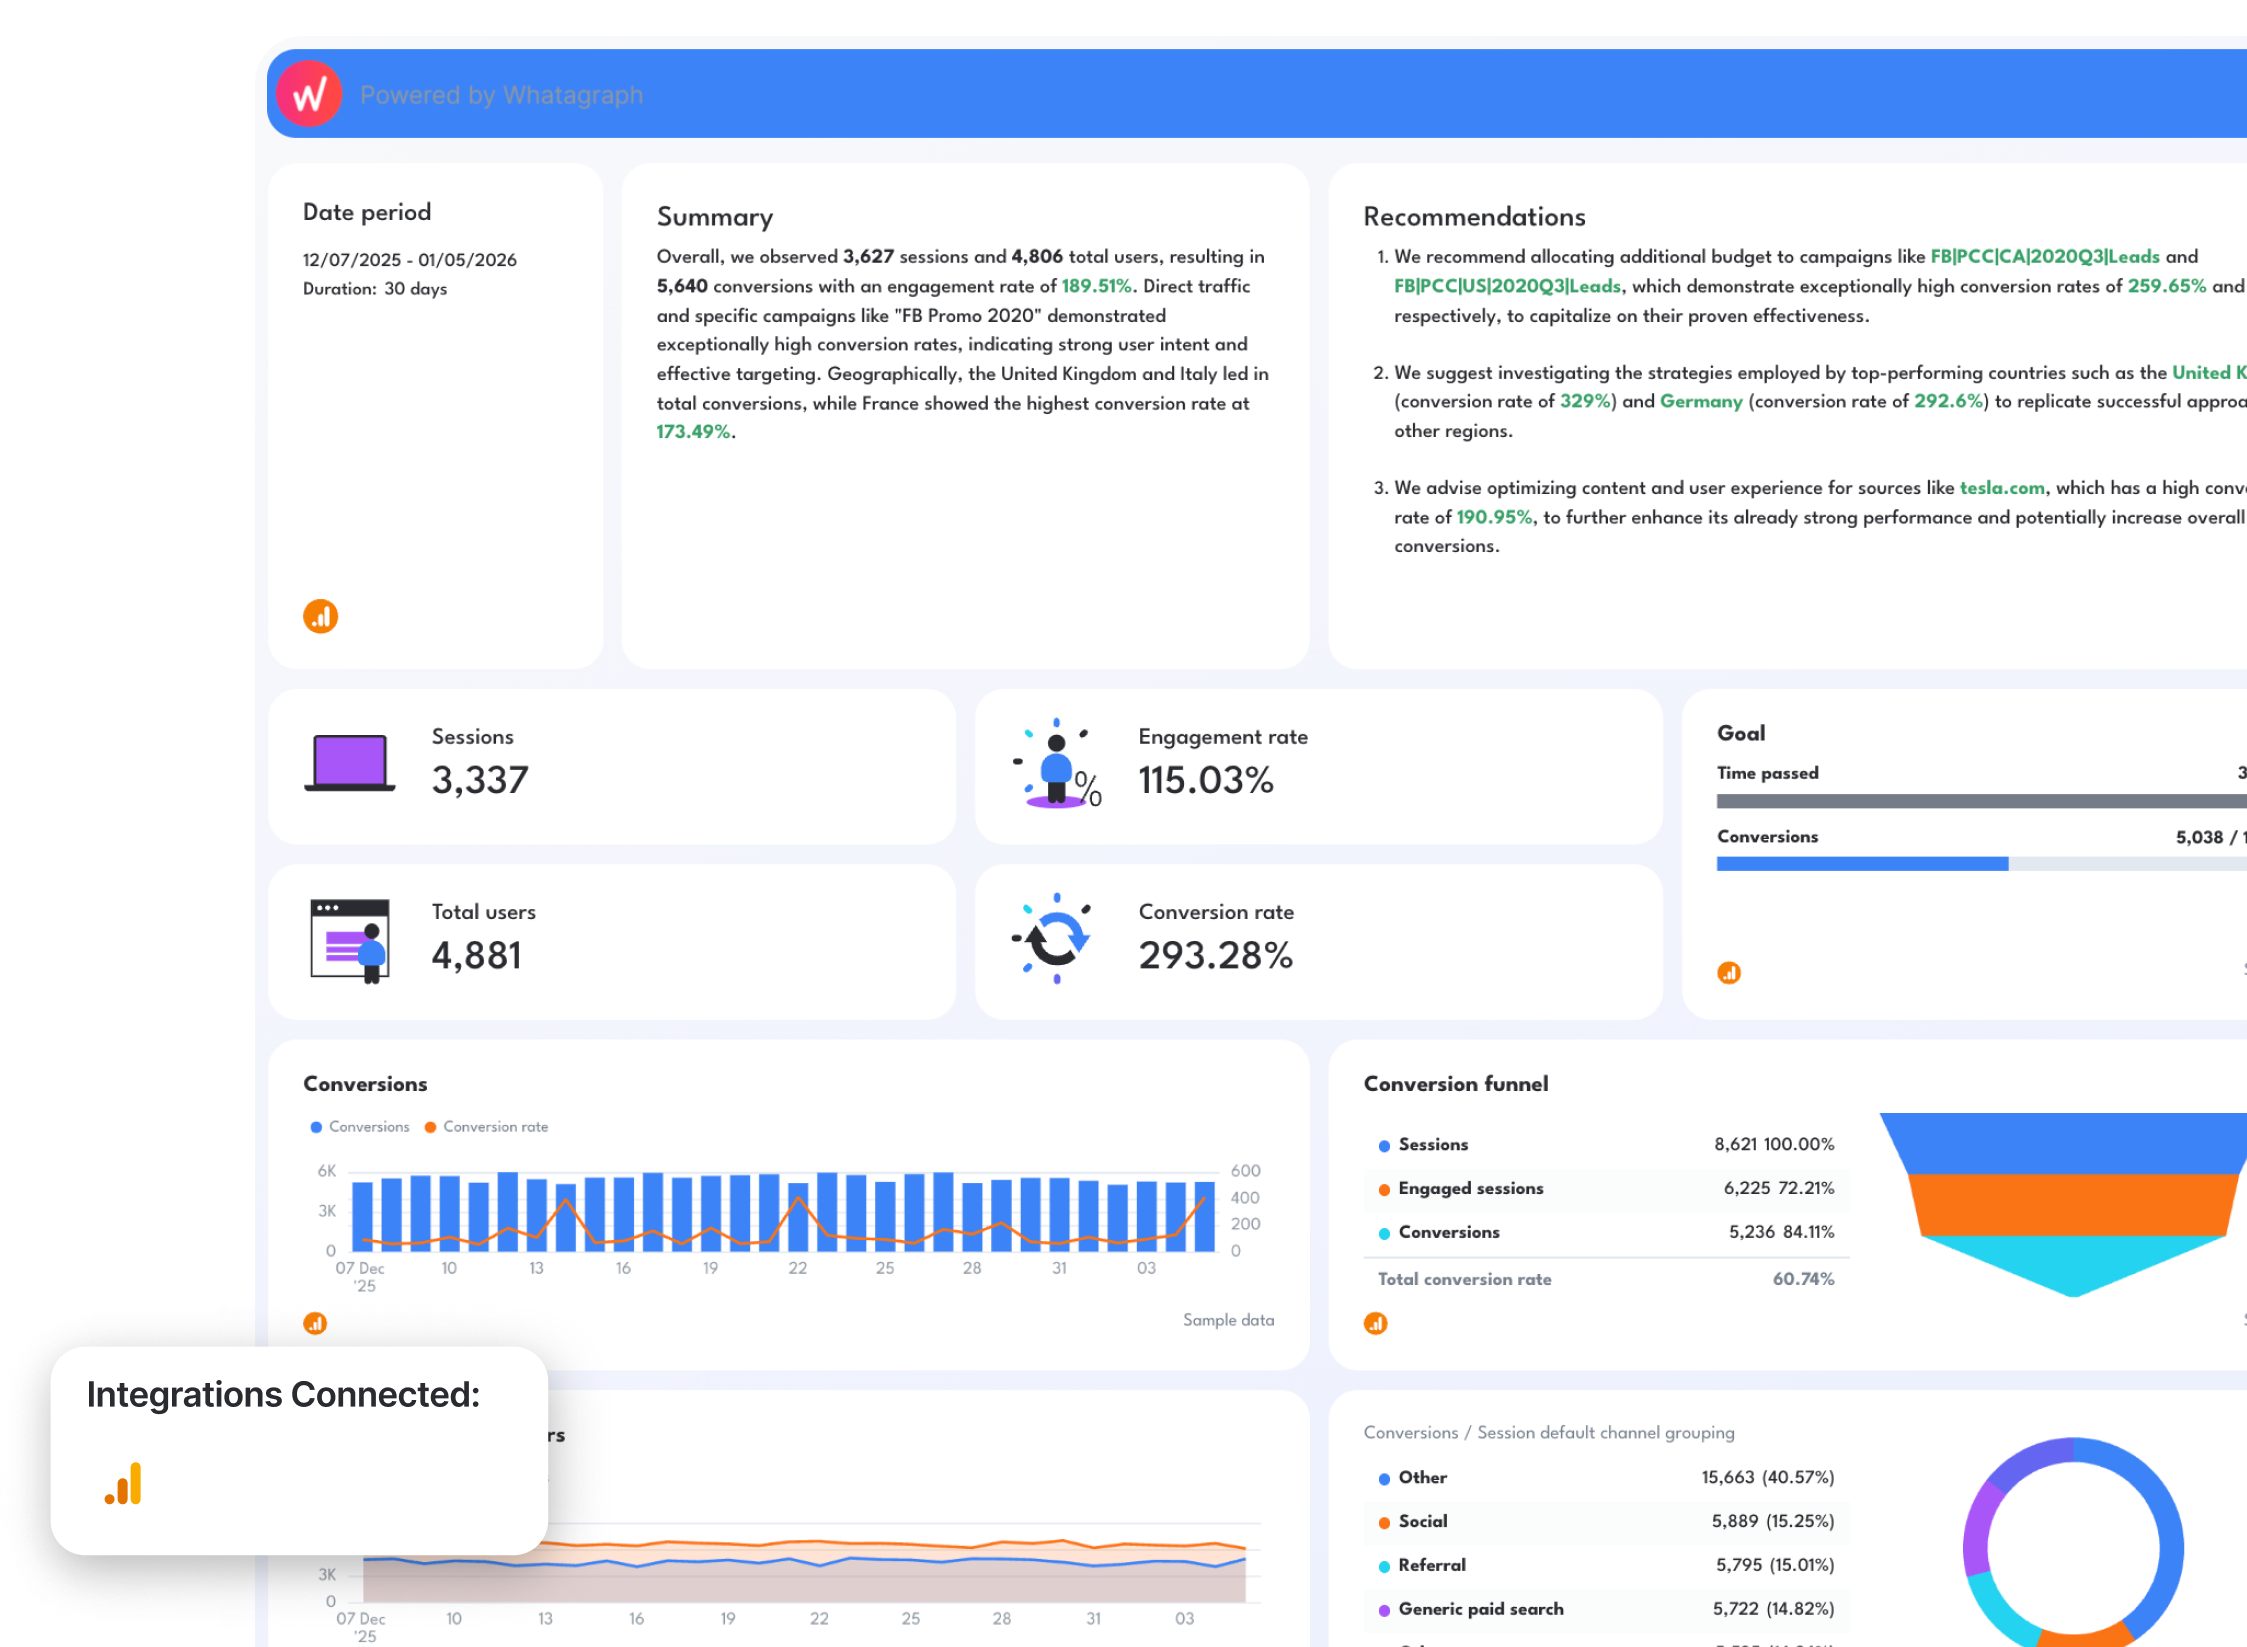
Use this dashboard for free with your data
Key metrics to include:
- Sessions, total users, and new users
- Engagement rate
- Conversion rate
- Top pages
- Conversions by source
- Conversions by country
How to structure it:
- Performance overview: Highlight cost per conversion, media spend, and total conversions.
- Acquisition overview: List the channels bringing in the most conversions. Compare new and returning users, bounce rates, and conversion rates.
- Website overview: Track user activity - visits, bounce rates, and length of stay - to locate engagement problems.
- Audience overview: Show who your visitors are, their demographics, interests, and the devices used.
- PPC channels overview: Highlight key ad metrics, like spend, conversions, clicks, and impressions.
- Organic overview: Include average search positions, traffic patterns, and the CTR. Use the insights to improve your website's organic rankings.
- Recommendations: Summarize actionable steps based on your insights. Focus on boosting ROI, optimizing spend, and improving campaign effectiveness.
9. Facebook Ads Dashboard Example
A Facebook Ads dashboard gives an instant overview of your Facebook Ads campaign performance across all Facebook Ads accounts.
Best for: Understanding Facebook Ads return on investment and what ad campaigns and creatives resonate most with your audience.
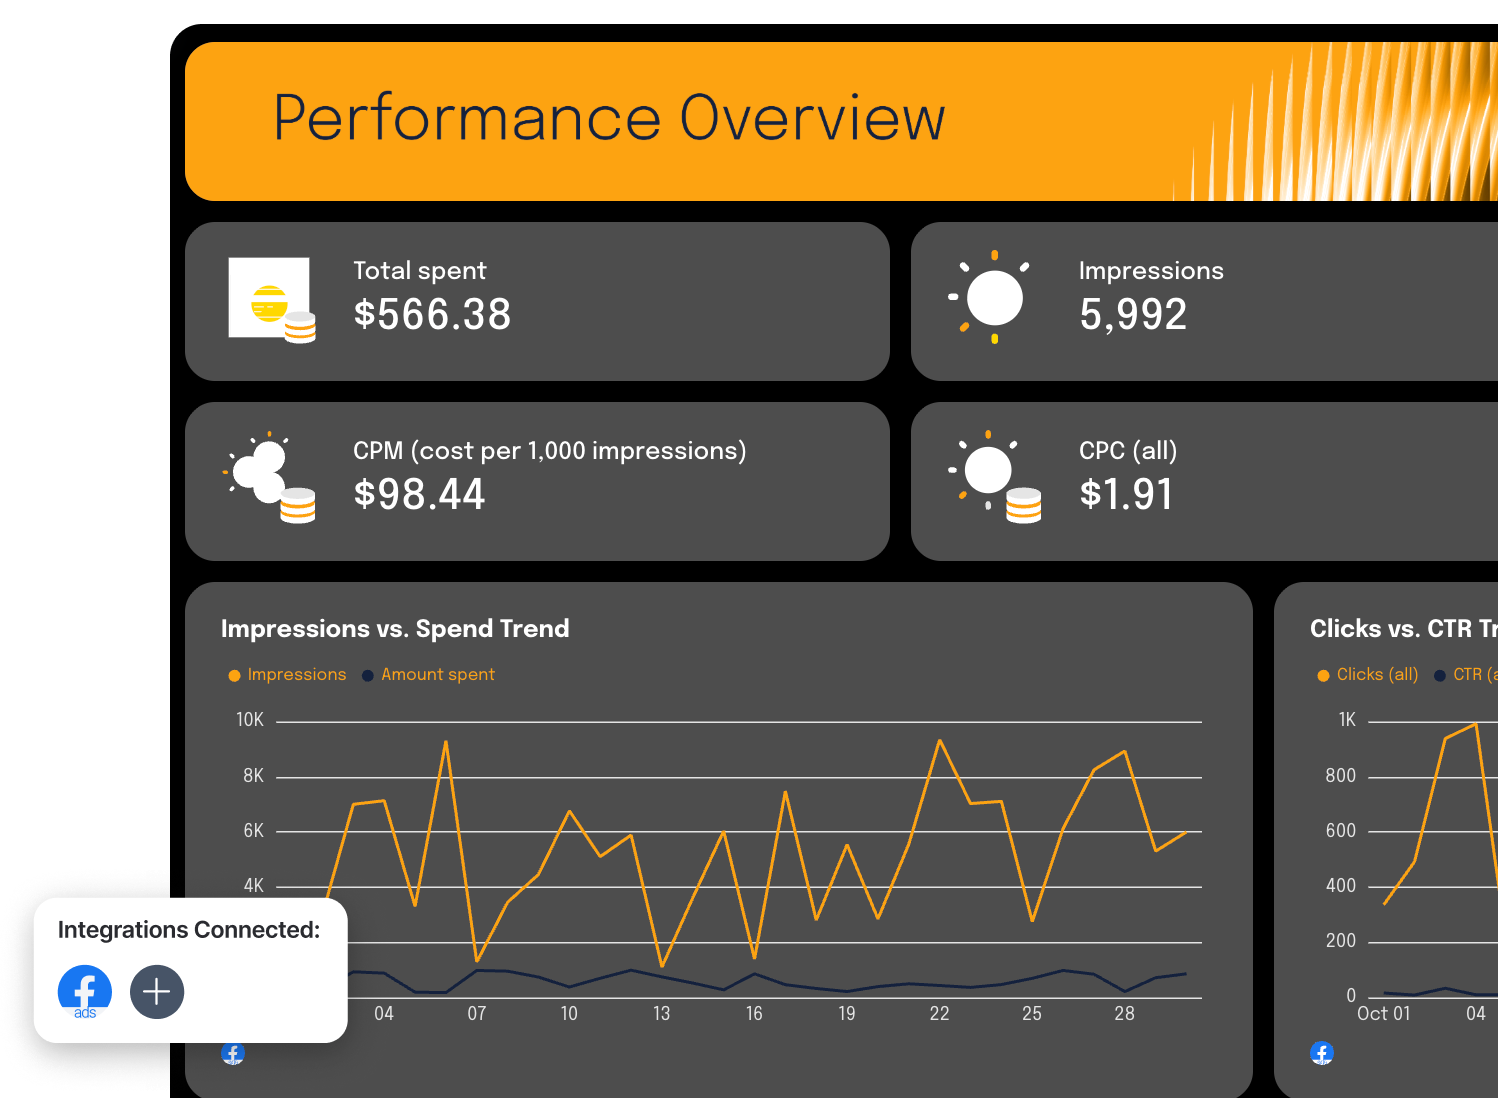
Use this dashboard for free with your data
Key metrics to include:
- Clicks
- Cost per thousand impressions (CPM)
- Click-through rate (CTR):
- Return on ad spend (ROAS)
- Conversion rate
- Total spent
How to structure it:
- Campaign overview: Show spend, clicks, ROAS, and top campaigns. Give clients a quick overview of campaign performance.
- Creative performance: List the top-performing ad creatives. Show the total likes, comments, and shares for each.
- Country insights: Break down performance by the country—or even the city if you target locally.
- Cross-channel insights: Compare Facebook Ads performance with other channels. See the top revenue channels and tweak if necessary.
10. Small Business Dashboard Example
A small business dashboard is great for tracking how your business grows over time. It helps you identify trends, like which channels perform the best, so you can adapt.
Best for: Tracking and visualizing high-level business metrics, like new leads, revenue, and total spent.
Key metrics to include:
- New leads
- Revenue
- Sessions over time
- Total spent
- Cost per conversion
How to structure it:
- KPI snapshot at the top: Highlight key metrics at the top—goal completions, new leads, revenue, and total spent.
- Channel summary table: Summarize each marketing channel in one table for easy comparison.
- Traffic overview: Display how website sessions evolve over time. Spot traffic trends and keep on track with your traffic goals.
- Audience overview: Dive into the audience demographics. Explain who your customers are, their interests, and the devices used.
- Insights and next steps: Explain campaign insights and the next steps for improving the results.
Create marketing dashboards that help to prove ROI to clients
No matter if you’re managing 1 or 50+ clients, the same principles apply for creating marketing analytics dashboards:
- Start with a performance overview that highlights 3-5 key KPIs
- Show the metrics that truly matter to your clients—ROAS, CTR, churn rate, etc.
- Keep the layout clean. Make insights clear and actionable.
- Highlight the good and the bad. Explain the next steps.
With Whatagraph, you can create these reports literally in seconds. Just explain to our AI tool the type of report you want to create and watch it get built in a few seconds.
Ready to build reports that your clients look forward to seeing? Start free with Whatagraph today.
Published on Mar 18 2020
WRITTEN BY
Elmeri PalokangasElmeri is a content strategist and writer helping SaaS firms scale up with long and short-form content. He has written dozens of SEO- and conversion-optimized blog articles for SaaS brands like Atera, Cognism, Scribe, Drip, QuickMail, Time Doctor, and TechnologyAdvice. When he's not working, he's off exploring Switzerland's stunning mountains.