Building a comprehensive Facebook Ads report: a how-to guide
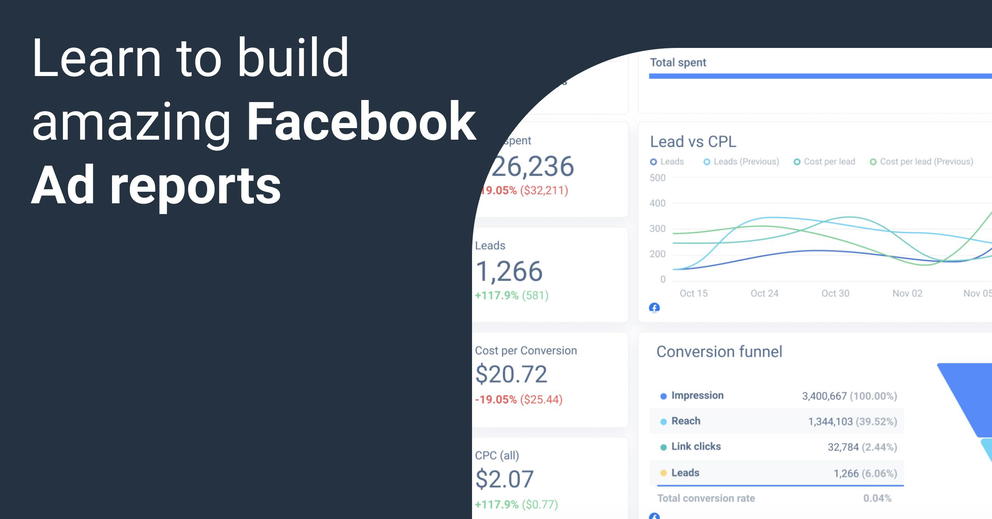
Communicating vital Facebook ad performance metrics should be easy. Build Facebook ad reports that actually provide insights that are easy to understand and act on.

Jan 18 2021 ● min read
- Metrics you should pay attention to when reporting
- Why you need to report Facebook Ads
- The first part of the report – the big picture metrics
- Funnel performance
- Specific Facebook Ad campaign performance
- Performance of ad sets, visuals, and ad copy
- Report that discloses metrics and provides valuable insights
- Facebook Ad report template with customization options is a must!
Whatagraph is a reporting tool used to aggregate digital marketing data and present it in a visually appealing manner. This tool works with a variety of popular digital marketing tools, including Facebook Ads.
Our goal with this article is to guide you on creating your own Facebook Ads report in minutes.
Now, aside from the report creation process, we want to get you acquainted with the right metrics to track. You’re probably well aware that the Facebook Ads dashboard boast tons of data – keeping your eye on all the metrics may pose some challenges. Worry not – we’ll alleviate this problem.
The marketing insights you acquire via the Facebook Ads interface also need to be organized. In addition to knowing what to track, we want to make sure you are presenting the data in a way that’s easy to digest.
Let’s begin.
Metrics you should pay attention to when reporting
The following Facebook Ad metrics are a must to track and should be mentioned within the report:
- Impressions show the number of times your ads have been seen by the same person regardless of the repeat view.
- Clicks are the cumulative amount of times that users have clicked on your ads.
- Unique Clicks are the number of unique users who clicked on your ads.
- CTR (Click-through Rate) is the number of users who clicked on your ads compared to the total users who saw them.
- CPC (Cost per click) is the average cost to you for every click on your ad.
- CPM (Cost per Thousand Impressions) is the total cost of running the ads for 1,000 impressions.
- Cost per conversion is the individual cost of a single conversion.
- CPL is the cost per potential lead your ads generated.
- Spend is the cumulative amount spent on your ads throughout each date period.
Of course, there are a lot of other metrics that your Facebook Ads dashboard will show you; however, you need to be focused. Keep your eyes on metrics that make your client stay in business and generate cash flow.
Why you need to report Facebook Ads
Let’s briefly talk about why it’s wise, to begin with creating a Facebook Advertising Summary dashboard:
- It offers an excellent health audit for your Facebook Advertising account.
- You can easily track the KPIs of your own or your clients.
- It shows how your campaigns are going on Facebook.
When you have 24/7 access to relevant data, it will be easier for you to tweak campaigns. At the same time, you can determine the best targeting strategies for future campaigns. Finally, you can conveniently share your report with others.
Alright, so theory aside, it’s time to start building the Facebook Ads report.
The first part of the report – the big picture metrics
Chances are, you probably have some specific KPIs that need to be tracked. Without KPIs, your efforts as a PPC specialist cannot be quantified. Whether you're using Google Analytics to track Facebook Ad metrics or another bespoke report, data needs to always be at your fingertips.
So let’s look at how your budgets are performing. Is the money spent bringing in customers and converting traffic?
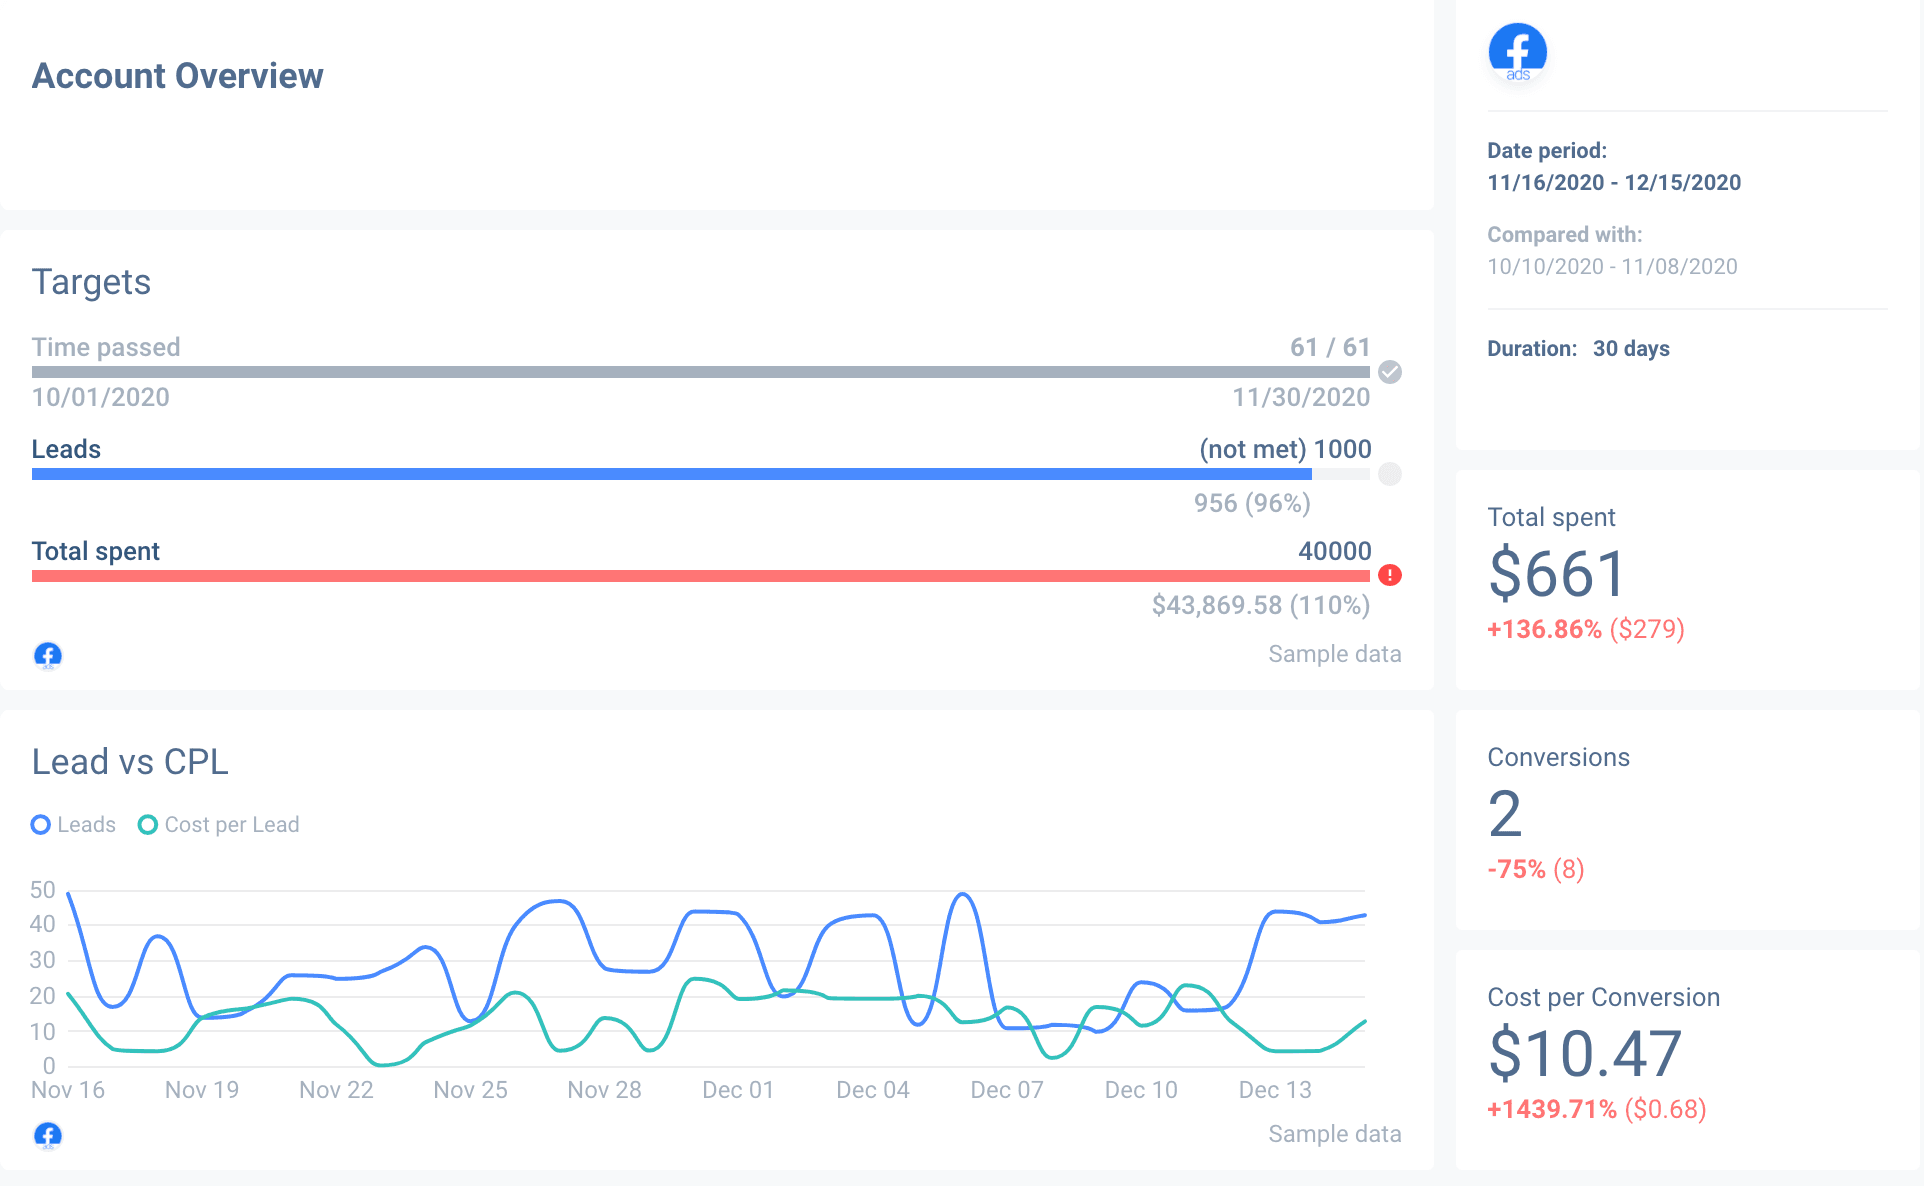
In the example above, we placed the essential metrics at the top of the report. This way, you can track your media spend against conversion and traffic targets.
The upper-left portion of the overview is goal tracking. Clearly illustrated goals and current standing is essential when disclosing your KPIs.
Finally, lead generation metrics are another KPI that needs to be at the top of the report. After all, PPC ads are all about generating leads while maintaining a reasonable cost per conversion.
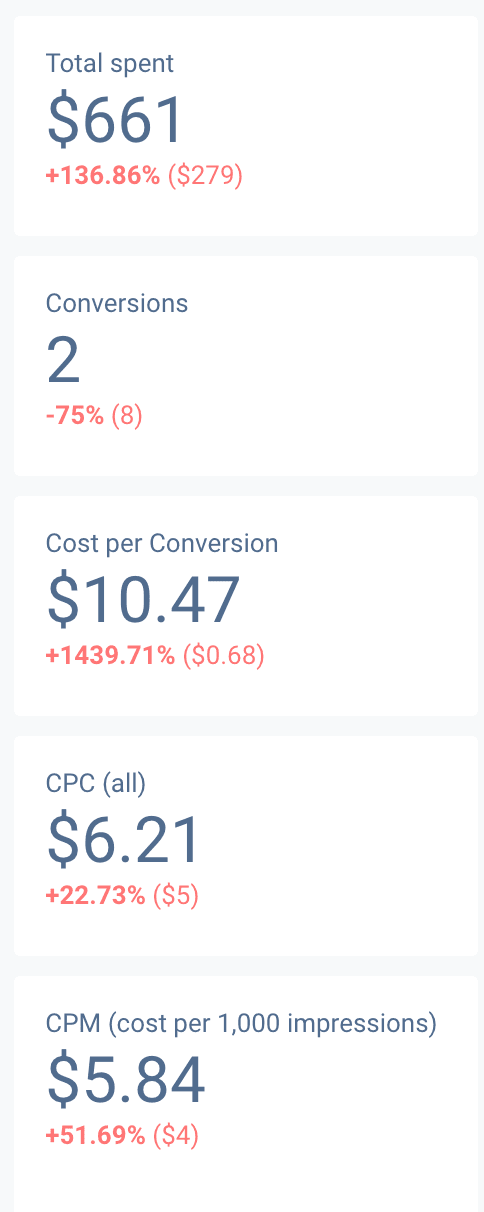
In our example, we disclosed the current ad spend, conversion amount, and cost-per-conversion metrics. Changes in those KPIs are clearly highlighted – a drop or increase since the last reporting period.
The bar graph on the bottom portion of the screenshot helps visualize cost-per-lead in relation to total leads generated in a selected period.
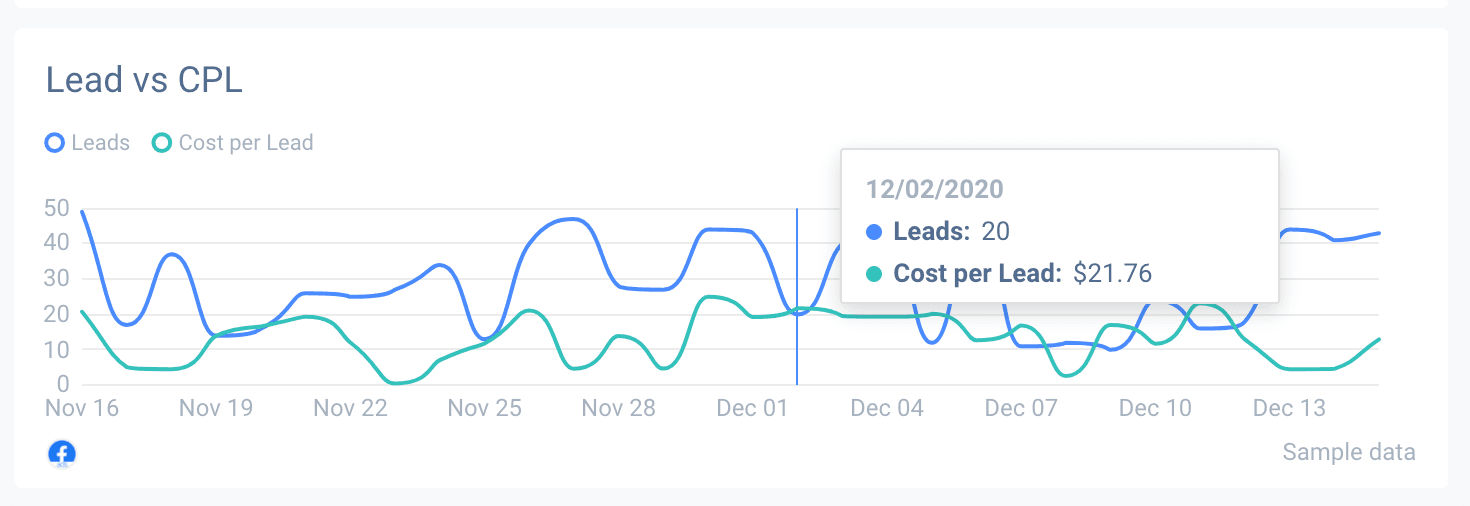
A good report allows you to view the precise CPL of any specific date. It can also show any potential patterns in what days of the week are likely to generate the most leads at a desirable cost.
Funnel performance
Facebook Ads can target a niche audience, which is incredibly beneficial. However, conversion metrics all rest in your hands. It all depends on your visuals and ad copy – along with the audience segments you’ve built for yourself.
So how well are your ads converting in aggregate? This is where a funnel graph comes in handy.
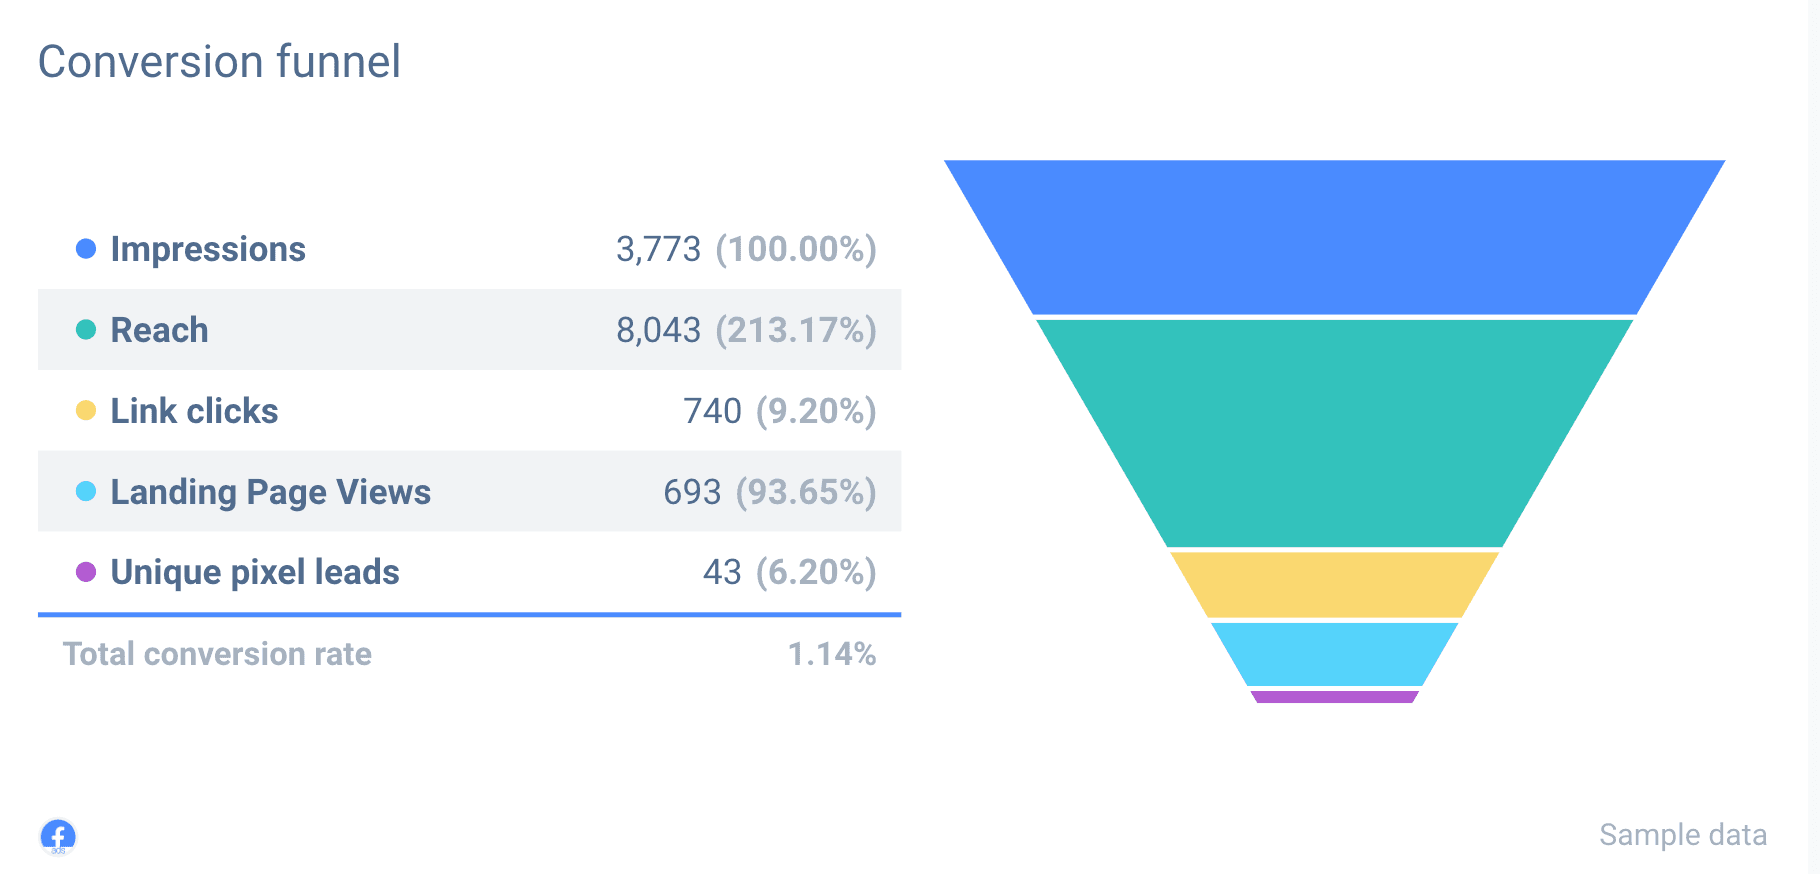
Using a funnel graph is a phenomenal method of showing the audience’s transformation process. It also helps you analyze overall ad campaign shortcomings.
As shown above, there’s a clear transition process from a simple ad impression, down the engagement’ funnel’, to an actual conversion – where the money usually comes from.
Specific Facebook Ad campaign performance
Not all campaigns are created equally – they all have their nuances and perform differently. In addition to the big-picture, aggregated data, it’s good to break down individual Facebook Ad campaigns’ performance within the report.
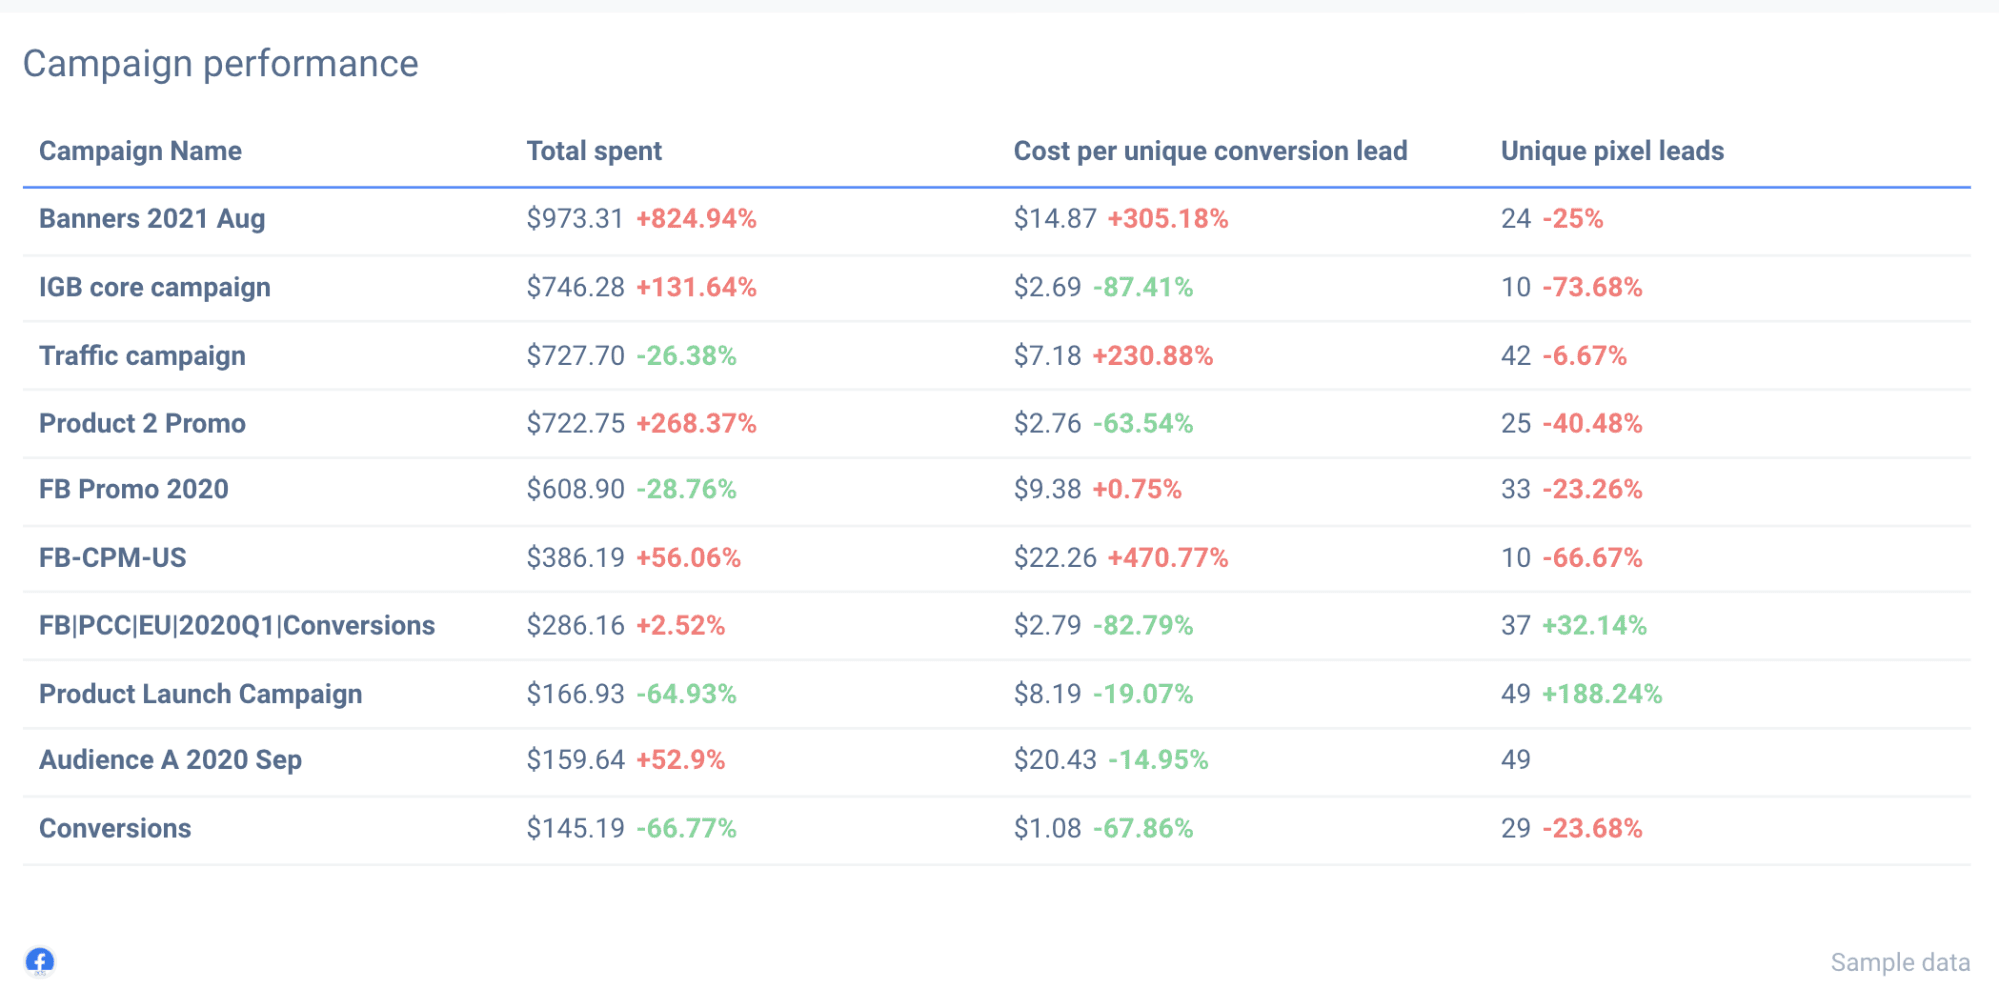
This data is not only relevant to you as a PPC manager but can give valuable insights to your client. The client may wish to look deeper into what ad copy performs best, what landing pages are converting, why you’re arranging your expenditures in a certain way.
Conversions are not only your problem. Having adequate design and content on the webpage is what helps convert. Campaign metrics can help the client allocate resources that improve conversion rates on the website level.
Performance of ad sets, visuals, and ad copy
Campaigns can still be broken down further – and we’re going to do just that. They’re made up of smaller ad sets and individual ads, which need to be analyzed as well.
By now, you’ve probably noticed the pattern – the deeper we go into the report, the more specific the data becomes.
So, what are your ad sets looking like? This is where we advise you to segment the metrics of individual ad sets.
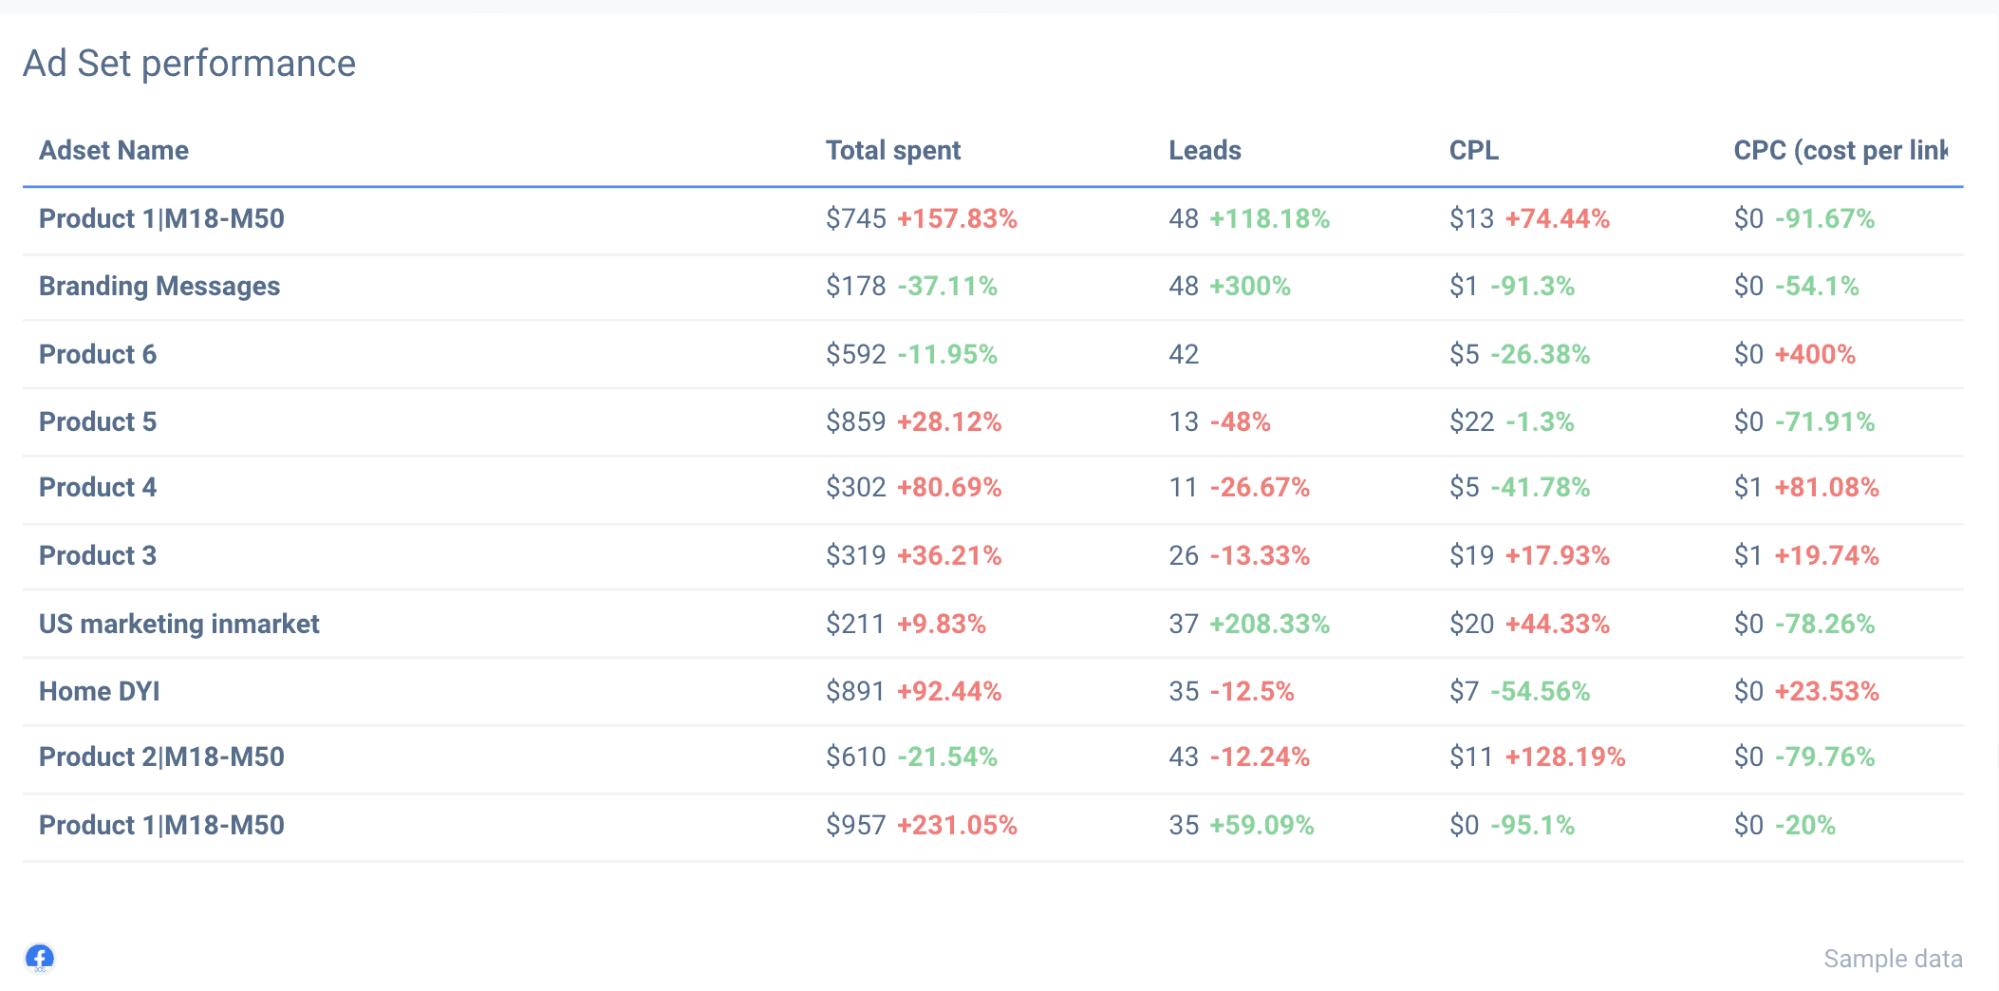
Again, the vitals – financial metrics, along with lead generation numbers, are presented clearly. That’s what any Facebook Ads manager must disclose efforts and results in great detail.
Visuals and ad copy
The trick here is creating a suitable ad copy along with visuals that reflect your brand while enticing your old and new audience with a particular product offering.
Analyzing the performance of each ad helps to understand what ad copies and visuals captivate the audience. It also shows what ad copies and visuals have gotten stale over a given time frame.
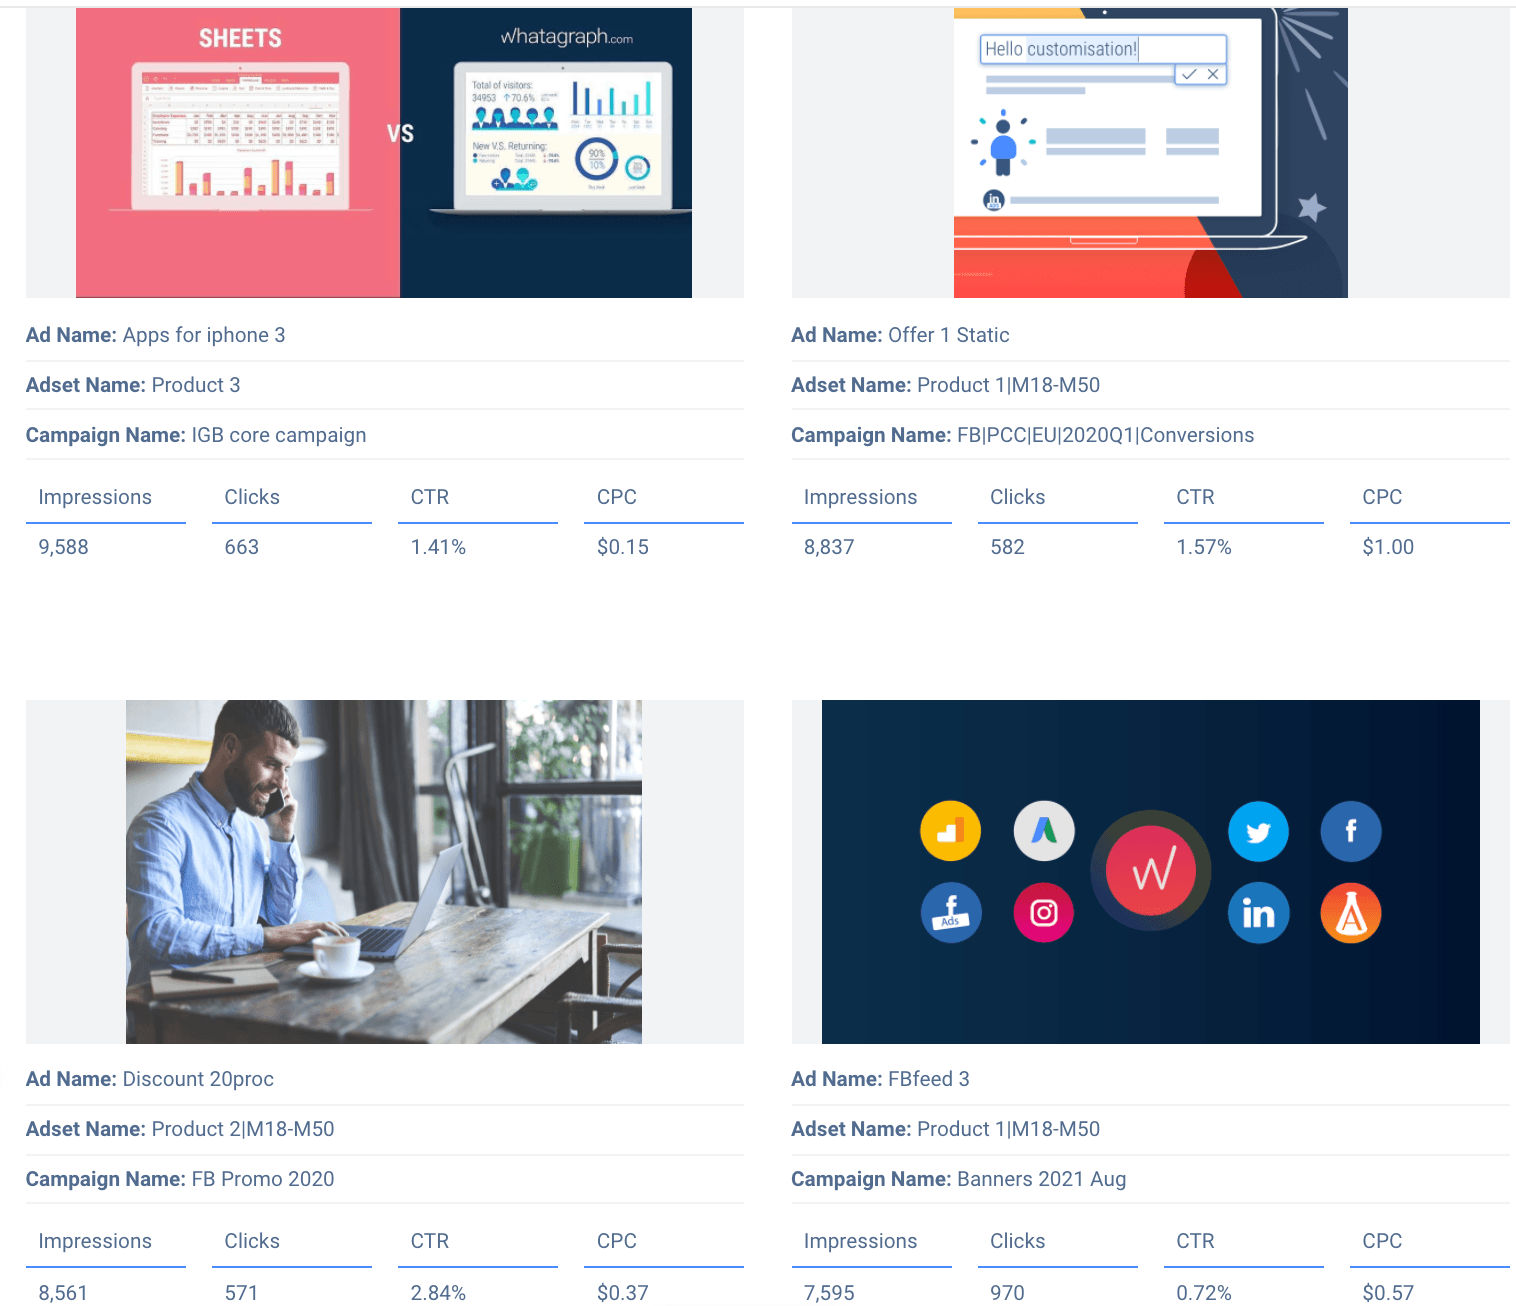
In the report, you can quickly deduce the types of content your audience prefers over others. You can also narrow down what types of ads convert best.
In the example above, we break down each ad copy, along with accompanying visual and relevant metrics that reflect ad performance. It’s a simple method of clearly showcasing specific ads you’ve been using to promote your client’s product.
Report that discloses metrics and provides valuable insights
Whether you’re reporting to your clients or firm executives, your report needs to tell a story. All of this rests on two things – data and visuals.
Data is used to showcase results and explain the reasoning for specific actions that you’ve taken. Most people – especially in marketing – aren’t too keen on making changes if the change is not supported by data; hard numbers.
Visuals are there to help translate data into something that’s easier to digest. The simple reporting process you’ve come to dread is turned into extensive storytelling, engaging your clients and executives.
Facebook Ad report template with customization options is a must!
Insightful client-centric reports are there to tell the story of your progress via visuals and precise information.
Great internal reports help your team monitor the current situation and quickly find any shortcomings within your processes.
You are welcome to try out our pre-built Facebook Ad report template and Facebook Analytics report template for free. We’ve already built the report for you: just connect your Facebook account, and we’ll automatically extract your data. Enjoy!
Published on Jan 18 2021
WRITTEN BY
Mindaugas SkurvydasMindaugas is the SEO specialist at Whatagraph with experience in driving organic traffic and improving SERP visibility for industries like B2B martech, B2B and B2C finance. He loves to be at the edge of new developments by maintaining numerous contacts with other publishers in the SaaS niche. When he’s not writing he’s pushing our technical SEO strategies into implementation.