Faster Way to Google Analytics 4 (GA4) Reporting
Extracting meaningful insight from Google Analytics 4 (GA4) can be time-consuming and complex. Native Google Analytics 4 reporting lacks advanced visualization and storytelling capabilities, and going through Looker Studio might be too complicated for some users. We have a better way.

Dec 21 2023●6 min read


In this guide, we’ll show you how to streamline the Google Analytics 4 reporting process in your agency.
A quick overview of Google Analytics 4 reports
We hope you switched from Universal Analytics property to GA4 — not only because it stopped collecting data this year but because GA4’s event-based attribution makes reporting more straightforward. There are also some security perks, such as storing data in EU/US servers depending on the origin, privacy-first event tracking, and regional control over Google signal data collection.
But, let’s first briefly explain how Google Analytics 4 reporting works.
GA4 comes with several new reports that you can use to monitor your website activity. For starters, the dropdown menu is now structured by a typical customer lifecycle — Acquisition, Engagement, Monetization, and Retention.
If there was only a way to insert a comment somewhere…
There’s also a convenient site search feature you can use to search through data streams, locate real-time reports, and access other GA4 properties using natural language queries.
In the following sections, we’ll briefly explain the standard report types available in GA4.
User reports
These reports allow you to learn more about the people visiting your website. You can use the data to create more targeted ad campaigns or understand if your website visitors match your ideal customer profile.
For example,
- Demographic reports: Tell you where users come from. From what country and which city? What language do they speak, and what’s their age?
- Tech reports: Tell you what platforms, device categories, operating systems, or browsers your visitors use. This data can tell you whether you need to optimize the app and develop new features. You can even adjust your campaign targeting criteria based on this info.
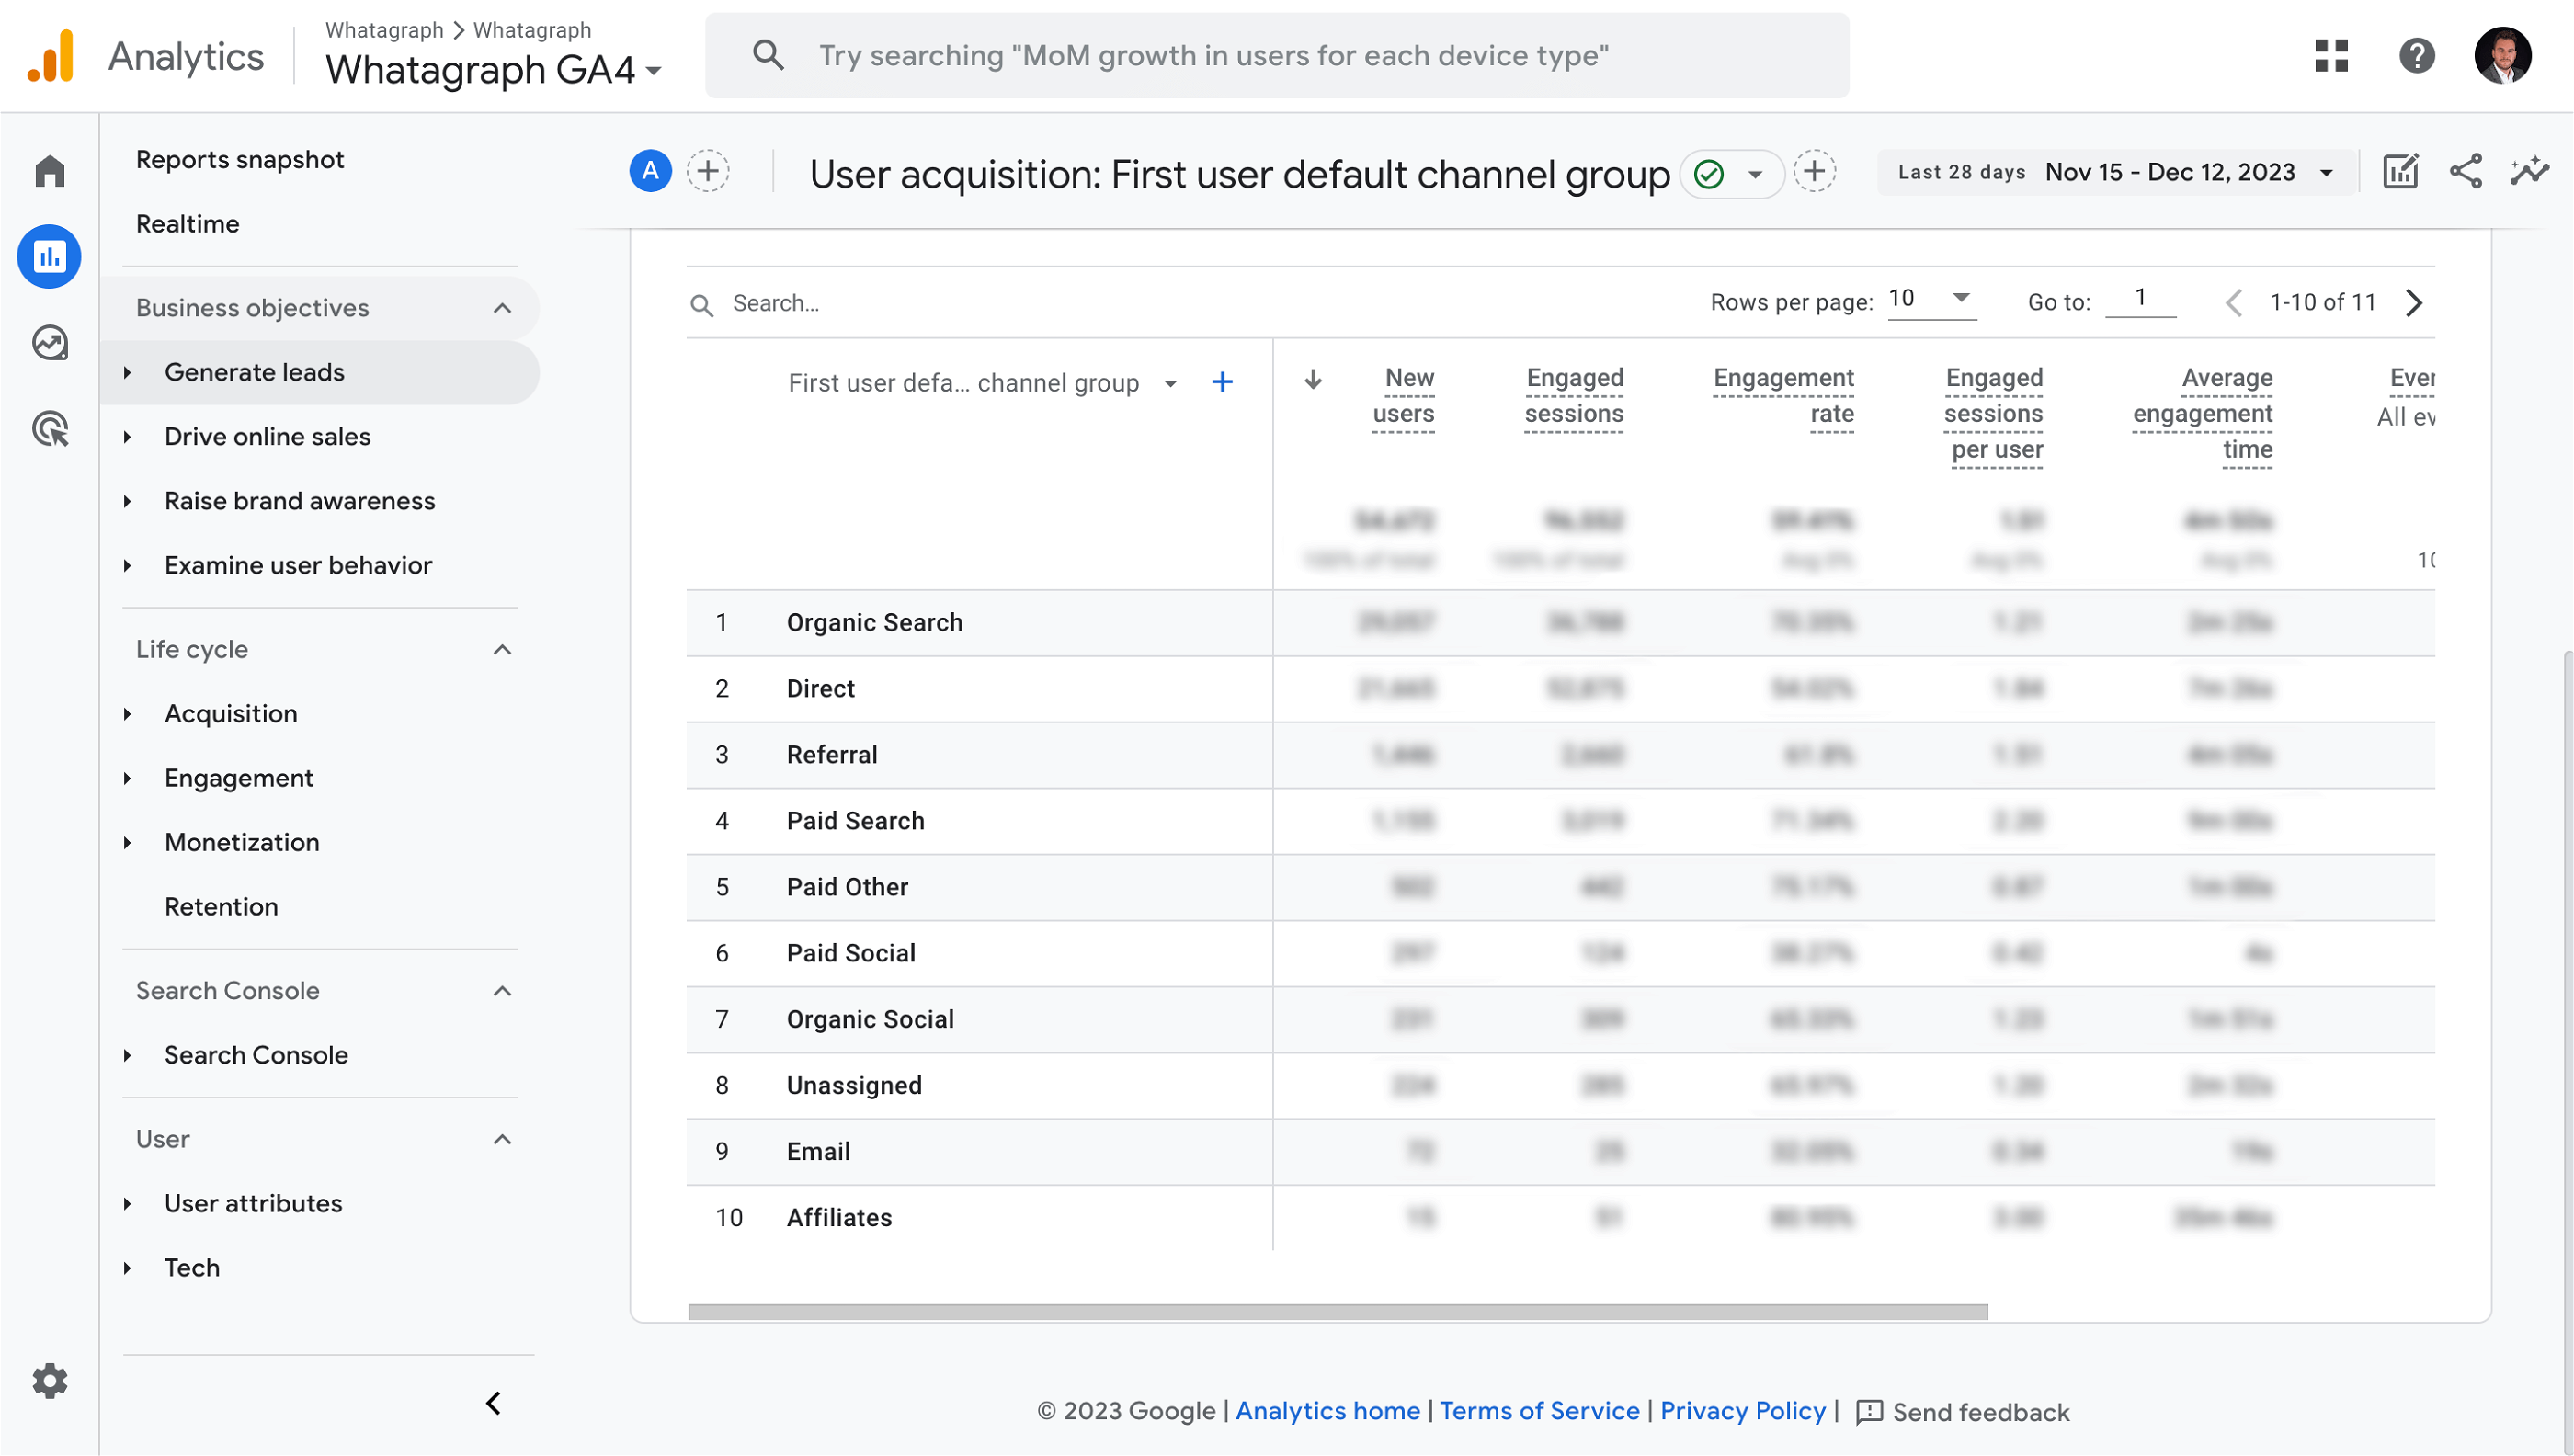
Acquisition reports
These reports tell you how visitors find your website for the first time. Which channels did they use, and what campaign brought them there?
This group of reports is essential for discovering effective marketing campaigns and understanding whether you must prioritize attracting new users or retaining returning customers.
Different acquisition reports show you how user engagement varies between the channels so you can identify top-performing ones.
Still, there’s a difference between user acquisition and traffic acquisition reports.
- User acquisition reports: How do new users find your website for the first time?
- Traffic acquisition reports: Where do new sessions come from, both for new and returning users?
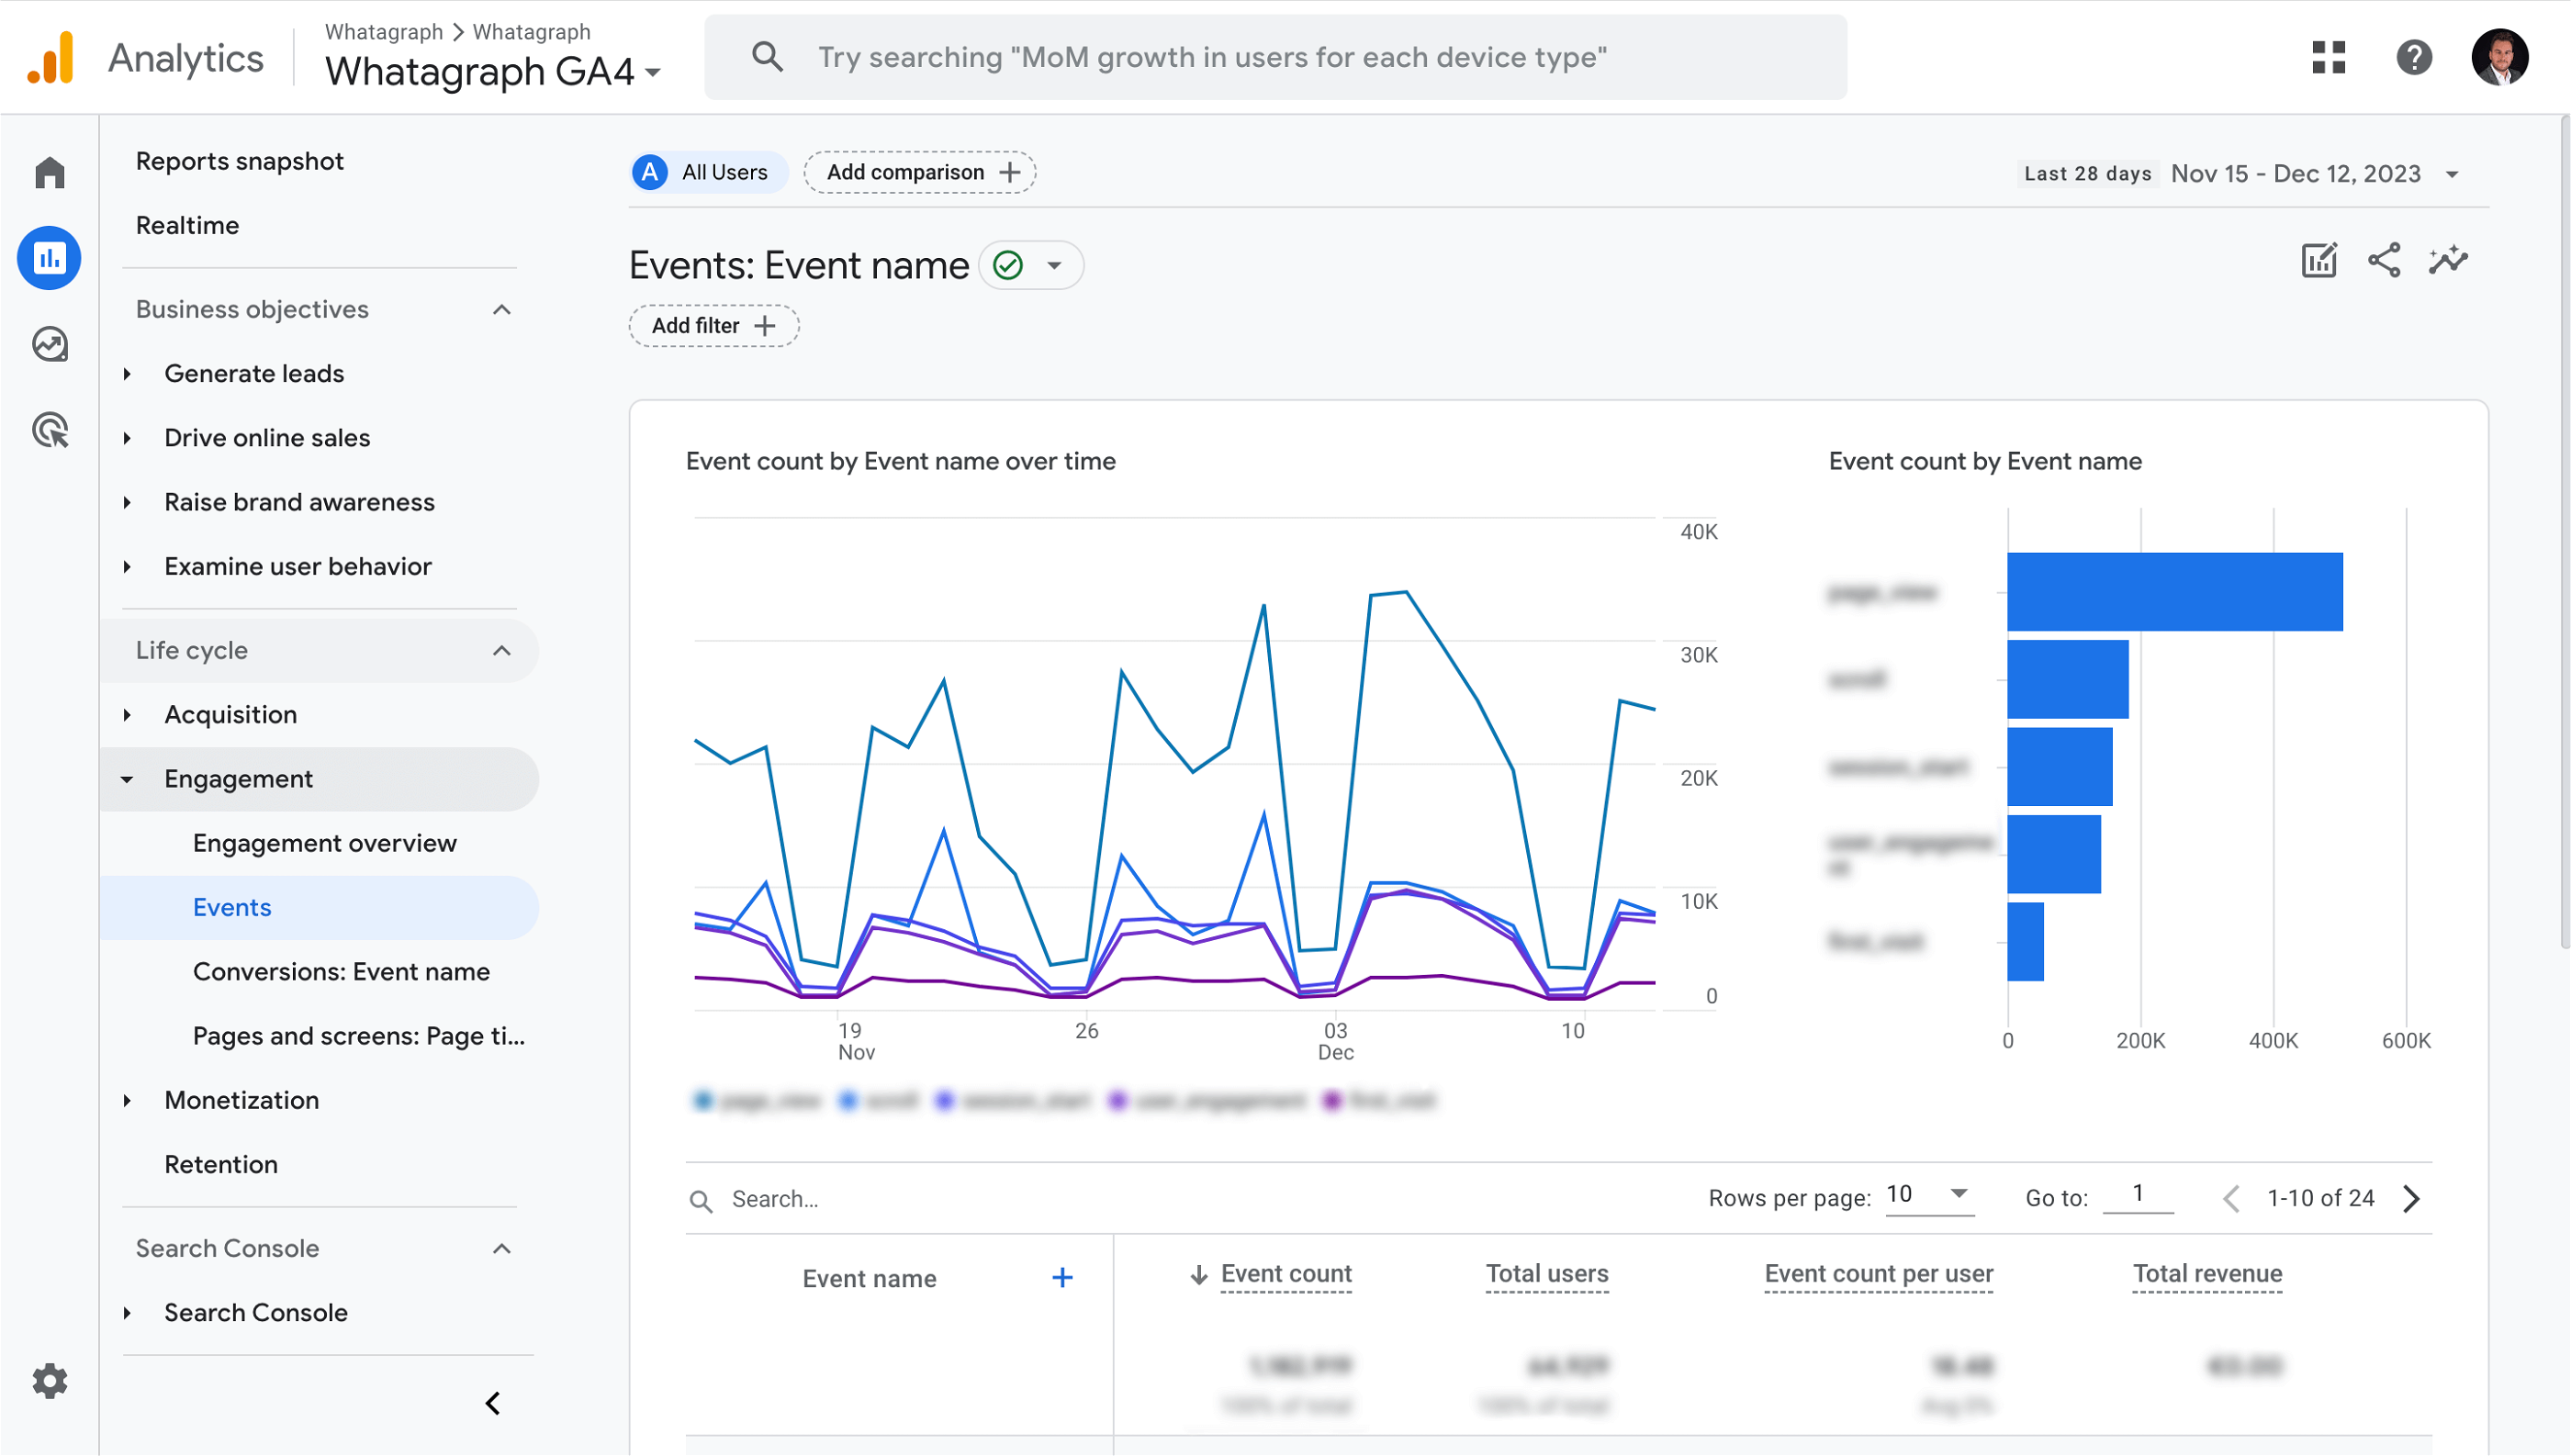
Engagement reports
You can use these kinds of reports to determine what content or landing pages your visitors engage with.
- Page and screens report: This shows how your website and mobile apps perform by the number of page views or screens, as they are called in mobile apps. Contains metrics like average engagement time, views per user, etc.
- Events report: This shows how often you trigger events on your website or mobile app. Use it to determine if visitors engage with your special offer banners or how far they scroll down your site.
Will clients get the important information right away?
Conversion reports
What used to be Goals in Universal Analytics are now Conversions in GA4.
This allows you to define your conversion event names specific to your business, which is especially valuable if you’re running a revenue or lead generation campaign to help you focus on the keywords that drive the most results for your business.
Monetization reports are useful for tracking e-commerce purchases and how visitors interact with your online store. You can add or remove custom dimensions and events and add metrics with the admin permissions.
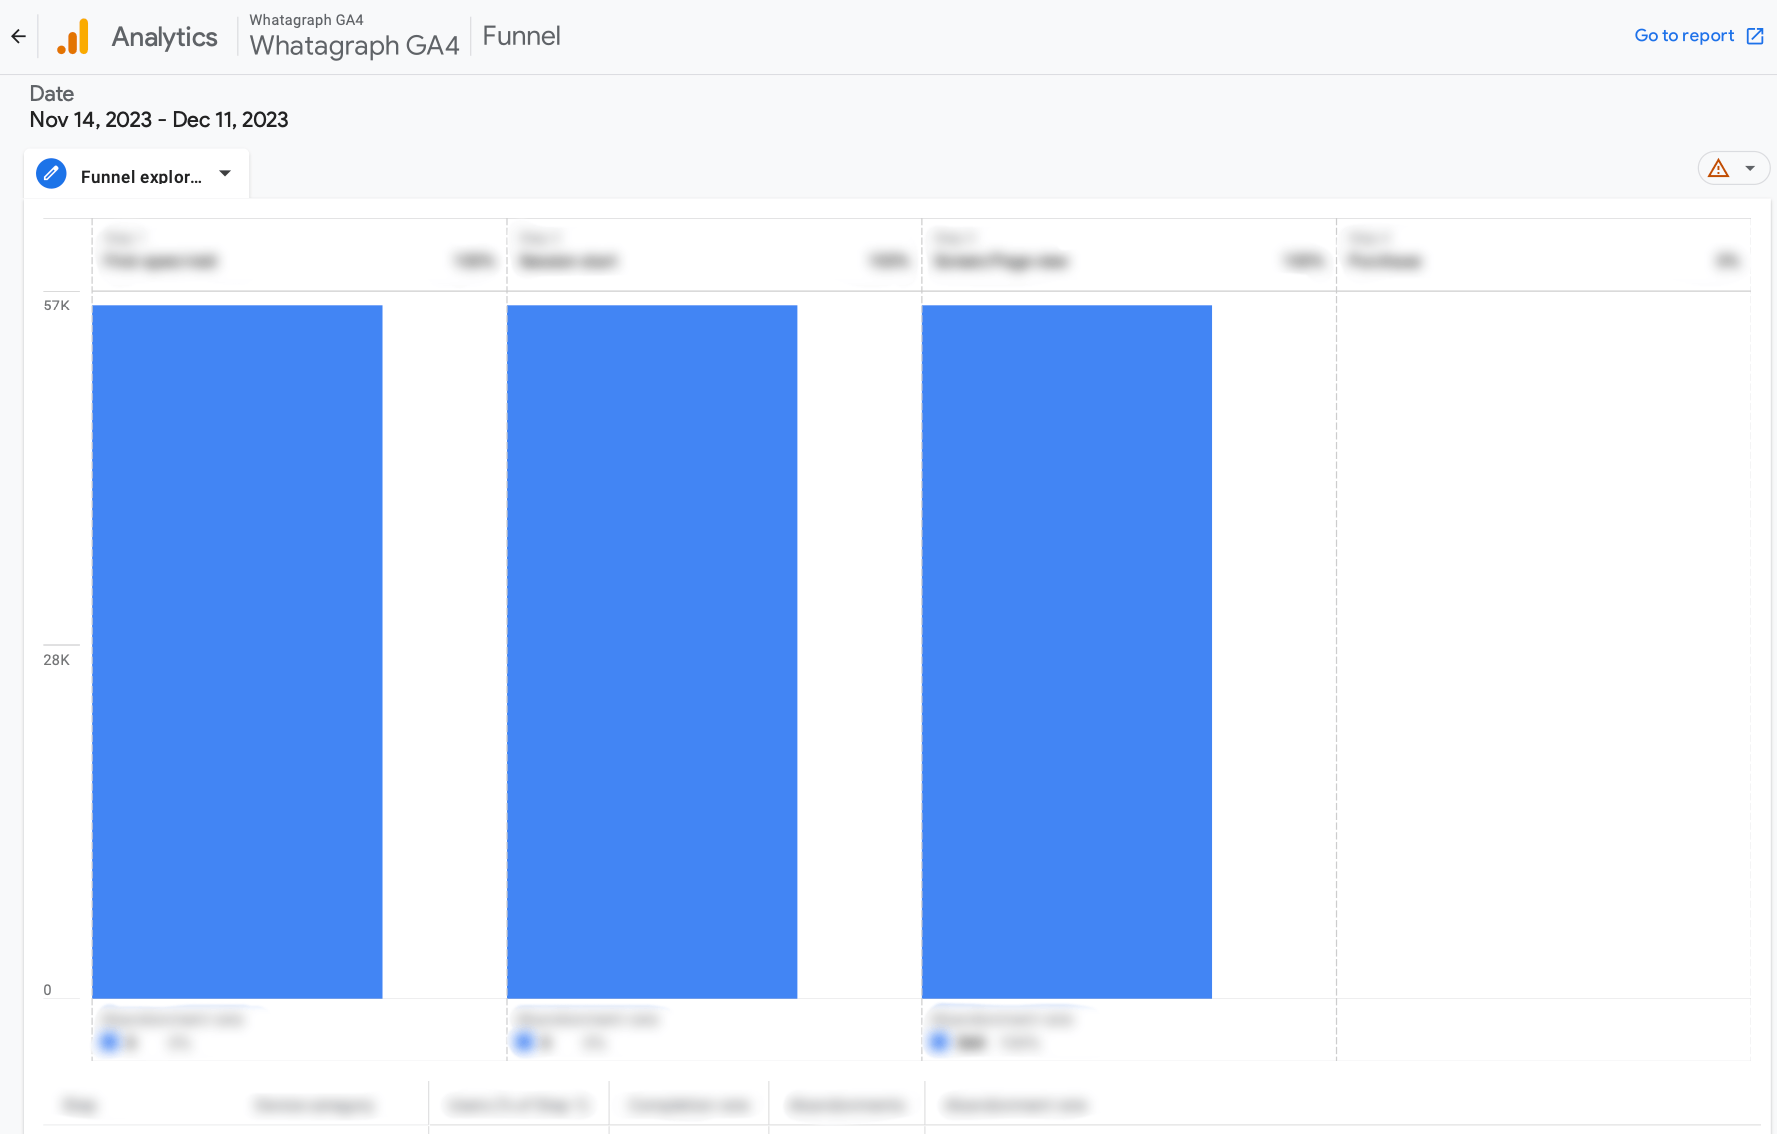
Multichannel funnel reports
We all loved multichannel funnel reports in UA, and now you can do the same and more with Funnel exploration reports in GA4.
Visualize how users move through your website across multiple channels, the user behaviors when they are about to purchase, etc.
These reports help you analyze a user journey or identify opportunities for improvement.
What key metrics and KPIs should you track in GA4?
Choosing the right key metrics and KPIs to track in GA4 depends on your specific marketing goals and objectives. However, some key metrics are universally relevant and provide valuable insights for most organizations. Here are the key metrics and KPIs you should consider tracking in GA4:
1. User Engagement:
- Average Session Duration: The average time users spend on your website per session. This metric provides insights into user engagement and content effectiveness.
- Bounce Rate: The percentage of single-page sessions that shows how engaging your website is. A high bounce rate suggests users are leaving quickly without exploring further.
- Engagement Rate: The percentage of sessions that trigger specific engagement events, indicating user interaction and value generation.
2. Acquisition and Traffic:
- Sessions by Channel: Identifies the sources of your website traffic, helping you understand which marketing channels are most effective at driving visitors.
- New vs. Returning Users: The difference between new and returning users provides insights into customer loyalty and acquisition strategies.
3. Conversions and Goals:
- Conversion Rate: The percentage of sessions that complete a desired action, such as a purchase, sign-up, or download. This metric is crucial for gauging the effectiveness of your website's conversion funnel.
- E-commerce Revenue: The total revenue generated through your website, providing a clear indicator of your online store's performance.
- Average Order Value: The average amount spent per order, helping you analyze customer purchase patterns and optimize product offerings.
4. User Behavior and Content Performance:
- Most Engaged Pages: The pages that capture user attention and generate the most engagement. This helps you understand user preferences and optimize your content strategy.
- Event Count: Tracks the cases of specific user actions, such as button clicks, video plays, or form submissions, providing insights into user behavior and interactions.
- Pageviews per Session: The average number of pages viewed per session. This metric indicates how deeply users explore your website and their level of engagement.
- Total Users: The number of unique users who have logged an event. You can compare this metric against Active Users (which is new in GA4) or Total Revenue for e-commerce web analytics.
Limitations of native Google Analytics 4 reporting
Google Analytics 4 provides a comprehensive and evolving platform for website and app analytics you can use to optimize your customer journey. However, even after the upgrade from now-discontinued Universal Analytics to GA4 properties, you may have noticed certain limitations in Google Analytics 4 reports.
These limitations make it difficult to tell a story, explore the conversion funnel in more depth, or simply visualize the data the way you want it.
Here are some of the key limitations of native GA4 reports:
Limited customization: Google Analytics 4 native reporting interface gives only a few customization options, which limits your ability to create custom reports tailored to your client’s specific needs.
Lack of pre-built templates: GA4 offers seven report templates called exploration reports: Funnel Exploration, Path Exploration, Segment Overlap, User Explorer, Cohort Exploration, User Lifetime, and the Free Form.
So, where is the problem with this?
The problem is that you are limited to what information each report template allows, with no possibility to combine widgets and create “one template to rule them all”.
In most cases, you’re down to creating a template from scratch, which is not intuitive in this tool, as we will see.
Challenging manual report builder: Creating a new report can be challenging for some users due to the platform’s unique structure. For example, you need to standardize and consolidate data across different data streams and dimensions to ensure the data is consistent and accurate.
Then, you need to have a clear understanding of the client’s business KPIs to ensure the data is presented in a relevant order that helps decision-making.
Effectively, that means retracing the steps and creating a new template for every client’s use case — which wouldn’t be such a problem if the builder itself were more user-friendly and allowed you to save visualizations you create as widget templates and rearranging them to tell the story.
Also, the way you create visualizations in the GA4 native environment requires you to configure all the dimensions, metrics, and segment details before the visualization appears, which can lead to a prolonged trial-and-error session.
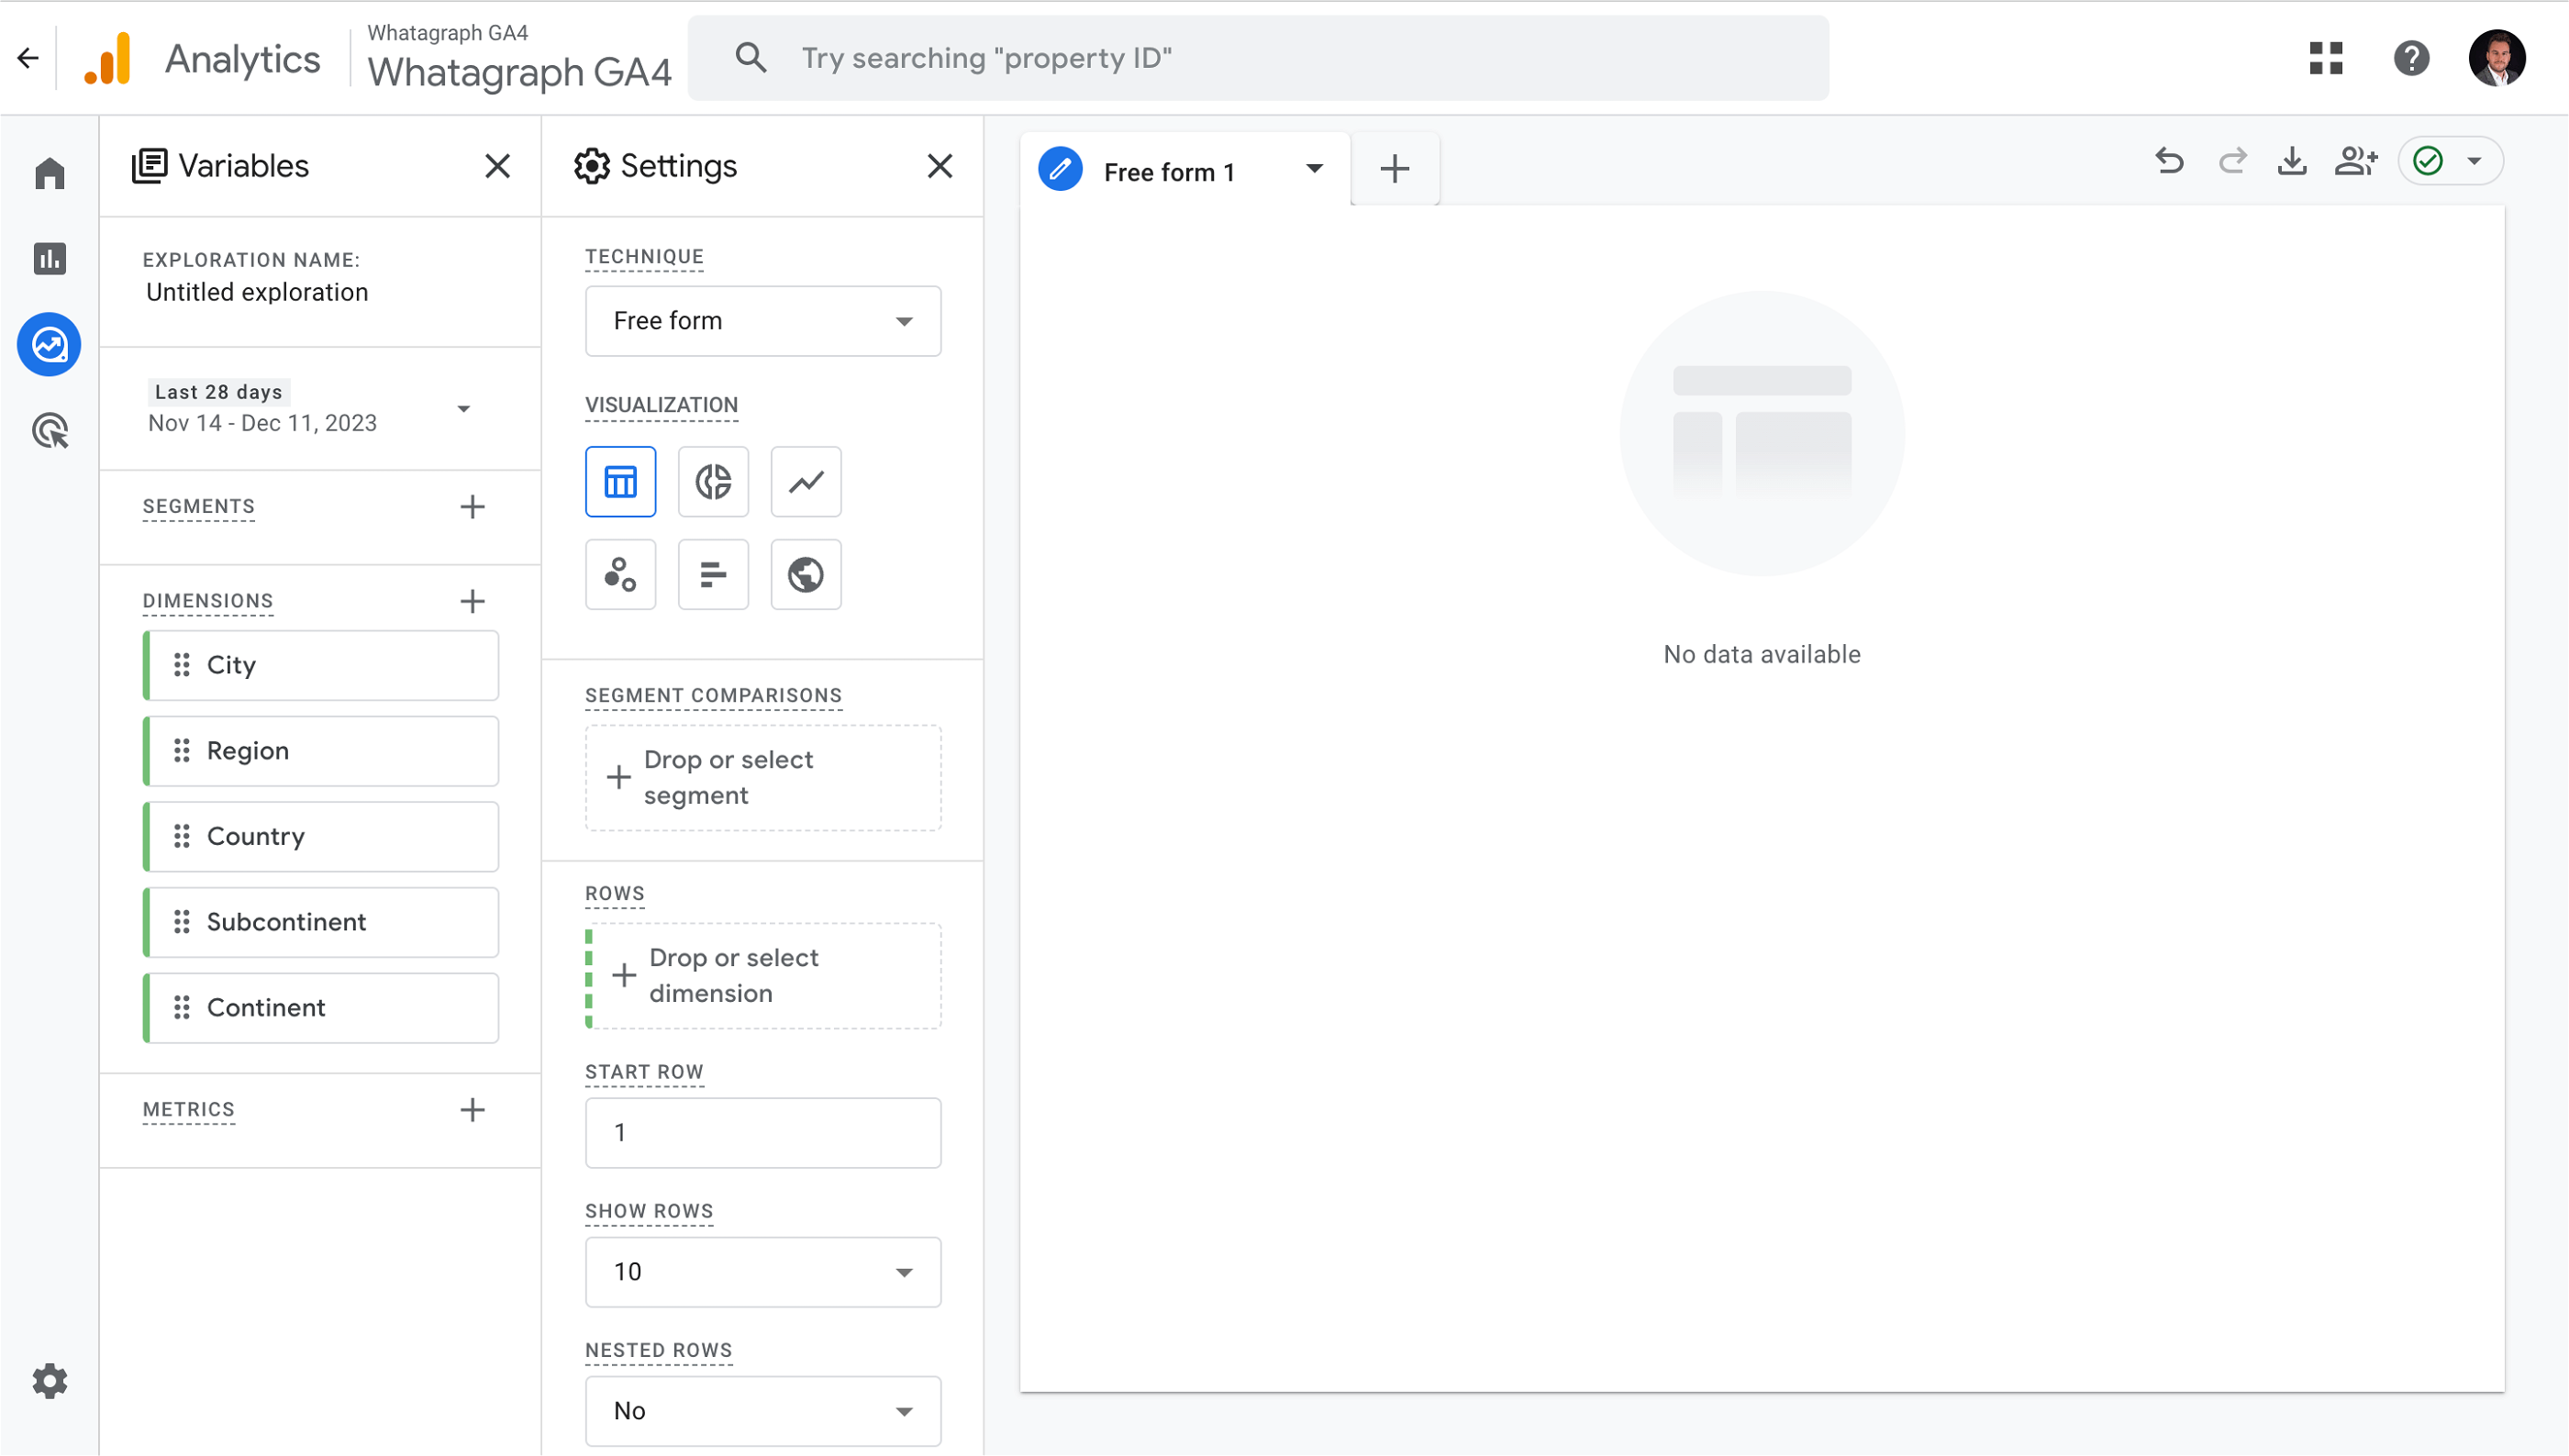
Where do we start?
Basic visualizations only: Google Analytics 4 supports basic data visualization techniques like graphs, charts, and tables but lacks advanced options to blend data from multiple sources, make custom calculations, create new metrics, or display multi-source tables.
Manual data sharing: Google Analytics 4 offers dynamic reporting capabilities, but the only way to share the interactive report or dashboard with a client is to send them a link to the entire dashboard and let them help themselves to any view and sub-report they need.
An example of PDF export from GA4: not the most engaging way to report.
On top of these visual limitations, GA4 also has some difficulties with querying data. Users of the free version have reported reaching quotas for their property, and fresh data was not fetched as a result.
What are the alternatives? Email them half a dozen exported PDF views? Half a dozen live dashboard links?
Neither way shows much professionalism and requires extra effort on the client’s side if they want to get all their web analytics data in one view.
Streamlined Google Analytics 4 reporting with Whatagraph
Native Google Analytics 4 reports and dashboards might work fine for in-house marketing specialists who do minimum outside reporting. However, if there are other teams, stakeholders, or clients involved, you need a more efficient and flexible solution.
If you’ve struggled with native GA4 reports or other inferior reporting tools, you’ll be amazed how Whatagraph can automate your reporting process, save time, and improve data communication and storytelling.
How?
Connect
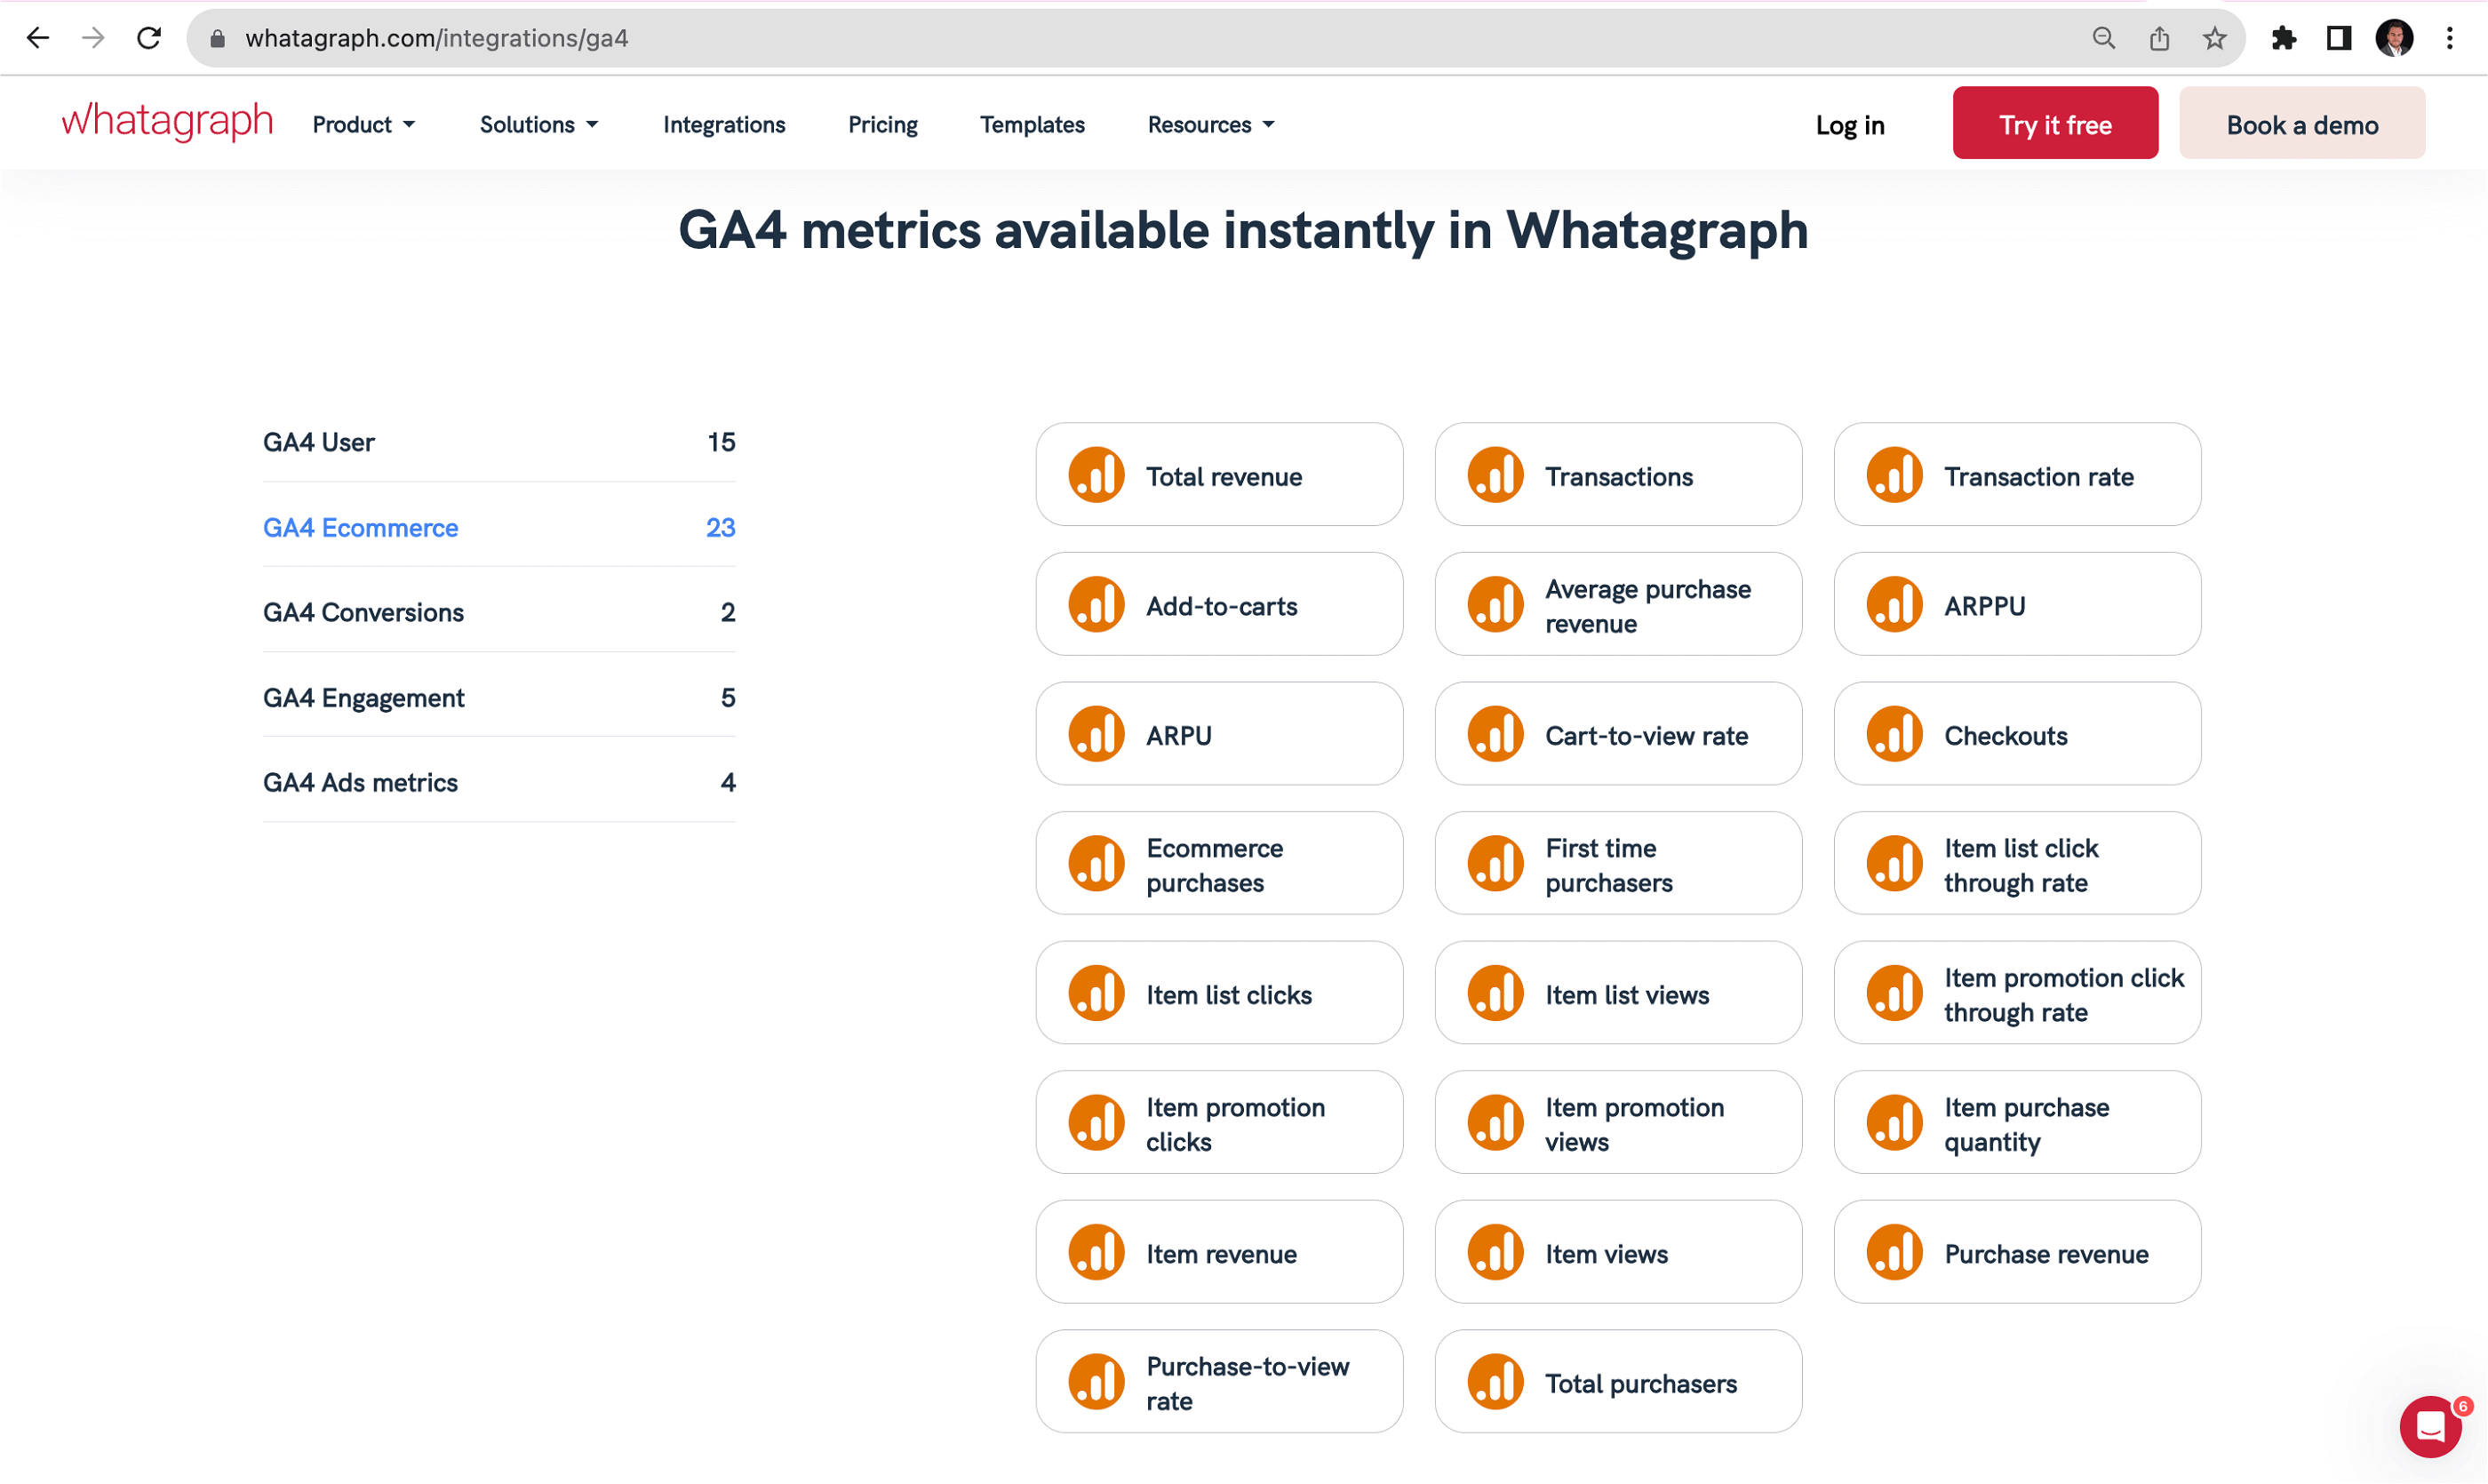
We have built a native integration for Google Analytics 4, so whatever data is available from GA4, we bring it in. And connecting data takes no more than a few clicks.
Just add your GA4 account as a source, and you’re done.
But a big advantage of Whatagraph over native GA4 reporting and even Looker Studio is that you can effortlessly bring data from other sources, such as SEO and PPC tools.
Our marketing data platform has native integrations with more than 45 paid advertising, email marketing, and e-commerce platforms.
This doesn’t include just Google Ads, Google Search Console, Google My Business, and other tools from Google’s stack but also Ahrefs, Semrush, Facebook and Linkedin Ads, Mailchimp, and many other tools your clients use.
A native integration is always the best way to connect your data, but no one has connectors for every tool out there.
Whatagraph takes care of that as well — you can connect data from any digital marketing tool via a custom API or by exporting the data to Google Sheets or Google BigQuery and adding them as a source.
Visualize
Next, we have a beautiful Google Analytics 4 report template you can use right off the shelf. But the difference between our template and native GA4 templates is that ours is fully customizable — and not only that, but you can make changes to it very easily.
Click on any widget to see the metrics and dimensions behind it. You’re welcome to change them, add new ones, or apply your own filter. Blend related metrics from different sources, create new metrics, and unify dimension names in the case of multi-source widgets.
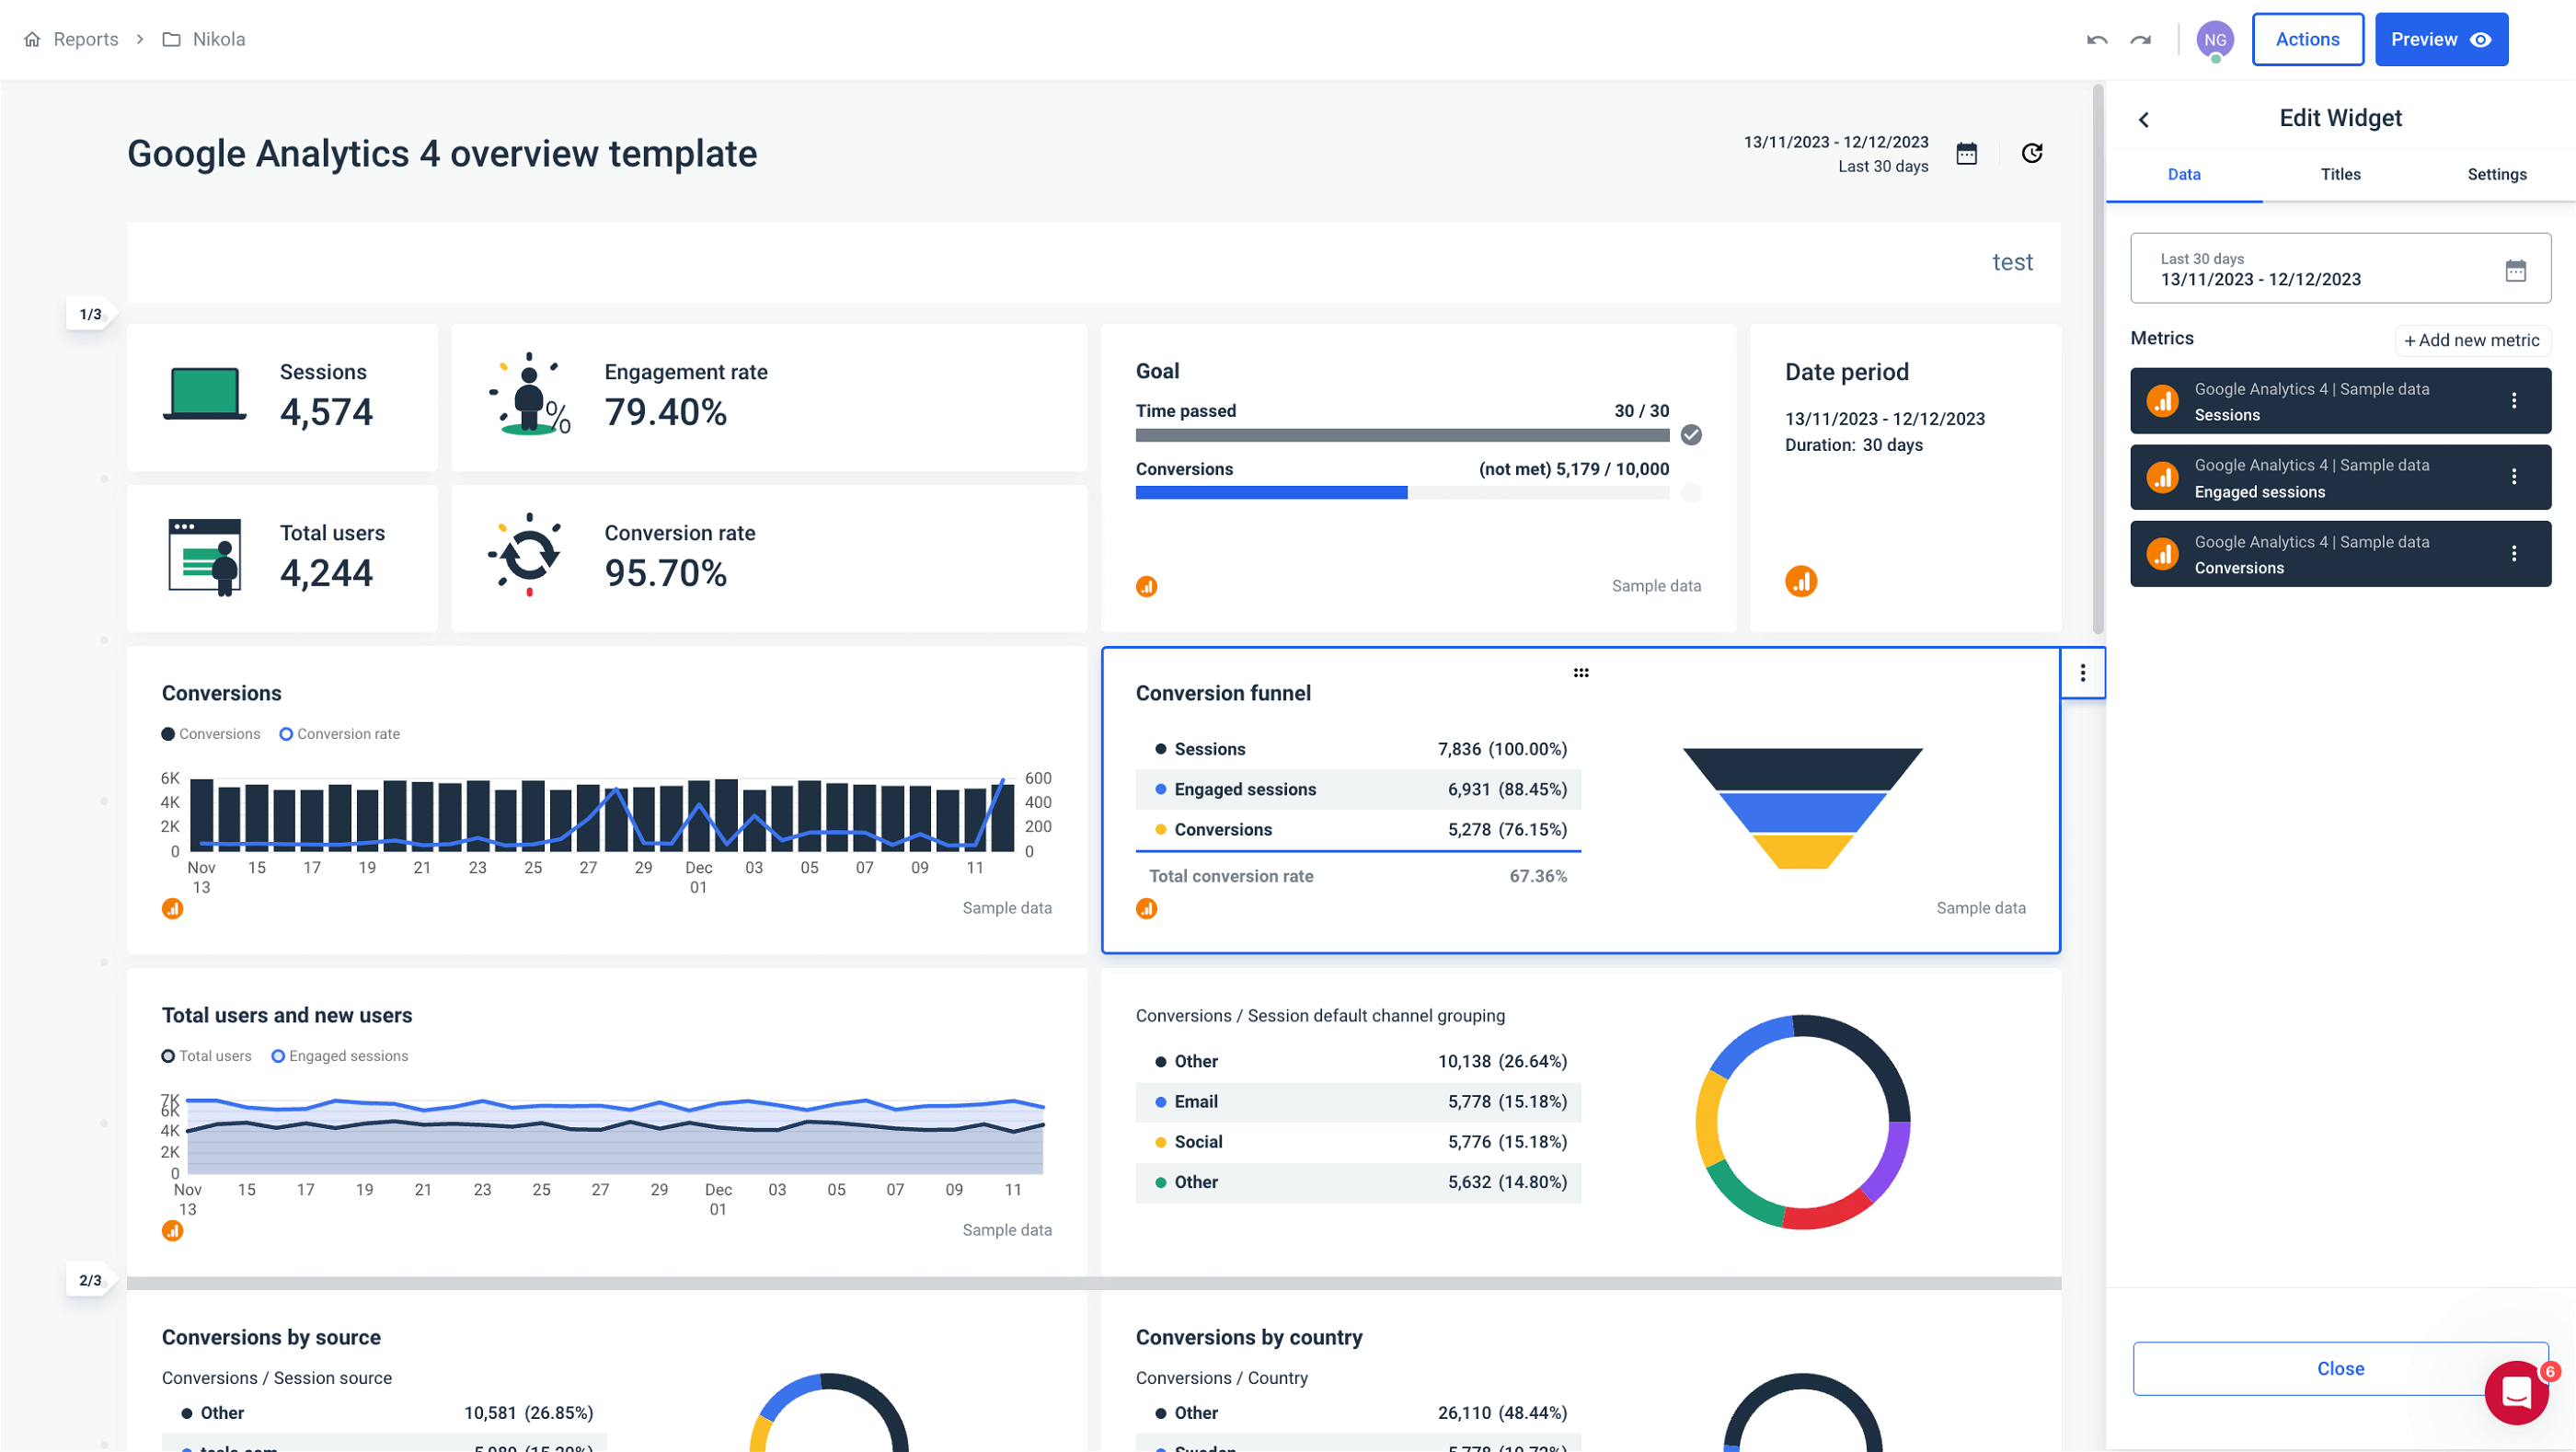
Don’t like the layout of our GA4 template? Rearrange the visualizations, adjust the goals widget for your needs, add comment sections, titles, etc.
Remember those 45+ native integrations? You can easily enrich your Google Analytics 4 report with cross-channel insights from other tools and have all the metrics related to your client’s funnel in one view.
Let’s take a look at other Whatagraph features that save you time:
- Drag-and-drop builder: If you prefer building reports from scratch, we have an intuitive drag-and-drop builder you can use to quickly create your custom GA4 report by picking the widgets you need.
- Save anything as a template: Any widget, report page, or report you create can be saved as a template, so you don’t have to waste time building complex visualizations every time.
- Linked reports: There’s another feature called linked reports, which is handy for marketing agencies and businesses that routinely create many reports. It allows you to link up to hundreds of reports to one master template and edit them all at once.
- Overview reports: A great feature for agencies to monitor multiple accounts or campaigns, you can also use it to track metrics from different channels, locations, web pages, devices, etc.
Share
Keeping clients and stakeholders informed about marketing developments is a time-consuming job. Unfortunately, native GA4 reports don’t help much in this area. You can download individual reports as rather unattractive PDF files or share links to individual dashboards, making viewers switch between the views as they try to see the whole picture.
Whatagraph has a much better solution:
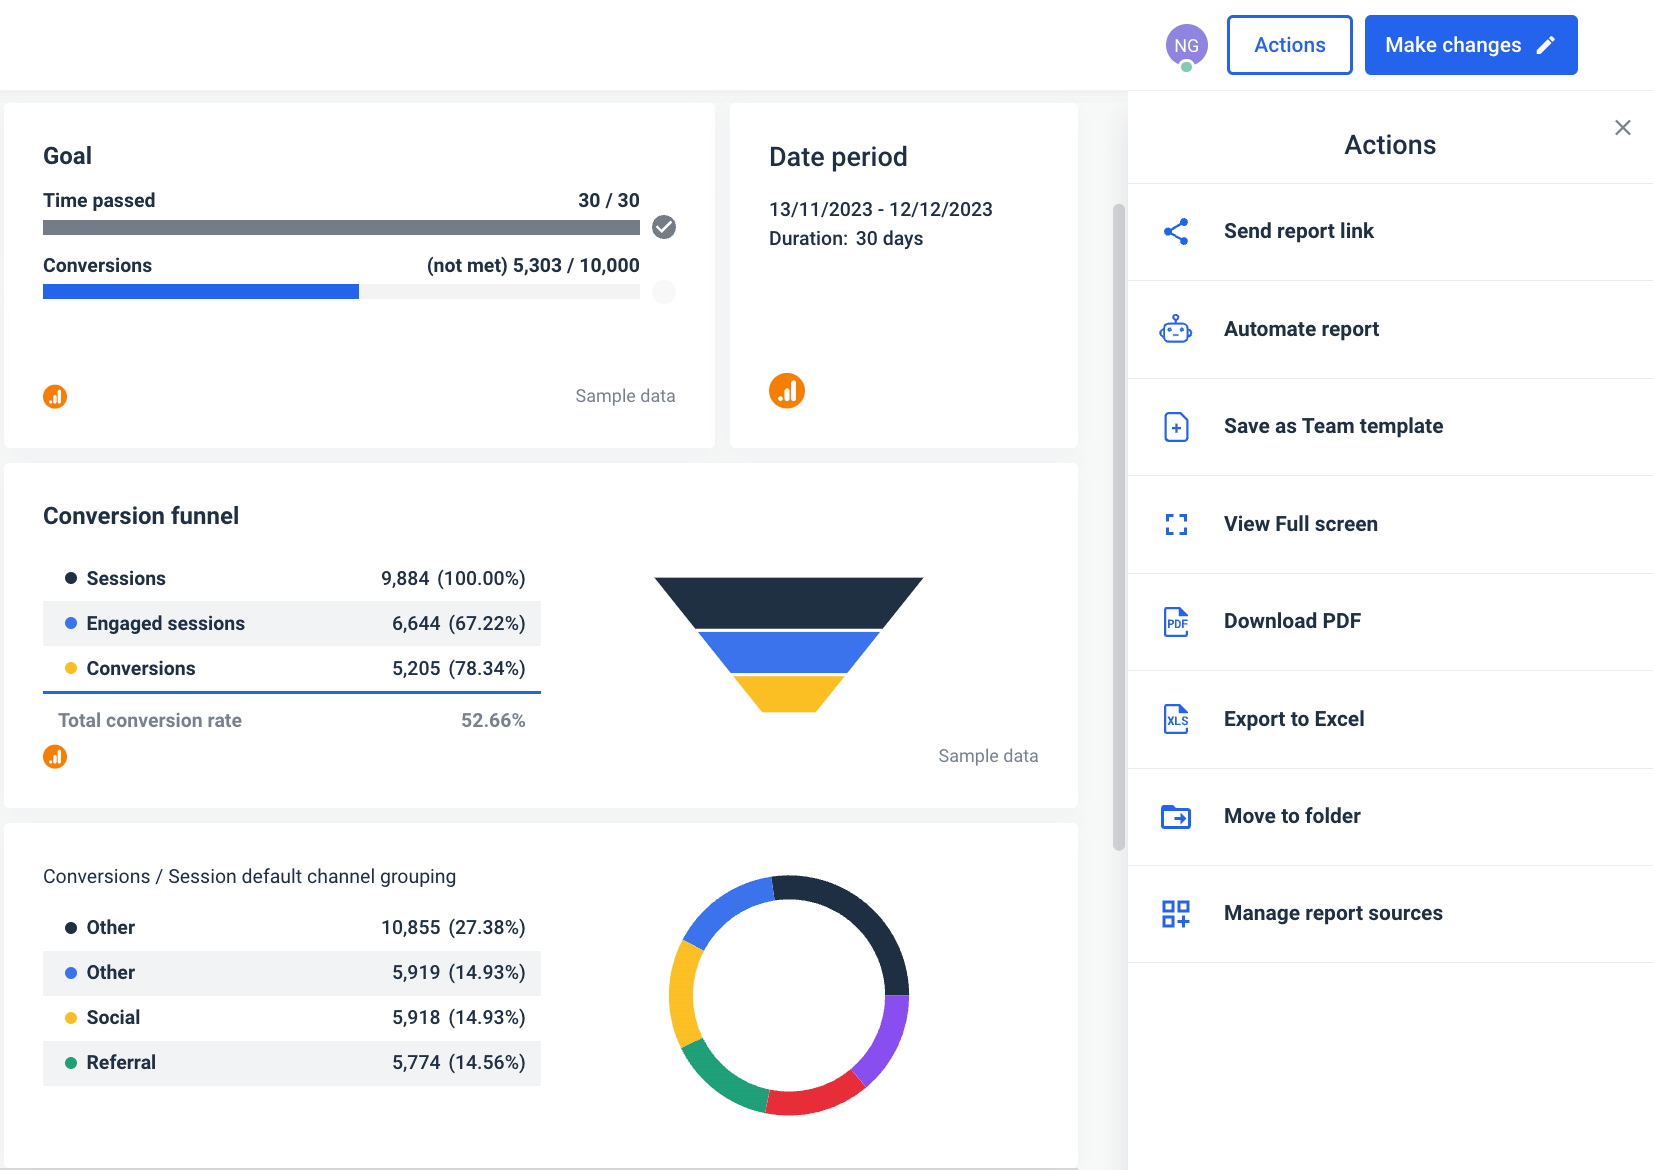
- Automated emails: Once you’re happy with the report, you can put the whole process on autopilot. Just add the recipients, frequency, and time of send, and the right people will get their reports every time. The best thing is that you don’t need to export the reports to another emailing tool — everything gets done in the same view where you created the report.
- Live links: Share a live link to your Google Analytics 4 dashboard, and clients can always check the progress of their marketing campaigns. And since Whatagraph allows you to display all Google Analytics 4 metrics in one dashboard, there’s no need to send separate links. Everything your clients need is presented in a user-friendly view, with an option to change the date range and see how website data changes over time.
Wrapping up
Google Analytics 4 is an indispensable marketing analytics platform for measuring traffic and engagement across your websites and apps. Its native reports and dashboards provide plenty of information about your conversion funnel.
However, mastering those reports takes time, and they are hardly suitable for client reporting, customization, and sharing.
You can significantly simplify and speed up your Google Analytics 4 reporting process by bringing your GA4 data to Whatagraph and using our user-friendly visualization and sharing interface.
In return, you get increased productivity, improved data visualization, cross-channel ability, and an easier way to communicate key findings with your clients and stakeholders.
Sign up for a free trial and let Whatagraph do the hard work!
Published on Dec 20 2023
WRITTEN BY
Nikola GemesNikola is a content marketer at Whatagraph with extensive writing experience in SaaS and tech niches. With a background in content management apps and composable architectures, it's his job to educate readers about the latest developments in the world of marketing data, data warehousing, headless architectures, and federated content platforms.