Universal Analytics vs. Google Analytics 4: Are You Ready for the Change?
And it's about to happen. Google has been warning us that as of July 2023, Universal Analytics will have stopped collecting data, and all the new data will have gone straight to Google Analytics 4 (GA4). Unless you’ve created a GA4 property, Google even created one for you.
But apparently, Universal Analytics is still much alive and kicking, but we never know for how much longer. This is the final call to all UA users to switch over to Google Analytics 4. So how does Universal Analytics vs. Google Analytics 4 stack?

Jul 18 2023●8 min read


- What is still similar between Universal Analytics and Google Analytics 4?
- New features that Google Analytics 4 brings
- What features did GA4 drop from Universal Analytics?
- How to report on Google Analytics 4 data?
- How to migrate your data from UA to Google Analytics 4 safely?
- Use Whatagraph data transfer
- FAQ
- Conclusion
The good news is that Google Analytics is a brand-new data platform with many improvements. However, there’s still some confusion about the differences and similarities between Google’s old analytics tool and the new one.
Let’s clear that confusion up once and for all. In this article, we’ll compare GA4 vs. Universal Analytics, check out the new features, and finally, explain how to prevent data loss while migrating to GA4.
What is still similar between Universal Analytics and Google Analytics 4?
Data and reporting features
Basically, everything you measure in UA, you can also measure in GA4, which includes running all the same reports. While there’s a common misconception that GA4 has more reporting options, many of them exist in UA as well, just hidden under different tabs.
Reporting interface
The interface of these two data analytics platforms is also similar. If you can navigate around your Universal Analytics account, there isn’t much of a learning curve for GA4. A few things are in different places. A couple of features may work a bit differently, but the design is the same for the most part.
Price
And finally, just like Universal Analytics, the standard version GA4 is completely free to use. But there’s also a premium enterprise version called GA4 360 that you need to pay for, with the price based on usage.

New features that Google Analytics 4 brings
Google Analytics 4 introduces many features that help users get more detailed and accurate insights into their customer data. Here are the key differences and improvements.
Event-based data tracking
The most significant difference between UA and GA4 is how they measure and model data.
In Universal Analytics properties, data is grouped into sessions, which forms a base for reporting. A session is a group of user interactions with your website that take place within a given timeframe.
During a session, UA collects and stores user interactions such as web page views, events, and eCommerce transactions as hits. A single session can contain multiple hits, depending on the user interactions.
This session-based measurement model is adequate but often leaves gaps within data collection since it doesn't include social interactions such as video watches, clicks, etc.
In GA4, on the other hand, each interaction is tracked as an event that you can analyze and measure in a much more flexible way using the available reporting software.
Events can collect and send pieces of information that more completely specify the actions the user takes or add more context to both the event and the user. This can include things like the value or purchase, the title of the page the user visited, or the user’s geo-location.
![]()
In UA, different hit types correspond to different types of data, where a hit is an interaction that a visitor has with your website or app. In GA4 properties, all hit types are observed as events.
There are 4 event types in GA4:
- Automatically collected events: Triggered by basic interactions when you install the GA4 code base. Examples: page_view, session_start, first_visit, etc.
- Enhanced measurement events: Automatically collected and allow you to track engagement with your content. For example, you can use enhanced measurement events to see data related to scrolls, outbound clicks, site searches, video engagement, and file downloads. You can even manually disable some specific measurements in this event type.
- Recommended events: Not automatically collected, but can help measure additional data and create more useful reports.
- Custom events: Names and set parameters you define as unique to your business. Before you configure a custom event, make sure first to review the list of automatically collected, enhanced measurement, and recommended events to avoid duplicates.
Universal Analytics also allows users to measure events like button clicks, and depth of scrolling, but it was only possible with the help of Google Tag Manager (GTM).
In GA4, for recommended and custom event tracking you will still need GTM, while automatically collected events and enhanced measurement events can be measured only with GA4.
Data streams
In Universal Analytics, you have to create separate properties for your website and app, while each property is recommended to include 3 distinct views:
- Unfiltered view — This is where you store all the raw data.
- Test view — Where you add filters and run experiments.
- Master view — Which gathers all the goals, filters, and other customizations you’ve tested in the test view.
In GA4, everything is much more simplified. Every website or app you add is considered a data stream and can fall under one single property. A data stream is a data funnel that starts from a customer’s touchpoint to GA4. Each GA4 property can have up to 50 data streams.
Attribution
In December 2019, Google upgraded Universal Analytics with the Attribution Project tool, which gave users access to tools related to attribution and conversion.
In GA4, there’s a section in the primary navigation called “Advertising”, which houses the same tools from the Attribution projects. However, these tools aren’t the only attributions that came with GA4. Now all users have access to Google’s data-driven attribution model that all GA4 properties now use as their default conversion model.
Machine learning
Data-savvy users are most excited about what Google Analytics 4 brings regarding machine learning. GA4 can actually help you predict what actions a user might take in the future.
There are three predictive metrics in GA4 that might be interesting for marketers:
Purchase probability: The probability that a user who was active in the last 28 days will activate a specific conversion event in the next seven days.
Churn probability: The probability that a user who was active on your site or app within the last seven days will not be active in the next seven days.
Predicted revenue: The revenue from all purchase conversions within the next 28 days from an active user in the last 28 days.
Cookies and IP-less tracking
When designing GA4, Google has put much effort into making it as private as possible. Users can collect data on GA4 without using third-party cookies or collecting IP addresses.
Instead of those, Google has decided to use first-party cookies alongside AI to fill in data gaps. This makes the platform compliant with major privacy laws, like GDPR and the California Consumer Privacy Act.
Mobile app data gathering
Another big change related to GA4 analytics is how easy it is to gather mobile app data alongside regular website tracking.
To be honest, you can also do this in UA, but you need to create a separate Universal Analytics property.
With GA4, everything is tracked in one platform, so you can get a more granular and comprehensive picture of how customers navigate your website.
New metrics
Among the new metrics that GA4 introduces, there’s one called “engagement rate”. It’s the percentage of “engaged sessions” — sessions that lasted longer than 10 seconds, had a conversion event, or had at least two pageviews or screen views. Following suit, the average session duration in UA is now the average engagement time.
Universal Analytics has the “bounce rate” metric — the percentage of single-page sessions without interaction with the page. A bounced session has a duration of 0 seconds.
In this sense, “engagement rate” is more valuable than “bounce rate” for measuring the behavior of users who might have viewed a single page and left without taking any action. But remember that the “engagement rate” is not the opposite of the “bounce rate”.
Improved product integration
GA4 seamlessly integrates with a range of other Google products, such as Google Ads, Google Merchant Center, and BigQuery.
For Google Ads, GA4 allows you to identify highly-engaged or high-value audiences and target them with a paid campaign. You can even see your Google Ads campaigns in the GA4 acquisitions report and import analytics conversions into your Google Ads account.
BigQuery was previously only accessible to users with GA 360 accounts. But now, the integration is free for all GA4 users and offers a multi-cloud serverless data warehouse you can use to analyze historical data and keep your data safe from shifting policies of individual platforms.
Customizable dashboards
In Universal Analytics, there isn’t much you could do to customize the report pages. GA4 allows users to rearrange data cards by clicking the customize report button.
User entity modeling
When a visitor lands on your website, they are most likely asked to consent to the cookies settings. Once they accept the terms, the website that is integrated with Universal Analytics sends the cookies into your web browser, and they can record and monitor the visitor’s actions during a specific session.
But nowadays, customers interact with businesses in more channels than just websites. People increasingly use apps and look for information on multiple platforms that don’t support cookies.
So in this day and age, relying only on cookies makes it challenging to combine user behavior data from different touchpoints to get a big picture of all their interactions.
Fortunately, GA4 brings new user entity data modeling that includes both cookies and Google signals. Now you can stitch the data together into a single cross-device user journey.
- Google signals: Data from users who are signed in to Google. They can help fill the data gaps that are left by the lack of cookies.
GA4 search bar
Universal Analytics search feature allows you to look up some things, like reports and insights. For example, if you type “conversions” into the search bar, you get the most relevant conversion reports and the conversion insight tab.
Now that looks weak compared to the intuitive search that GA4 brings. By clicking in the search box, you can already see your recent searches. Start typing a question, and Google suggests to complete it.
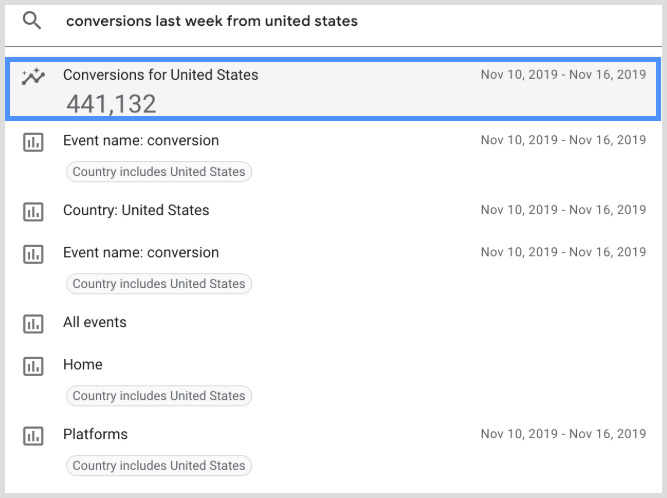
Yes, you can ask real questions, such as: how many more visitors than last week? — and Google will answer directly in the search bar.
You can even enter advanced queries that compare data ranges, such as how certain data compares from one period to another.
What features did GA4 drop from Universal Analytics?
Monthly hit limits
In Universal Analytics, webmasters are limited to 10 million hits per property, 500 hits for each session, and 200,000 hits per user per day. At the moment, GA4 doesn’t impose such limits.
Spam referrals
This is another feature that hasn’t made it to the new web analytics platform. GA4 prevents spam by forcing all Measurement Protocol hits to have a secret key that filters out spam referrals before the platform records them.
Bounce rates
This metric is now omitted from the reports because Google chooses to take a more positive approach by focusing on user engagement rate. In the place of bounce rate, webmasters can track engaged sessions. So basically, in GA4, your site’s bounce rate is the percentage of sessions that weren’t engaged.
How to report on Google Analytics 4 data?
Universal Analytics is built as a comprehensive collection of standard reports. GA4, however, has far fewer standard reports and seems best suited to be used with custom reports or exporting data to another reporting software, such as Whatagraph.
As an all-in-one platform to connect, visualize, and share digital marketing data, Whatagraph has native integration with Google Analytics 4, allowing users to export GA4 data to be visualized in engaging reports and dashboards.
Whatagraph Google Analytics 4 reports allow you to track, analyze and report on website and app events, traffic, and overall performance. You can either use our intuitive drag-and-drop report and dashboard builder or pick a template with pre-made widgets that cover page insights, impressions, reach, demographics, and more.
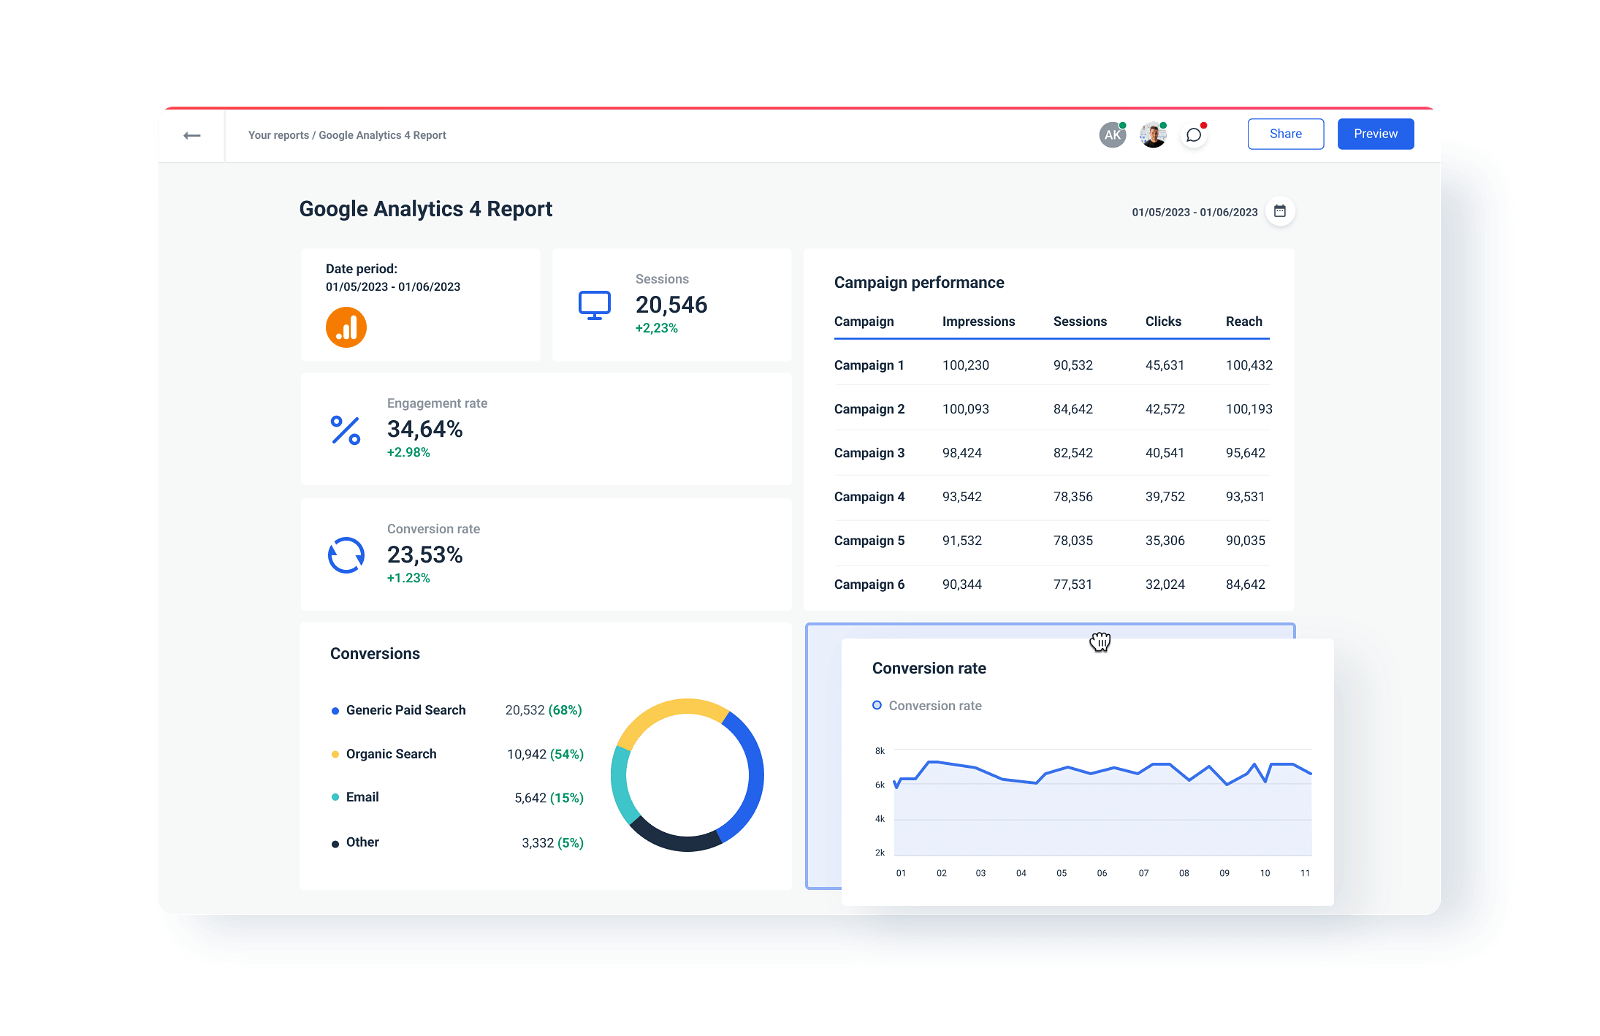
Each of the Whatagraph report or dashboard templates can be fully customized, as you can add and remove widgets, create custom dimensions and metrics, as well as rearrange the layout of graphs, tables, and images. Whatagraph even allows you to track cross-channel campaigns from one place by combining metrics from multiple sources in a widget or table.
You can customize your report or dashboard even more by changing the fonts, colors, and branding to match it more to your own, as well as altogether remove Whatagraph branding for a more professional look.
Sharing your GA4 dashboards with Whatagraph is easier than creating one. You can schedule emails with reports as PDF attachments or send your client a link to an interactive report or dashboard.
How to migrate your data from UA to Google Analytics 4 safely?
If you didn’t do it yourself, Google has already created a GA4 property for you. But what is to happen with all your historical data in Universal Analytics?
A 12-months deadline
The data will be there for 12 more months, and after that, it will be gone. There’ll be no way to retrieve it or export it.
The safest way to keep all your historical UA data is to export it to a data warehouse. This way, you’ll be able to access it at any time, even after the expiry deadline.
Problem solved!
But there’s another issue with Google Analytics 4 — the historical data retention limit.
GA4 data retention limit
While in Universal Analytics, you can store data indefinitely and never be concerned about it expiring, GA4 allows you to store data for a maximum of 14 months. After that period, your data will be deprecated.
So how to bypass this limit?
Start moving your new GA4 data to a data warehouse such as BigQuery as well to keep it safe from deprecation.
Another problem solved by data warehousing!
GA4 reporting data limitations
Still, there’s one more data limitation that comes with Google Analytics 4. Whether you use a basic reporting tool like Looker Studio or a powerful data platform like Whatagraph, clients may require lots of data in their reports.
The problem is that Google Analytics 4 allows you to make only up to 50,000 requests per project per day and 10,000 requests per profile per day. If you decide to include a larger date range, you’ll hit the wall.
How to solve this?
Again, by moving all your GA4 data to a data warehouse. While Google Analytics 4 has multiple challenges when querying large datasets, Google BigQuery has absolutely no limitations in terms of how much data you can fetch and what date range you select.
But isn’t moving data to BigQuery on a regular basis too complicated?
Not if you:
Use Whatagraph data transfer
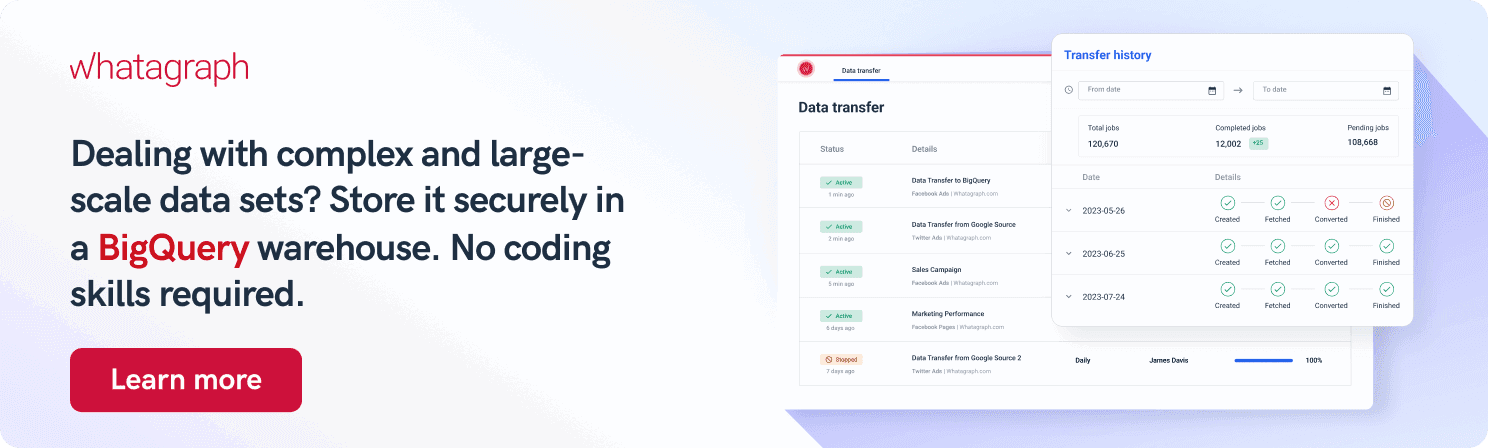
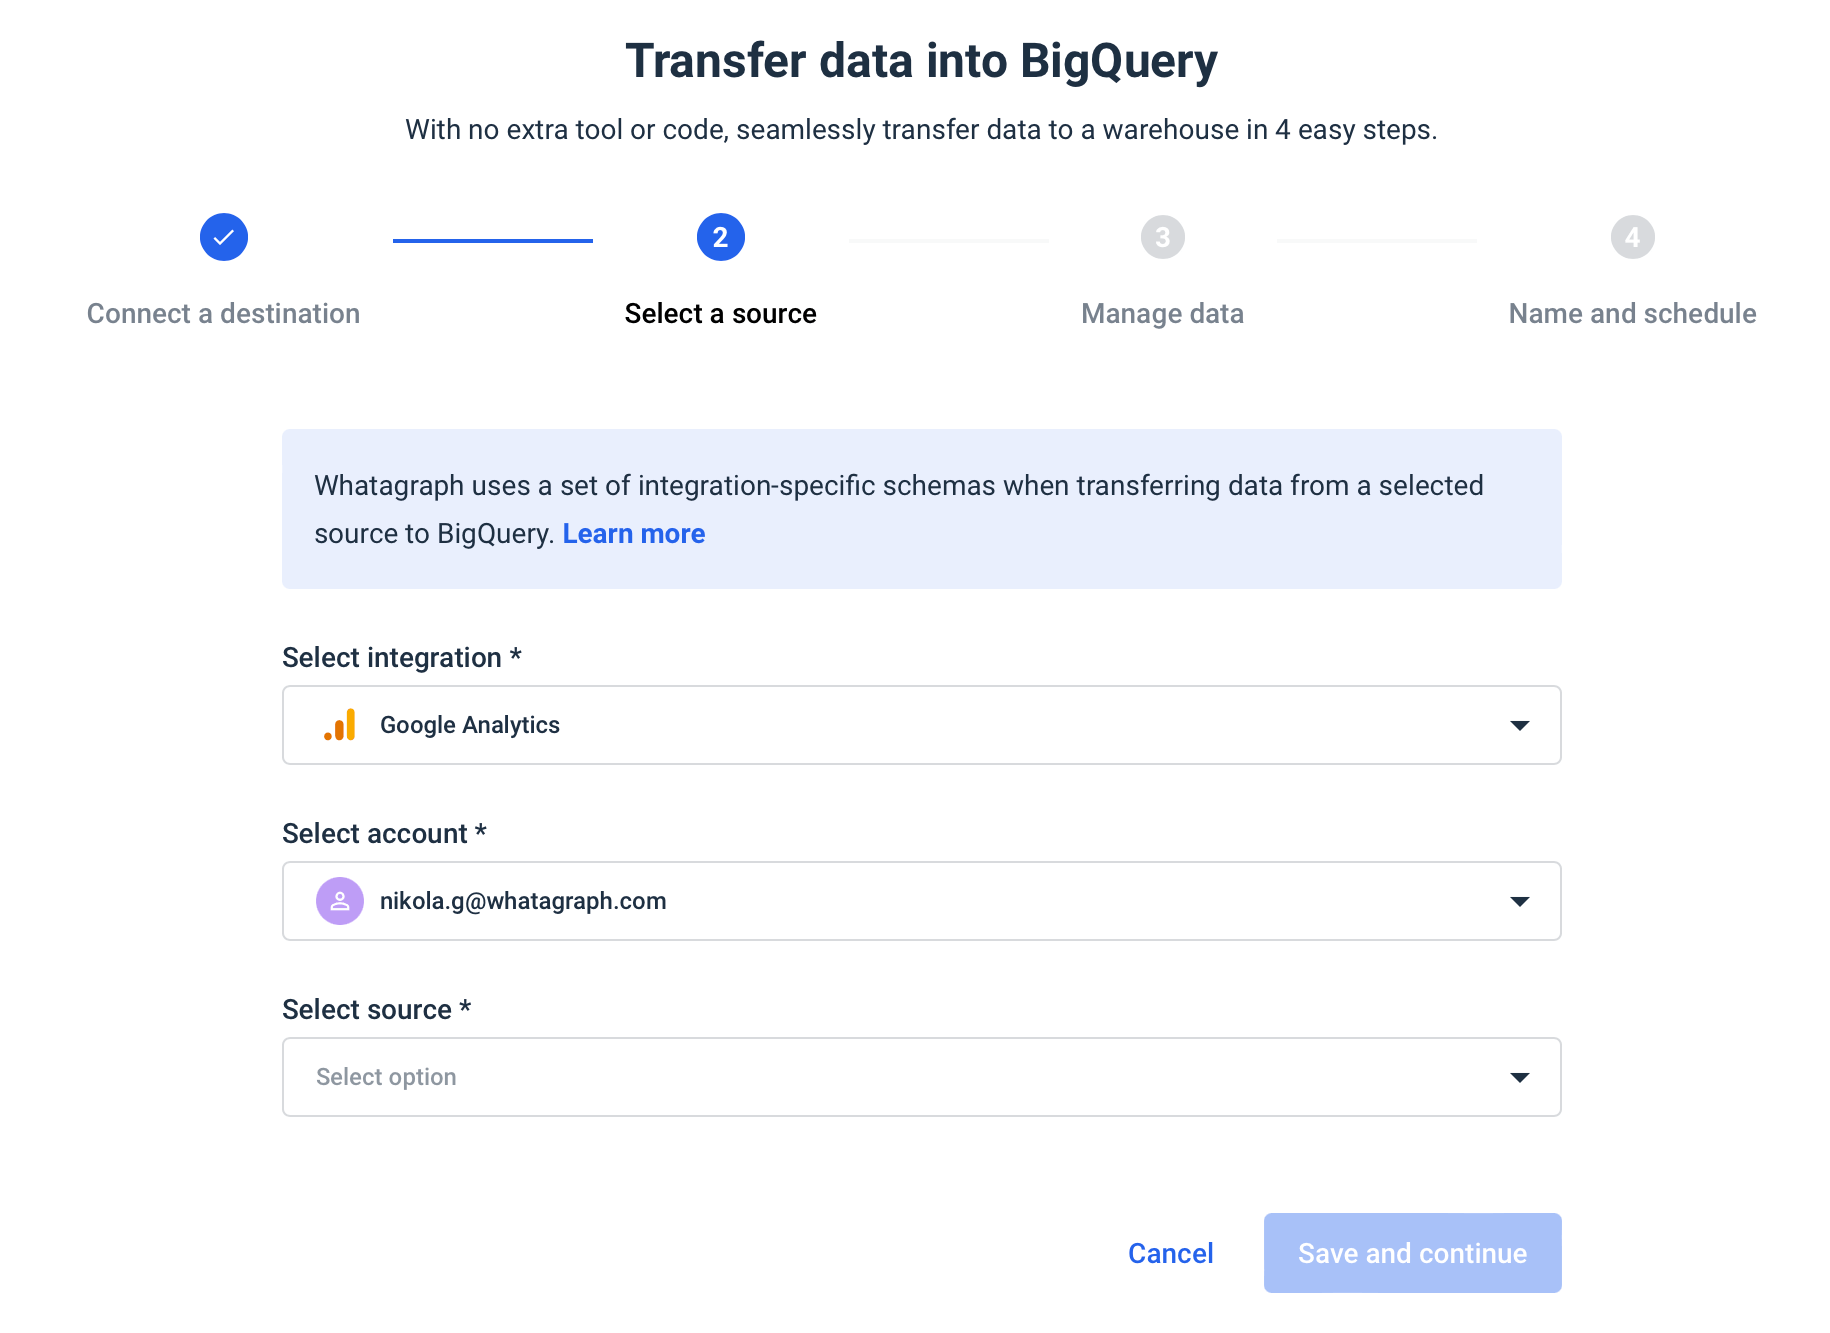
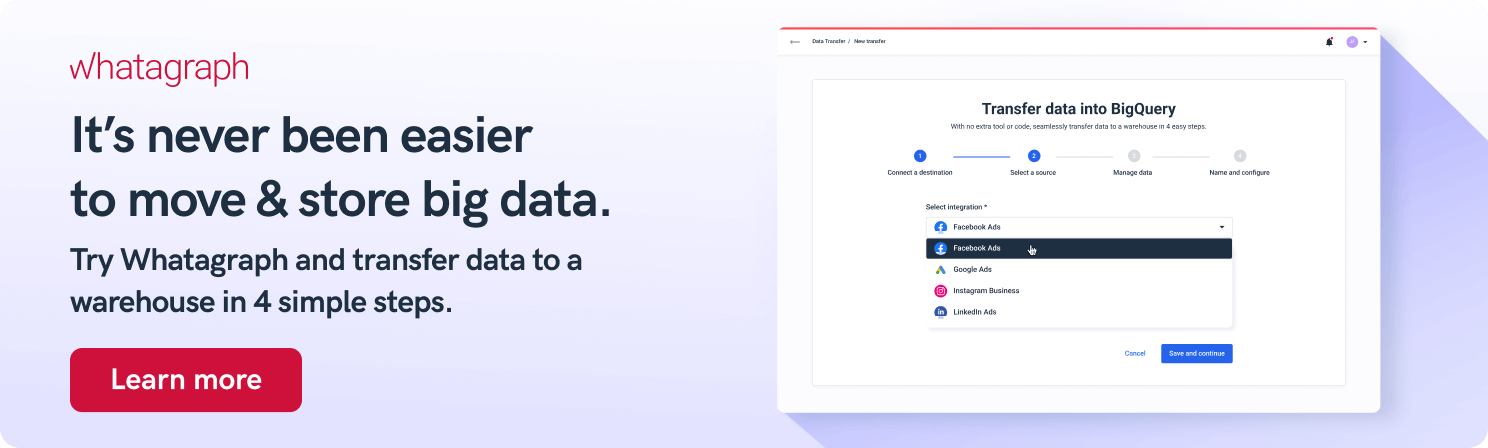
Whatagraph offers a no-code way to move data from multiple sources, including Google Analytics 4 to Google BigQuery so that even a non-technical user can do it without ticketing a data engineer every time.
Our data transfers are simple and safe to run in just four steps:
- Connect the destination
- Choose the integration
- Set the schema
- Schedule the transfer
Once you create a transfer, you can automate the process by scheduling when and how often you want to load your data. This way, your storage refreshes automatically without your intervention.
And when you need to report on Google Analytics 4 data stored in your BigQuery warehouse, just use Whatagraph’s visualization feature to create a GA4 or cross-channel report or dashboard without date range limitations.
FAQ
Is Google Analytics 4 better than Universal Analytics?
Yes, Google Analytics 4 is better than Universal Analytics in many areas, as it offers a lot of new functionalities and improved features. GA4 supports cross-device reporting and helps business owners model future transactions.
Should I upgrade to Google Analytics 4?
Yes, you should upgrade to Google Analytics 4. Especially now that Universal Analytics can stop collecting data any moment, it’s not a question of “should you” but “when”. And the answer is sooner, the better, as your historical data won’t be on your Google Analytics property forever.
Conclusion
We hope this Universal Analytics vs. Google Analytics 4 guide gives you a better understanding of what GA4 is and how it’s different from soon-to-be discontinued Universal Analytics.
The number of new features that give you more granular insights into your data might just sweeten the deal and urge you to migrate to GA4 sooner than later.
The good news is that if you use Whatagraph to report on Universal Analytics data, you can also use it to report on GA4 data — now with more metrics and cross-channel data blending!
Feel free to try our Google Analytics 4 template and see how it can automate your GA4 reporting.
And if you’re still unsure how to safely migrate your data from Universal Analytics to Google Analytics 4, please watch our webinar and hear it from our product experts.
Published on Jul 18 2023
WRITTEN BY
Nikola GemesNikola is a content marketer at Whatagraph with extensive writing experience in SaaS and tech niches. With a background in content management apps and composable architectures, it's his job to educate readers about the latest developments in the world of marketing data, data warehousing, headless architectures, and federated content platforms.