What Are the Limits of the Google Analytics 4 API And How to Overcome Them?
On July 1st, 2023, Universal Analytics will stop processing hits, and whether you like it or not, you will have to get familiar with Google Analytics 4. But it’s not just about website analytics and data — there are other implications when you switch. Most notably, Looker Studio (formerly Google Data Studio) has issues loading data from Google Analytics 4. Here is why that happens and how you can overcome it.

Jan 10 2023●5 min read


Why are there API limitations in Google Analytics 4?
Like most marketers or website owners, you’re probably getting a lot of emails from Google Analytics. Besides the monthly reports, there is another important type of email — a reminder that they are replacing the current version of GA (Universal Analytics) with Google Analytics 4.
Google Analytics 4 is not new by any means. The new analytics setup was launched in October 2020, and businesses could switch from Universal Analytics at any time. All this time, you could use Looker Studio to fetch data and create marketing reports.
Using Google Analytics API instead of the standard Google Analytics user interface gave teams much broader horizons for insights like hierarchical traffic and time-sensitive attribution analysis.
Problems started arising when Google launched its Google Analytics 4 API v1 somewhere in March of 2022. There was always an API quota for each service account, but since November of 2022, Google has been more strict about enforcing it. This is why you may get quota API errors in your Looker Studio dashboard.
Top 5 Google Analytics 4 API errors
What happens is that Looker Studio editors using the native GA4 connector can’t visualize their data. Once the quotas for a specific property ID are reached, Looker studio displays the error message:
1. The underlying data quota limit was exceeded. Please try again later.
Google Analytics, not Looker Studio, sets the quotas, and everyone must fit within the same limitations. There are two quota limits, depending on whether you use a GA4 Standard (free version) or 360 property.
2. Failed to fetch the data from the underlying dataset.
Google Analytics 4 sets quotas on the property level, which means that when you meet the quota, it affects all users. If Looker Studio reports consume all available quotas for a GA4 property or data sources used elsewhere, Looker Studio may fail to fetch new data.
3. Quota Error: The data set has been accessed too many times.
The API request quota has been reached. The API lets you get data in two date ranges in a single JSON request. You must use the Core Reporting API to access the actual report data (like sessions, pageviews, bounce rate, etc.).
4. Exhausted concurrent request Quota, please send fewer requests concurrently.
This error refers to the number of API requests that are made at the same time. For non-paid GA properties, this is limited to 10. If a Looker Studio report contains elements that need more than 10 API calls to refresh or more users make API calls simultaneously, you will start getting this error message.
5. Sorry we have encountered an error and were unable to complete your request.
You need to switch authentication from scram-sha-256 to md5. Not recommended generally, as md5 has more security issues.
How to work around the limits of the Google Analytics 4 API
Looker Studio users are resorting to different solutions to get their data into Looker Studio without hitting the API quota limit. For example, you can use:
- Whatagraph
- BigQuery
- GA4 Premium
- Google’s Extract Data connector
- Google Sheets
Use Whatagraph
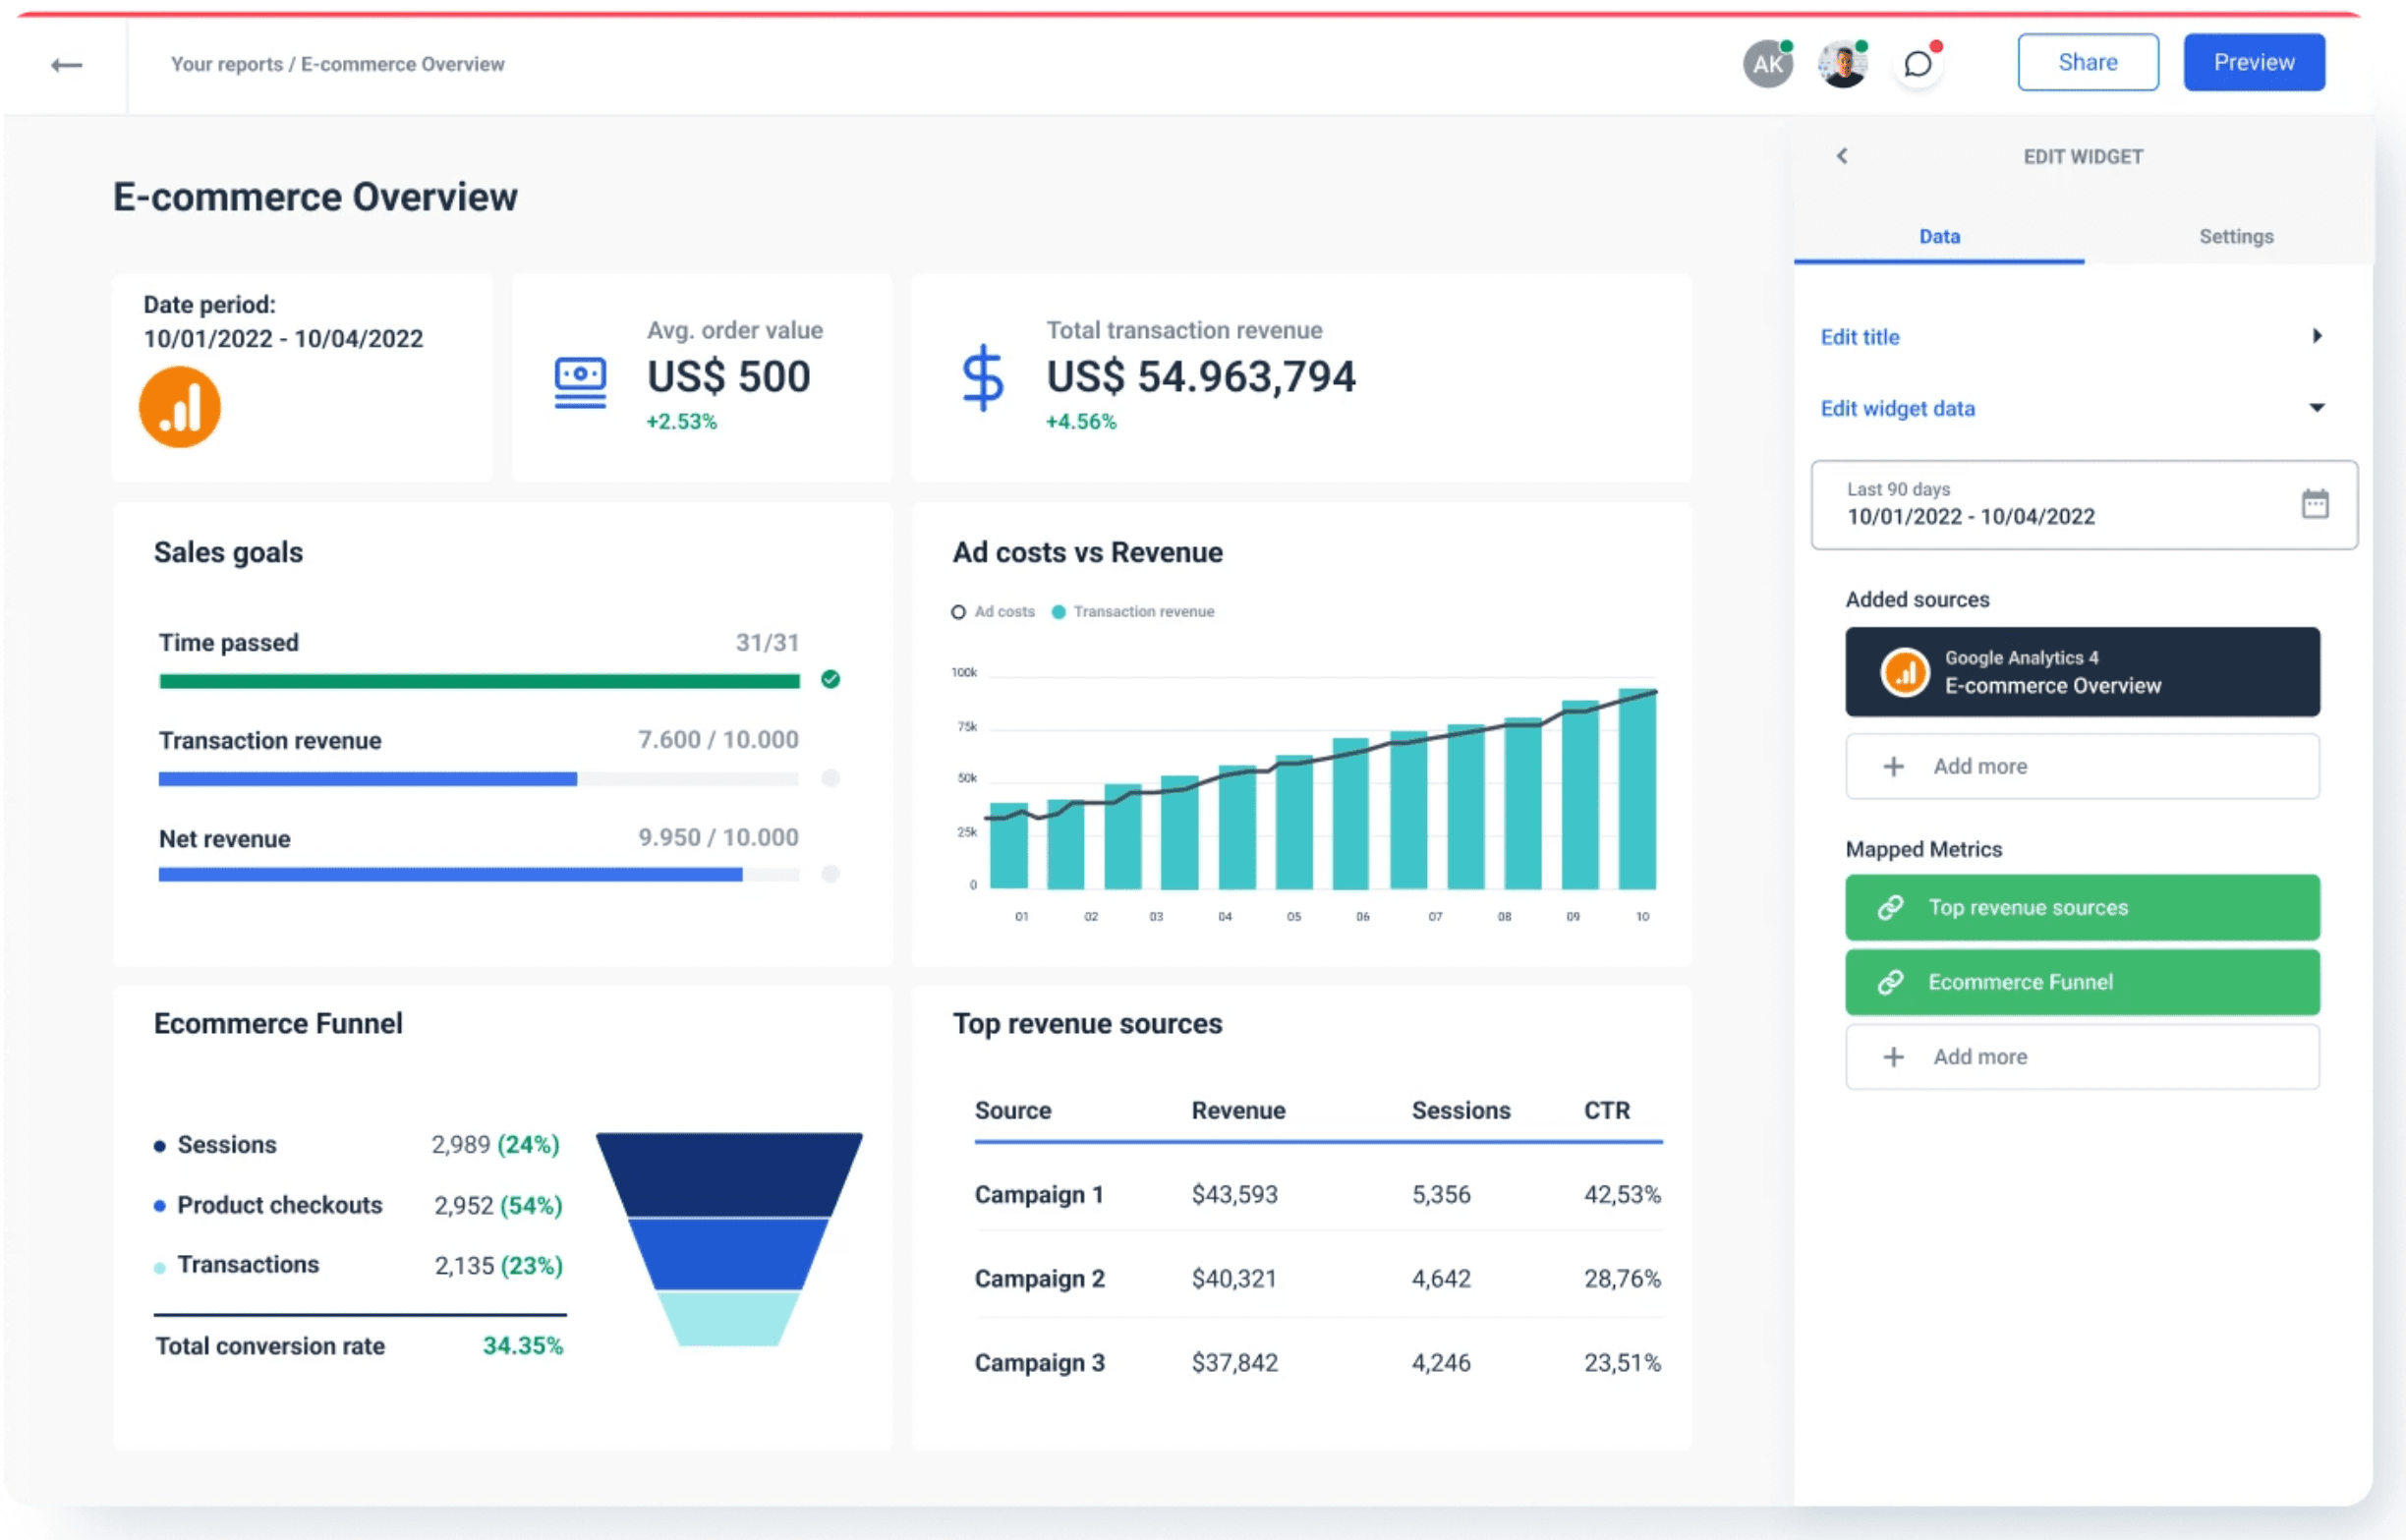
Although the quotes are enforced for the native Google connector, the limitations have not affected third-party pipelines. The easiest way to keep in touch with your Google Analytics 4 data is to use a tool with native Google Analytics integration like Whatagraph.
Whatagraph has a ready-made connection with Google Analytics 4 data API, no additional setup or coding is needed. Just log in and get your data connected to your reports and dashboards.
Whatagraph replicates the data and makes it available to for super-fast automation and reporting. You can clean and prepare your report data before sending it anywhere further. This way complex joins and transformations take place within Whatagraph.
Schedule how often you want to update and update only the most recent data incrementally. In practice, you can have massive tables with even hundreds of millions of rows and not slow down your users or overload your database.
Users can create report templates and connect as many reports as needed in real-time.
If data from Google Analytics alone does not solve your problem, effortlessly combine metrics from multiple data sources, such as Google Ads and Google Search Console, to run reports for cross-channel campaigns from one place.
Load data into BigQuery directly
With the increased dependence on data-driven insights, using a data warehouse to secure your data is the most stable and long-term solution. If you use Looker Studio for reporting, you can also try BigQuery — a data warehouse based on the Google Cloud Platform.
Storing in data warehouses helps you eliminate data silos, lower maintenance needs, and take ownership of your data.
If you are proficient in writing queries, BigQuery is the big leap forward. It will allow you to shift most of the request load from the API to BigQuery.
Note: This method is not something we’d recommend for beginners. It’s quite heavy on the engineering side, and you may need to hire a data scientist. It can also mean additional costs on the BigQuery side if you don’t optimize your queries.
You can also use BigQuery with Whatagraph. This way, you save yourself all the hassle of writing queries and the money you’d pay the data engineer.
Upgrade to GA4 Premium
If your clients are hitting quotas regularly, you may try upgrading your Google Analytics account to Premium. You’ll get almost 10x the quota limits and many other benefits. This solution would not be ideal for most users, but it can be a quick fix to those who can afford it.
And afford is the word because the price of the GA Premium package is about $15k per year.

Google’s Extract Data connector
This option is free to use and the data extractor allows you to choose specific metrics, start date, end date and custom dimensions for your report.
You can get the full list of available dimensions, metadata, and metrics at:
https://developers.google.com/analytics/devguides/reporting/data/v1/api-schema#metrics
In other words, you take a snapshot of your data after which you can schedule the daily, weekly, or monthly update.
A huge perk of this connector is that it promptly accelerates the reporting in your favorite reporting tool such as Whatagraph. Your data loads and responds to filters and other changes much faster.
The problem is that you can’t edit the fields once you’ve selected them in the report. Also, you’re also limited by 100MB of storage, which can last a long time, but definitely not forever.
You can also use Google’s Data Extract connector with Whatagraph. Link it with your existing data sources, select the metrics you want to report, and extract the data. As a result, your Looker Studio report uses stored data instead of live data and makes your reporting much faster.
Google Sheets
You can also use Google Sheets as data storage and feed your data to a reporting tool such as Whatagraph for visualization and reporting.
However, with Google Sheets, you’re limited to 1 million rows. If you handle a lot of data, it’s best to use a data warehouse like BigQuery or a GA-native data connector like Whatagraph.
December 2022 Update: Monitoring Google 4 API Usage Data
On December 20, 2022, Google updated Looker Studio with a new feature for reports that connect to Google Analytics 4 data.
Now you can monitor quota token usage to keep your reports within GA4 quotas.
To activate the feature, go to edit mode and right-click on the report chart or canvas to access the Google Analytics Token Usage dialog. Here you can see both the number of quota tokens spent by report components and the remaining tokens.
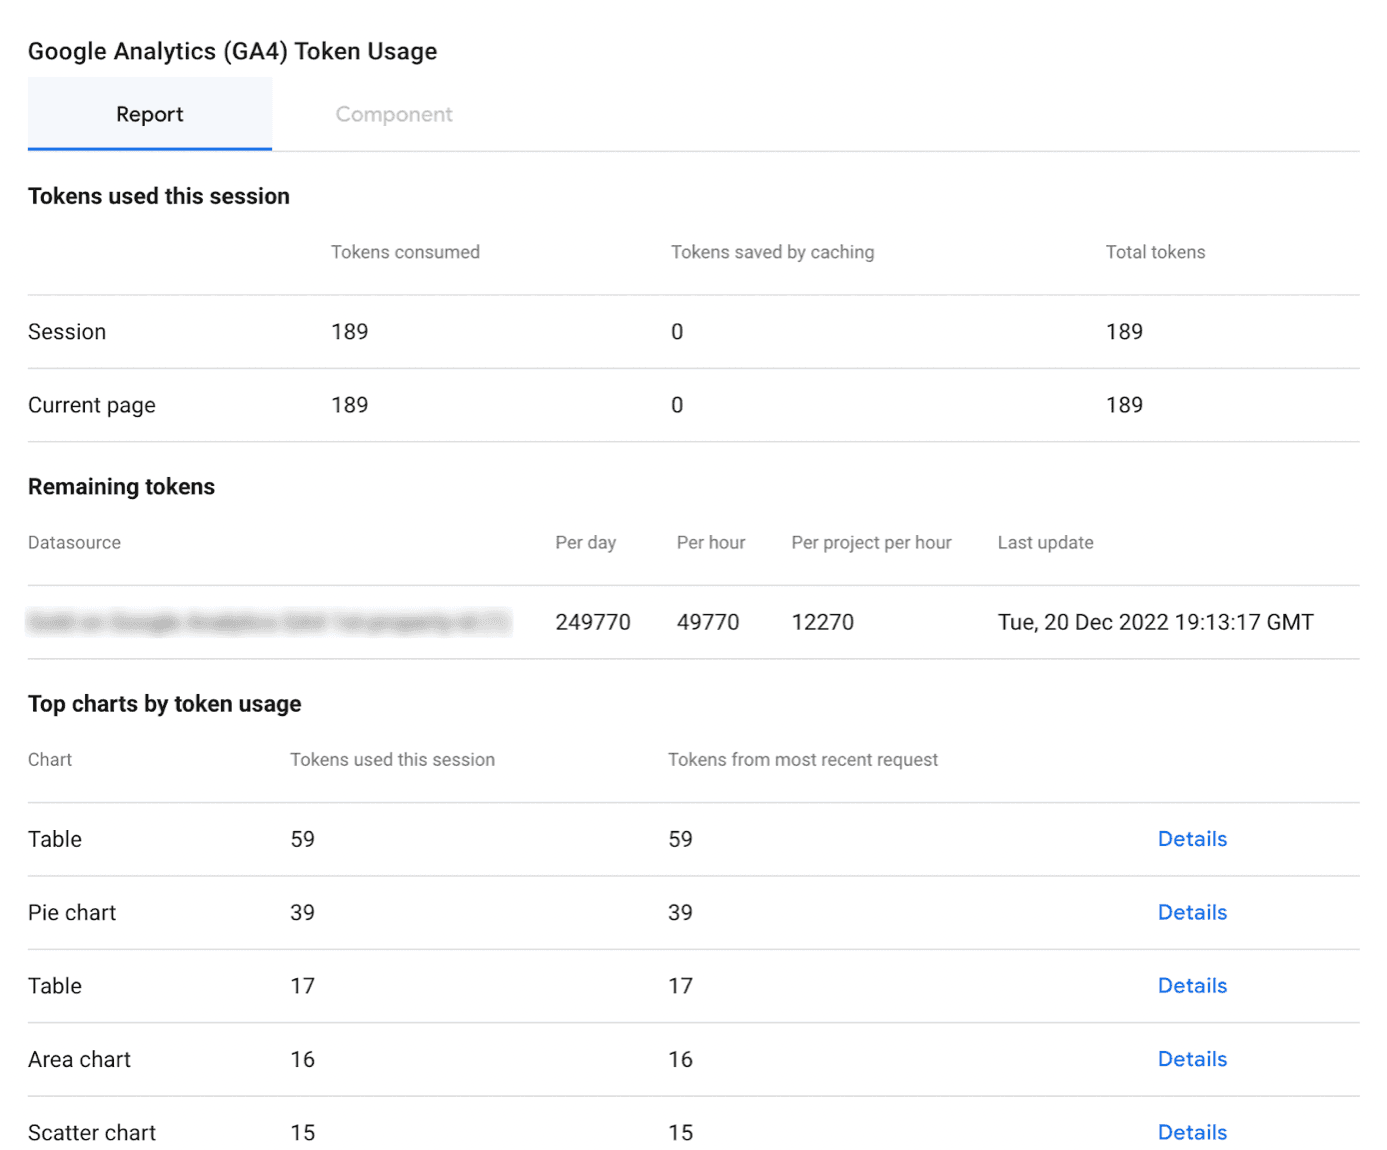
When you combine this data with Google’s recommendations for reducing the amount of data queried from GA4, you can keep your reports within GA4 API quota limits.
Wrapping up
The limited number of Google Analytics 4 API requests has changed the rules. If you have many user permissions and data, you don’t want any tool generating that many queries against your database.
Many systems and apps might use your database even if you have a few active users. In this situation, you can burn through your API quotes faster than the third monkey running up the ramp to Noah’s Ark.
The easiest way to bypass this limitation is to use a data connector like Whatagraph. This way all the querying is done on stored data which doesn’t trigger the reporting API count.
Book a demo call with one of our product specialists and learn how else Whatagraph can help you grow your business.
Published on Jan 10 2023
WRITTEN BY
Nikola GemesNikola is a content marketer at Whatagraph with extensive writing experience in SaaS and tech niches. With a background in content management apps and composable architectures, it's his job to educate readers about the latest developments in the world of marketing data, data warehousing, headless architectures, and federated content platforms.