Automated Access to Google Analytics Data in Google Sheets
If you’re into digital marketing and CEO, you probably know how much information you have to track and evaluate on a regular basis. Luckily, there’s a free Google sheet analytics add-on that will make it easier for you to access, visualize, understand, share and manipulate data from your Google Analytics in your Google Sheet.

Jan 31 2020 ● 5 min read

What Is Google Sheets Analytics Add-On and How to Use It?
If you’re into digital marketing and CEO, you probably know how much information you have to track and evaluate regularly. Luckily, there’s a free Google sheet analytics add-on that will make it easier for you to access, visualize, understand, share, and manipulate data from your Google Analytics in your Google Sheet.
It pulls data from Google Analytics and helps you create reports in Google Sheets and re-run them at any time, which will save you valuable time.
Using the Google Analytics add-on allows you to retrieve important data from your Google Analytics account and use the many great functions on Google Sheets to quickly create easy-to-understand reports whenever you like.
Here’s everything you need to know about this fantastic Google Analytics Spreadsheet add-on, whether you work independently on a team.
Where to Find Google Sheet Analytics Add-On
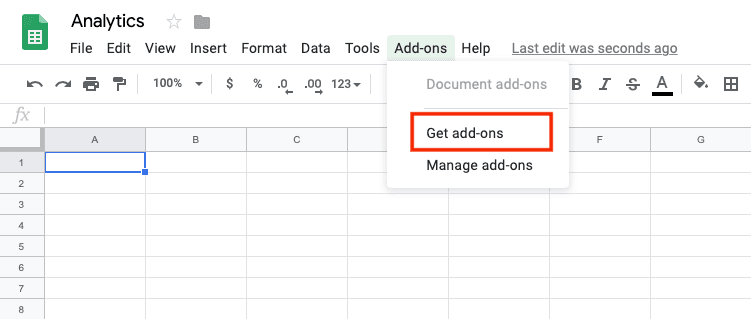
First, open a new Google Sheet and find Add-Ons in the top menu. Once you click it, a drop-down menu will appear and click Get Add-Ons. Notice the search bar in the new window and type in Google Analytics. Press Enter and choose the add-on with the recognizable Google Analytics logo and name. Then, select the +Free button and your add-on will be installed in a minute.
To check if you have successfully installed the add on, go to the Add-Ons section in the top menu and check if there’s a new listing when you click it, called Google Analytics. In case you can’t see the add-on, make sure you refresh the page.
Reasons to Use Google Analytics Add-on as an Extension for Google Sheets
This add-on allows you to combine the power of Google Analytics when it comes to providing insightful data, and the power of Google Sheets when it comes to data manipulation. Here are some of the cool features:
- It quickly pulls data from your Google Analytics account into a spreadsheet.
- It compares data across specific time periods.
- It filters and segments the retrieved data within Google Sheets.
- It lets you choose the most important metrics for your needs and create reports which can be changed or improved at any time.
- Thanks to the many different functions in Google Sheets, you can manipulate all the data retrieved from Google Analytics as needed.
- You can run reports on multiple views and compare the results side by side.
- It gathers different types of information, so you can choose how you want it reported.
- It will save you valuable time.
- You can share the data with your team or clients and let it be worked on by all of them at the same time, thanks to the sharing and privacy features of Google Sheets.
- It lets you schedule your reports to run and update as needed.
How to Create Reports
Once you have successfully installed the add-on in Google Sheets, choose Create a New Report when you click Google Analytics from the drop-down menu of Add-Ons in your Google Sheet.
Then, you’ll notice a sidebar on the right to select the information for your Google Analytics account and choose the metrics and dimensions to query.
Some of the many different metrics you can choose are traffic, bounce rate, pages per visitor, and average time on page. Select the ones you need for your report. The dimensions, on the other hand, let you segment your data based on things like keyword, referral path, source, etc. Choose any dimension or leave the field blank. But, be sure they are compatible with the metrics in your report in order to work.
Also, don’t forget to give your report a name. However, make sure you’re using the same google account to sign in in Google Sheets as the one you use for Google Analytics.
The process until now explains how to create the instructions Google Analytics add-in needs to pull data from your account and run the report.
How to Run the Report?
Choose Run Reports from the drop-down menu of the Add-ons section in the top menu in your Google sheet. This will run the report you’ve previously set up. After several seconds, you’ll get a notification that the report was run, and you’ll see a new tab at the bottom.
If you want to exclude a report only temporarily, you should just delete the name of the report instead of deleting the entire report.
To see the data retrieved from Google Analytics in the report, click the new tab. This is just one report, but you can create as many as you wish. If you create, let’s say, five new reports, you’ll see five new tabs. But, if the report was already run, you won’t get a new tab.
You can always change the report settings on the first report configuration tab by adding and removing metrics, dimensions, dates, and even filters.
Even though all this can seem overwhelming at first, once you try it you’ll see that using the add-on is extremely useful and easy. However, if you run into any problems, you can always use Whatagraph's Google Sheets Integration tool to build cross-channel reports and automatically display data along other sources like Google Analytics.
How to Schedule Reports to Run Automatically?
Go to the Add-ons section in the top menu, choose Google Analytics and click Schedule Reports. Here, you can turn to schedule on and off, as well as choose the time and frequency of your reports. You can schedule your reports to run every day, month, week, or hour.
FAQ:
Can You Do Data Analysis on Google Sheets?
You can ask questions about the information or data in your Google Sheet based on which you will get suggestions for analysis, charts, and formatting.
For example, if the questions are What person has the top score? or Total Sales in October 2018? be sure “person,” “score,” “date,” and “sales” are in your sheet.
If you have a question to ask about your data, go to Explore found at the bottom right in your Google Spreadsheet. Click Edit found at the top-right if you want to ask a question about data on a different spreadsheet and make the changes.
Type in your question under Answers and press Enter. Enter the question in the box under Answers, and click Enter. Click the question under the text box to find out some answers.
What Is Google Sheet Used For?
This online app is the biggest competitor to Microsoft Excel created by Google. It includes almost all spreadsheet functions like Excel. It allows you to use it anywhere, so you can add or change an existing file online together with other people in real-time.
Updates include Explore, a feature using machine learning that suggests answers based on natural language questions. Now, you can use this web-based app to gather and organize data from your Google Analytics account and manipulate it with the many different functions available, thanks to the Google Analytics add-on.
What to Do If My Scheduled Reports Didn’t Run on Time?
Make sure there’s at least a one-hour buffer between the time you create the schedule and the time it’s supposed to run. Otherwise, your report may be postponed to the next interval.
Can I Schedule Different Reports at Different Intervals?
You need to use multiple sheets if you want to set different schedules for different reports.
Conclusion
This amazing Add-on is an extension for Google Spreadsheets that lets you create and run custom reports within Google Sheets. The extension works by connecting your Google Analytics account to your Google Sheets, filtering the data you want to retrieve from Analytics, and gathering it into a clear format that’s ready for reporting. You can schedule your reports to run automatically, as well as set their frequency.
This fantastic tool is free to use and a true time-saver for any digital marketer. Once you learn how to use it, you’ll see how much it can simplify your work and life.
Published on Jan 31 2020
WRITTEN BY
Gintaras BaltusevičiusGintaras is an experienced marketing professional who is always eager to explore the most up-to-date issues in data marketing. Having worked as an SEO manager at several companies, he's a valuable addition to the Whatagraph writers' pool.