Google Sheets MCP: Connect Google Sheets to Claude and trust the answers
You can connect Google Sheets to Claude or any other AI tool with a Google Sheets MCP - a connector that lets AI tools like Claude read, and usually edit, your spreadsheets in plain language, with no CSV exports and no code.
But the harder question is - can you trust the answers Claude gives you?
In this article we’ll show you not only how to connect Google Sheets to Claude, but also how to get answers you can actually stand behind.

Aug 07 2026●12 min read


Your lead list lives in a Google Sheet. So does the budget plan, the retainer log, along with Google Ads, Google Search Console, and GA4 data.
You want to analyze all of this with Claude, but instead of uploading them one by one, you can use a Google Sheets MCP.
But not all MCPs are created equal.
Some you'll need to spend time and effort building yourself, and others you can just plug-and-go, and you'll always get accurate answers from Claude.
This article covers
- the three types of Google Sheets MCP and what each is good for
- two ways to connect Google Sheets to Claude
- how to set your data up so the answers hold up
- a prompt library for querying your sheet alongside your marketing channels
TL;DR
- A Google Sheets MCP server is a connector that lets Claude and other AI tools read, and usually edit, your spreadsheets in plain language.
- There are three types: single-platform Sheets servers, stitched connector MCPs, and an MCP sitting on a governed data layer. They solve different problems.
- Spreadsheets are the least governed data your team owns, so the type you pick decides whether the numbers hold up.
- Want Claude to edit cells, add rows, or build a spreadsheet? Use a dedicated Google Sheets MCP server. Google has an official one and there are open-source alternatives.
- Want to ask questions across your sheet and your ad channels together? Connect the sheet as a source in Whatagraph and query it through Whatagraph's MCP, which reads and writes.
- Either way, sort out your date column, your currencies, and your metric definitions before you connect. Full walkthrough and prompt library below.
What is a Google Sheets MCP server exactly?
A Google Sheets MCP server is a connector that gives an AI tool like Claude direct access to your spreadsheets. You skip the CSV export and the copy-paste, and just ask questions about the live sheet in plain language.
Most of them write as well as read. Update a cell, append a row, set a formula, insert a column, create a whole new spreadsheet.
MCP stands for Model Context Protocol, an open standard Anthropic introduced in late 2024. It's what lets AI agents talk to outside systems without a custom integration for each one.
Arturas Lazejevas, Whatagraph's CTPO, puts it in plain terms:
Think of MCP as a door that LLMs like Claude or ChatGPT can use to access any of your systems that you connect (through the MCP).
So how is that different from the Google Sheets API, which has existed for years?
Fluidity. Arturas again:
An API is a robot on a factory floor programmed to build a box. It works great - until the hammer changes. Then it stops and needs reprogramming. MCP is fluid and more like a human. A bit slower, but it adapts on the fly.
An API needs you to know the exact parameters before you ask. An MCP server describes its own tools, and the model works out which one to call from your question.
3 types of Google Sheets MCPs
Not all MCPs are created equal. Before you pick one, a few things are worth asking:
- Is it reading raw cells, or a modeled version of your data?
- Can it answer a question that spans the sheet and your ad platforms at once?
- Who converts the currencies and decides what a conversion is, you or the model?
- Do you get the same number on Monday that you got on Friday?
The answers depend entirely on which type you're using. There are three in the market right now.
| Single platform Sheets MCP | Stitched connector MCPs | MCP over a governed data layer (Whatagraph) | |
|---|---|---|---|
| What it is | A protocol wrapper over the Google Sheets API. Google's official server, or an open-source one | Several platform wrappers side by side, your sheet among them. Nothing shared between them | A protocol over a unified data model. Your sheet becomes a governed source next to your channels |
| Reads raw cells or modeled data | Raw cells | Raw cells and raw API output | Modeled: metrics defined, currencies converted, naming normalized at ingest |
| Cross-channel answer | Not its job. One spreadsheet at a time | Claude stitches at query time. The join drifts | Pre-blended in the data model |
| Same question, same answer | Within that sheet, yes | No. Depends on the prompt | Yes. Metrics are defined once |
| What it can change | The spreadsheet itself: cells, formulas, rows, columns | Read-only in most cases | Your reporting layer: custom metrics, dimensions, tags, goals, blends, widgets, whole reports |
| Where it fits | Spreadsheet mechanics | Quick answers when close enough is fine | The reporting itself, from the definitions up |
Whatagraph's MCP is the third one. As Arturas explains:
Whatagraph doesn't query separate connectors like Facebook, Google Analytics, and Google Ads on the fly and have Claude reason about it. We unify all of that data as it comes in. The MCP is just the query layer on top.
Your spreadsheet gets treated the same way. It comes in, it gets mapped to metrics and dimensions, and by the time Claude asks a question the reconciliation has already happened.
Which one you want comes down to what you're actually trying to change: the spreadsheet, or the reporting that spreadsheet feeds.
How to connect Google Sheets to Claude [2 options]
There are two routes. One points Claude at the spreadsheet. The other points Claude at a governed layer that your spreadsheet is part of.
Option 1: build it yourself with a Google Sheets MCP server
Google has an official Google Sheets MCP server, currently in Developer Preview. It's remote, so there's nothing to host, and it ships six tools: get_values, get_spreadsheet, update_spreadsheet, update_values, update_formulas, and insert_dimension.
Getting it running takes a Google Cloud project, the Sheets API and the Sheets MCP API enabled, an OAuth consent screen, four scopes added by hand, and your own OAuth 2.0 client ID and secret pasted into Claude. You'll also need a paid Claude plan for custom connectors.
Then there's the open-source route. xing5/mcp-google-sheets is the most widely used Google Sheets MCP server, running through uvx with a Google service account, and it goes further than Google's: create a spreadsheet, add and delete sheets, copy a sheet, append values, format cells, set data validation, all addressed with a spreadsheet ID and A1 notation.
Worth knowing before you install it: by default it exposes 19 tools, which the maintainer notes eats roughly 13,000 tokens of your context window before you've typed anything. There's a flag to load only the tools you need.
Both routes work in Claude Desktop, Claude Code, Cursor, and anything else that speaks MCP.
If your job is spreadsheet mechanics, this is the route. Reformat a client tracker, append last week's rows, rebuild a formula column, spin up a new sheet from a pile of data. Claude is good at it and the setup is a one-time cost.
The ceiling shows up the moment the question stops being about the spreadsheet.
These servers hand Claude the raw data. Every time you ask something, it re-derives what your columns mean, which rows are totals, whether "Spend" and "Cost" are the same thing, and what to do with the row where someone typed "n/a".
And they only see the sheet. Ask how the plan compares to what actually delivered and Claude has half the answer, because the other half is in Google Ads.
→ The real cost shows up in maintaining this system, not the setup.
One Sheets server on its own is barely any maintenance. The trouble starts when it's one of several, because a cross-channel question means running a Sheets server next to a Google Ads server, a Meta server, and whatever else, then keeping all of them authorized, current, and in agreement about what a conversion is.
Laurynas Arminas, Whatagraph's Product Manager, has watched this pattern play out with several marketing teams:
It's easy to get something 80% done and think you're there. But then you realize how hard that remaining 20% is. Once you're working with seven different channels, seven different places pulling data from MCPs, things start getting confusing. Every time you add a client or a channel, you need to update everything - and things slip through the cracks.
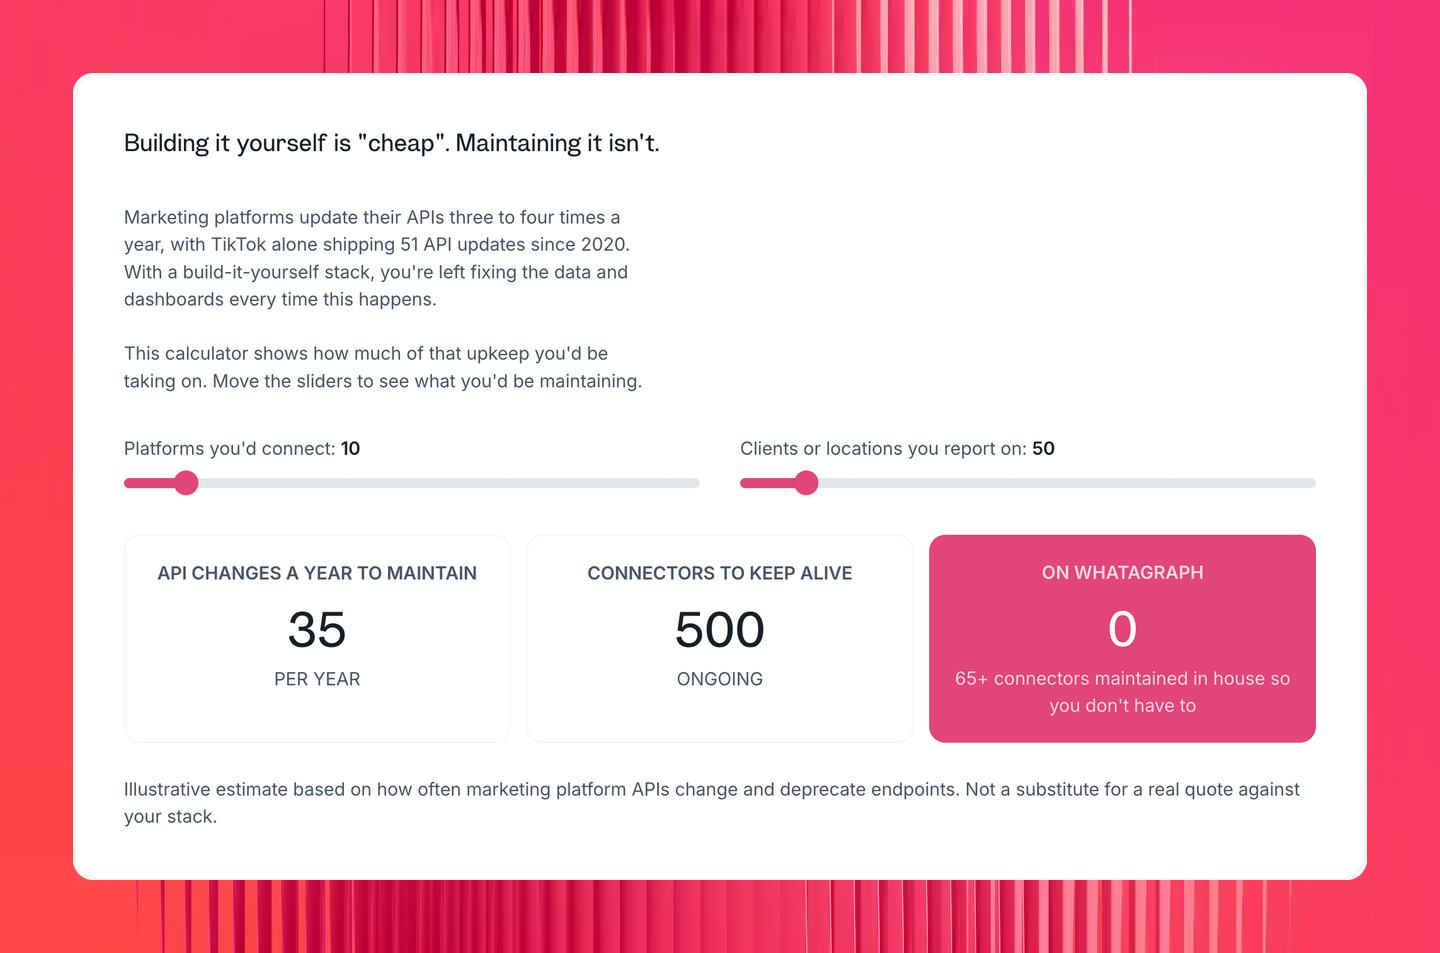
That last 20% is the part nobody scopes. Marketing platforms change their APIs three or four times a year, and TikTok alone has shipped 51 Ads API updates since 2020.
At two clients and two channels, that's an afternoon here and there. At ten clients and five channels, it's a standing job that eats into the one you were hired to do.
If you want to see what that actually adds up to, we built a calculator on our alternatives page for exactly this. Set the sliders to your number of platforms and clients, and it shows how many API changes and connector authorizations a build-it-yourself stack leaves you maintaining every year.
Option 2: connect Google Sheets to Claude with Whatagraph's MCP
The other route treats your spreadsheet as what it usually is: one source among the ten or twelve your reporting already runs on.
You connect the sheet in Whatagraph the same way you'd connect Google Ads or GA4, and it lands in the same governed layer, with the same metric definitions, currency conversion, and naming rules applied to it. Then you connect Whatagraph's MCP to Claude and query all of it together.
This matters more for spreadsheets than for any other source, because of what tends to live in them.
The margin per client. The retainer value. The agency fee that turns platform ROAS into something closer to real profitability. The conversion definition three regions each interpreted differently.
Talk to enough performance teams and the same thing comes up: the custom metric definitions live in a spreadsheet and get rebuilt per client, instead of being defined once and reused.
That's the data your channels can't give you, and it's exactly what a cross-channel answer needs.
So the useful version isn't "Claude can read my budget tab." It's Claude comparing the plan in your sheet against live spend across Google Ads, Meta, and LinkedIn, using your ROAS formula, in your reporting currency.
Here's a full video breakdown that walks through how Whatagraph standardizes data for AI tools like Claude:
Whatagraph's MCP writes too. This is the part people assume they'll have to do by hand afterwards.
Claude can create custom metrics with your own formulas, build custom dimensions that normalize inconsistent campaign naming, tag sources by client or region, set goals, convert currencies, and build widgets, tabs, and entire reports.
You describe the definition once in plain language and it goes into the governed layer, where every report, dashboard, and future Claude answer inherits it.
Compare that to the same instruction pointed at a raw Sheets server, where Claude will happily write a new column into your spreadsheet and nothing downstream knows it exists.
Even better - you no longer need to context-switch to Claude anymore.
Whatagraph is opening early access to IQ Agents, an always-on team of agents that does this work on a schedule rather than on a prompt. It helps you:
✅ Onboard a new client or account (with sources connected and reports created) in less than an hour.
✅ Standardize dimensions automatically across all your channels and sources.
✅ Build custom metrics according to your business logic.
✅ Create overviews of your entire portfolio broken down by client, location, or whichever custom tag that makes sense to you.
✅ Catch anomalies and fix them before your clients see them.
And that’s not all. Whatever you’ve been doing manually so far for reporting, agents can do on your behalf.
They're built to run on the same governed foundation, so an agent can't quietly invent its own version of a number your client already trusts. Access opens by cohort, and you can request early access to get in before public launch.
Which option fits which job
| If you want to... | Use |
|---|---|
| Reformat, append rows, or build a spreadsheet from scratch | A Google Sheets MCP server (Option 1) |
| Ask questions about one standalone sheet | Either. A Sheets MCP server is quicker to set up |
| Compare what's in your sheet against live channel performance | Whatagraph MCP (Option 2) |
| Get the same number on Monday and Friday, and in the client report | Whatagraph MCP |
| Define a metric once and have every report and AI answer use it | Whatagraph MCP |
| Have it maintained without you prompting for it | IQ Agents (early access) |
Most teams end up wanting both, and they don't conflict. Keep a Sheets server for spreadsheet work, and put the reporting on a layer that was built to be queried.
Here's how to set the second one up.
8 steps to connect Google Sheets to Claude with Whatagraph MCP
Setup takes a few minutes once your sheet is in decent shape. Most of the work is in the sheet itself, not the connection.
Before you start, have three things ready:
- a Whatagraph account with your sources connected (start a 14-day free trial)
- a Claude account, on claude.ai or Claude Desktop
- Owner or Full Admin access to your Claude workspace
If you're on a team plan and the option to add a custom connector isn't there, whoever manages the account will need to do this part.
A trick: log into Whatagraph in the same browser you're using for Claude. It turns the authorization step into one click instead of a separate login.
Step 1: Get your sheet into a shape that can be read
First, make sure your Google Sheets is set up correctly:
- A date column, formatted
YYYY-MM-DD, in the first position. This is how the date range gets recognized. Mixed date formats across tabs are the single most common reason a sheet connects fine and then shows the wrong numbers. - At least one column of purely numeric values. That's what gets read as a metric. One stray "n/a" or "TBC" in a number column and the whole column flips to a dimension.
- Metrics in their own columns, running across, not stacked down the page. Vertical layouts get read as dimensions.
- Percentages and currency formatted in the sheet first, using the FORMAT function, before you connect.
You can download a sample Google Sheet template with the right formatting here.
Text columns become dimensions and number columns become metrics automatically. If one gets read wrong, append wg:dimension or wg:metric to the column name and it'll behave.
Step 2: Connect Google Sheets as a source in Whatagraph
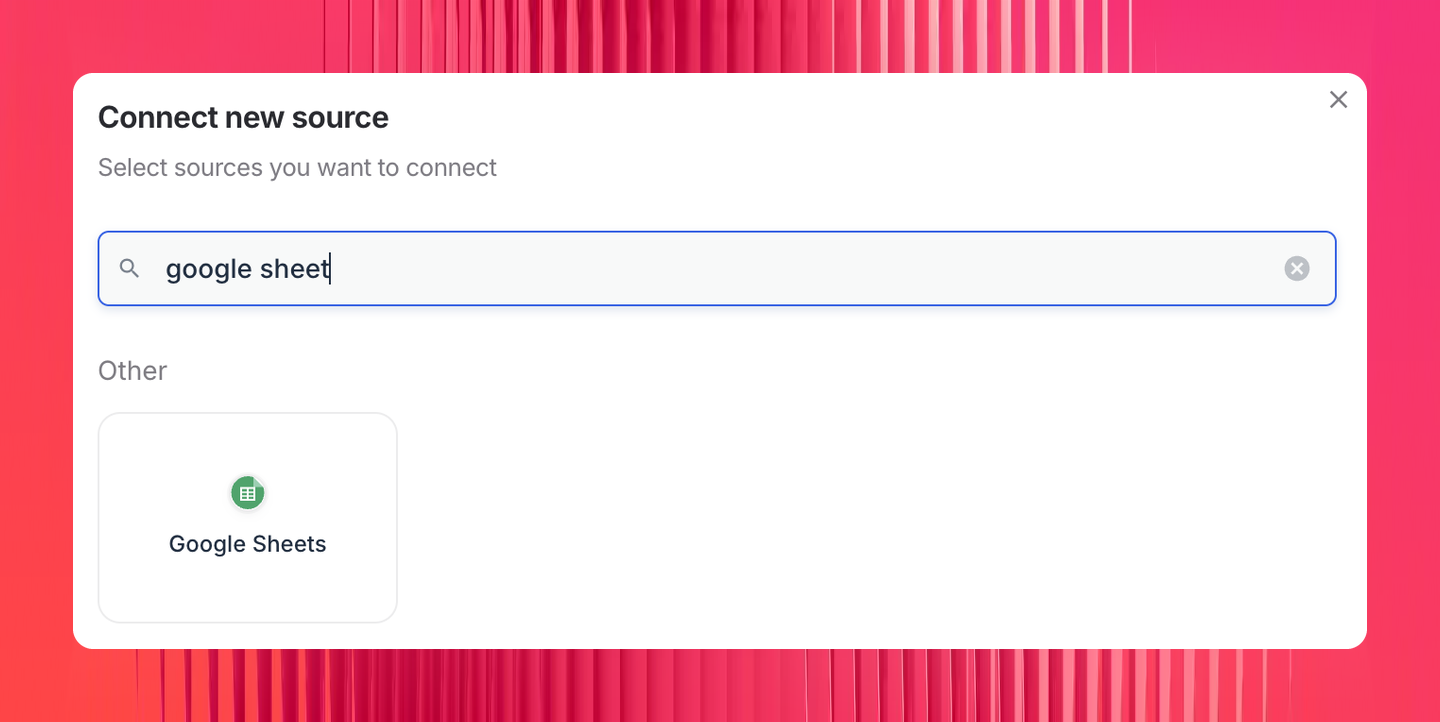
In the Data space, go to Sources, click Connect new source, and find Google Sheets in the list. You'll be sent to Google to authorize, and the new source appears when you come back.
Connect the ad platforms, analytics, and CRM sources you want to ask about alongside it. The sheet on its own is only half the point.
Sources refresh hourly. If you've just changed the sheet and want it now, refresh the report manually.
Step 3: Set up your governed data layer
This is the step people skip and then wonder why the answers feel off. As Arturas puts it:
My suggestion would be to really embed your business logic into Whatagraph first, so that Claude doesn't need to reason about it. It doesn't need to figure that stuff out every time.
Here's what to set up before you start querying:
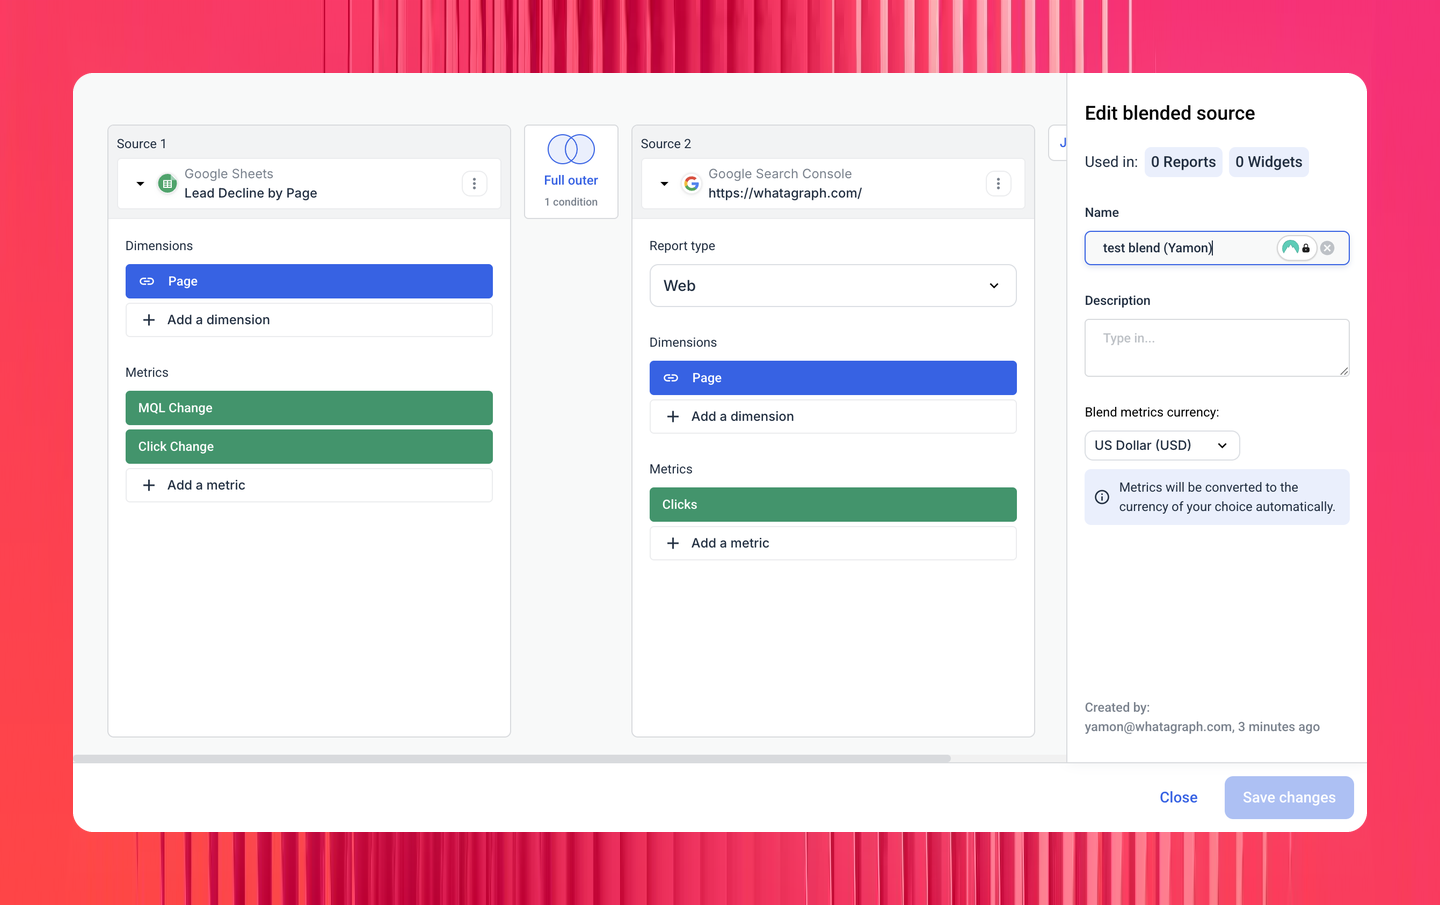
- Blend the sheet with your channels. Join your Google Sheets to any platform you want, like Google Search Console, Google Ads, Hubspot, e.t.c. on shared keys like date, page, or campaign name.
Define your custom metrics. Build any custom metric according to your business logic like contribution margin, marketing efficiency ratio, conversion rate, or a ROAS that accounts for fees. Claude will use that definition instead of platform-reported ROAS every time.
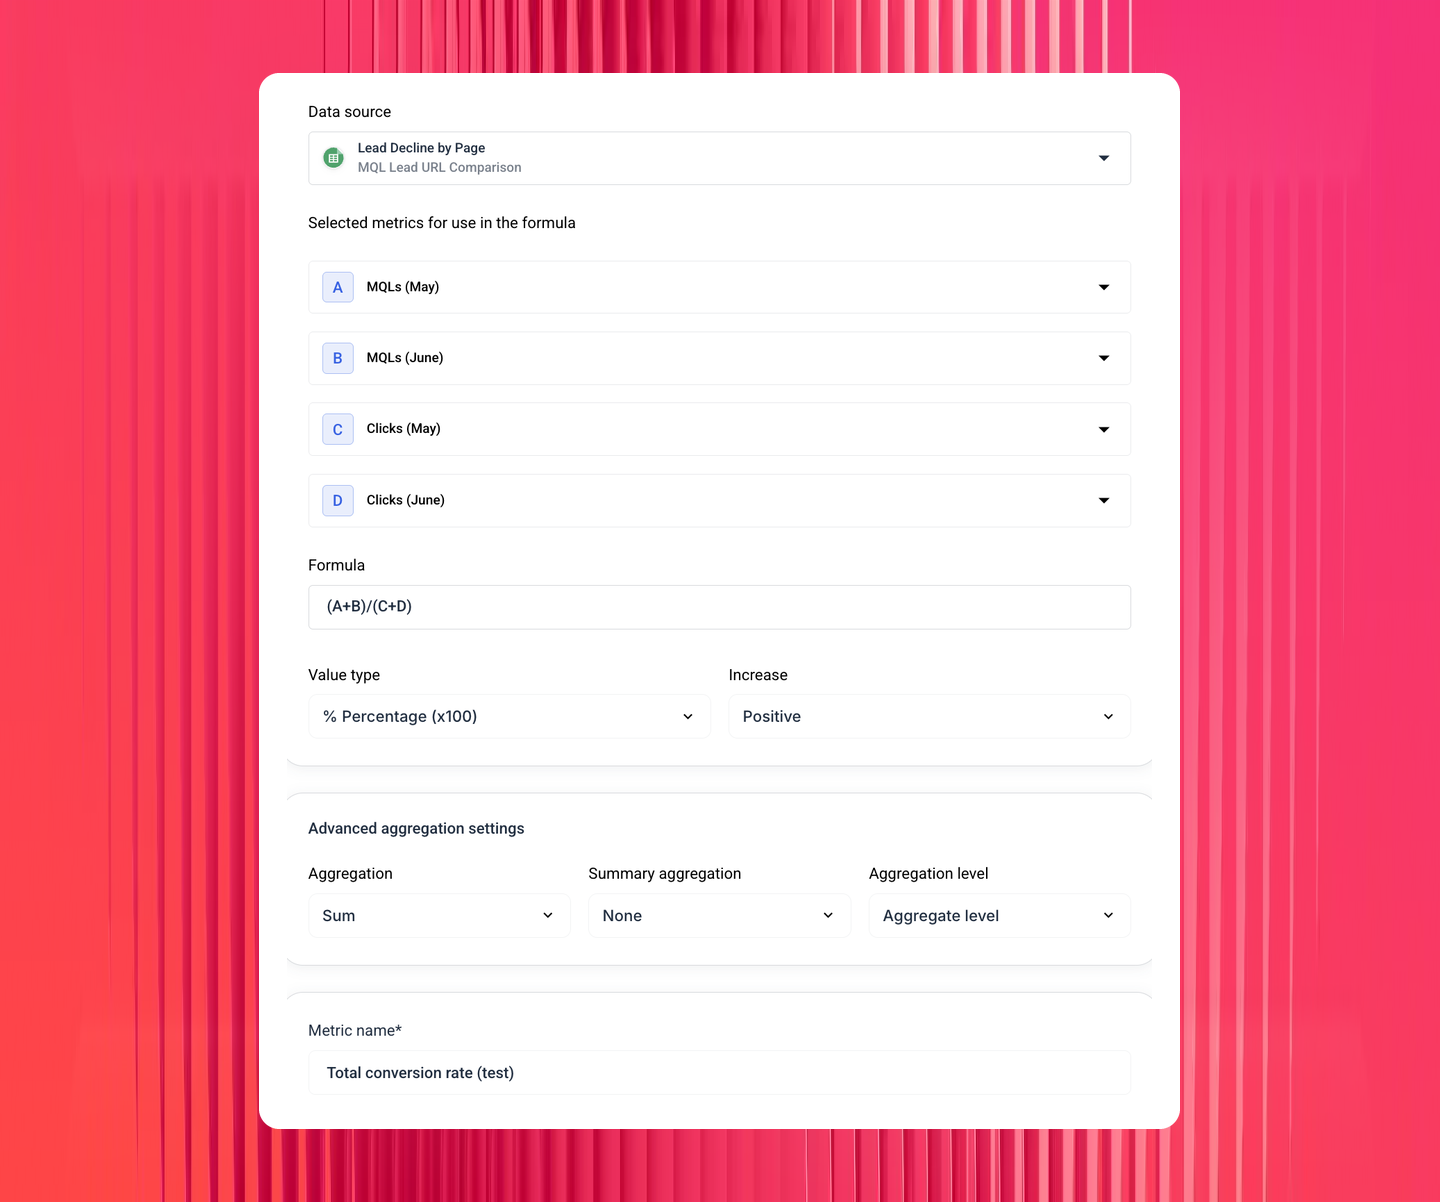
For instance, I built a custom conversion rate metric based on my spreadsheet data that combines MQLs and clicks for May and June, and divides the two, and turns it into a percentage.
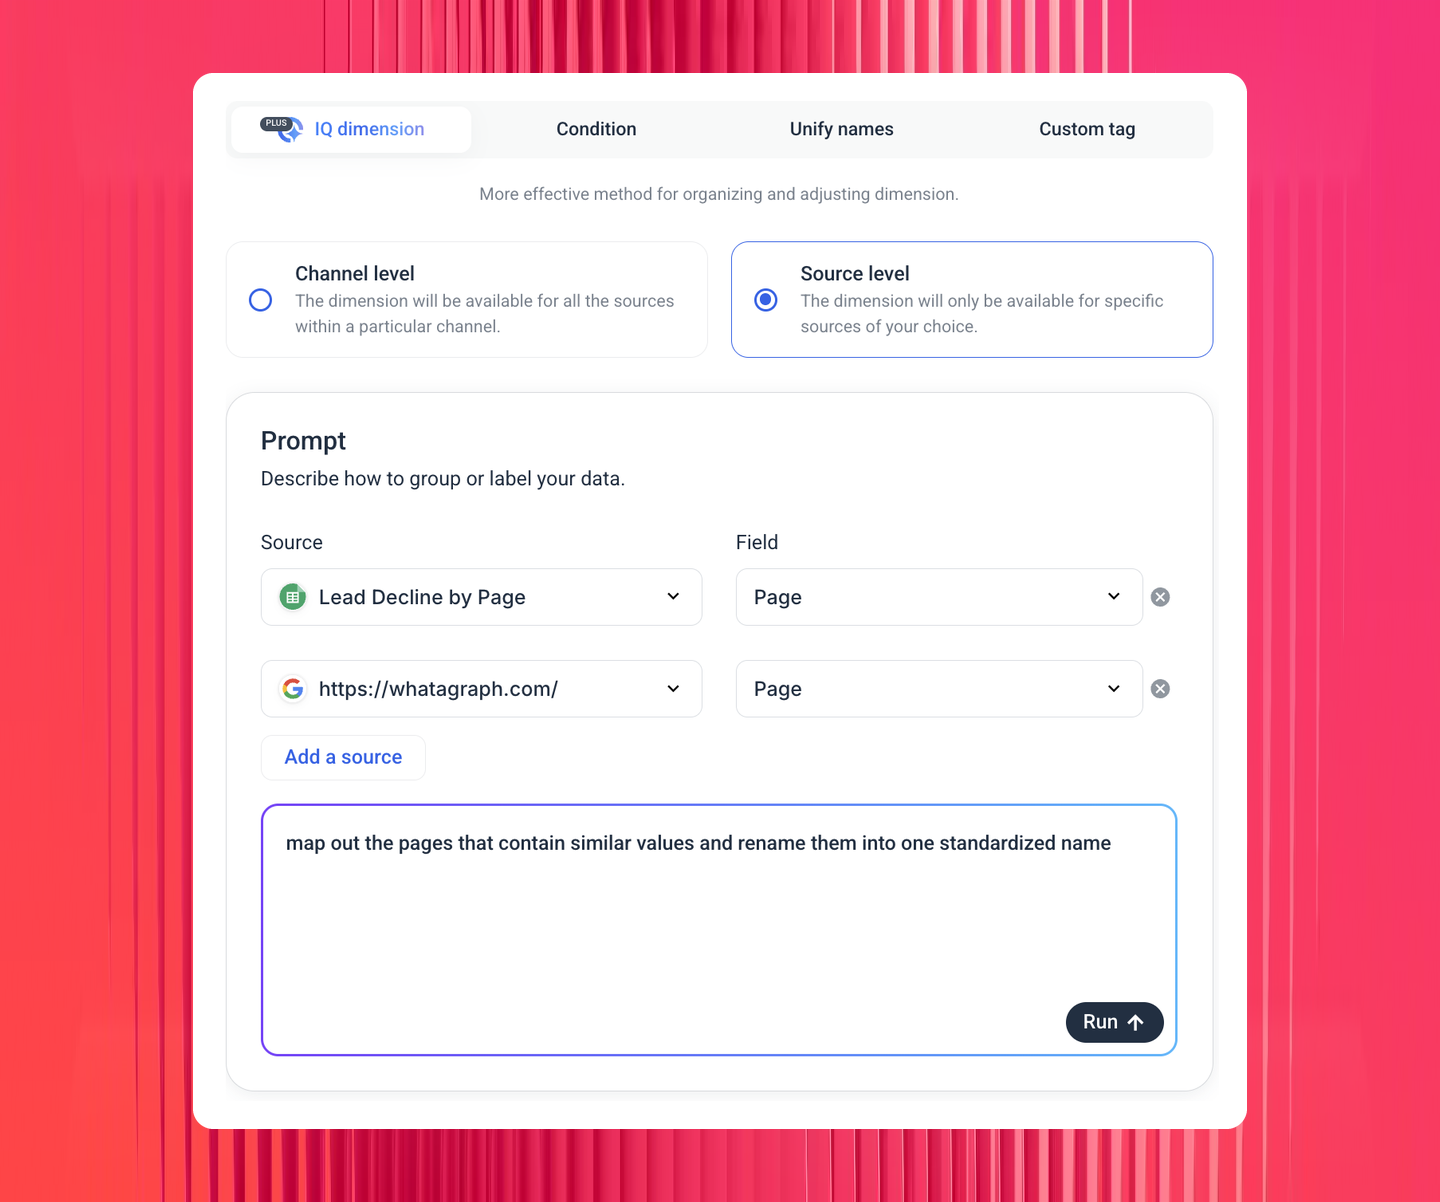
Define custom dimensions. Your sheet says one name, Google Search Console calls it another, Google Ads calls it another. You can normalize all three to one standardized name automatically using Whatagraph IQ.
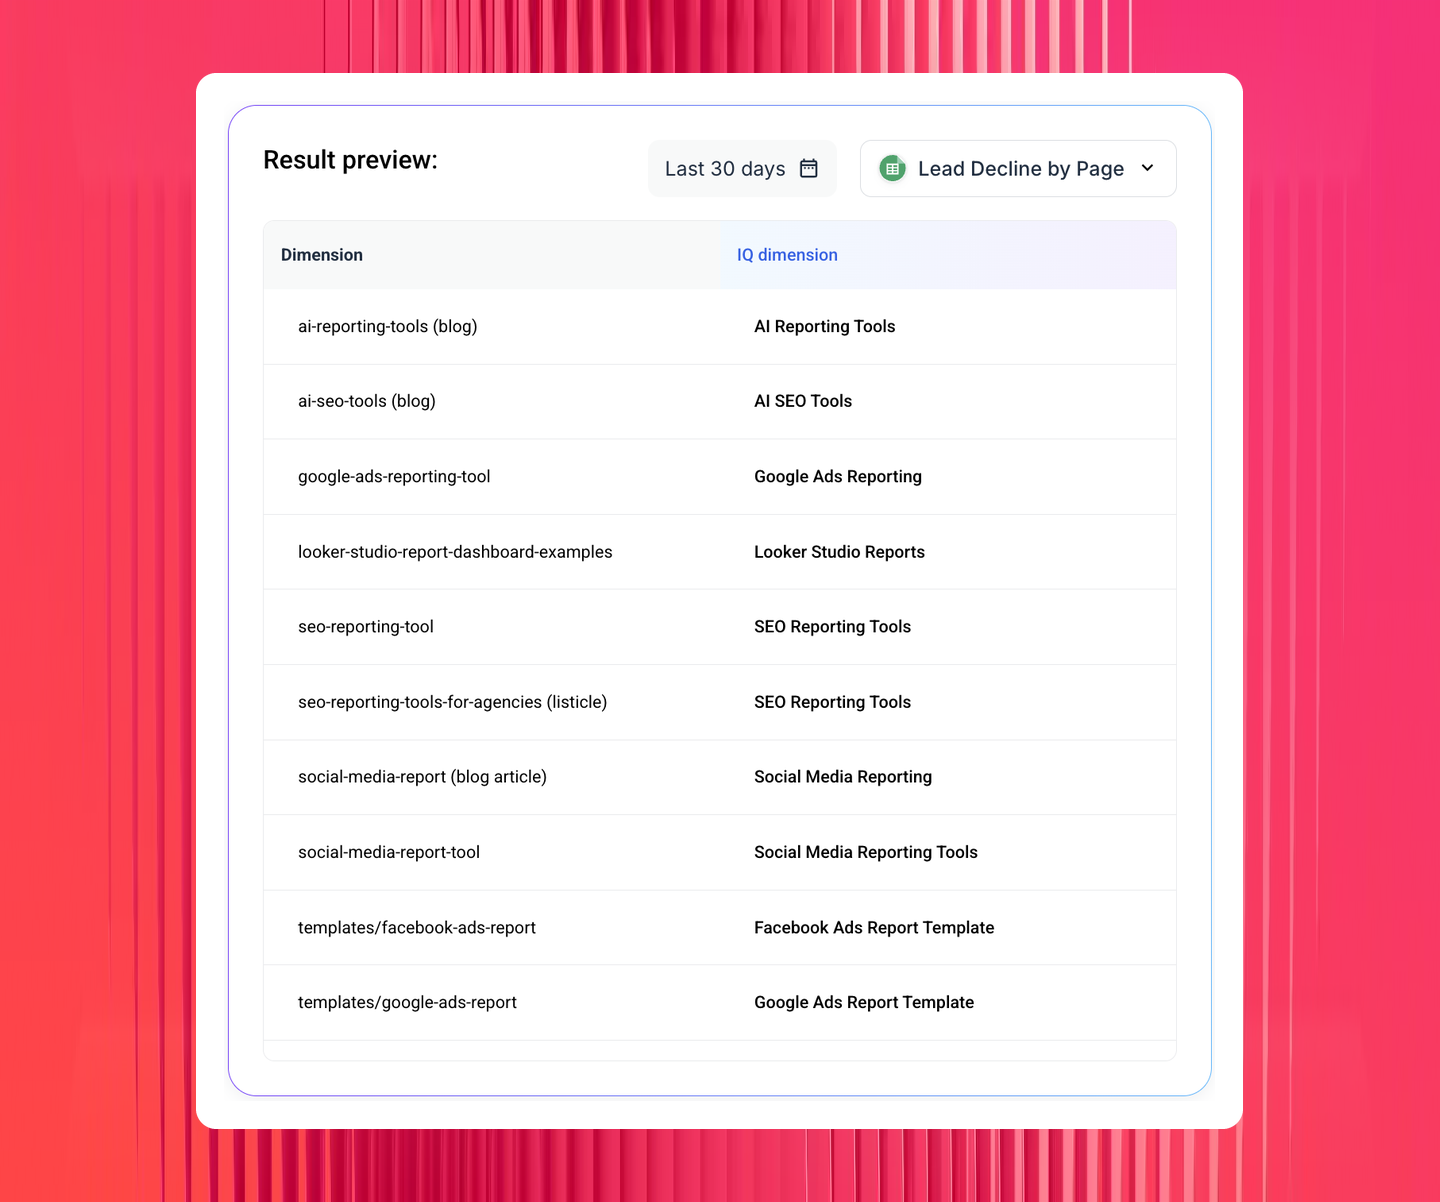
In this example, I wanted to map inconsistent "Page" dimension names in my Google Sheets and Google Search Console. So I just asked Whatagraph IQ to do it for me.
And here's the result, literally done in seconds:
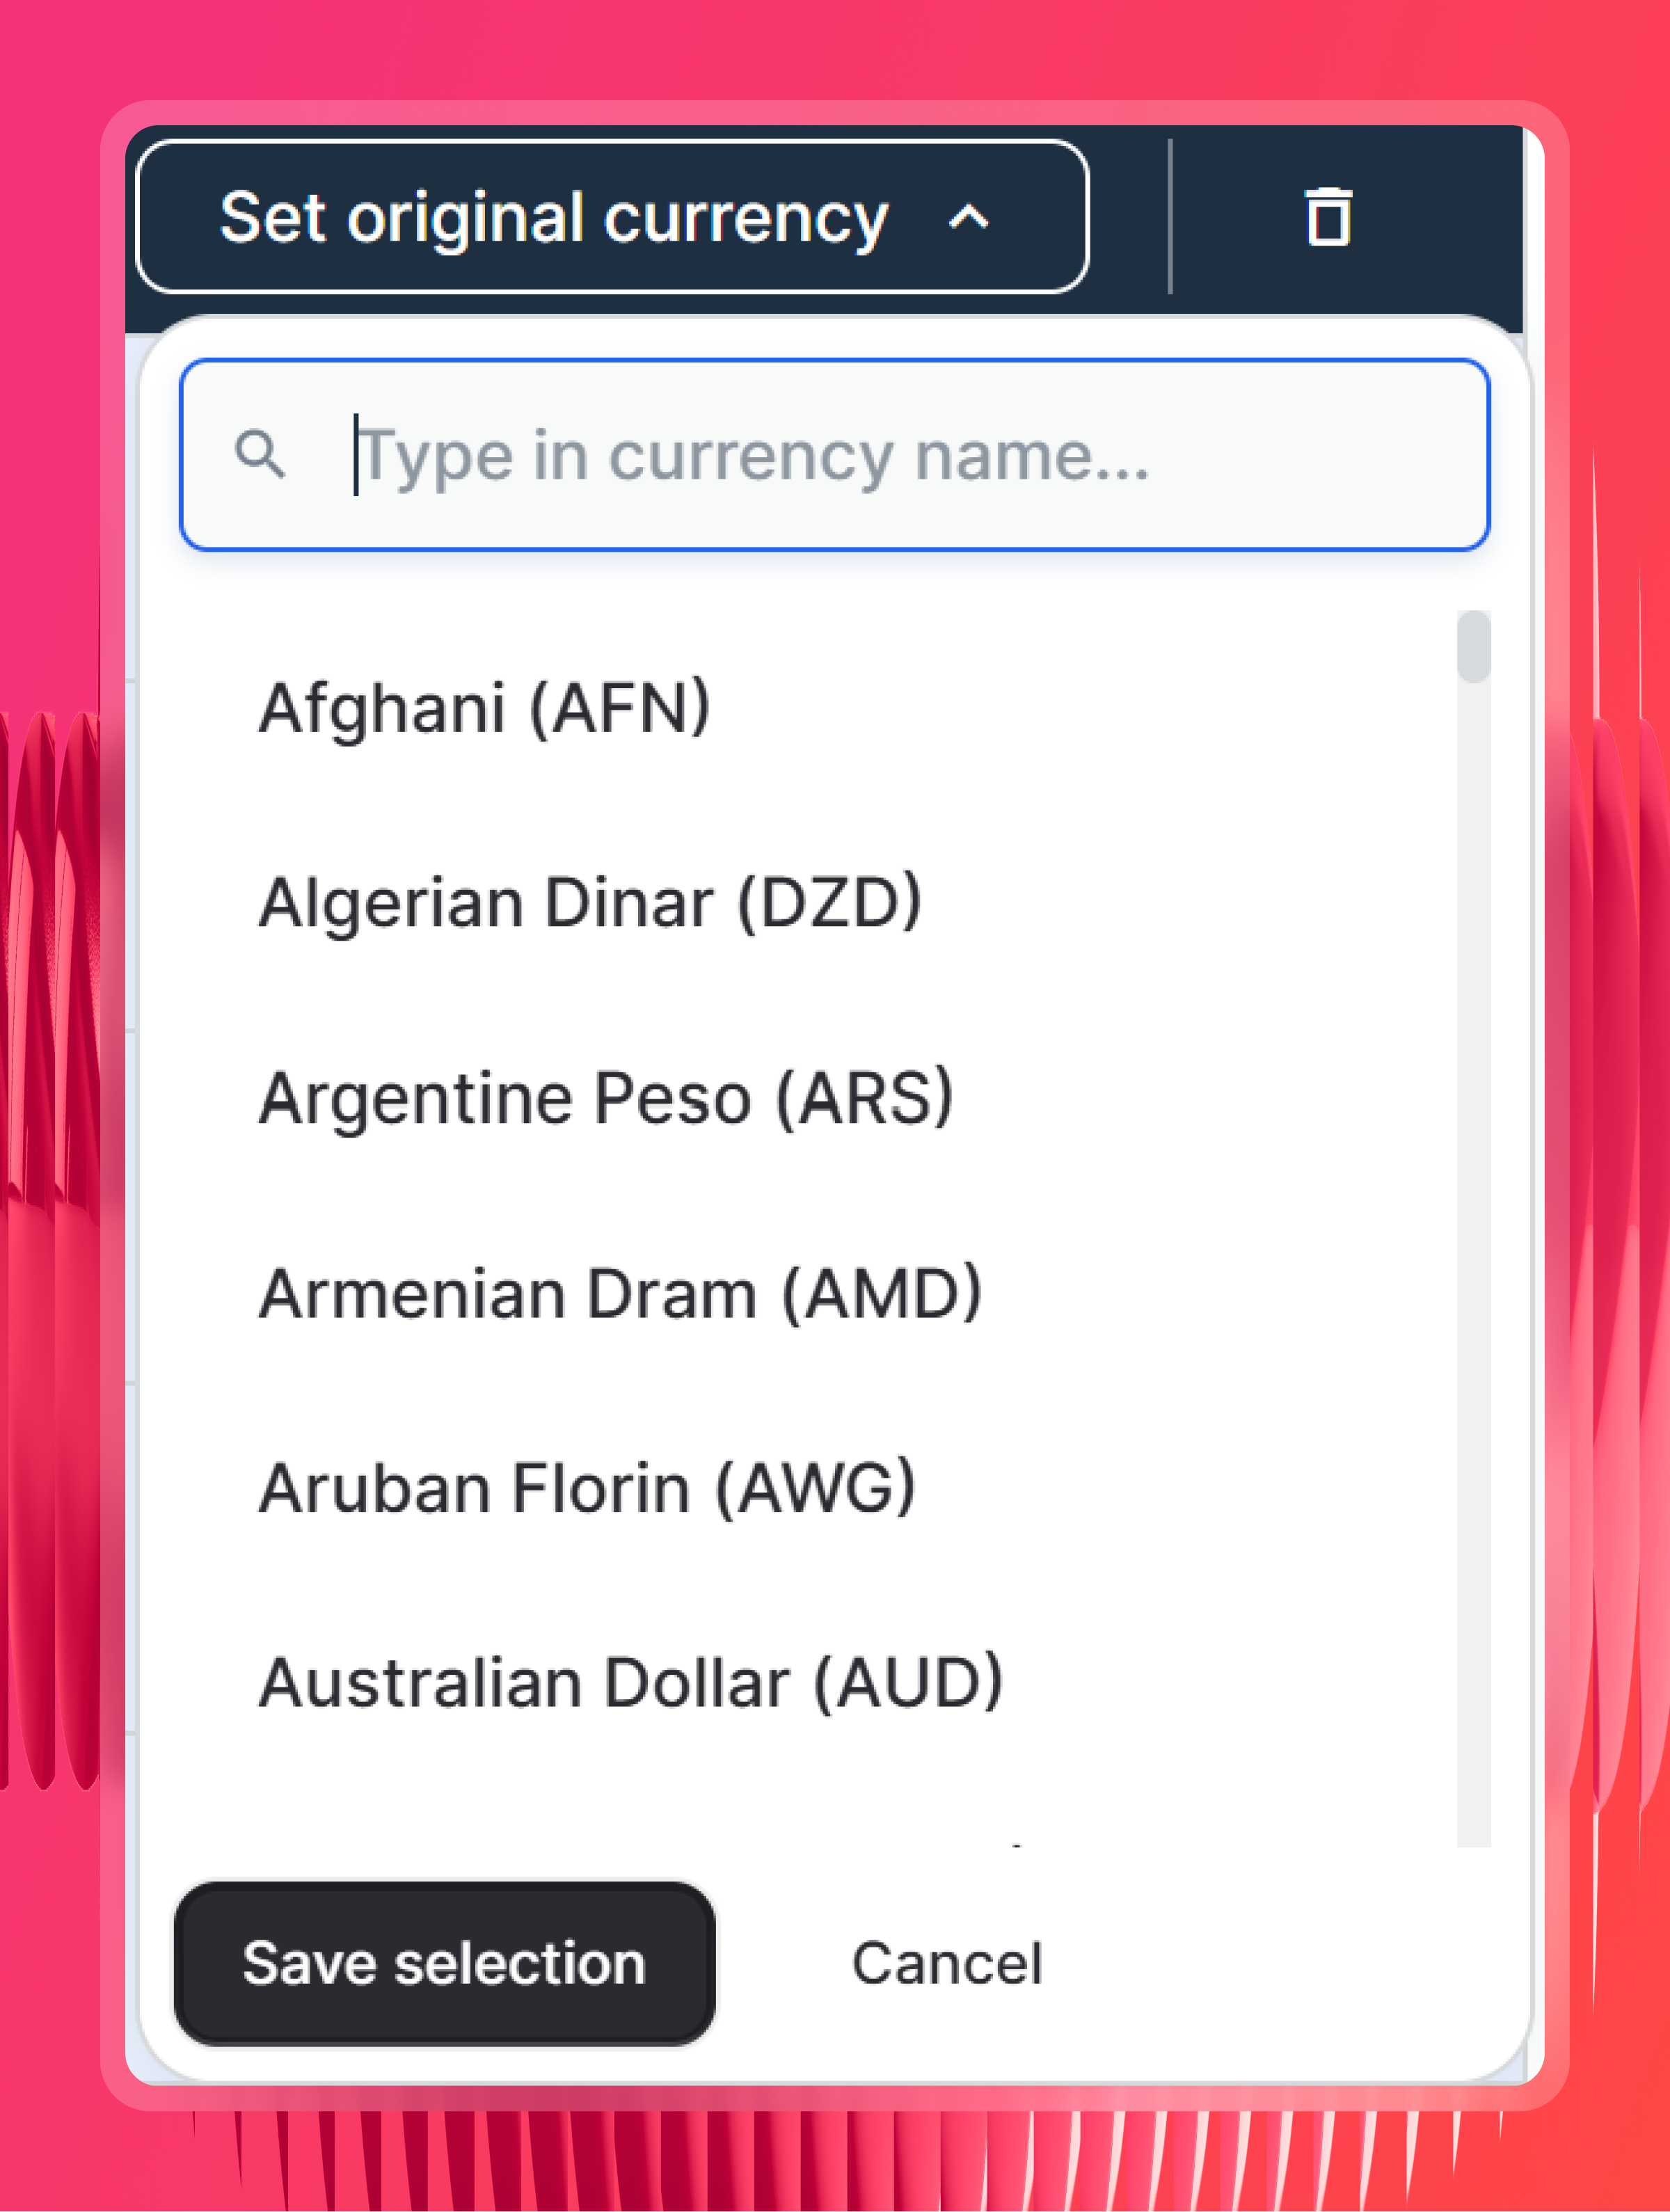
- Check currency settings. Whatagraph detects the original currency per source. Sheets are the one source where it often can't, because a spend column is just numbers. Set it manually here so nothing gets added together that shouldn't be.
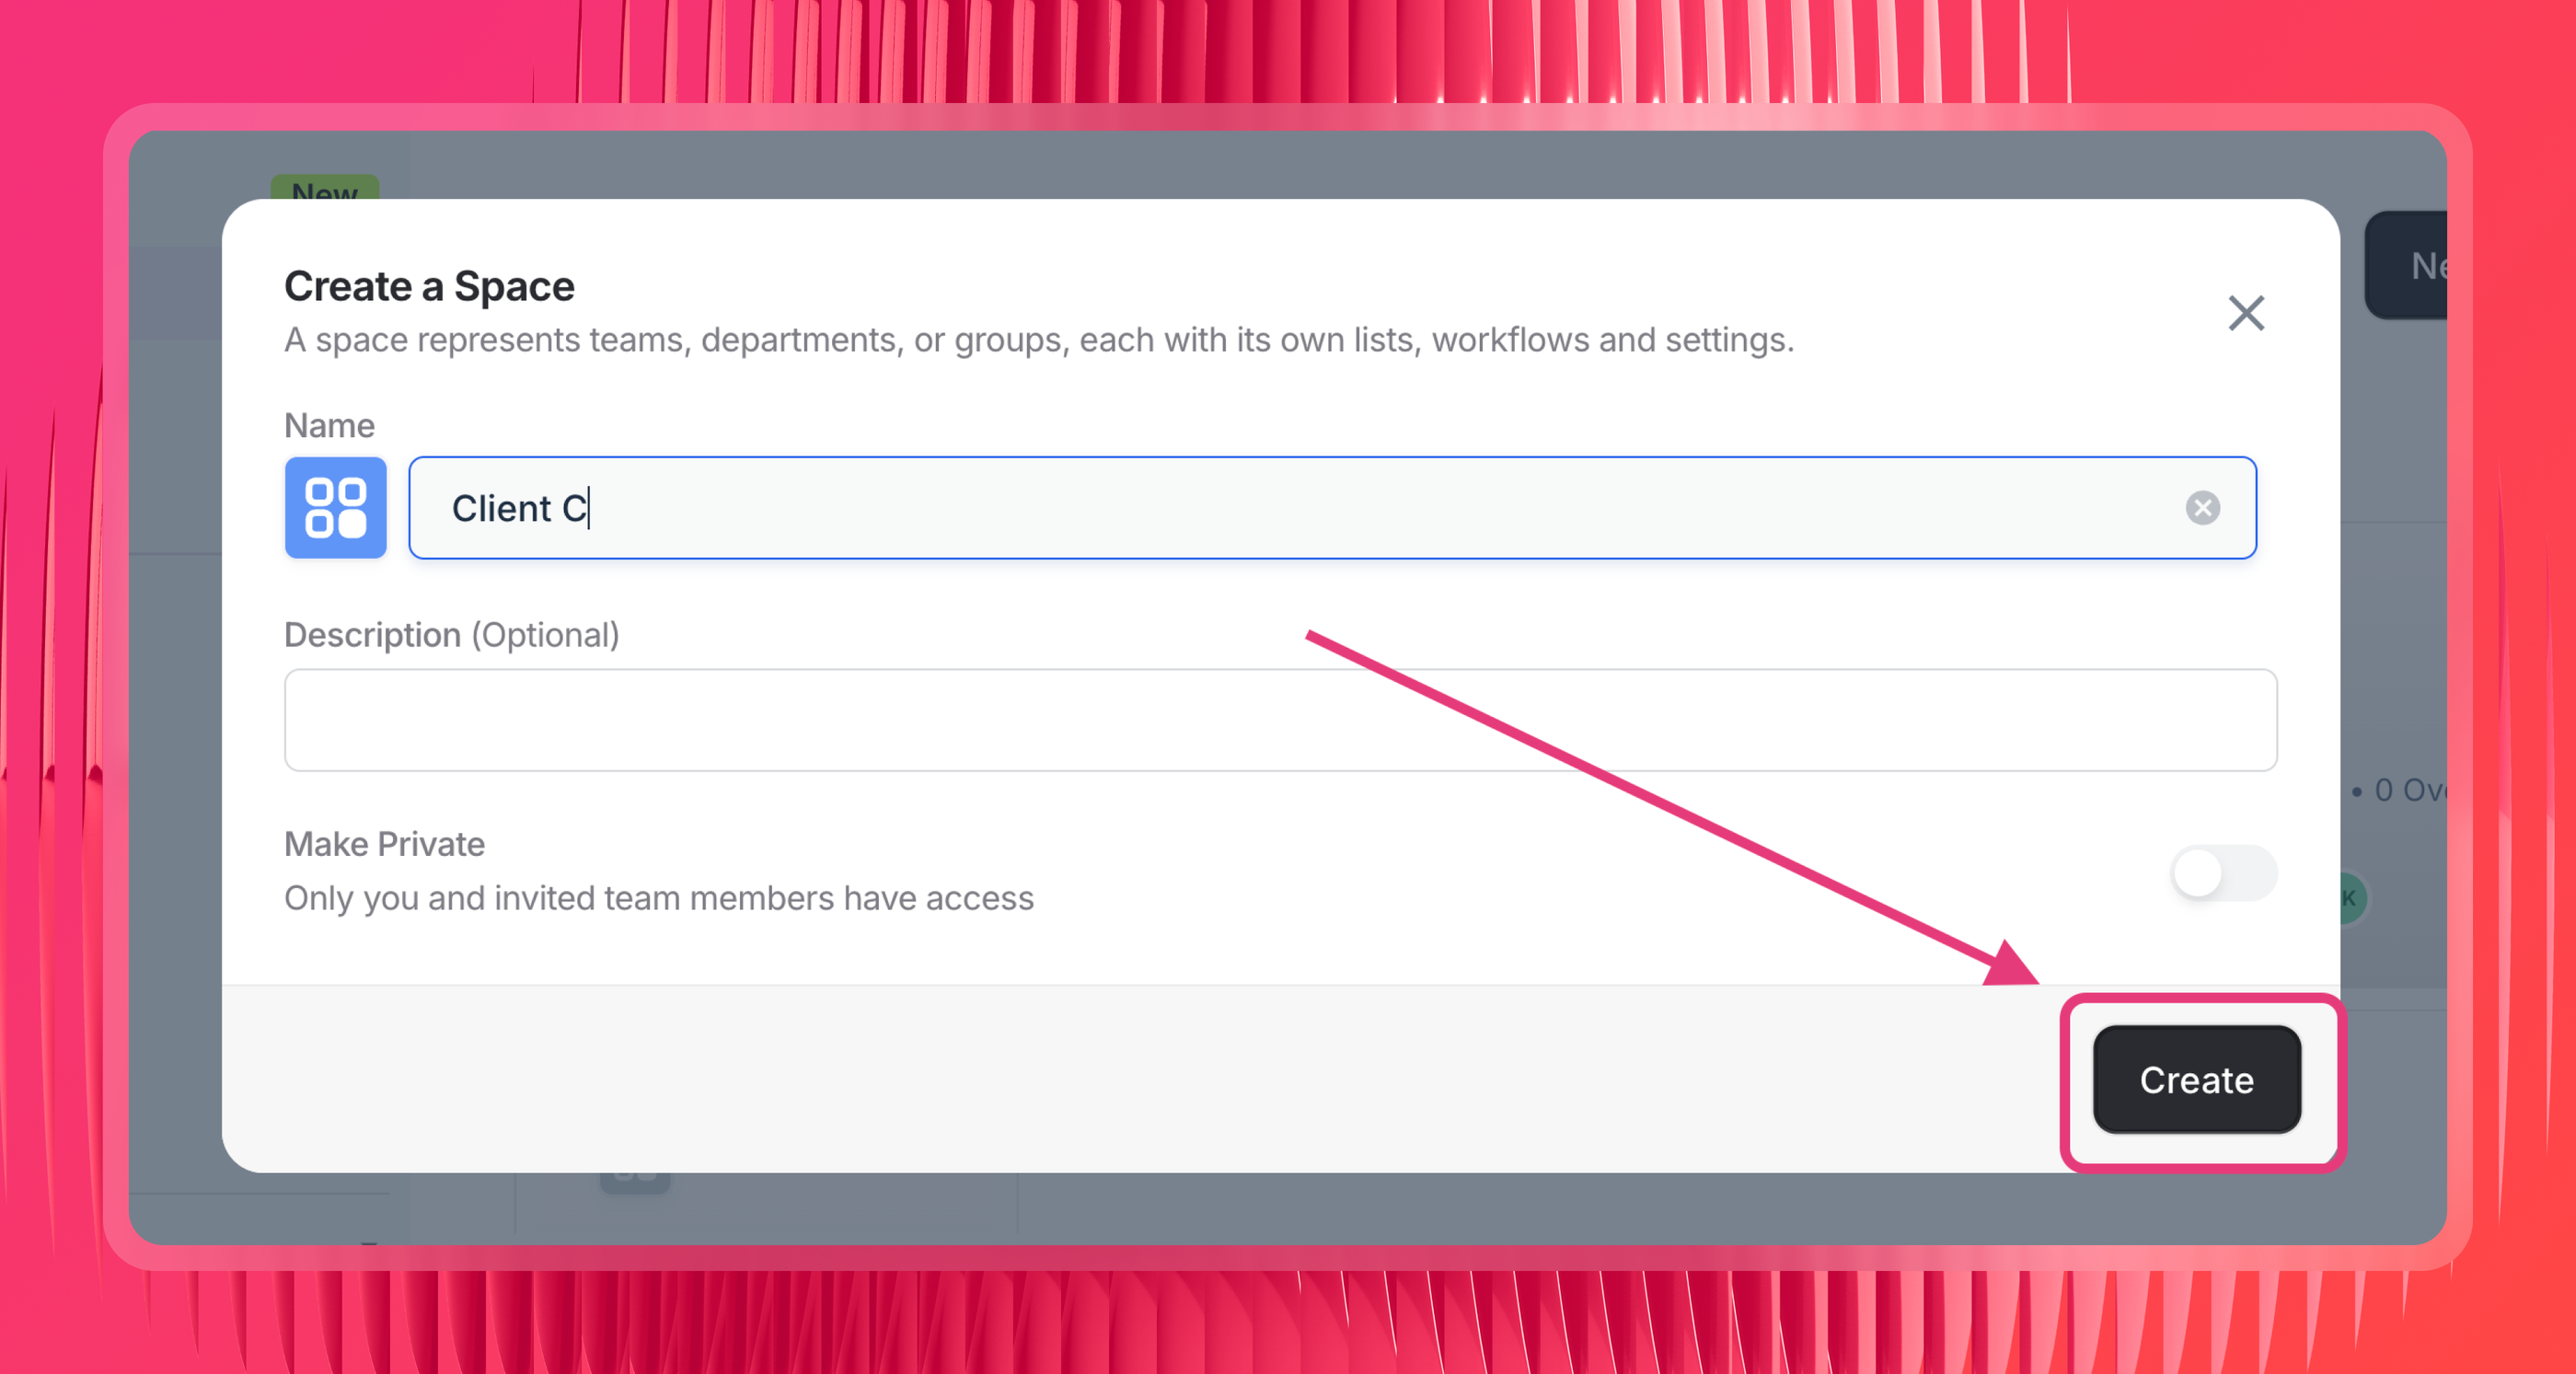
- Organize sources into Spaces by client or location. Claude scopes queries by Space. Put the client's sheet in the same Space as the client's channels and a question about that client stops being a search across everything you own.
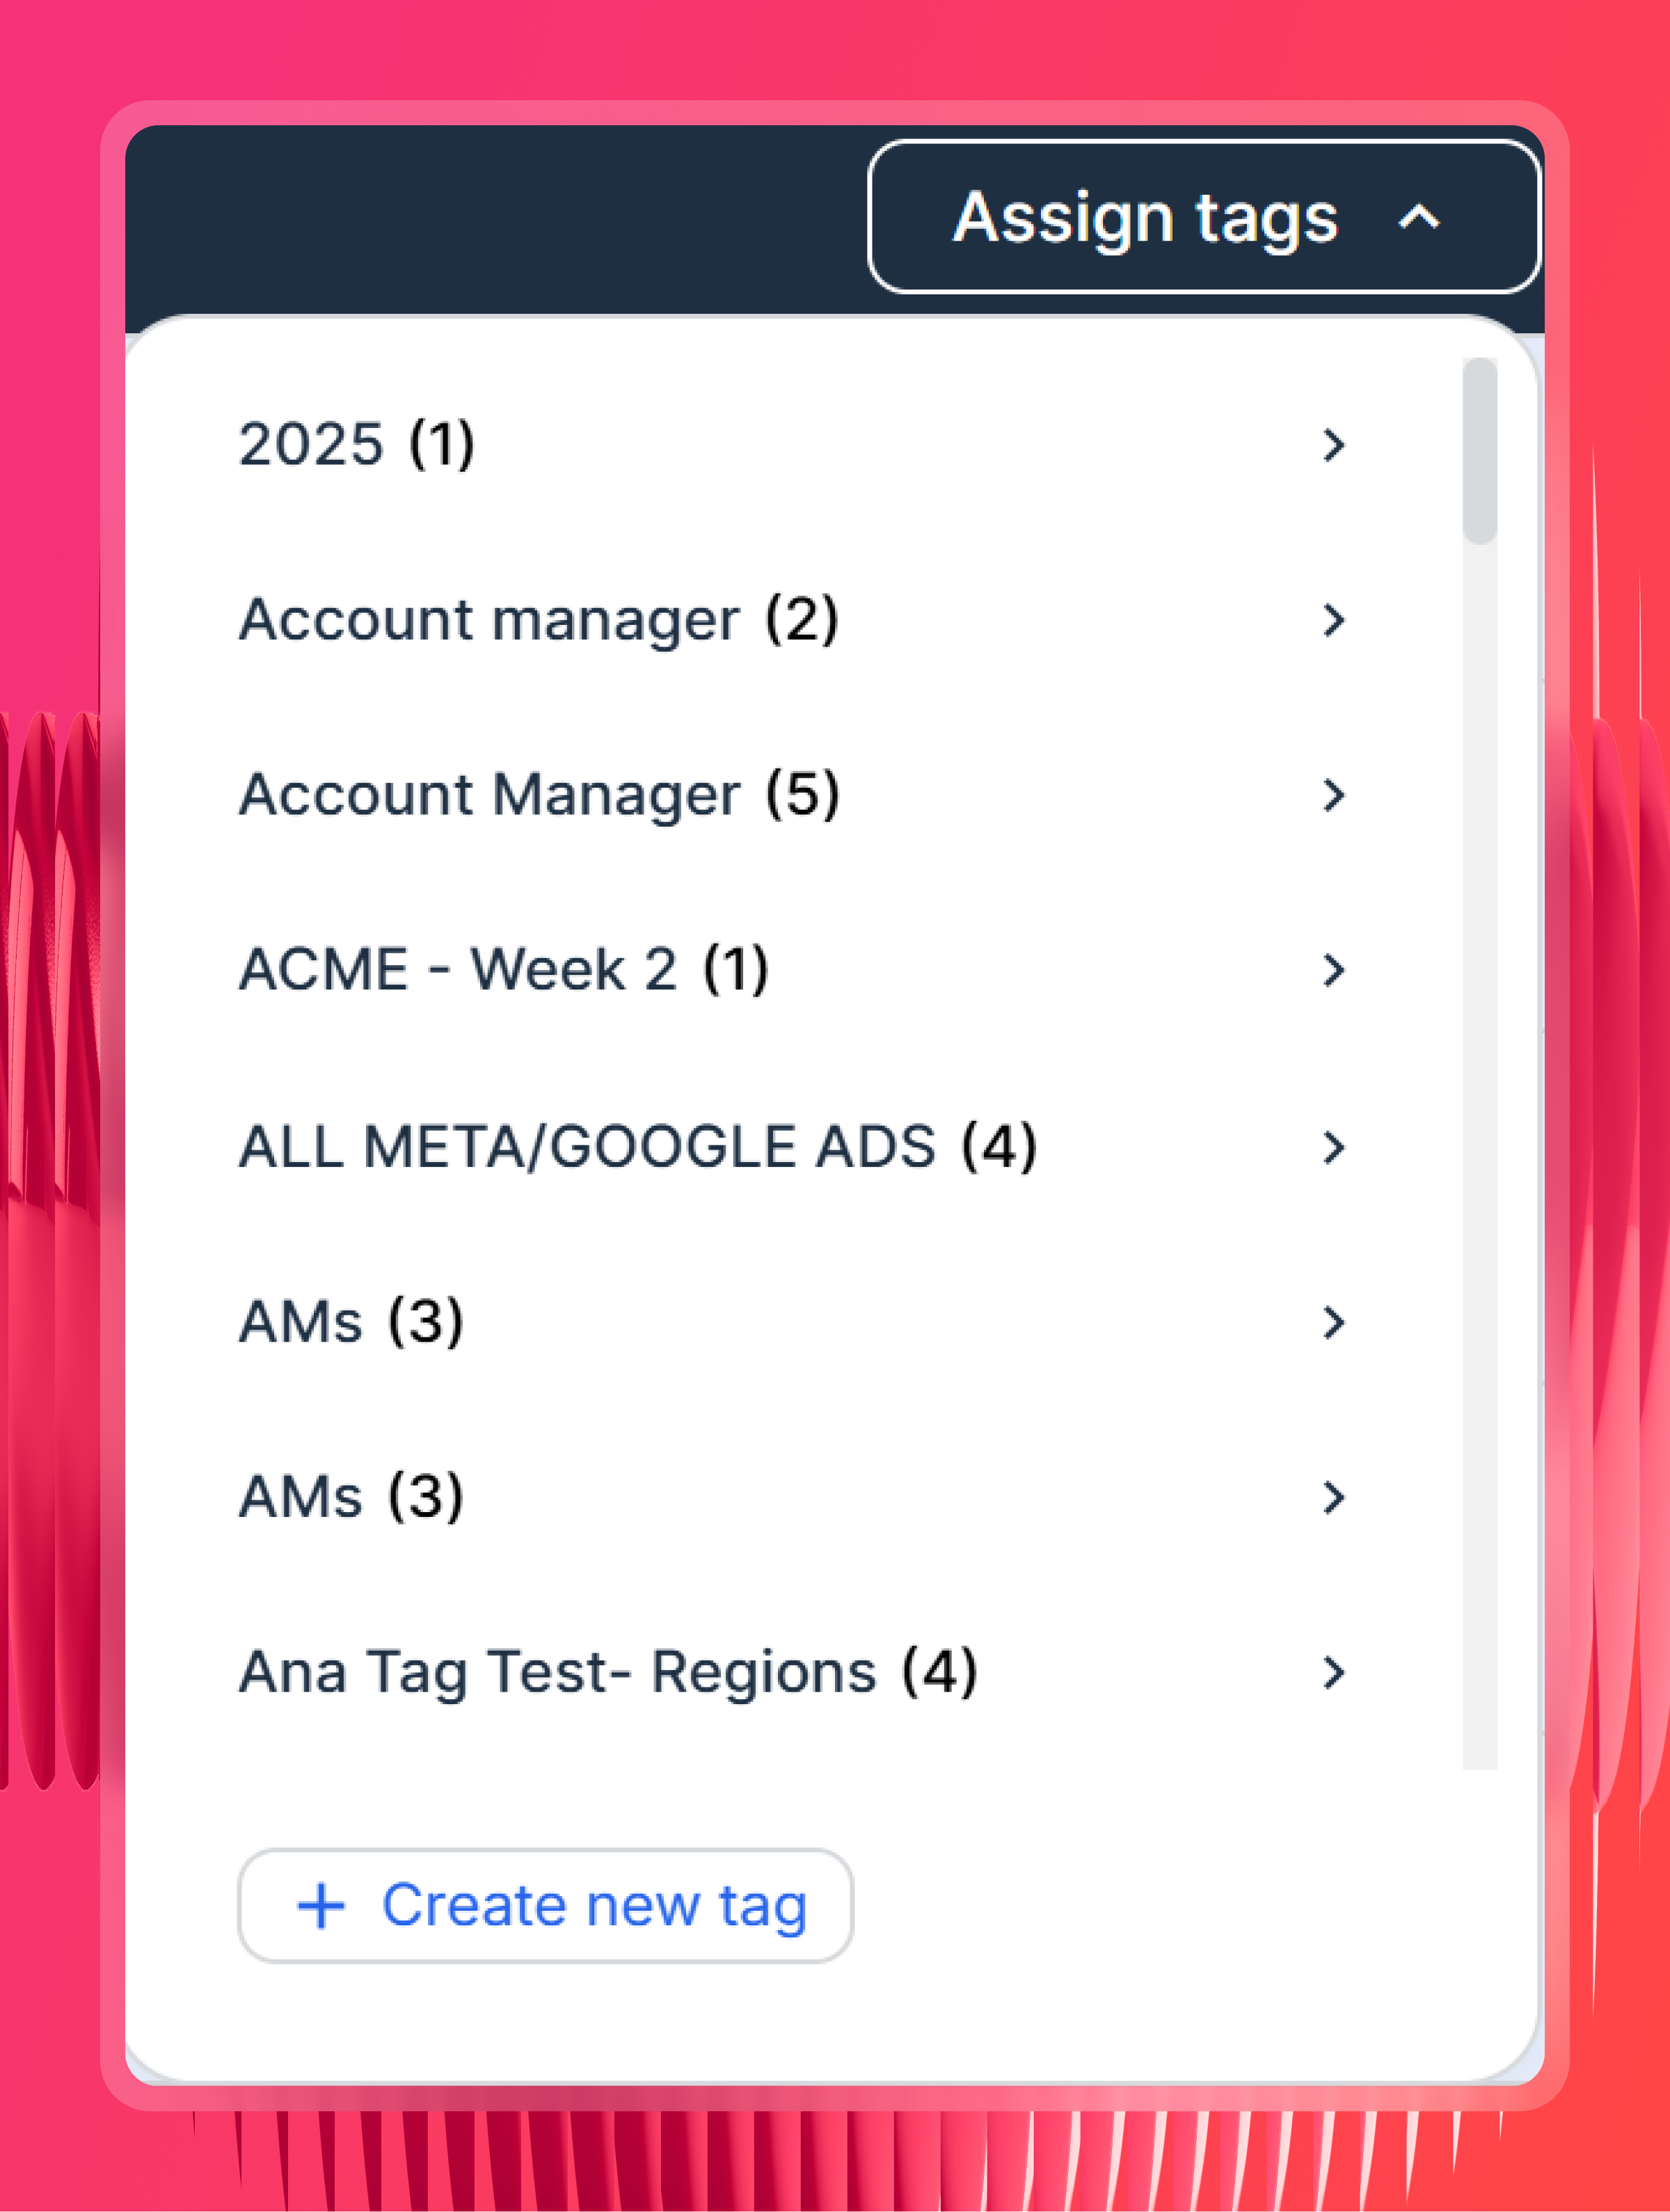
- Tag your sources. Label by client, region, account manager, or tier so you can filter on those labels in Claude instead of listing sources every time.
The more of this you do upfront, the better every answer gets afterwards.
You don't have to build it all by hand. Once the MCP is connected, Claude can create these for you. Describe the metric in plain language, tell it which columns to use, and it writes the definition into your data layer where every report and future answer inherits it.
And if you'd rather this maintained without prompting for it at all, IQ Agents is in early access: new sources connected and blended, new campaigns tagged into your taxonomy overnight, reports rebuilt when the month rolls over.
Step 4: Add the Whatagraph MCP connector in Claude
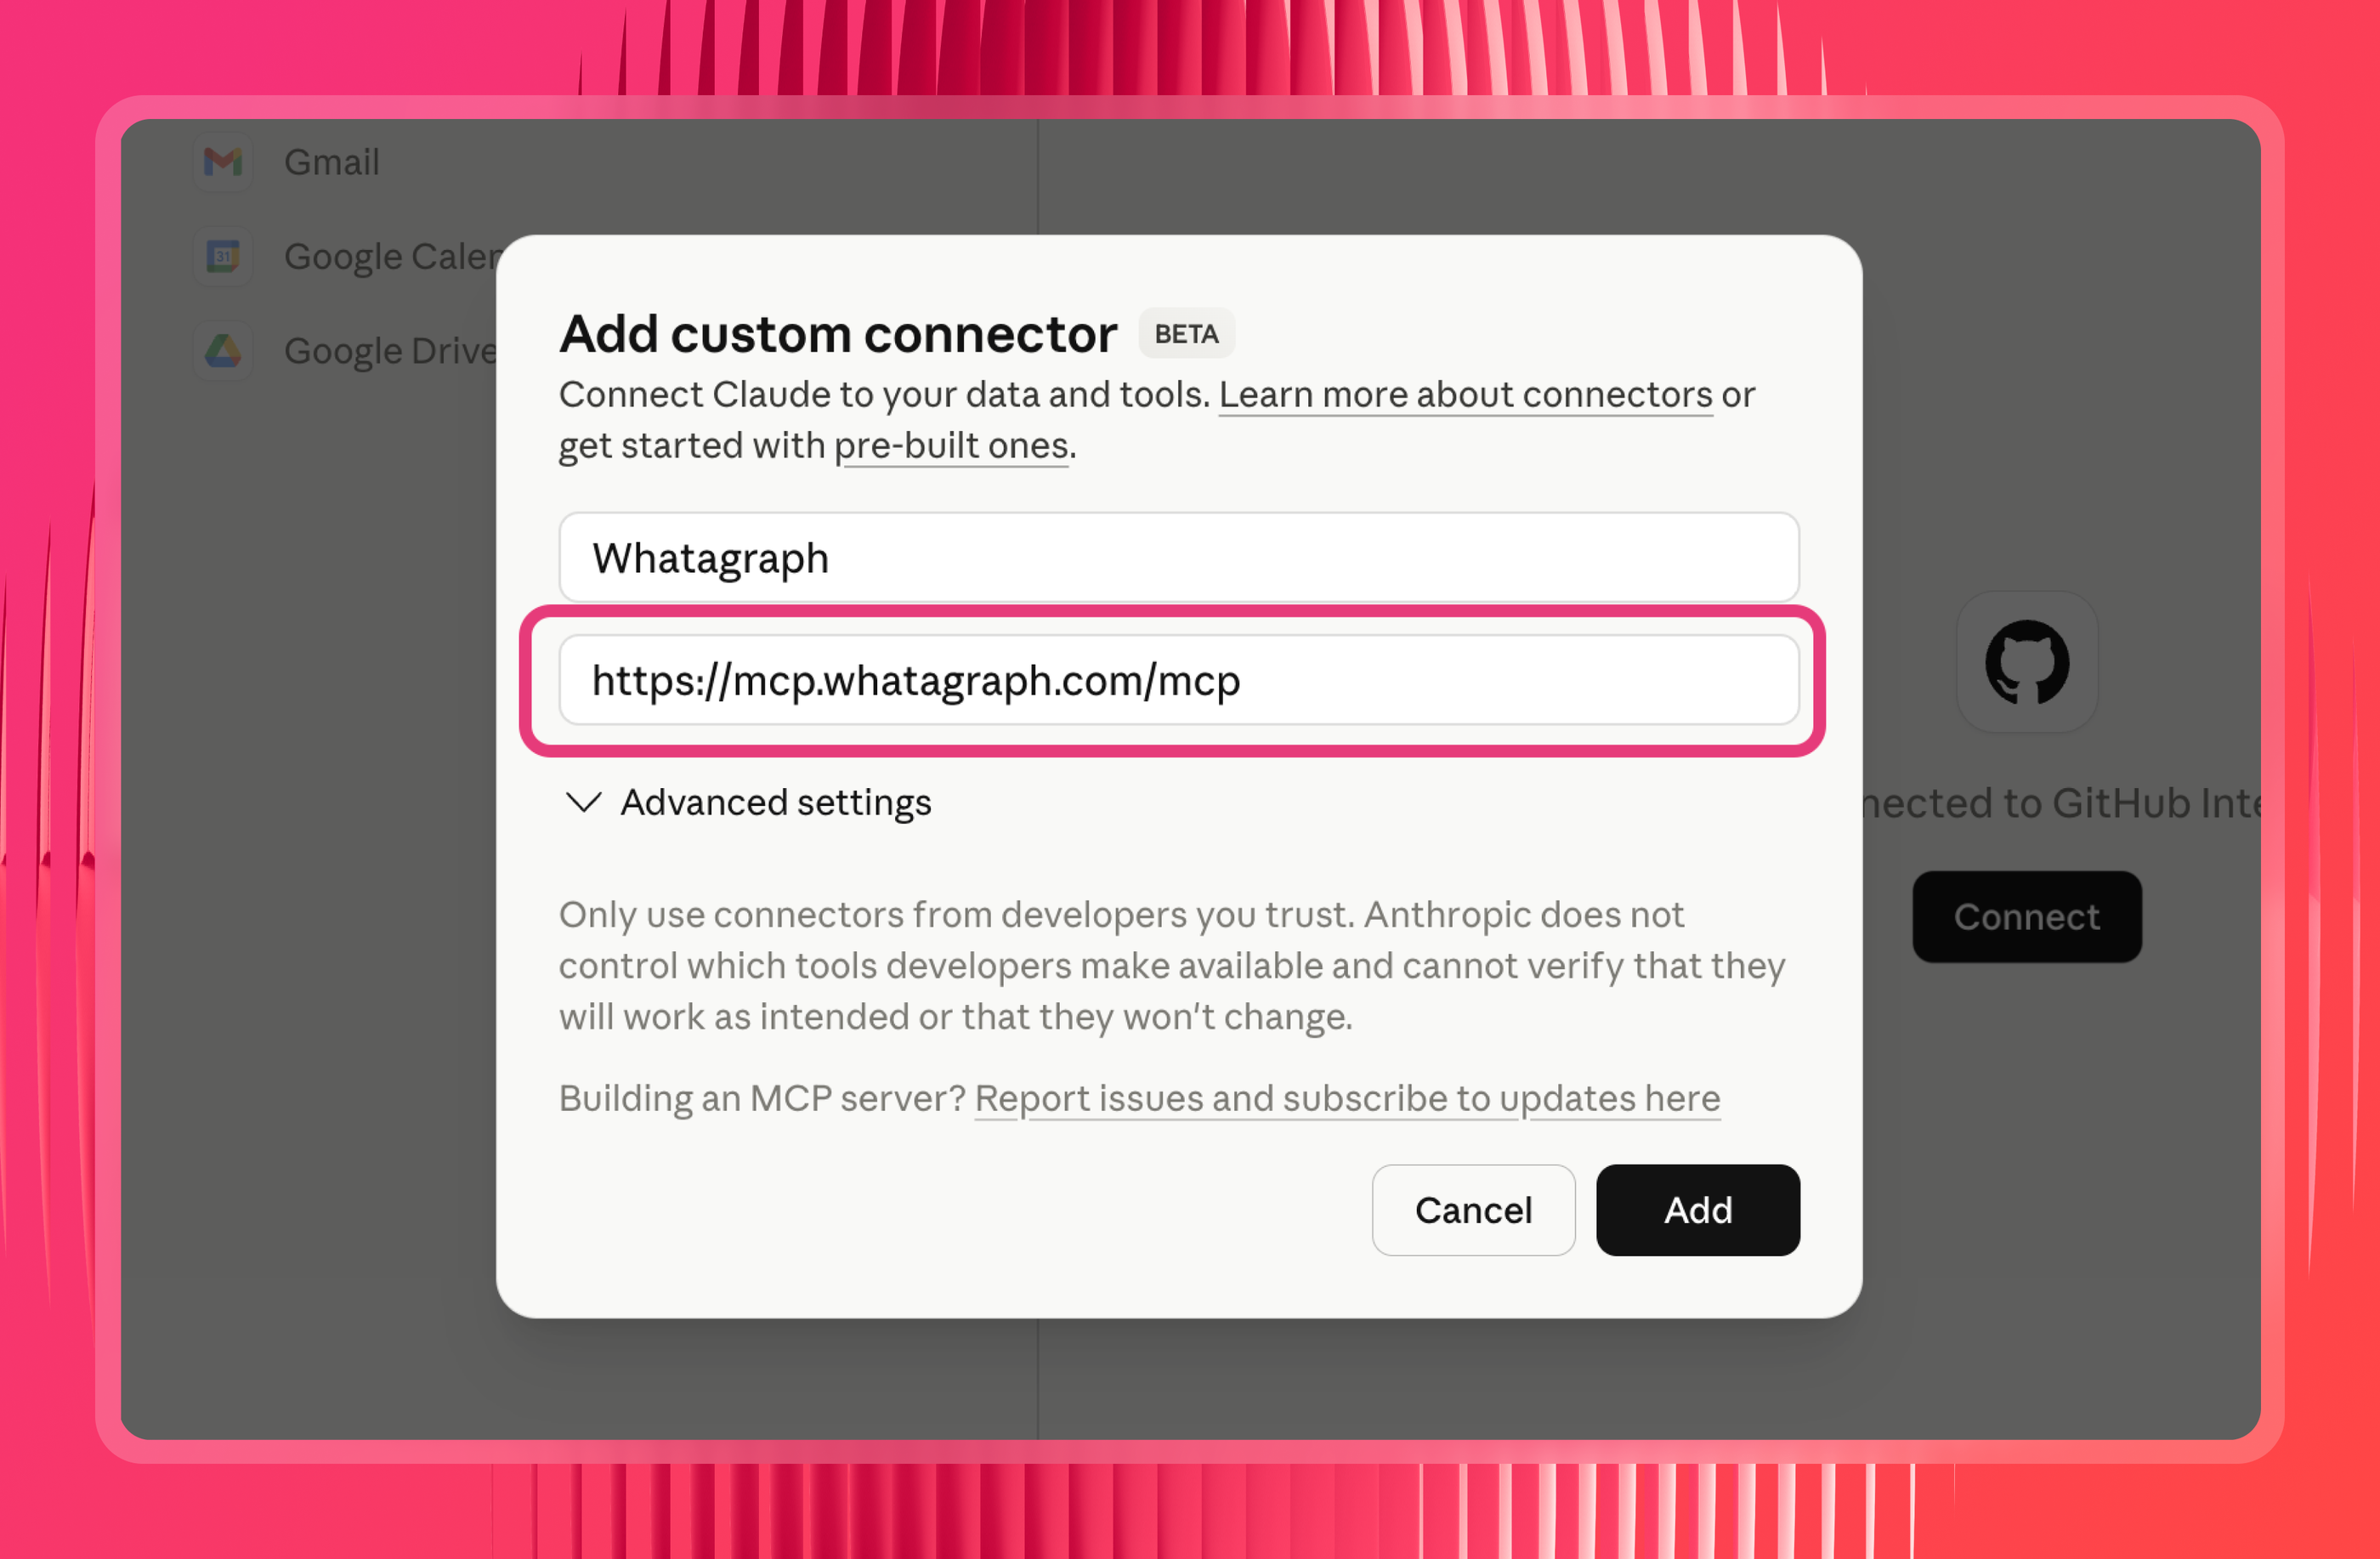
Open Settings in Claude and go to Connectors. Look for the option to add a custom connector, then paste in the server URL:
https://mcp.whatagraph.com/mcp
Using ChatGPT instead? Same URL, same steps. The only difference is you need Developer access to add custom apps.
Step 5: Authorize the connection
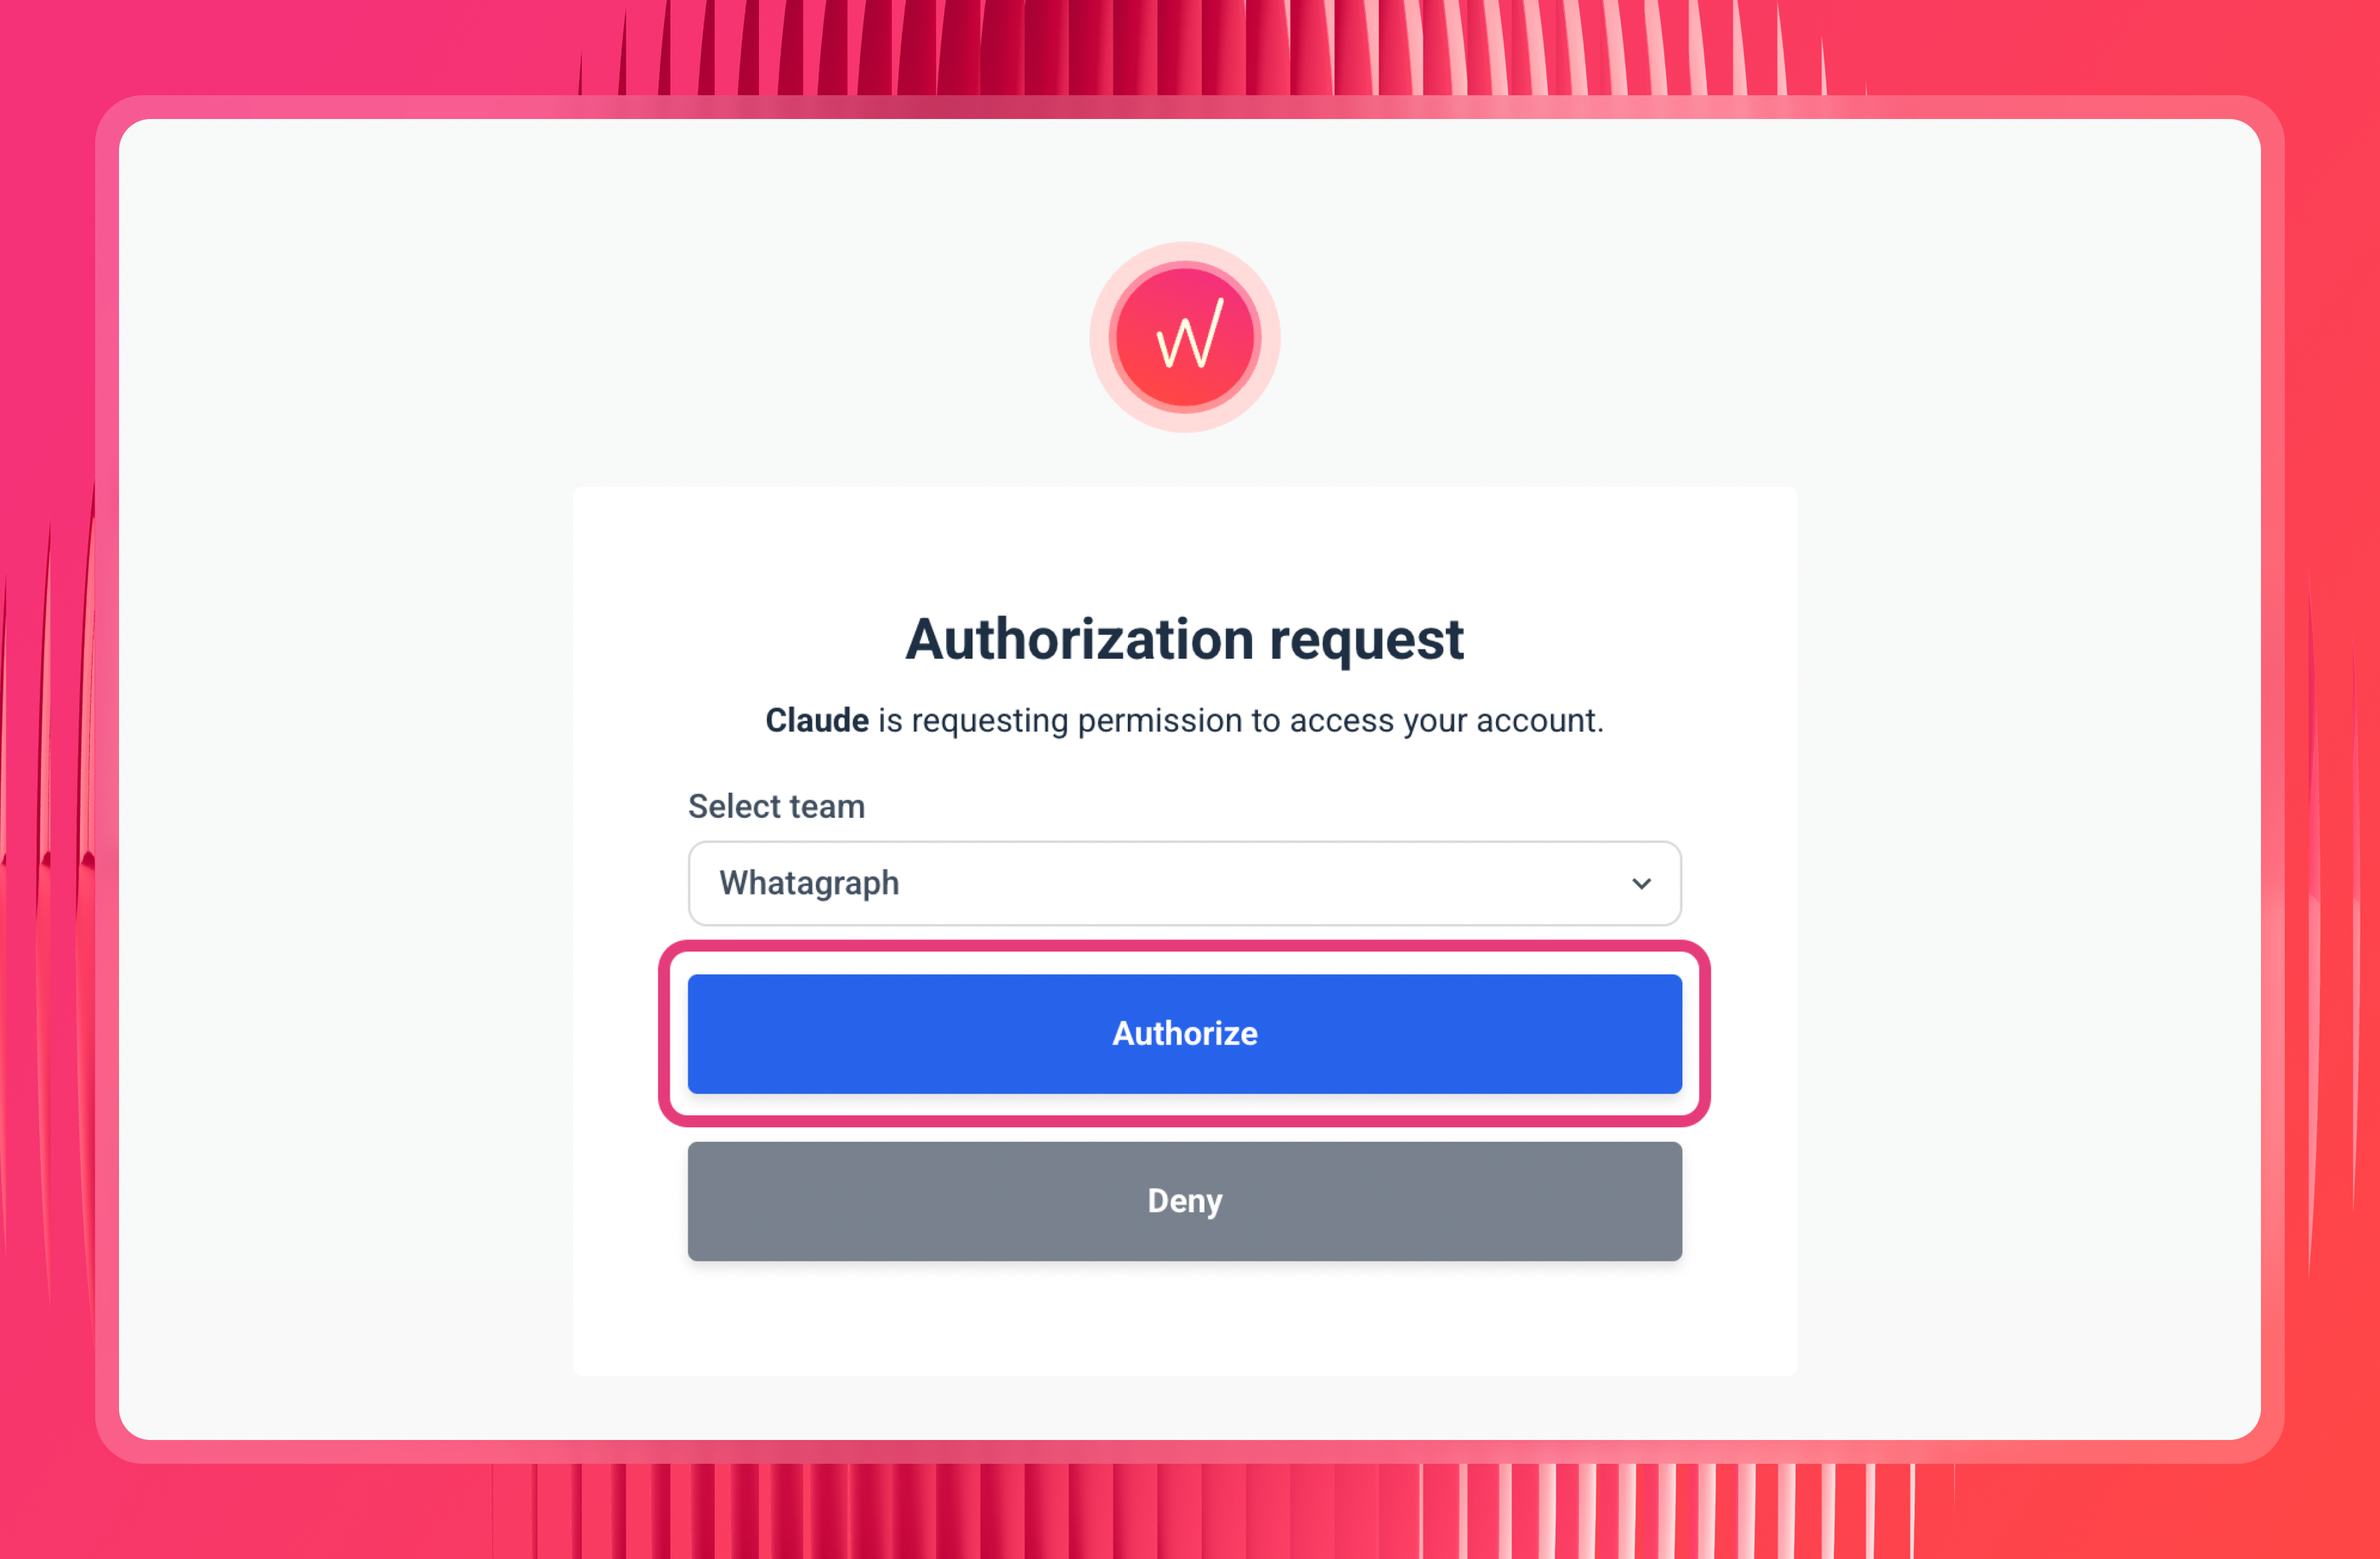
Claude opens a Whatagraph authorization page. If you're already logged in, you'll go straight to team selection. Pick the team you want Claude to reach and click Authorize.
No API keys, no service account JSON, no OAuth client to create first.
Step 6: Set permissions to "Always allow"
You'll see the connector's tool permissions after connecting. If they're set to "Needs approval," Claude asks you to authorize every single data pull, which gets old within about four questions.
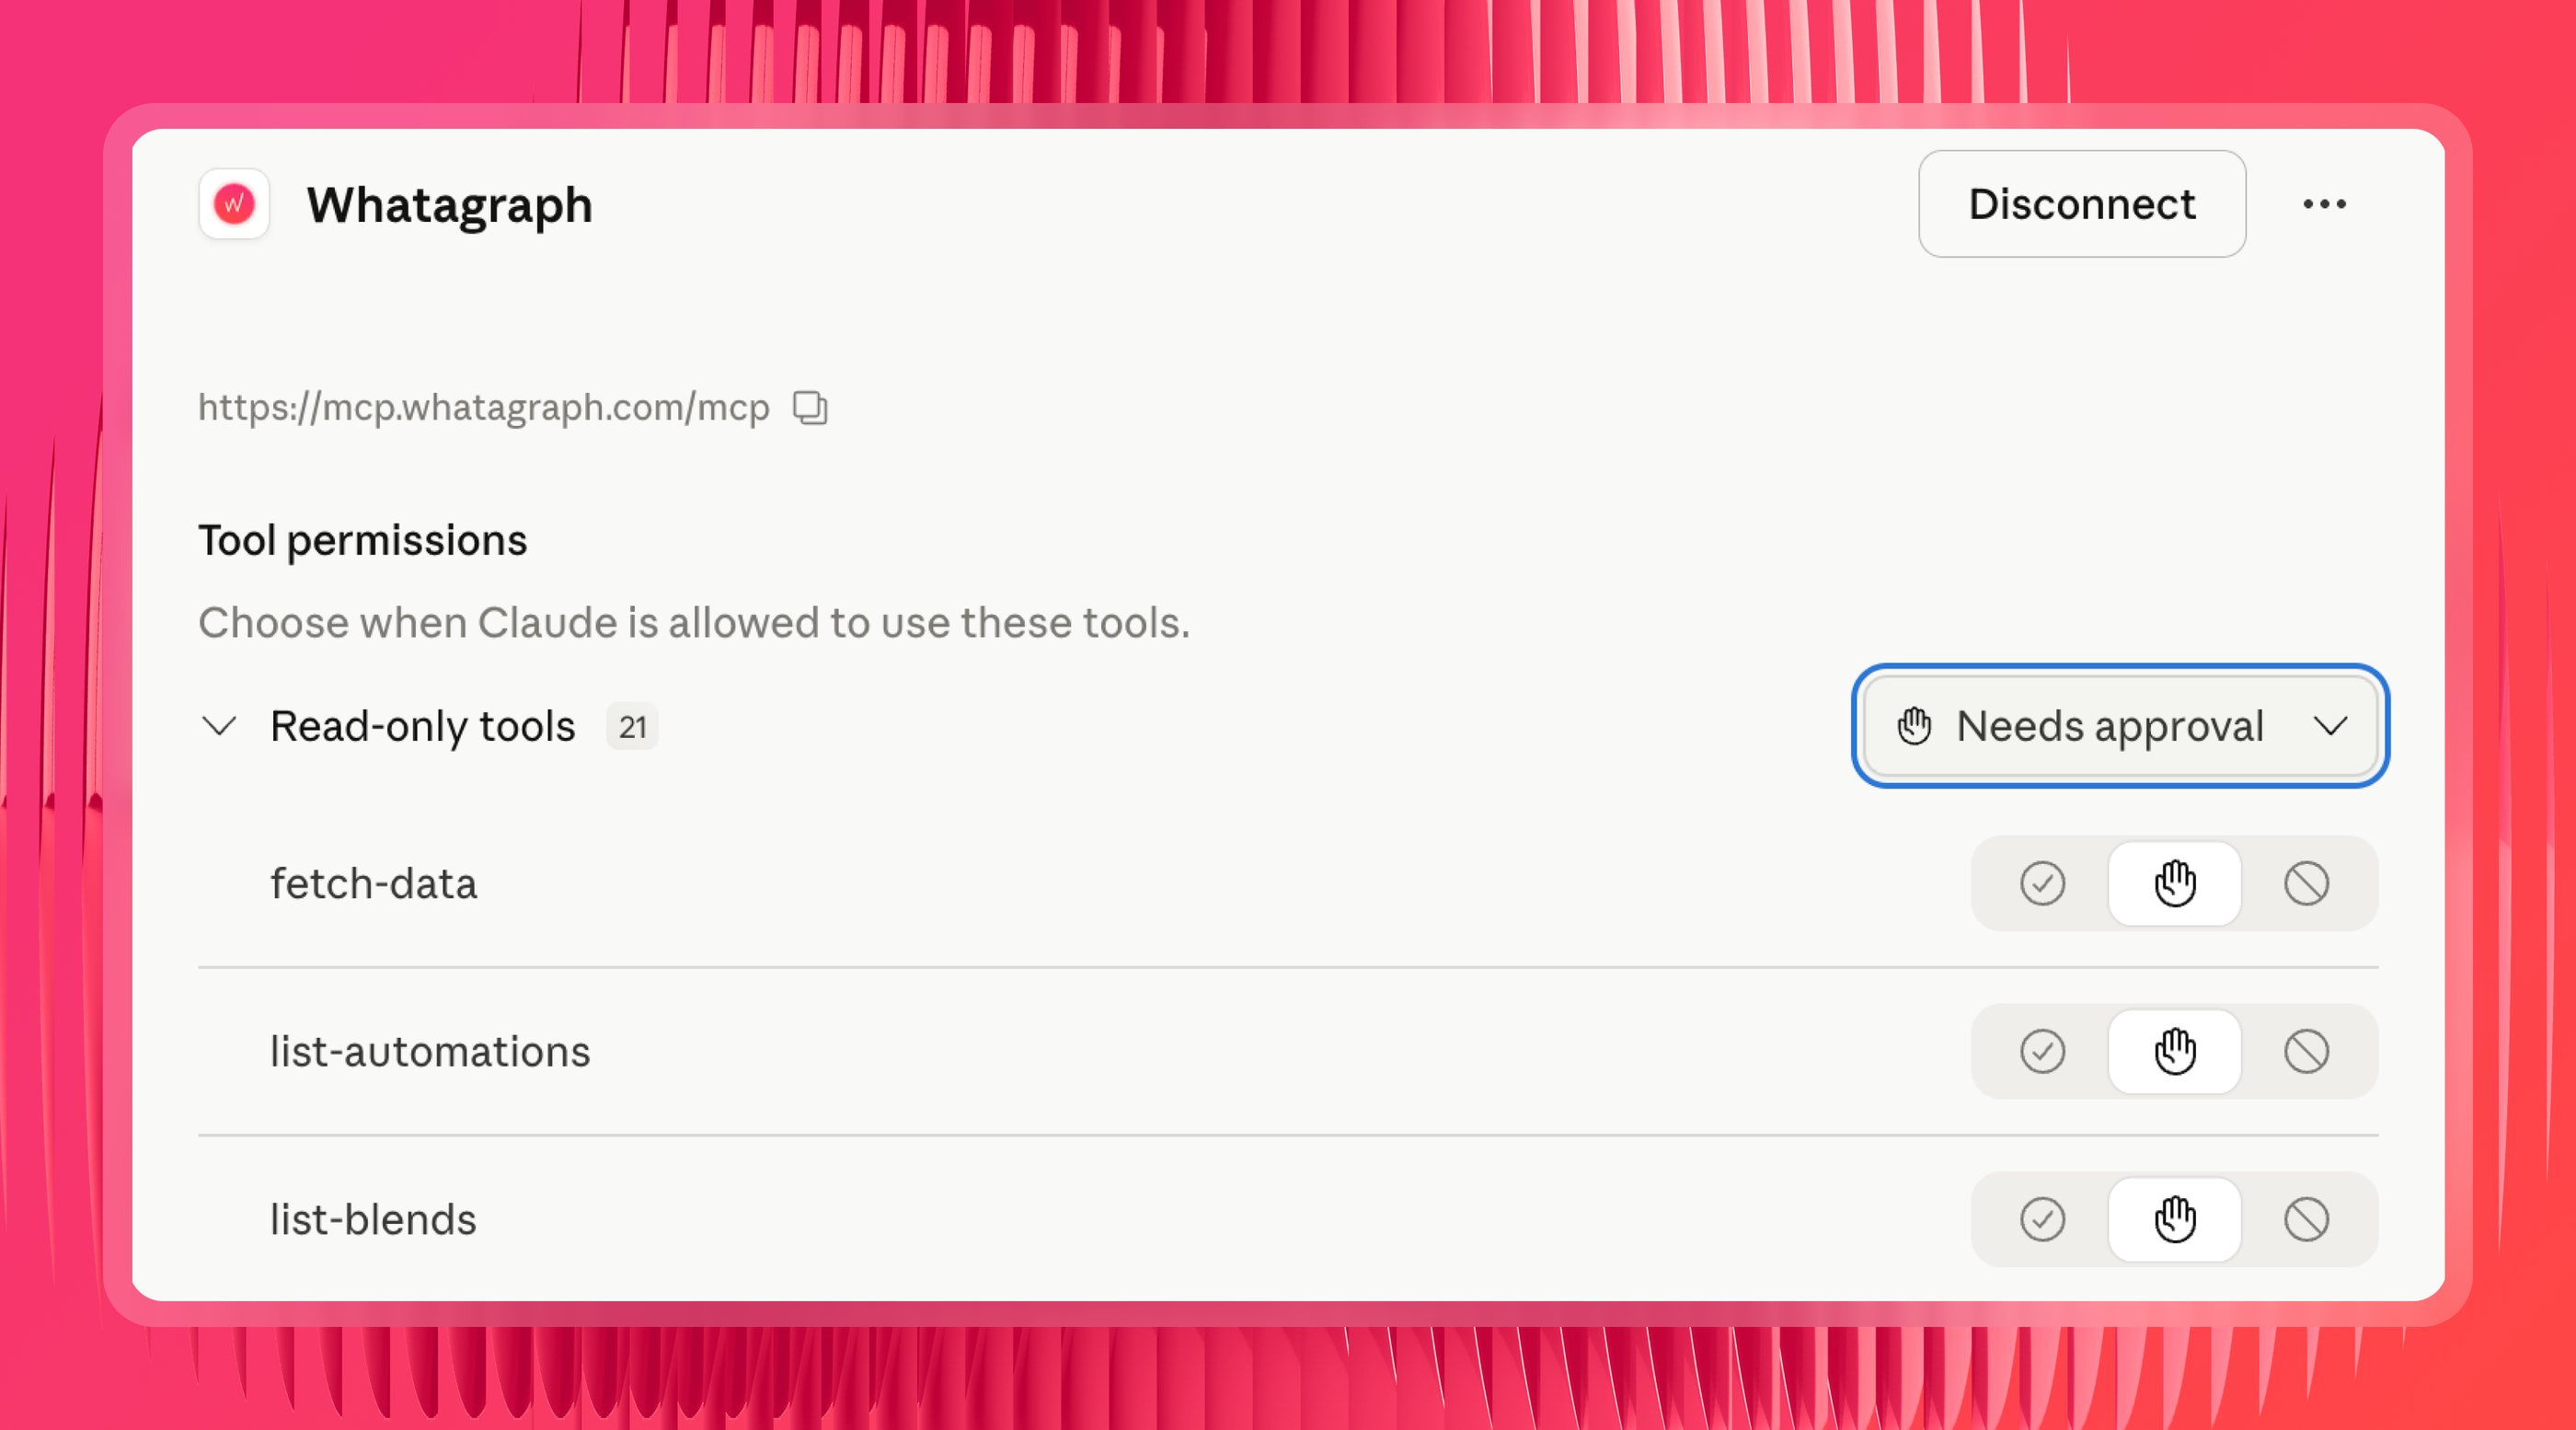
Worth keeping approval on for the write and delete tools until you trust the setup, though. Arturas's advice on that: leave it as ask for approval until you're confident it's doing the right thing for your specific context.
Step 7: Test it
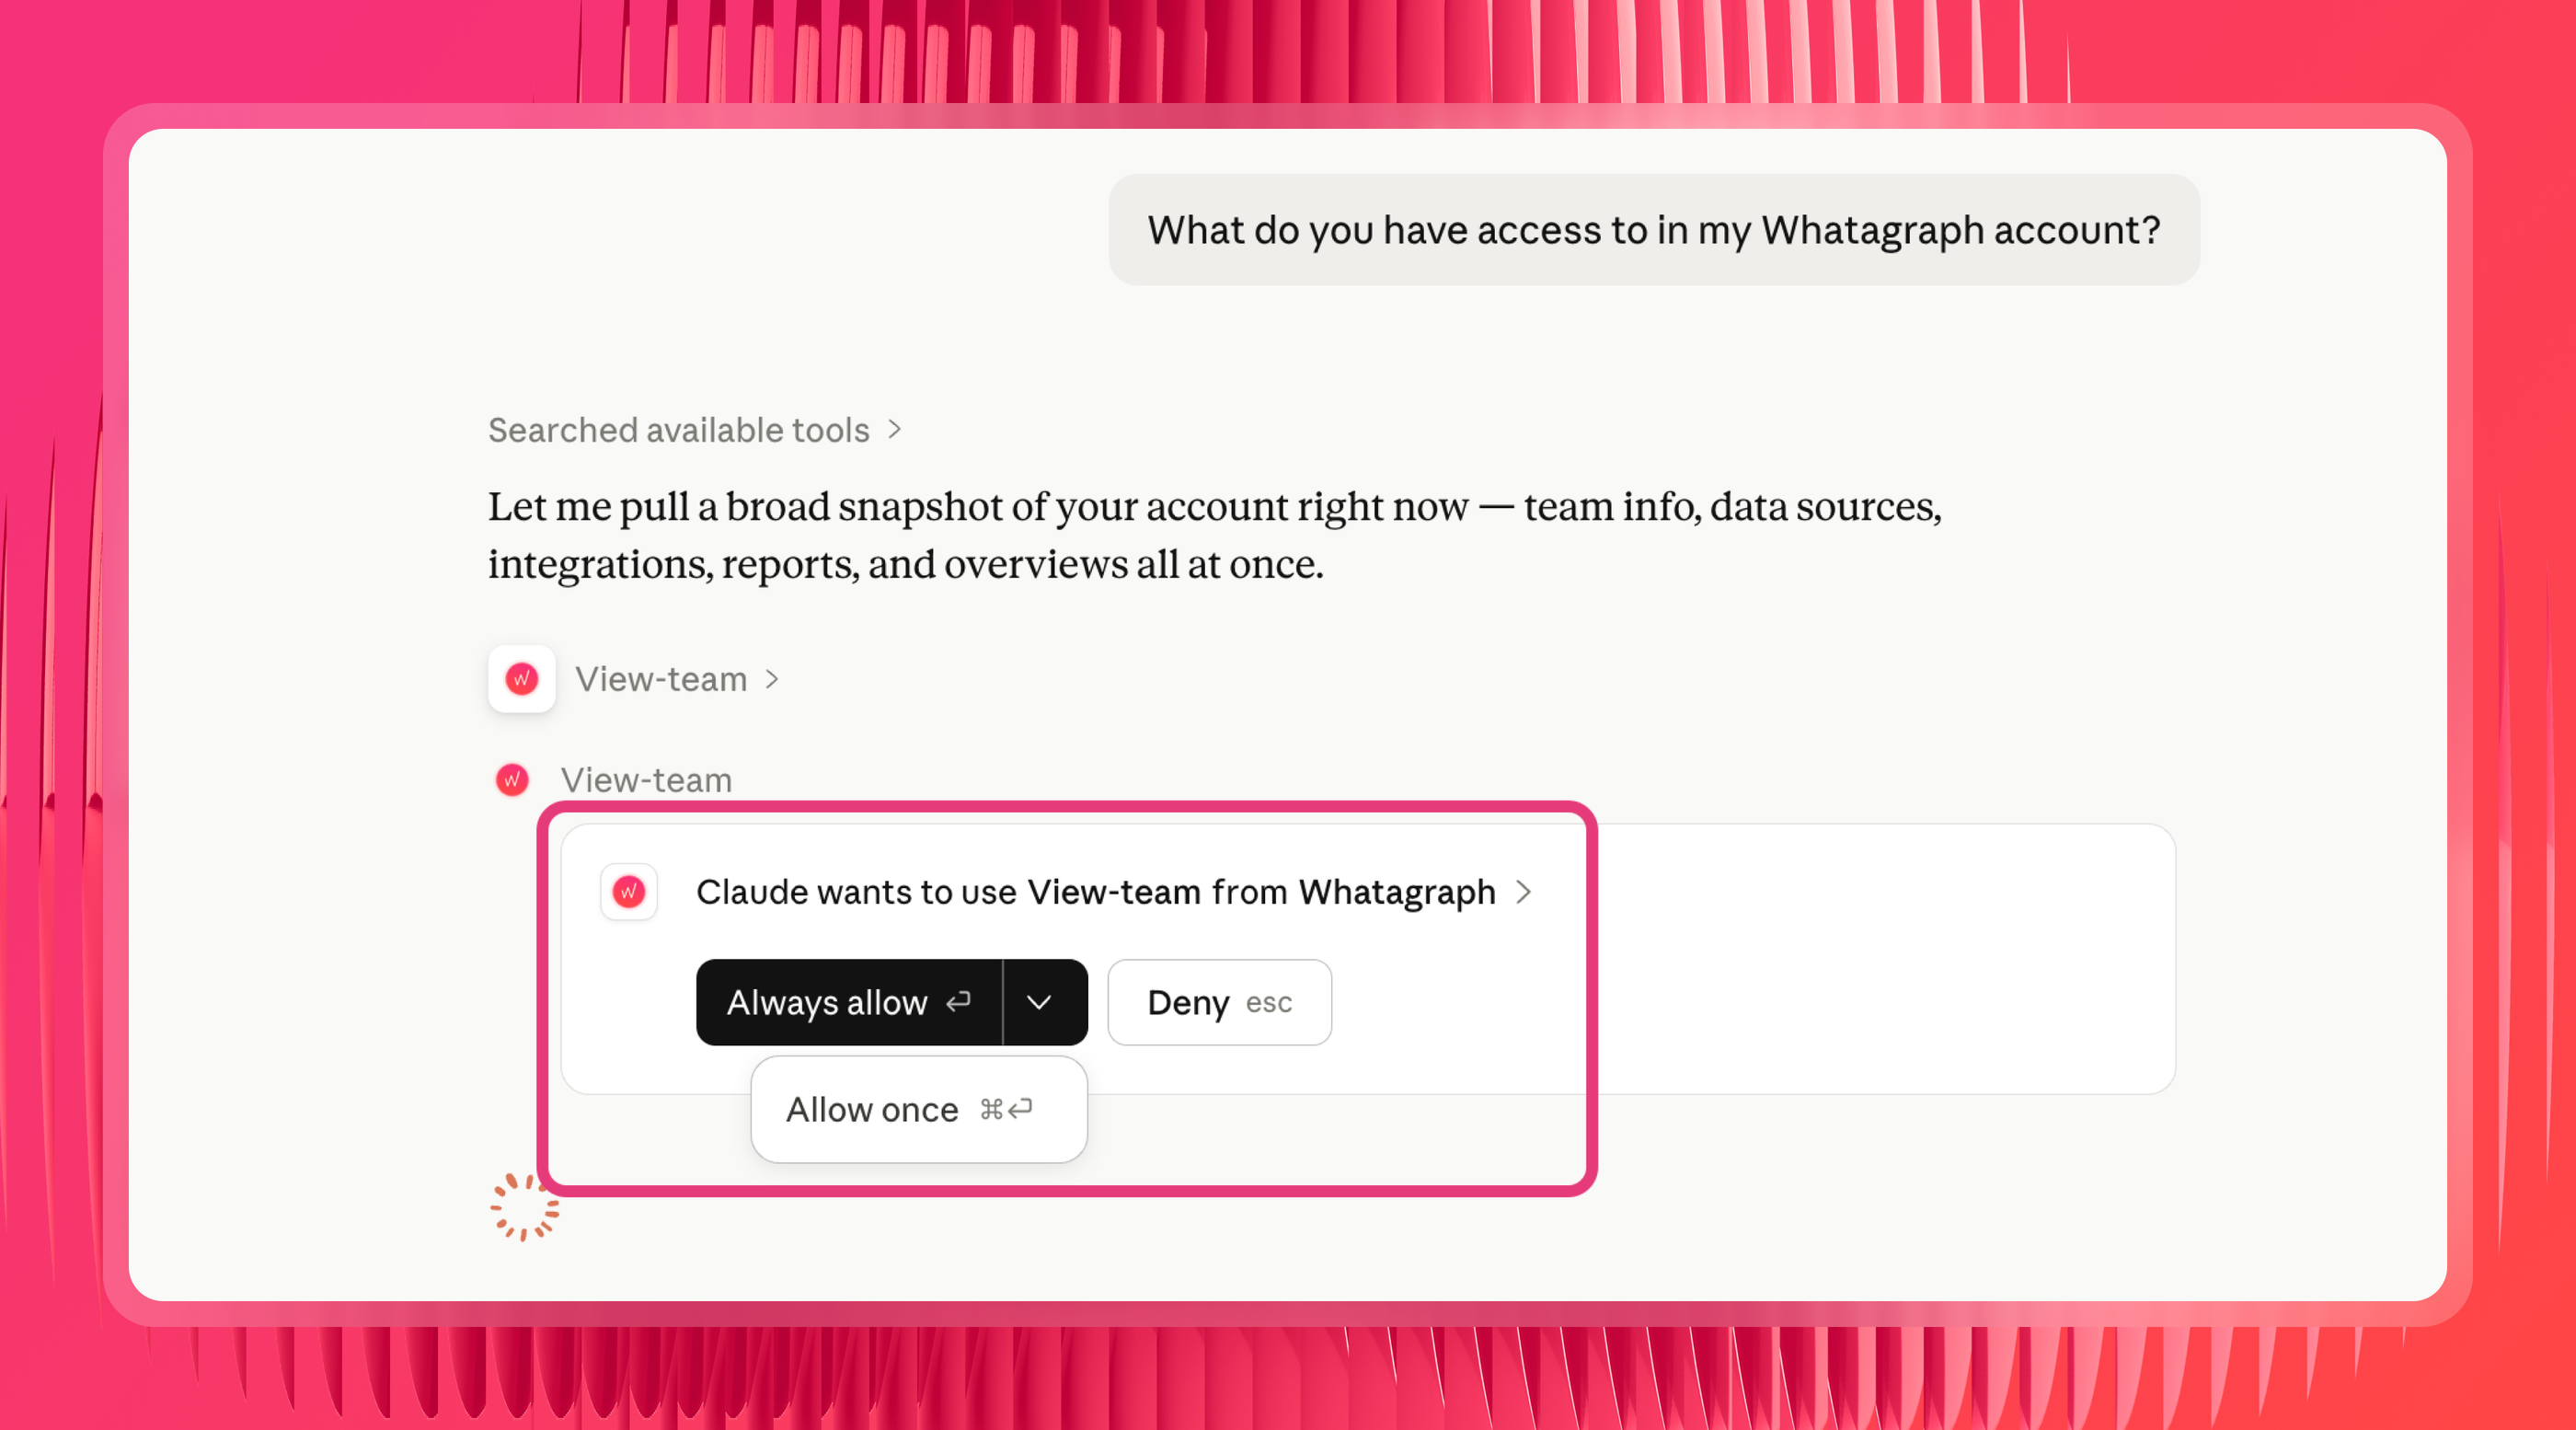
Ask Claude: "What do you have access to in my Whatagraph account?"
It should come back with your connected sources, including the sheet. Then try something that spans both sides, like "compare the monthly budget in my planning sheet against actual spend in Google Ads for this month."
If the numbers line up with your report, you're set.
Step 8: Add your own context with Claude skills
Whatagraph ships a set of pre-built skills embedded directly in the MCP, so there's nothing to download or upload.
As Laurynas Arminas, Whatagraph's Product Manager, explains it:
Each of Whatagraph's pre-made skills either sequences multiple tool calls in a logical order, or brings structured knowledge so you don't have to piece the picture together yourself.
What you add on top is the context only you have. Which sheet holds the targets. Which source group belongs to which client. Which conversion actions count. Which chart type you want when you ask for a visual.
Arturas recommends building these the practical way: run a chat until you get the answer you actually wanted, then ask Claude's Skill Creator to turn that into a skill so the next conversation starts there instead of from scratch.
That's the difference between asking a question and having an answer waiting for you.
Prompts library by use case
Once the sheet is connected and your business logic is set up, these are the questions worth asking. They're grouped by job rather than by metric, and most of them span the sheet and your channels at once, which is the whole reason to do this.
Plan vs. actual and budget pacing
The sheet holds the plan. The platforms hold what actually happened. Nobody enjoys reconciling those by hand on the 20th of the month.
Try these prompts:
- "Compare the monthly budget in my planning sheet against actual spend in Google Ads and Meta for this month. Which campaigns are over or under?"
- "Based on the daily pace so far, project month-end spend per client and flag anyone who'll finish more than 10% off the planned number."
- "Which clients are pacing ahead of the budget in my sheet, and by how much?"
- "Show me planned versus actual CPA by campaign for the last 30 days, and rank by the size of the gap."
- "My pacing sheet says this campaign is off track but the platform says otherwise. Show me the daily spend both ways so I can see where they diverge."
- "How much of the quarterly budget in my plan sheet is left, and what's the daily run rate needed to spend it evenly?"
Targets, goals, and client health trackers
If your account team runs weekly reviews off a spreadsheet, this is the section that saves the most time.
Try these prompts:
- "Using the targets in my client health sheet, which accounts are behind on their KPI this month?"
- "Rank every client by the gap between their target and actual conversions, worst first."
- "Which accounts have a red status in my tracker and what does their actual performance look like this month?"
- "Summarize the clients flagged as at-risk in my sheet, and pull the last 30 days of spend and conversions for each one."
- "Which clients hit their target last month but are behind at the same point this month?"
Offline and manually tracked data joined to paid performance
This is the data that lives nowhere else: trade show leads, phone sales, partner submissions, offline closes. It's usually the difference between reported ROAS and real profitability.
Try these prompts:
- "Join the offline leads in my sheet to paid spend by month. What's the true cost per lead once offline conversions are included?"
- "Compare platform-reported conversions against the closed deals in my sales sheet by campaign. Where's the biggest gap?"
- "Using the agency fee and client overhead columns in my sheet, calculate contribution margin by client for last quarter."
- "What's our MER for this client, accounting for the fees in my sheet rather than platform-reported ROAS?"
- "Which channels drove the leads that actually closed, based on my manually tracked sales log?"
Cross-channel rollups where the sheet supplies the missing dimension
Your sheet often holds the only column that makes a rollup meaningful: client tier, region, account manager, retainer size, vertical.
Try these prompts:
- "Group total spend and conversions by the client tier column in my sheet, across Google Ads, Meta, and LinkedIn."
- "Which account manager's book of business improved most month over month?"
- "Break down cross-channel performance by region using the region mapping in my sheet."
- "Compare this client's cost per conversion against the portfolio average for their vertical."
- "Which retainer tier is generating the best return on managed spend?"
Reconciliation and troubleshooting
Try these prompts:
- "My sheet shows a different spend number than Google Ads for last month. Show me a day-by-day breakdown of both so I can see where they split."
- "Are there any rows in my connected sheet with missing dates or blank metric values?"
- "Which of my sources are broken or stale right now?"
- "Is the date range on this report actually covering the full range of dates in my sheet?"
- "Are any filters applied to this report that would exclude part of my sheet data?"
Client reporting and executive summaries
Ask for the write-up before the call rather than after it. This is where automated reporting stops being a scheduled PDF and starts being an answer you can act on.
Try these prompts:
- "Write a three paragraph performance summary for this client covering this month versus last, leading with the headline result, then the two biggest drivers, then one recommendation."
- "Summarize how every client in this Space performed against the targets in my sheet, in a table."
- "Build a report tab comparing planned versus actual spend by channel, and pick a chart type that makes the gap obvious."
- "Give me five bullet points on this client's performance for a call in ten minutes."
- "Which clients improved most week over week, and which declined?"
If the deliverable itself is the thing you need, branded and scheduled rather than sitting in a chat, that's what the Google Sheets reporting tool handles, built on the same connected sheet.
Want the same setup for your ad platforms? See the Google Ads MCP guide, or the roundup of the best MCPs for marketing.
Conclusion
Connecting Google Sheets to Claude takes minutes. Getting answers you'd put in front of a client takes a bit of setup first.
Sort out the sheet, define what your metrics actually mean, blend it with the channels it belongs next to, and the AI stops guessing at your business logic every time you ask it something.
Start a 14-day free trial with Whatagraph, connect your sheet alongside everything else you run, and see whether the numbers hold up.
Want a walkthrough on your own data instead? Book a demo with our team.
Published on Aug 07 2026
WRITTEN BY
YamonYamon is a Senior Content Marketing Manager at Whatagraph. With an eye for detail and a knack for always considering context, audience, and business goals to guide the narrative, she's on a mission to create genuinely helpful content for marketers. When she’s not working, she’s hiking, meditating, or practicing yoga.