Marketing agency reporting: examples, KPIs, templates & best practices

Nov 12 2026●15 min read


- Key takeaways
- What is marketing agency reporting?
- How do agencies streamline or scale client reporting? Examples of marketing agency reporting
- What are the core elements of a high-value client report?
- Which marketing agency KPIs and metrics should you track?
- Which marketing agency report templates should you start from?
- What are the best practices for agency reporting?
- What are the best reporting tools for agencies?
- What are the future trends in marketing agency reporting?
- The bottom line on marketing agency reporting
Reporting is one of the most important tasks in your marketing agency to retain clients and, if you do it right, even onboard new ones.
But it’s also the most tedious and time-consuming part of your work.
Which KPIs do you report on?
How do you structure reports so clients will stay engaged?
How do you streamline reporting so you’re not spending dozens of hours on it every month?
And how do you scale reporting as you grow?
These are the questions we’ll answer in this article. Skip straight to case studies how marketing agencies are scaling or streamlining reporting, or best practices from agency leaders.
Key takeaways
- Marketing agency reporting is the recurring process of pulling performance data from every channel an agency runs, such as Google Ads, Meta Ads, GA4 and Google Search Console, into one client report that shows results against targets and what the agency will do next.
- Agencies streamline reporting by cutting the time each report takes and scale it by serving more clients without adding reporting staff. GKV cut a typical report from 10-15 hours to about 4 with AI agents, and Dtch. Digitals onboarded 250+ clients in one month with one template per client segment.
- A high-value client report has five core elements: an executive summary with insights and next steps, goals vs. actuals, a cross-channel overview, a channel breakdown, and branding and delivery.
- Seven agency leaders share their best practices: start from the client's goal, show what each channel contributed, lead with the takeaways, turn every number into an action, write for the reader, catch red flags early and keep results visible between reports.
- For reporting tools, Whatagraph is the best fit for mid-to-large marketing agencies that want an all-in-one tool with native connectors, governed data layer, white-label reporting, and autonomous agents. Looker Studio is best for solo marketers and agencies working with only Google platforms. AgencyAnalytics and DashThis are great for smaller agencies with less than 10 clients, while Klipfolio is best for agencies with a dedicated technical team.
- Five future trends are changing agency reporting: hybrid build-and-buy stacks, AI agents doing the busywork while people make the calls, monitoring between reports, AI search visibility as a reporting line, and metric definitions as infrastructure.
What is marketing agency reporting?
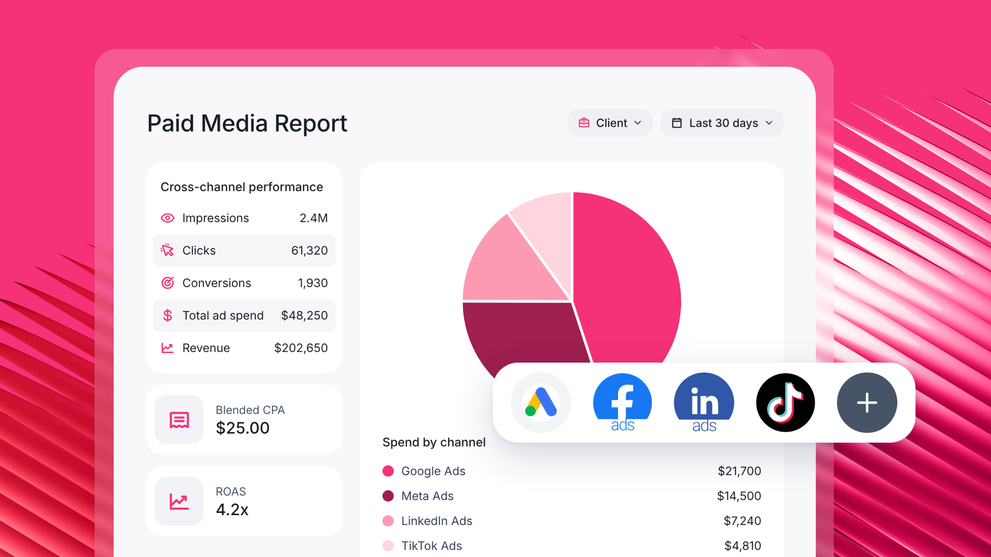
Marketing agency reporting is the recurring process of collecting performance data from every channel an agency runs for a client, turning it into a report or dashboard, and explaining what happened and what the agency will do next.
For a typical client, agencies pull data from Google Ads, Meta Ads, LinkedIn Ads, GA4 and Google Search Console, plus a CRM like HubSpot or a store like Shopify, into one report.
Agencies report to clients for three reasons:
- Prove the retainer. Show the client what their budget produced against the targets you agreed.
- Decide next month's spend. See which campaigns to scale, pause or fix.
- Catch problems early. Spot a broken tracking pixel, a disconnected ad account or a campaign that ran out of budget mid-month before the client asks about it.
The biggest issue with reporting is the opportunity cost of time.
Reporting is a huge timesucker. For instance, GKV, a Baltimore agency, used to spend 10-15 hours on each client's monthly report. Across 12 clients, that's 120-180 hours a month for a two-person analytics team, or three of every four weeks. Some clients got last month's report in the final week of the next one.
This is the time that you could spend on other things that move the needle for clients, like deeper analysis, new experiments, and proactive optimization.
Here's how agencies are reclaiming time back from reporting for things that matter.
How do agencies streamline or scale client reporting? Examples of marketing agency reporting
Agencies streamline client reporting by cutting the time each report takes. They scale it by serving more clients without adding people to the reporting team. These five marketing agency reporting examples show how, and all five run their reporting on Whatagraph.
How GKV got back 70+ hours a month to deliver deeper analysis and strategic recommendations for clients
GKV is a full-service communications agency in Baltimore. Two analysts, led by Anna Alexiadi Smyrniotaki, Director of Digital Analytics & Strategy, write monthly insights reports for 12 clients.
Each report used to take 10-15 hours. Reporting filled three of every four weeks, and some clients waited until late in the following month for their numbers. Anna knew what she wanted that time for:
“If the agents can complete monthly reporting in the first one or two weeks of the month, that could exponentially save us time. Then we have the rest of the month left to connect with stakeholders, answer ad-hoc questions, and do the more human and strategic parts of the job.”
To streamline the work, GKV built one specialist agent for each client with IQ Agents in Whatagraph.
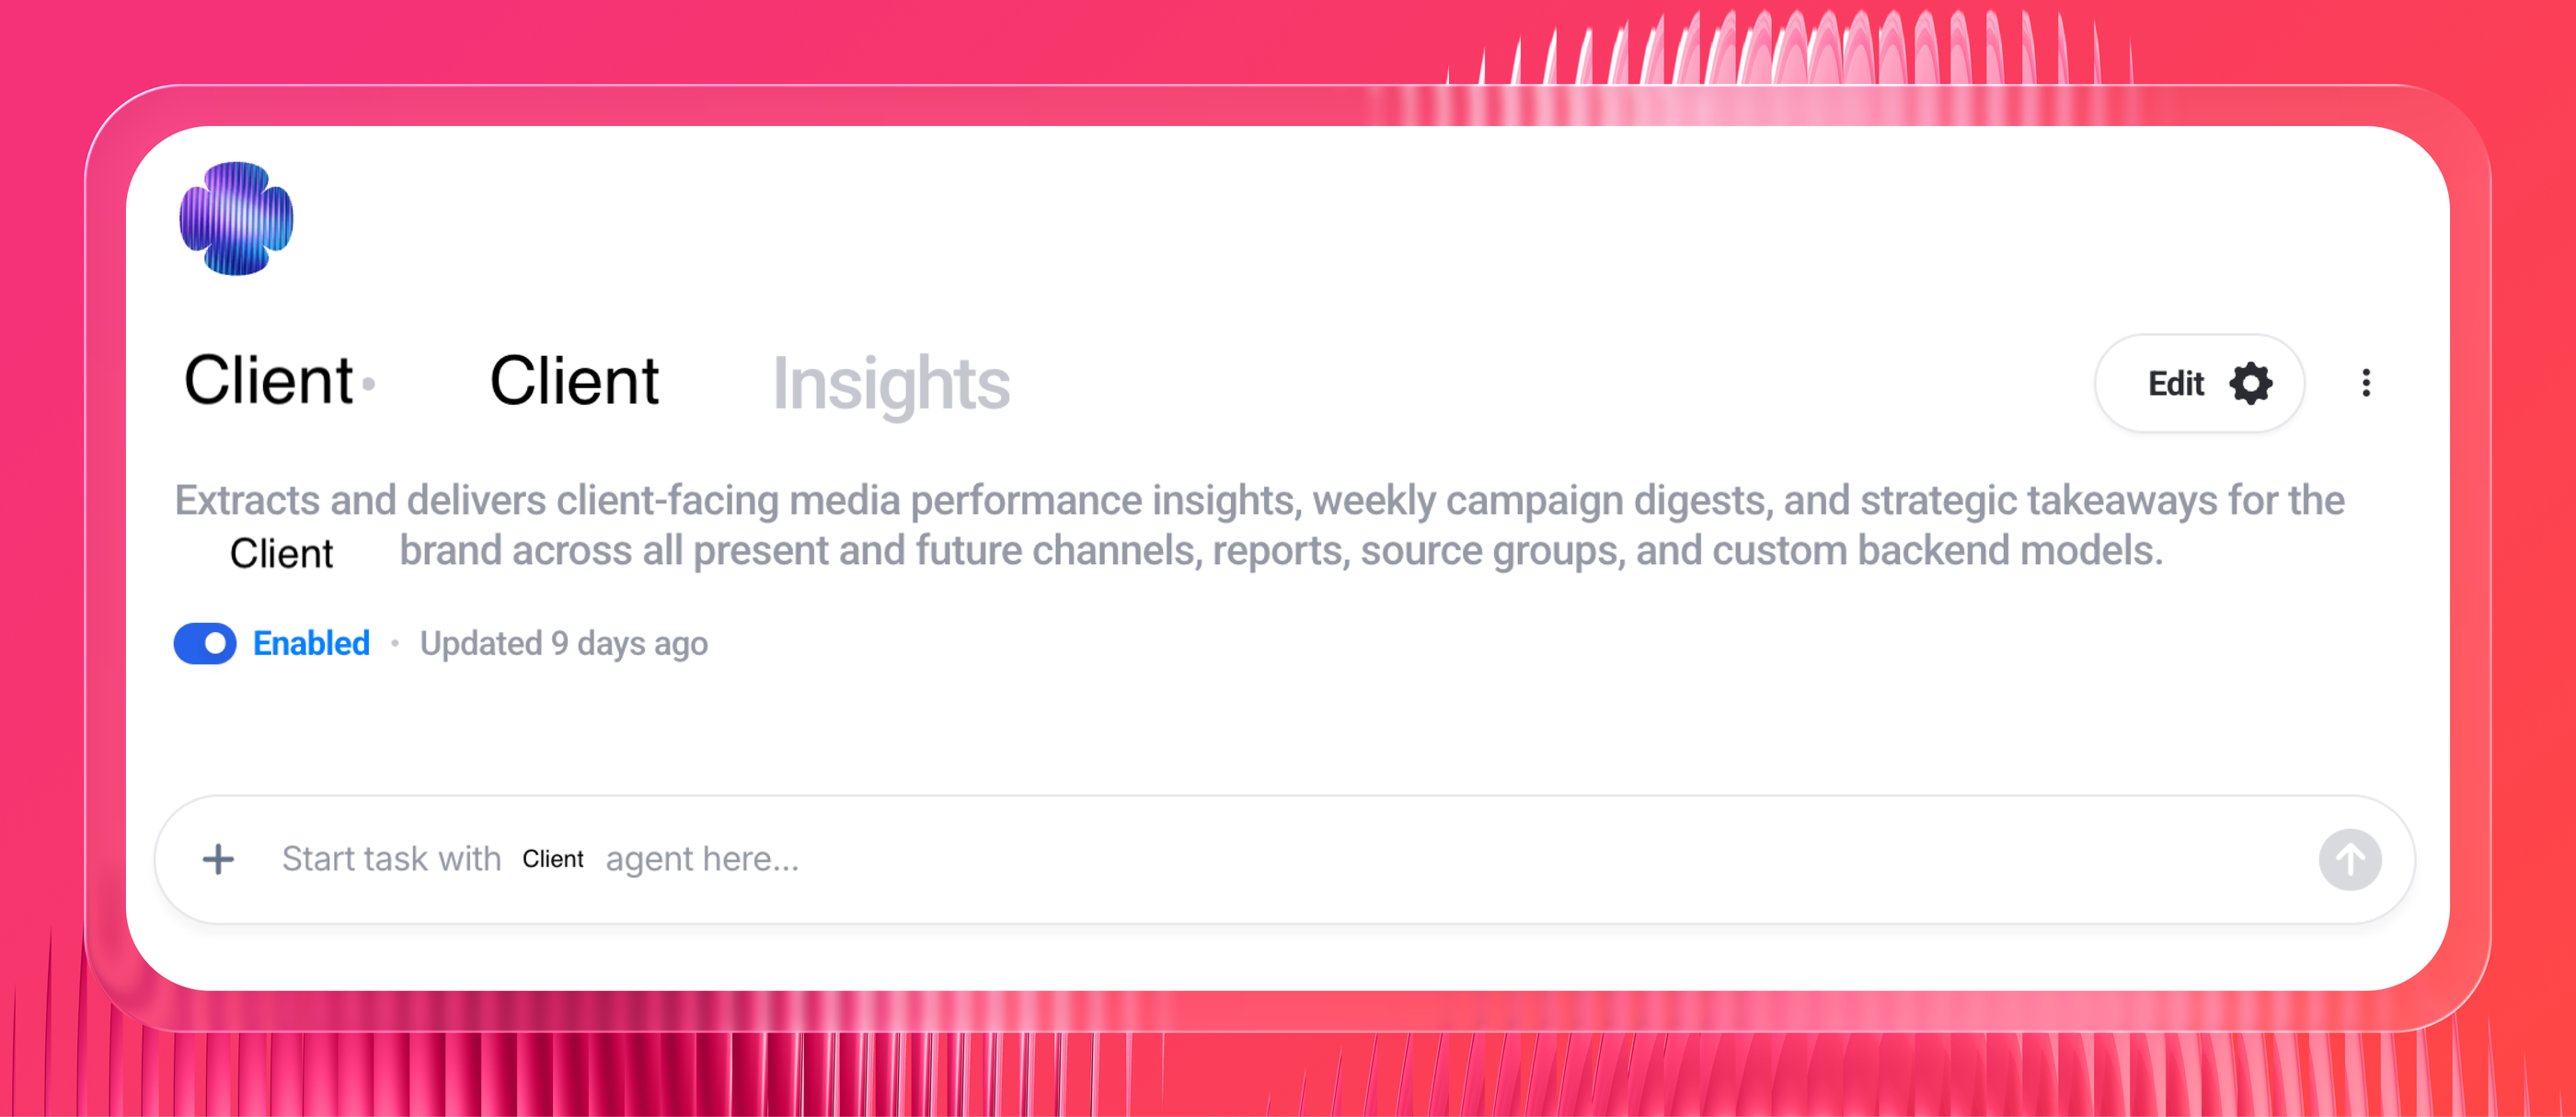
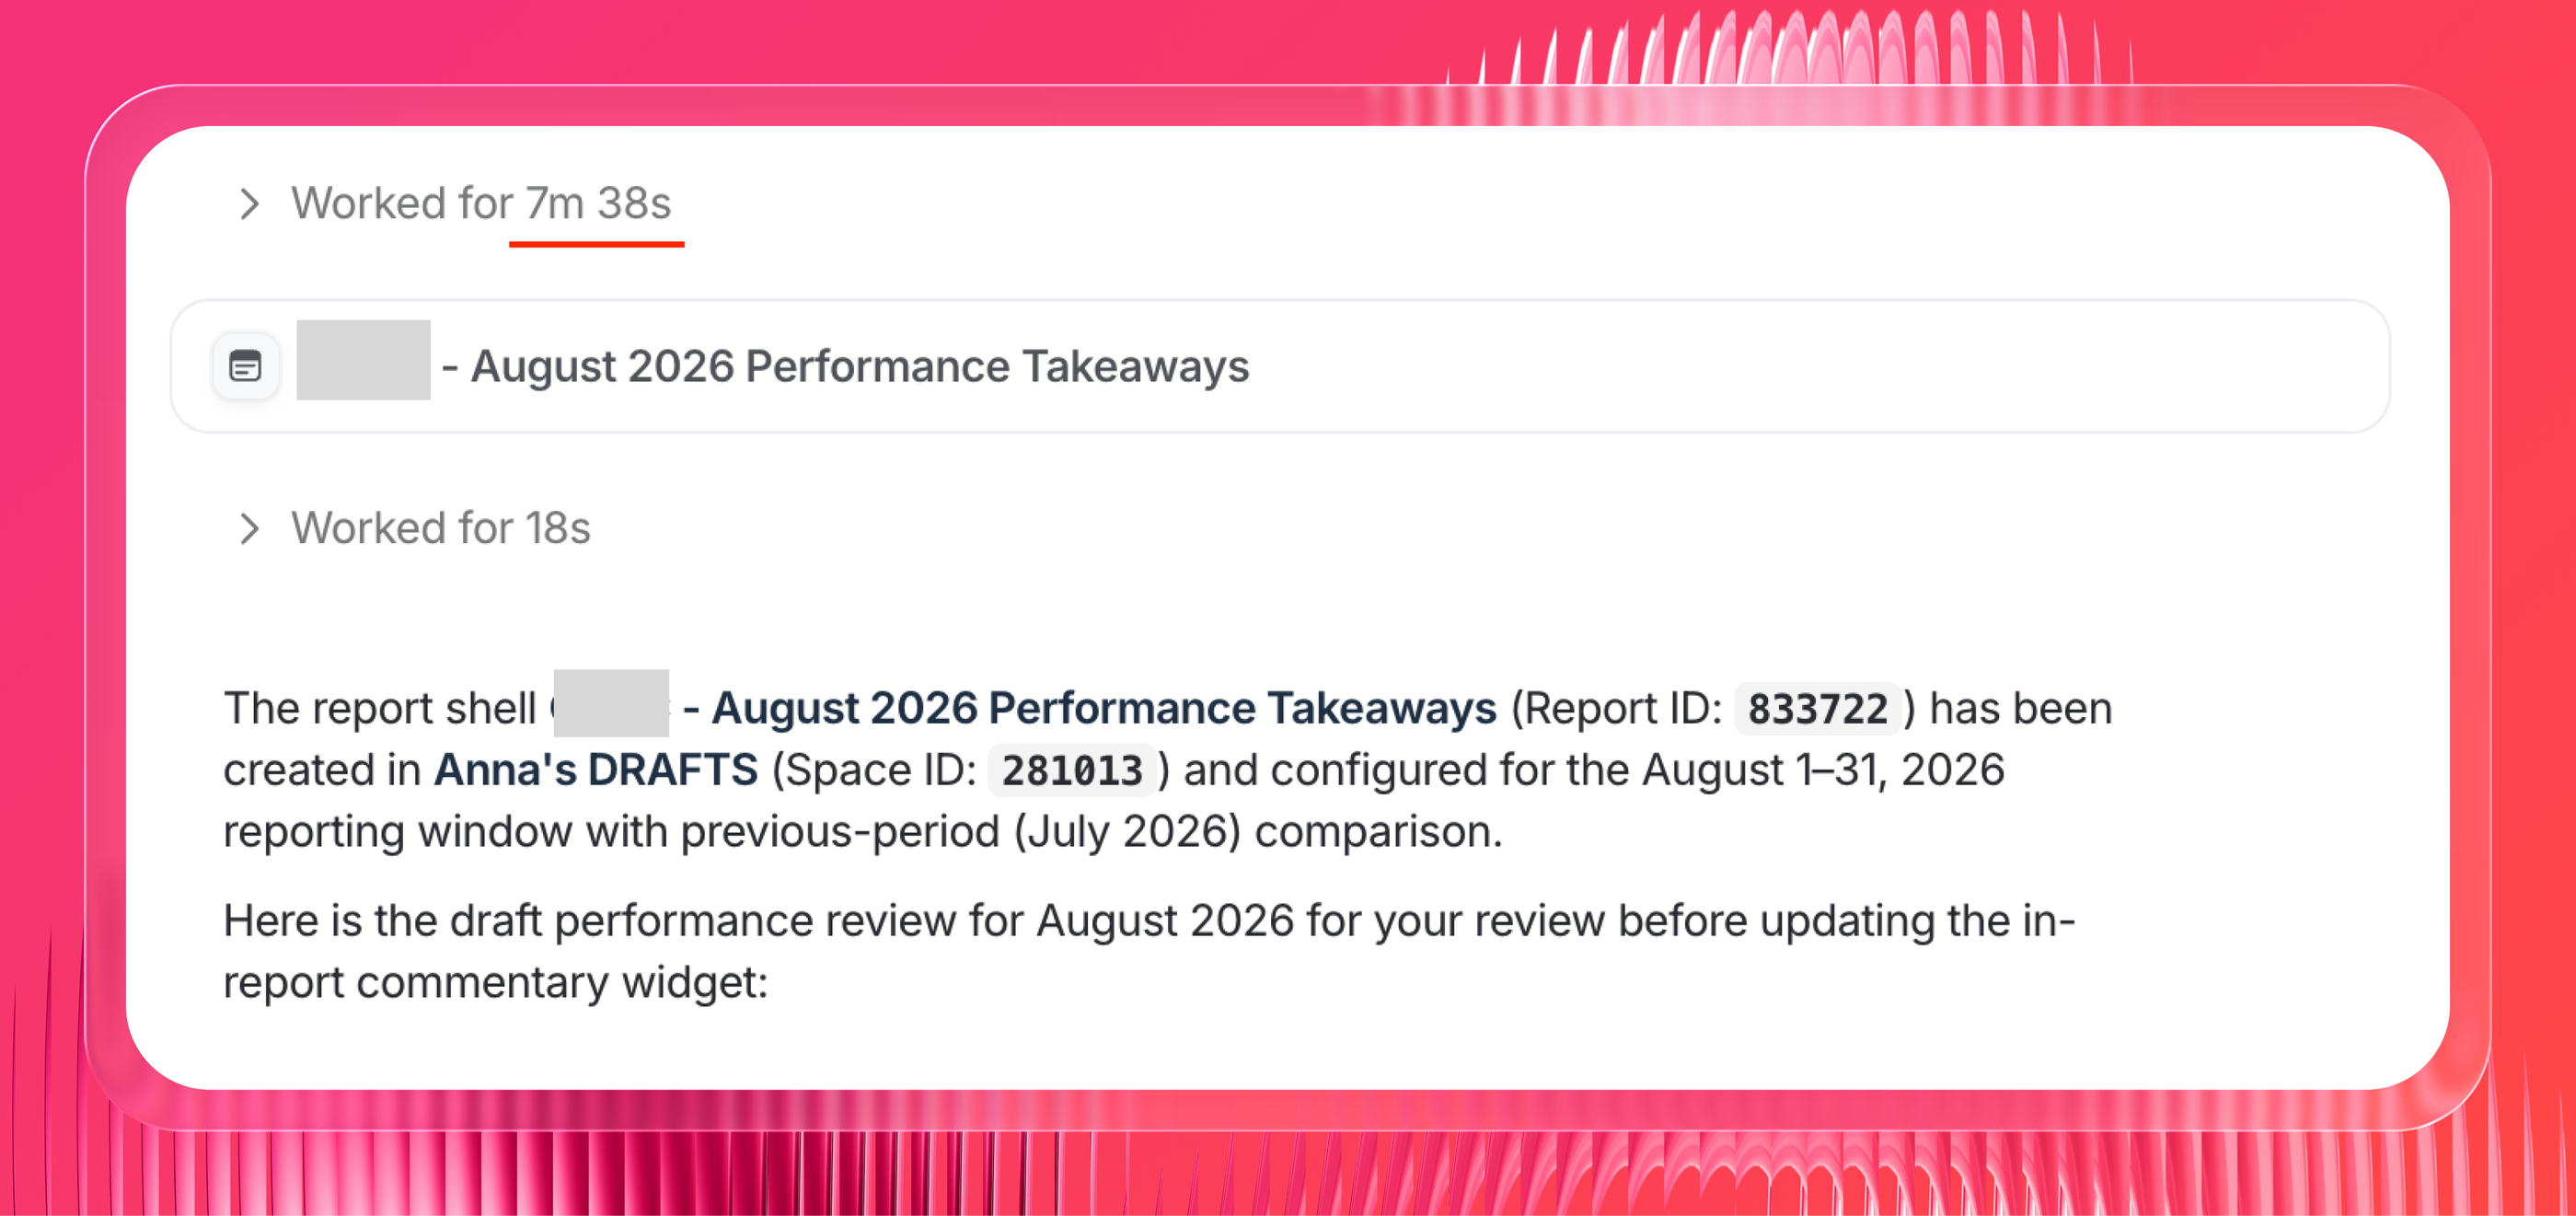
Each agent drafts its client's monthly report and commentary from the client's previous reports, connected data sources and campaign groupings, and the first draft is ready in about 7 minutes. The analysts review every draft and own every recommendation.
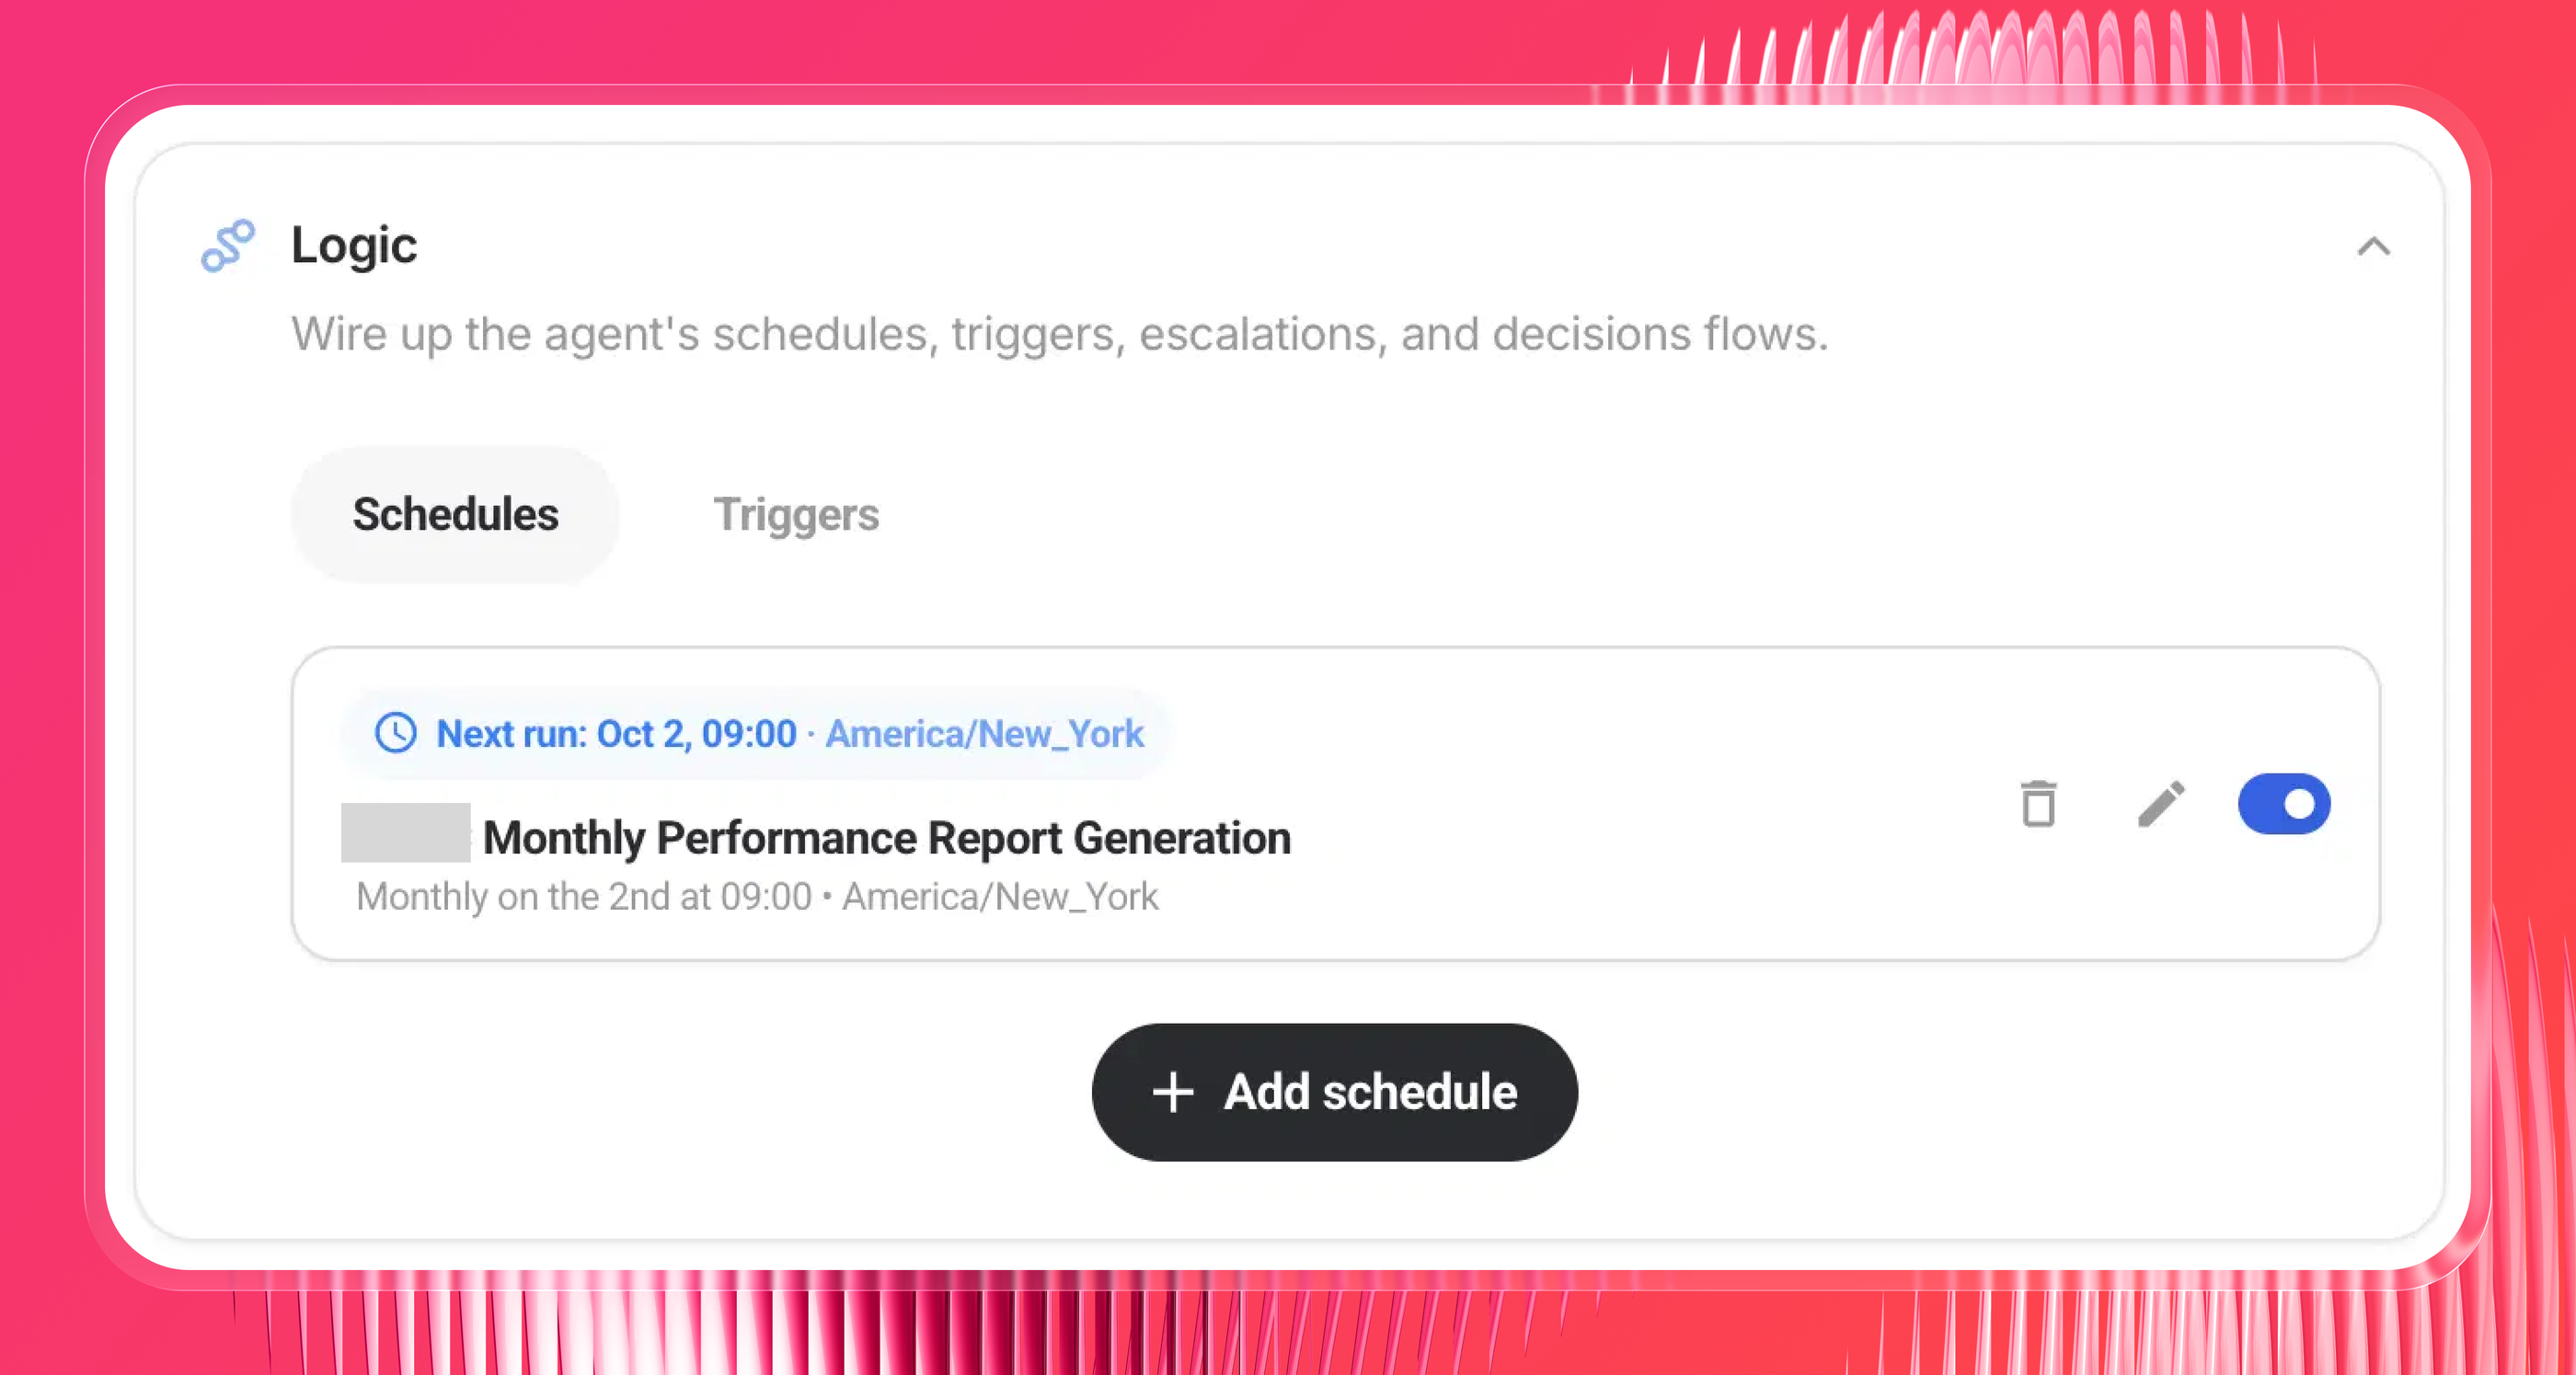
Anna then set the agent up to create reports on a schedule, on the 2nd of every month.
A typical report now takes about 4 hours with review. All 12 reports go out in 1-2 weeks instead of 3-4, and the same two analysts have 70+ hours a month back.
"Agents enable us to get started on monthly reporting from a rough draft of performance takeaways, so we can focus on curating deeper insights and more actionable recommendations."
How Maatwerk Online saves 100 hours a month and automates reporting with AI
Maatwerk Online is a full-service digital agency in Rotterdam with more than 100 clients. Its reports had grown far past what clients read. Co-founder Lars Maat said:
“I got the feeling we were actually rebuilding Google Analytics. There were so many metrics and so many tables that no one was using. That's not how reporting should be.”
Lars streamlined every report around three questions:
“Your reporting dashboard should always be about the main KPIs. Are we hitting targets? What are we spending? How much profit is that gaining?”
To scale that across 100+ clients, the team:
- Built four pillar templates (eCommerce, Leadgen, Branding and B2B) that work for 90% of clients with minimal tweaks
- Added a goal bar to every dashboard, showing each target and where the client stands today
- Introduced a report licensing fee for clients that now covers the full cost of reporting
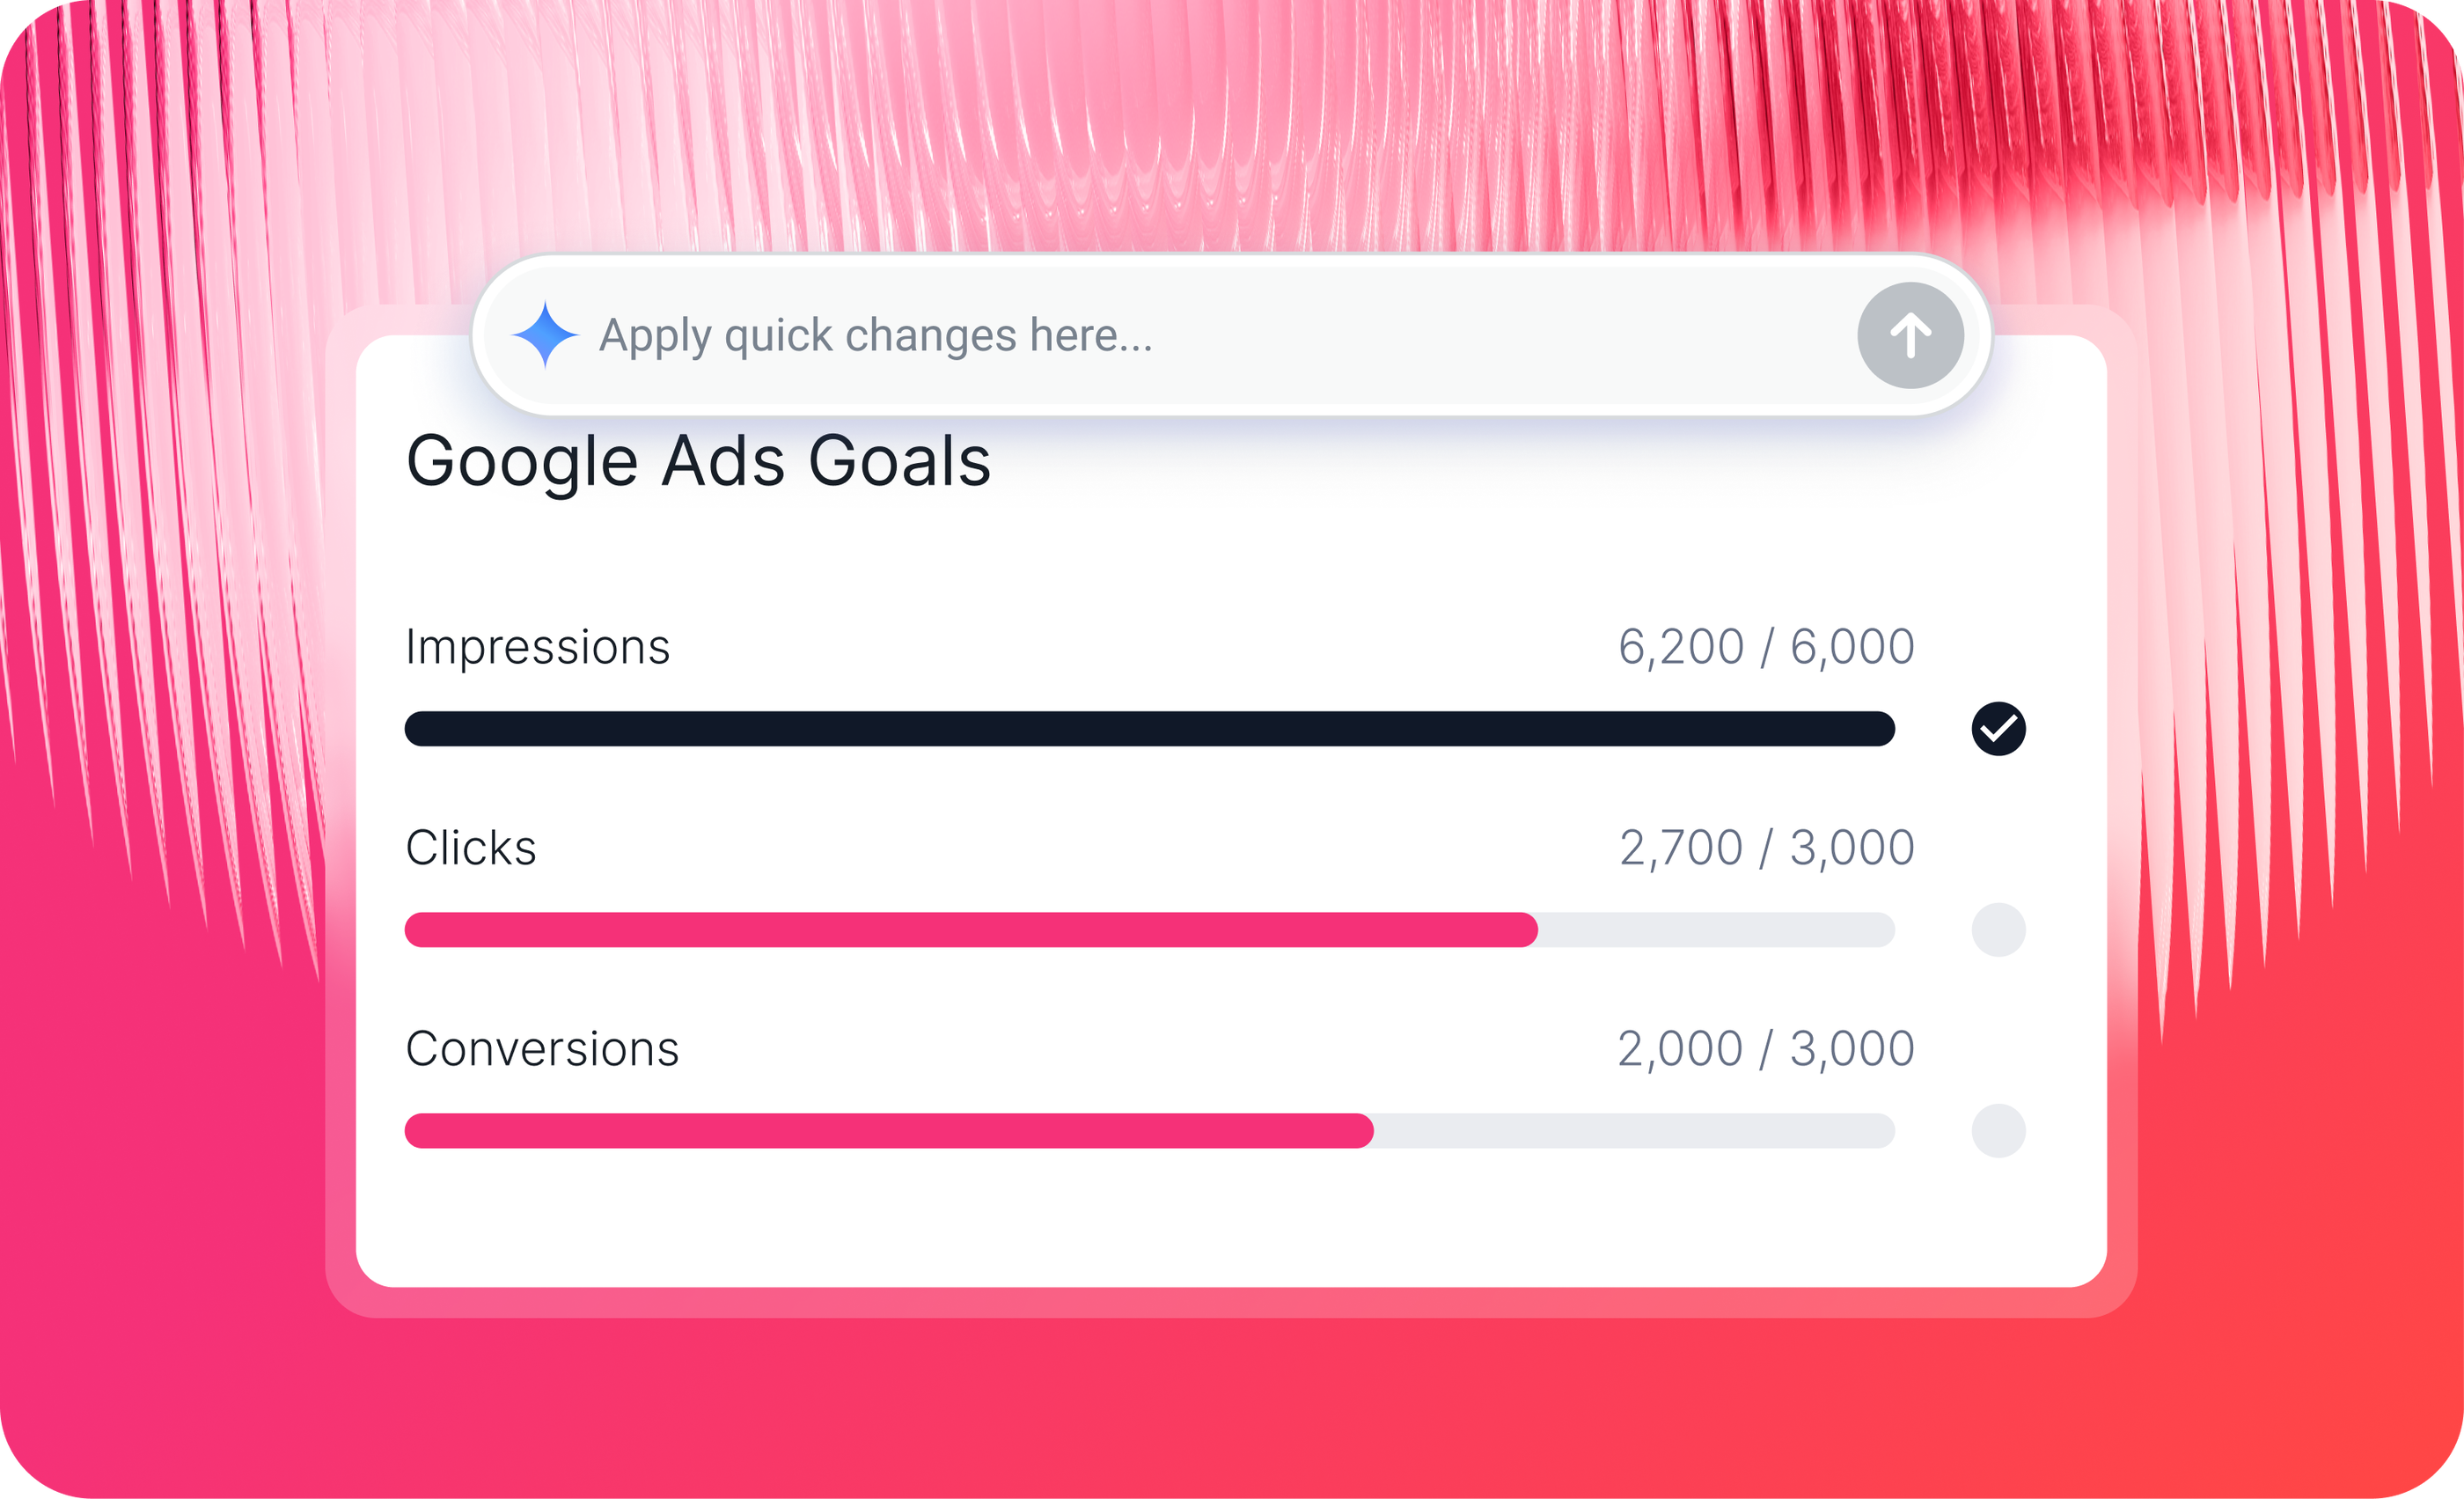
The agency now saves 100+ hours a month, at least one hour per client, and no longer pays for Supermetrics.
Read Maatwerk Online's full story.
How a five-person Dutch performance marketing team uses IQ Agents to make more room for proactive client work
This Dutch team gives every client a set number of specialist hours each week. Too many of those hours went to the same recurring work: preparing the weekly report, checking numbers and finding optimizations.
The team's co-owner had already built his own connections to the Meta Ads and Google Ads APIs, plus a library of skills and scripts. Keeping the connections alive became a job of its own:
“I can use the API from Meta Ads and the API from Google Ads, but it's a hassle. Every couple of months, they change how the connectors work, and then you have to update them.”
To streamline the weekly work, the team bought the data layer and kept the expertise. Whatagraph's connectors now feed the client reports, and every Monday IQ Agents run the team's own skills and scripts:
- An agent copies each client's weekly report template and fills it with last week's data
- A script scores every Meta Ads campaign and ad against the team's own criteria
- An agent drafts optimizations for the best and worst performers into the client report, in Dutch
- A specialist approves each optimization (and makes the change in Meta Ads Manager) or deletes it
The following Monday, the agent reads what the specialist kept and uses it as context for its next draft.
The team hasn't measured the time saved yet. What changed is where the hours go: specialists start each week from a reviewed shortlist, then spend their time on deeper analysis, new tests and proactive optimization. The co-owner said:
“Agents handle the low-hanging fruit, which frees up our specialists to tackle the bigger things and go deeper.”
How Dtch. Digitals scaled reporting and decreased client churn by 50%
Dtch. Digitals is a full-service agency with offices in the Netherlands and Germany. It grew to 85 team members and more than 340 clients, and reporting didn't keep up. Team members copied basic templates without adjusting each client's KPIs. Stef Oosterik, Quality Manager, said:
“The reporting process became a mess, and we really needed to clean it up. I was convinced that if we kept using the old tool, we wouldn't be able to scale up.”
Stef scaled reporting by standardizing it. The team built one template for each main client segment:
- E-commerce B2C
- E-commerce B2B
- Lead generation B2C
- Lead generation B2B
A basic report takes about 30 minutes, and client-specific KPIs add one to two hours. Every client gets a monthly report plus a link to a live dashboard.
With the templates in place, the team onboarded 250+ clients in one month, and new hires create on-brand client reports in minutes. Client churn dropped by 50%.
Read Dtch. Digitals' full story.
How Peak Seven saved 63 hours a month and democratized insights for clients and teams
Peak Seven is a Florida advertising agency that generates leads for franchise businesses and sends 25 client reports a month.
No one owned those reports, so reporting often fell through the cracks between the Accounts and Digital teams. The Looker Studio setup made it worse. Kim Strickland, Digital Marketing Specialist, said:
“Looker Studio was slow and always breaking. The data wouldn't pull through, or it would pull through incorrectly. It was just time consuming, frustrating, and a constant guessing game.”
Peak Seven made Kim the owner of reporting. To scale, she built one master template for franchise clients that report on the same metrics. Onboarding a new client now means swapping in its data sources, not building a new report.
Each report got faster too: 1.5 hours or less instead of 4. Across 25 reports, that's 63 hours a month back. The reports now feature in Peak Seven's new-client pitches, and they helped the agency keep clients it was close to losing. Kim said:
“There were clients we were on the verge of losing. But being able to show exactly how we're performing, why it's better, and that it's because of us has made a huge difference.”
What are the core elements of a high-value client report?
A high-value client report has five core elements, in this order:
- Executive summary, insights, and next steps
- Goals vs. actuals
- Cross-channel overview
- Channel breakdown
- Branding and delivery
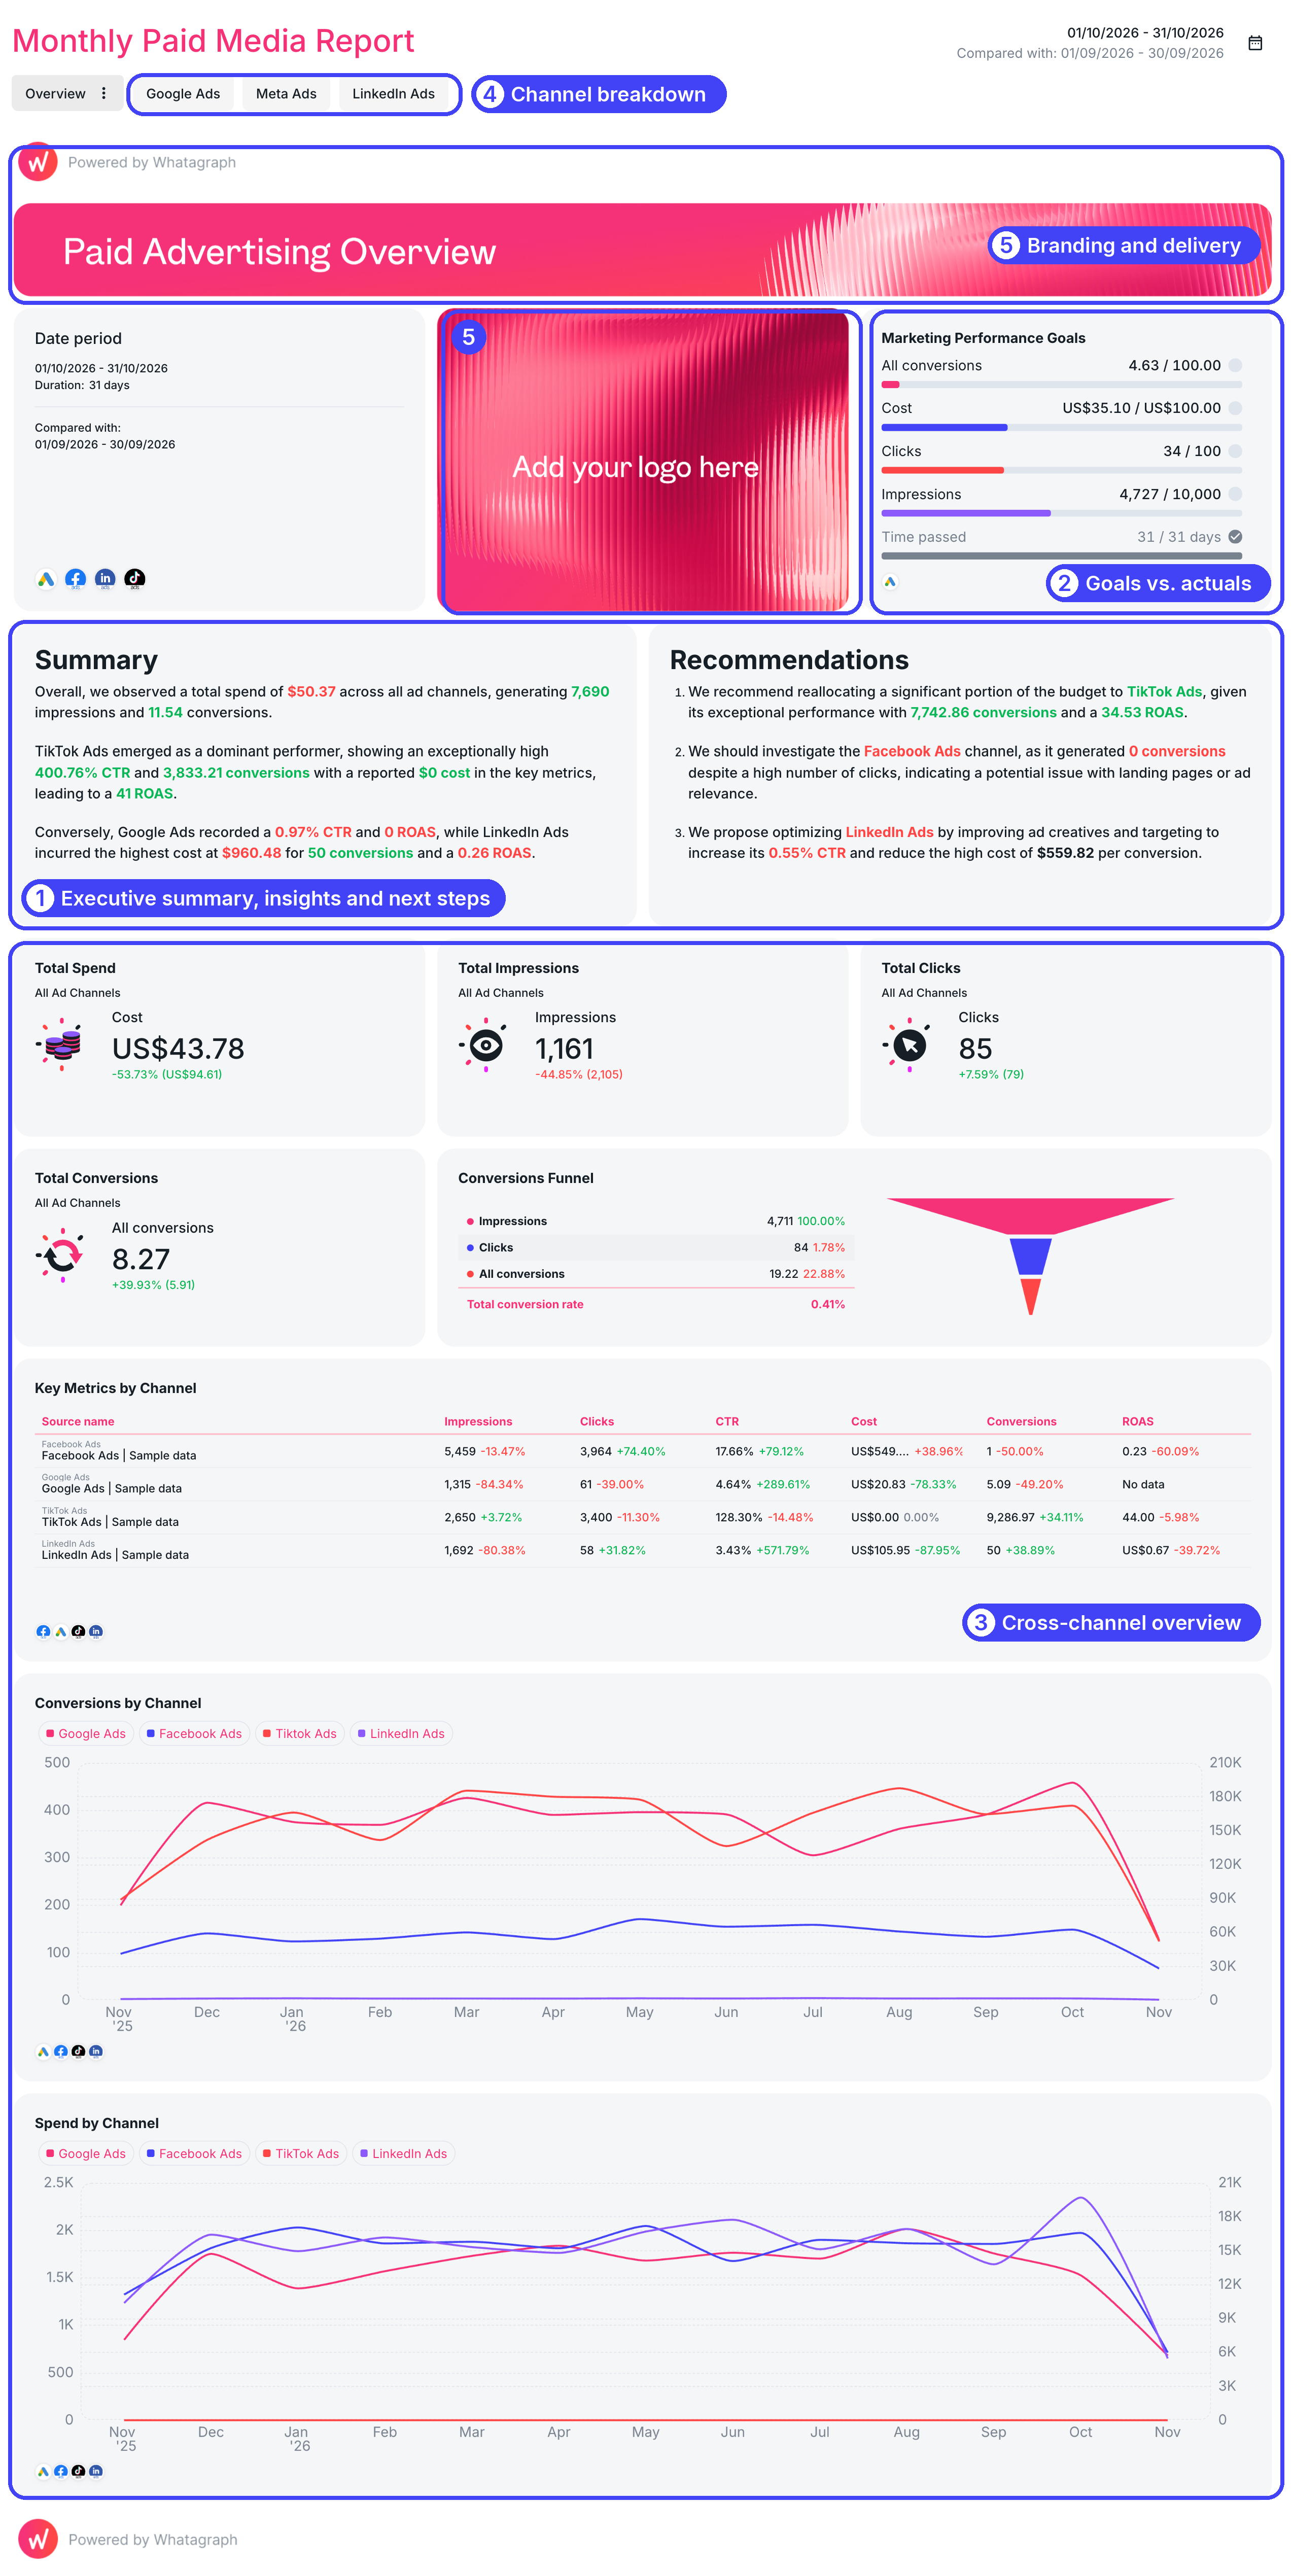
Want to see these elements in full reports? Browse these PPC reporting examples.
Executive summary, insights, and next steps
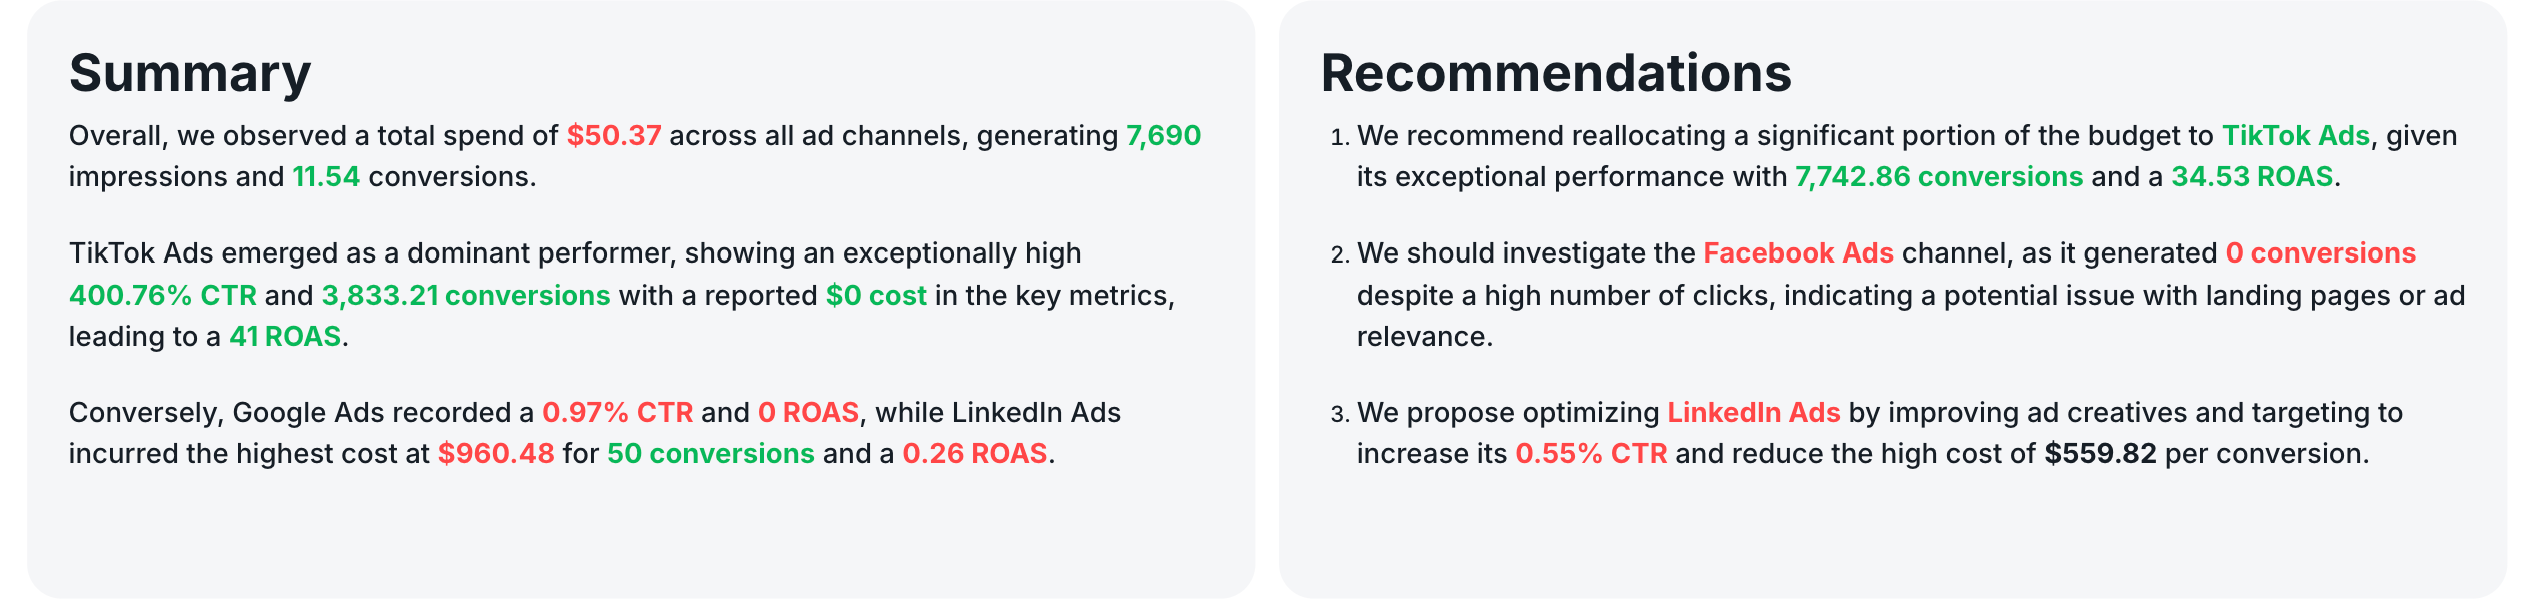
The executive summary is three or four lines at the top of the report: what happened, why it happened, and what you'll do next. Write it for the client who only reads the first page.
Lead with the result the client cares about most (“Leads were up 18% against target”), not the channel you spent the most time on.
Insights are the most time-consuming part of the report. André Cardoso, Project and Performance Marketing Manager at Wise Pirates, said:
“I'd say in 60-70% of the reports we create, writing out the insights takes the most time.”
In Whatagraph, you can get AI agents to write the first draft of your insights, and then review and tweak it before sending it to clients.
For example, a UK full-service agency streamlined the first draft of insights for 50+ reports.
This agency runs one specialist per service line: SEO, PPC and email. Their reports already refreshed with new data every month. But each specialist still needed to do the analysis in Claude and copy the insights back to the reports manually.
This setup worked but there's still recurring manual work and the setup lived in just one specialist's Claude chat.
The SEO lead at the agency built a narrative agent on Whatagraph IQ Agents to write the first draft of commentary.
He instructed the agent to:
- Write the commentary in the agency's house style: positive sentiment in green, data call-outs in red.
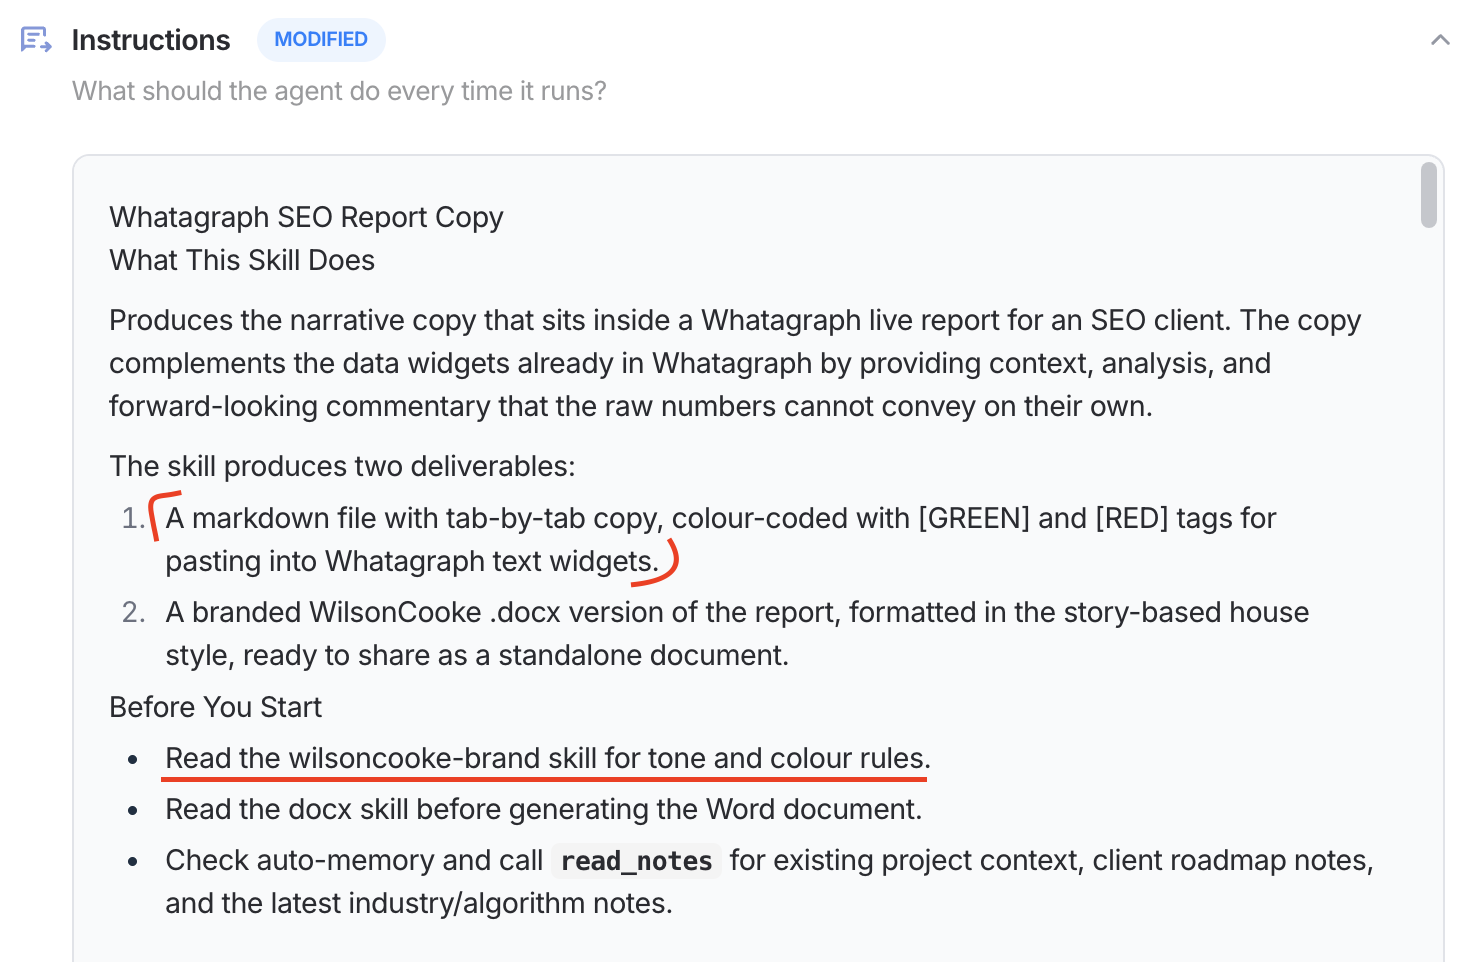
- Carry forward the recommendations from the previous report and prioritize next month's recommendations by effectiveness.
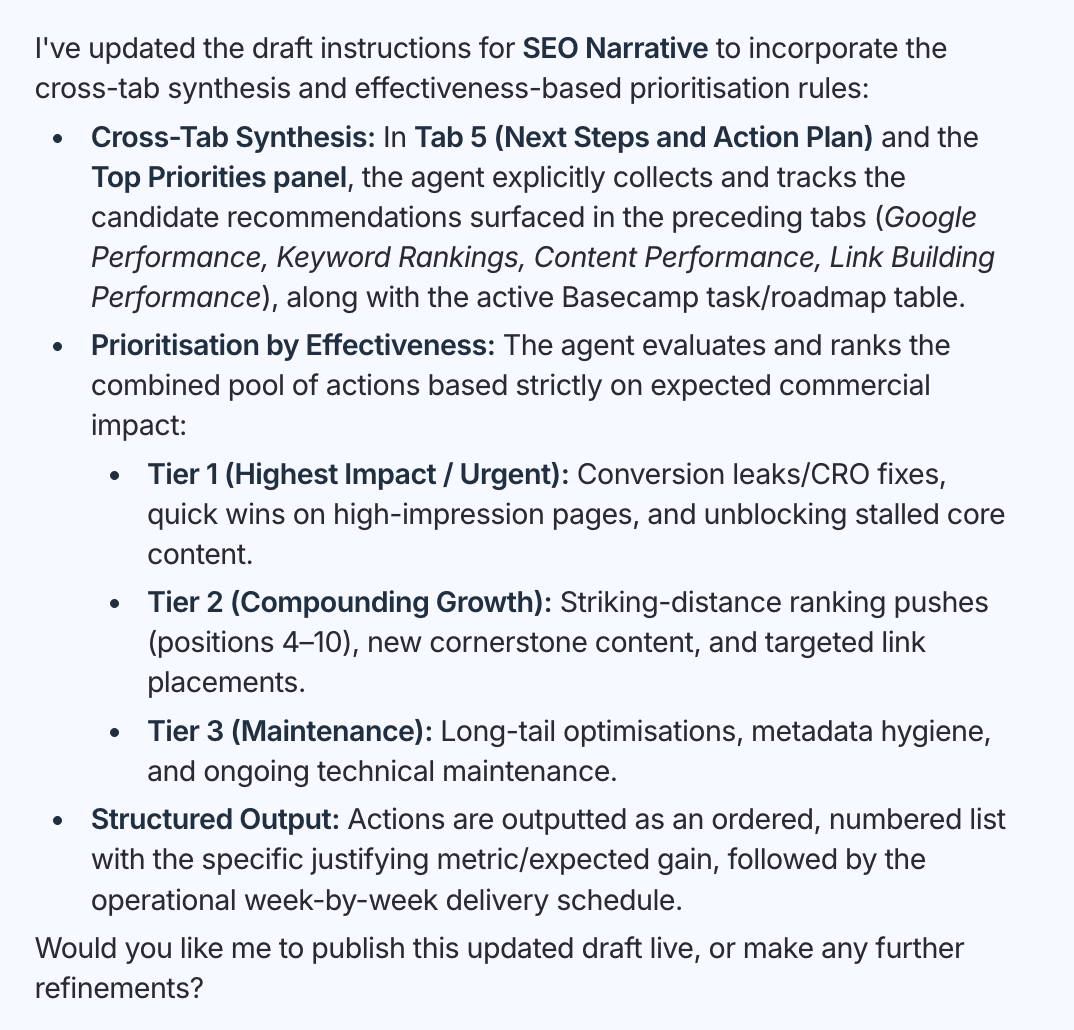
- Do a weekly scan of the latest SEO news, save it to the agent's memory, and use this context to explain the data in the next month's report.
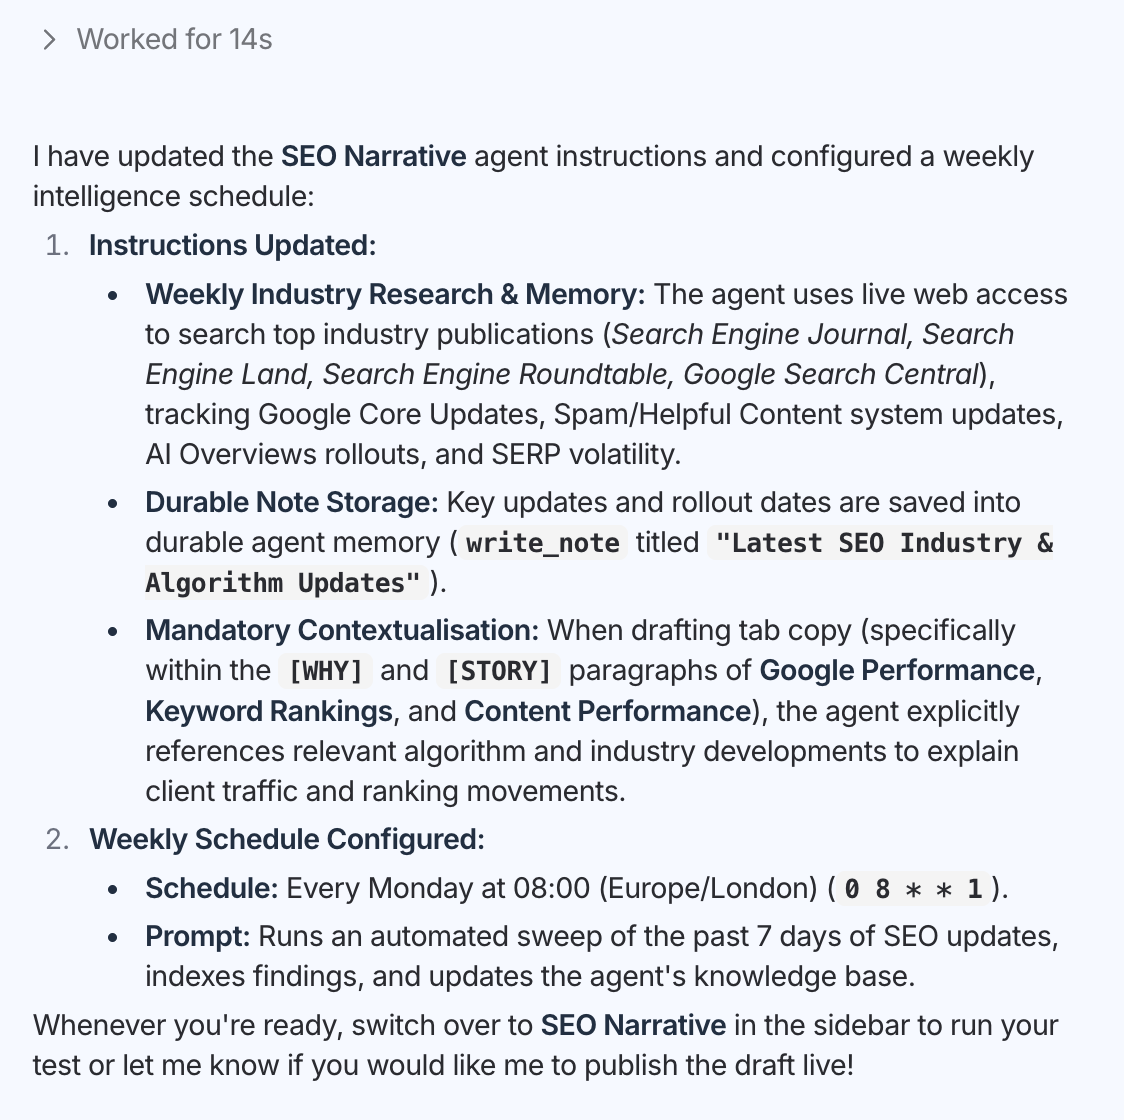
Then the SEO lead replicated this agent across their other service lines: PPC and email.
When he went on annual leave, the agency's managing director used the agents to create 50+ performance reports, with full commentary in the agency's house style and the full context. She then reviews everything and signs reports off before they go to clients.
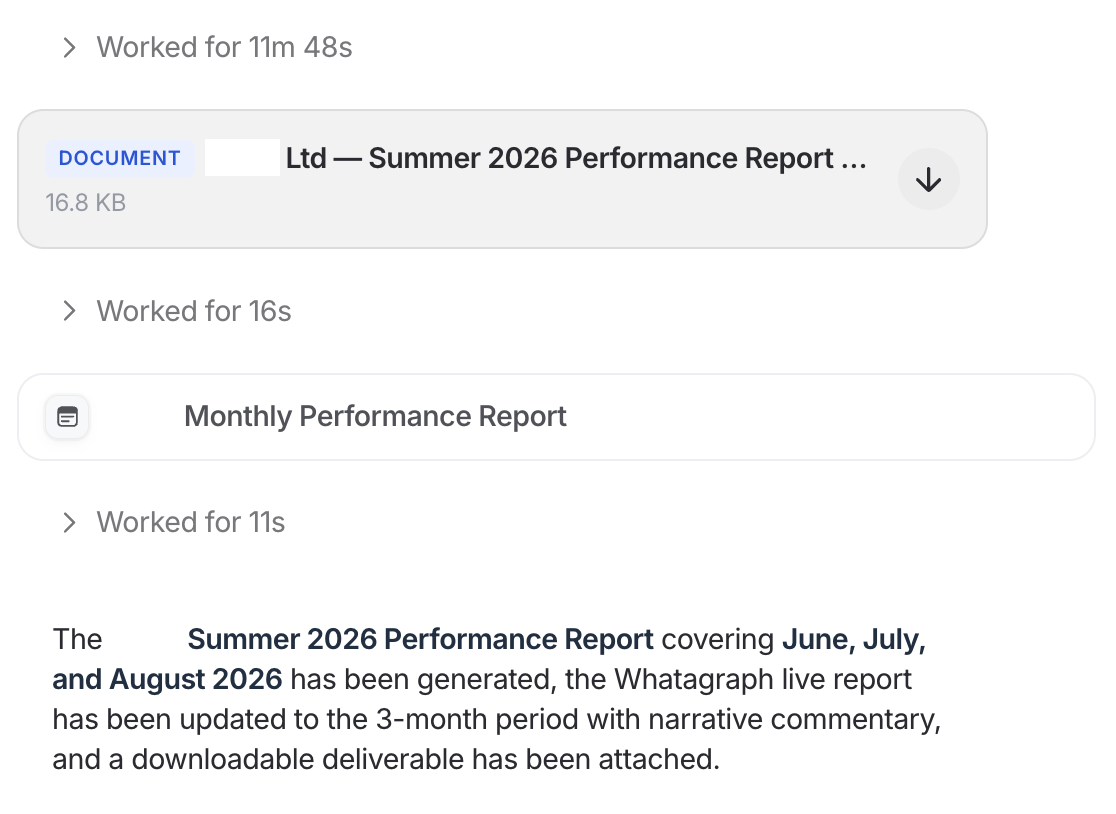
Each report now takes one and a half to two hours, including the specialist's review. Across 50+ reports a month, that's more than 150 hours back for analysis.
The agency's Head of SEO said:
“Whatagraph IQ Agents pull the data together and get a first draft of reports in our house style. That frees our specialists to do what clients value most: reading the numbers against what's happening in their sector and advising them what to do next. Every report is still reviewed and signed off by someone who knows the client.”
At Dtch. Digitals agency, every number comes with an explanation. Stef Oosterik said:
“We make sure the figures in the dashboard are always paired with an explanation from our specialists.”
Tie each insight to a number in the report:
- What happened (CPA rose 22% on Meta Ads)
- Why it happened (two top ads hit high frequency)
- What you'll do (rotate in new creative and shift budget to Google Ads search)
Goals vs. actuals
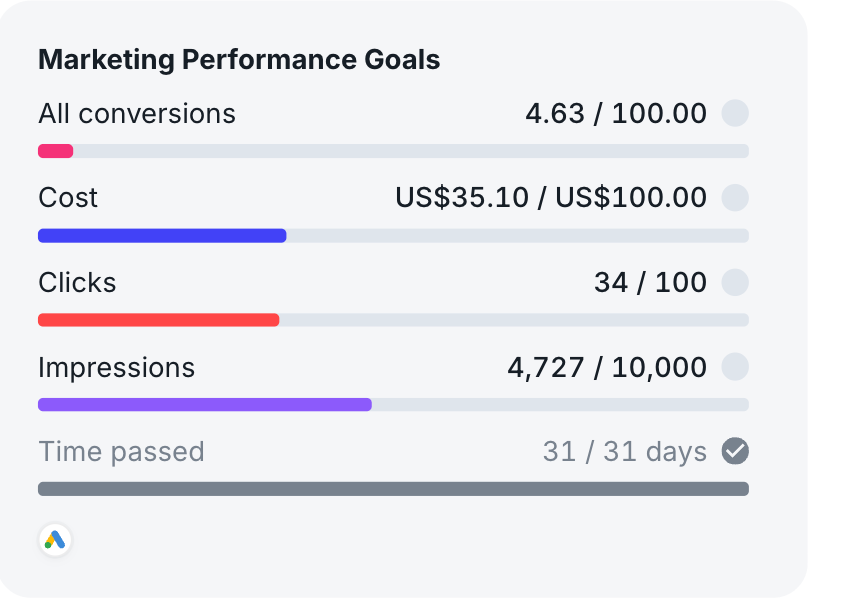
Goals vs. actuals show progress against the targets you agreed with the client: leads against the monthly lead target, spend against budget, ROAS against the floor you set.
In fact, goal pacing is Patrick Cumming's, Founder of Ad Juice, favorite graph.
“The main graph I use is goal-pacing. It tracks where we're at for our KPI on each metric vs where we should be over time. That way I can tell if we're on track or off-track to hit our KPI goal for the quarter.”
Anton Kovalchuk, Digital Marketer and Manager at QliqQliq, ties every goal back to money:
“Every report, in my practice, relates ad performance directly to revenue or cost efficiency, hence letting clients see where the value really lies in their ads spend.”
In Whatagraph, goals sit inside the report:
- Goal widgets show each KPI against its target, like the goal bars Maatwerk Online adds to every client dashboard.
- Goals and alerts notify your team in Slack or by email when a KPI goes off track.
- Budget pacing agents check spend against each client's budget on a schedule and flag campaigns that are overspending or underspending.
Cross-channel overview
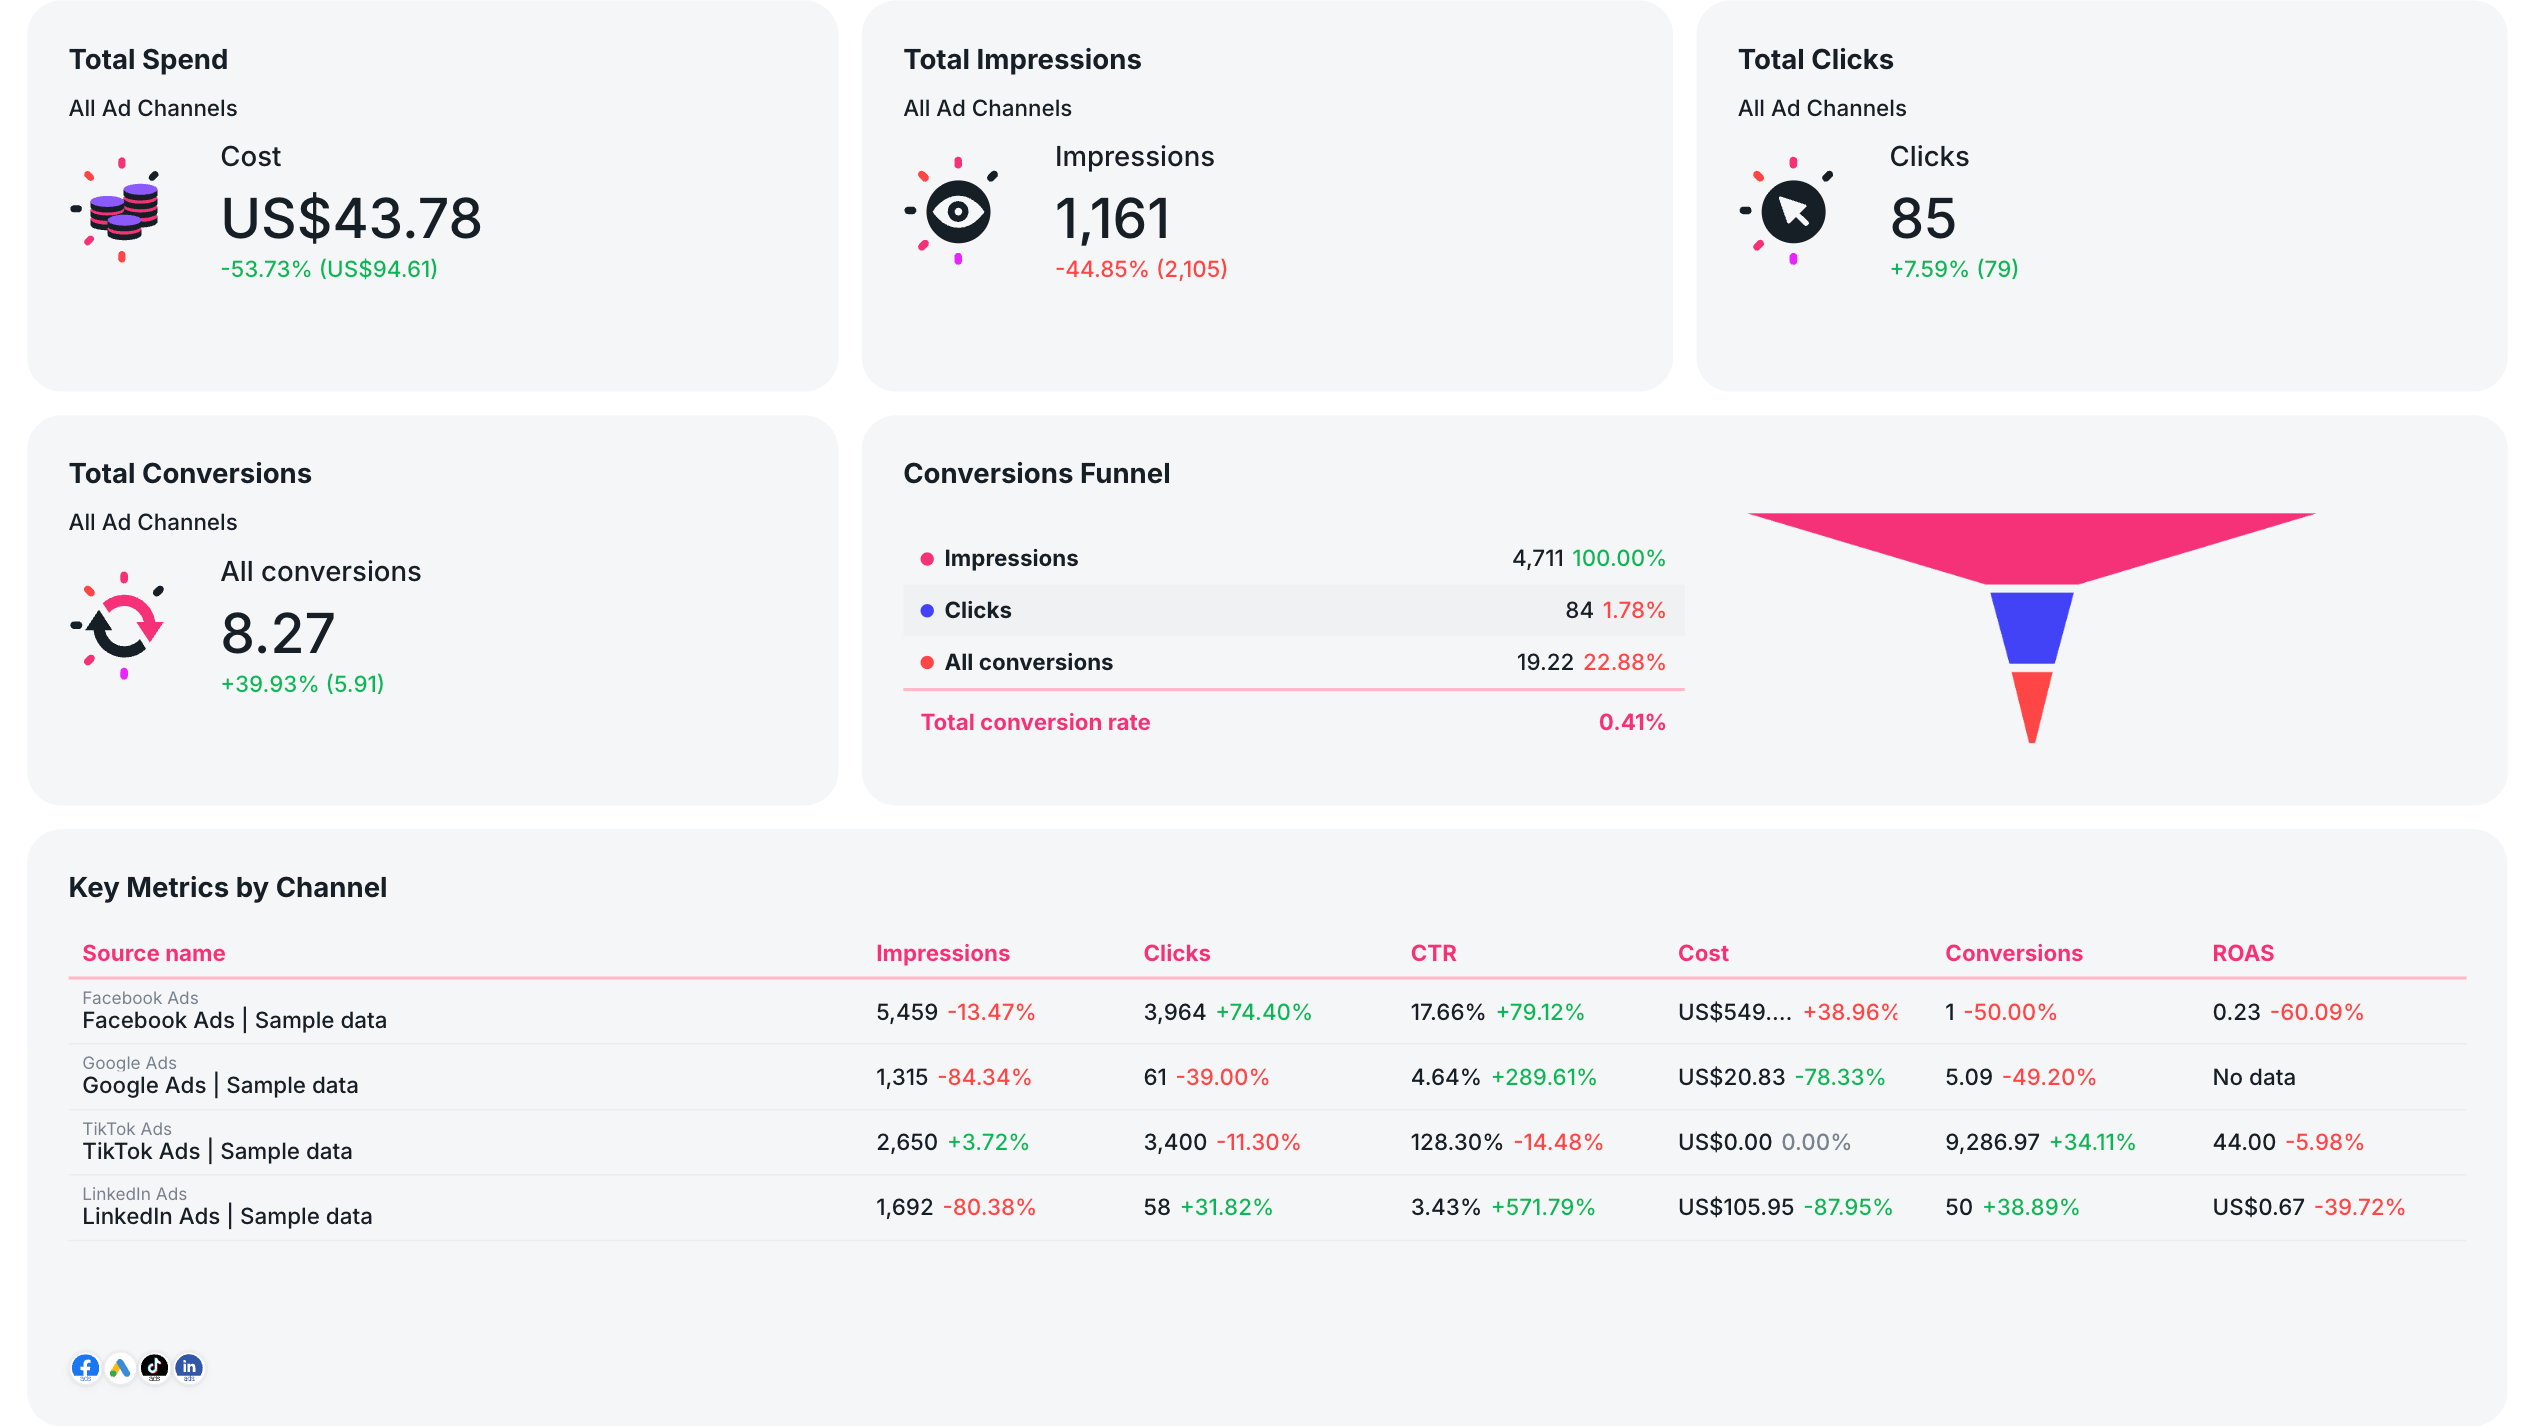
The cross-channel overview shows blended results across every channel first: total spend, total conversions, and blended CPA or ROAS. The channel breakdowns follow, one per platform.
Ryan Anderson, President of Markiserv, builds his reports in that order:
“The look of the overall report generally highlights revenue at the forefront, or what the client views as their top item to track for conversion. After this, we offer supporting metrics in the order they appear on the conversion funnel.”
But the tricky part is to combine the data from different channels without tinkering with codes or scripts, and it gets trickier when you have dozens of data sources and channels.
In Whatagraph, you can build your cross-channel view with agents or manually with simple workflows. Here's what you can do:
- Blend data from different platforms, such as Google Ads and Meta Ads, into one view, joined on date or campaign, with no SQL.
- Combine several accounts from the same platform, such as a client's regional Google Ads accounts, into one source.
- Create custom metrics like “blended ROAS”, save these metrics as templates, and add them to any report you create in seconds.
- Standardize campaign names across platforms, and filter the report by brand, location or campaign type.
- Add offline data with Google Sheets for sources that don't live in native platforms.
Tanja Keglić, Performance Marketing Manager at Achtzehn Grad, said this cross-channel view was the reason her agency switched to Whatagraph:
“We wanted to blend more sources together to see in one overview what's the performance and what we should change or adapt.”
Channel breakdown
The channel breakdown gives each channel its own section, so you can drill into its performance and see which campaigns, ads and creatives are working.
Each channel section covers:
- The channel's key metrics, such as spend, conversions and ROAS, plus any metrics you agreed with the client
- Tables that break down performance by campaign, keyword and ad
- The top-performing ads, ranked by the metrics the client cares about most
- Audience breakdowns for Meta Ads, LinkedIn Ads and TikTok Ads: age, gender, job title, seniority and location
In Whatagraph, each channel gets its own tab in the same report:
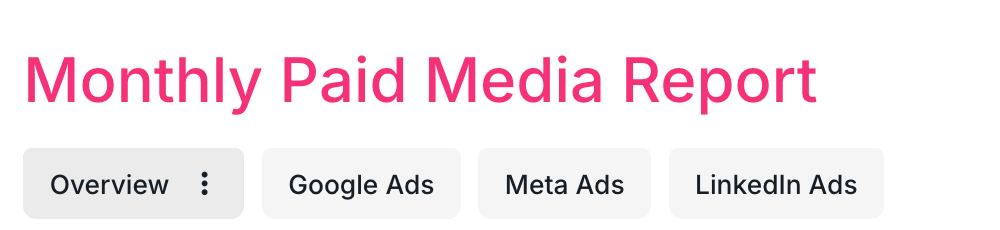
- One live link holds the cross-channel overview tab and a tab for each channel, so the client doesn't have to open five separate reports.
- Each tab can start from a pre-made template, such as the Google Ads report template or the PPC Reporting Hub templates, which use an overview tab followed by one tab per ad platform.
- Linked templates keep the same tabs across every client report. Edit the master report, and every linked report updates.
Branding and delivery
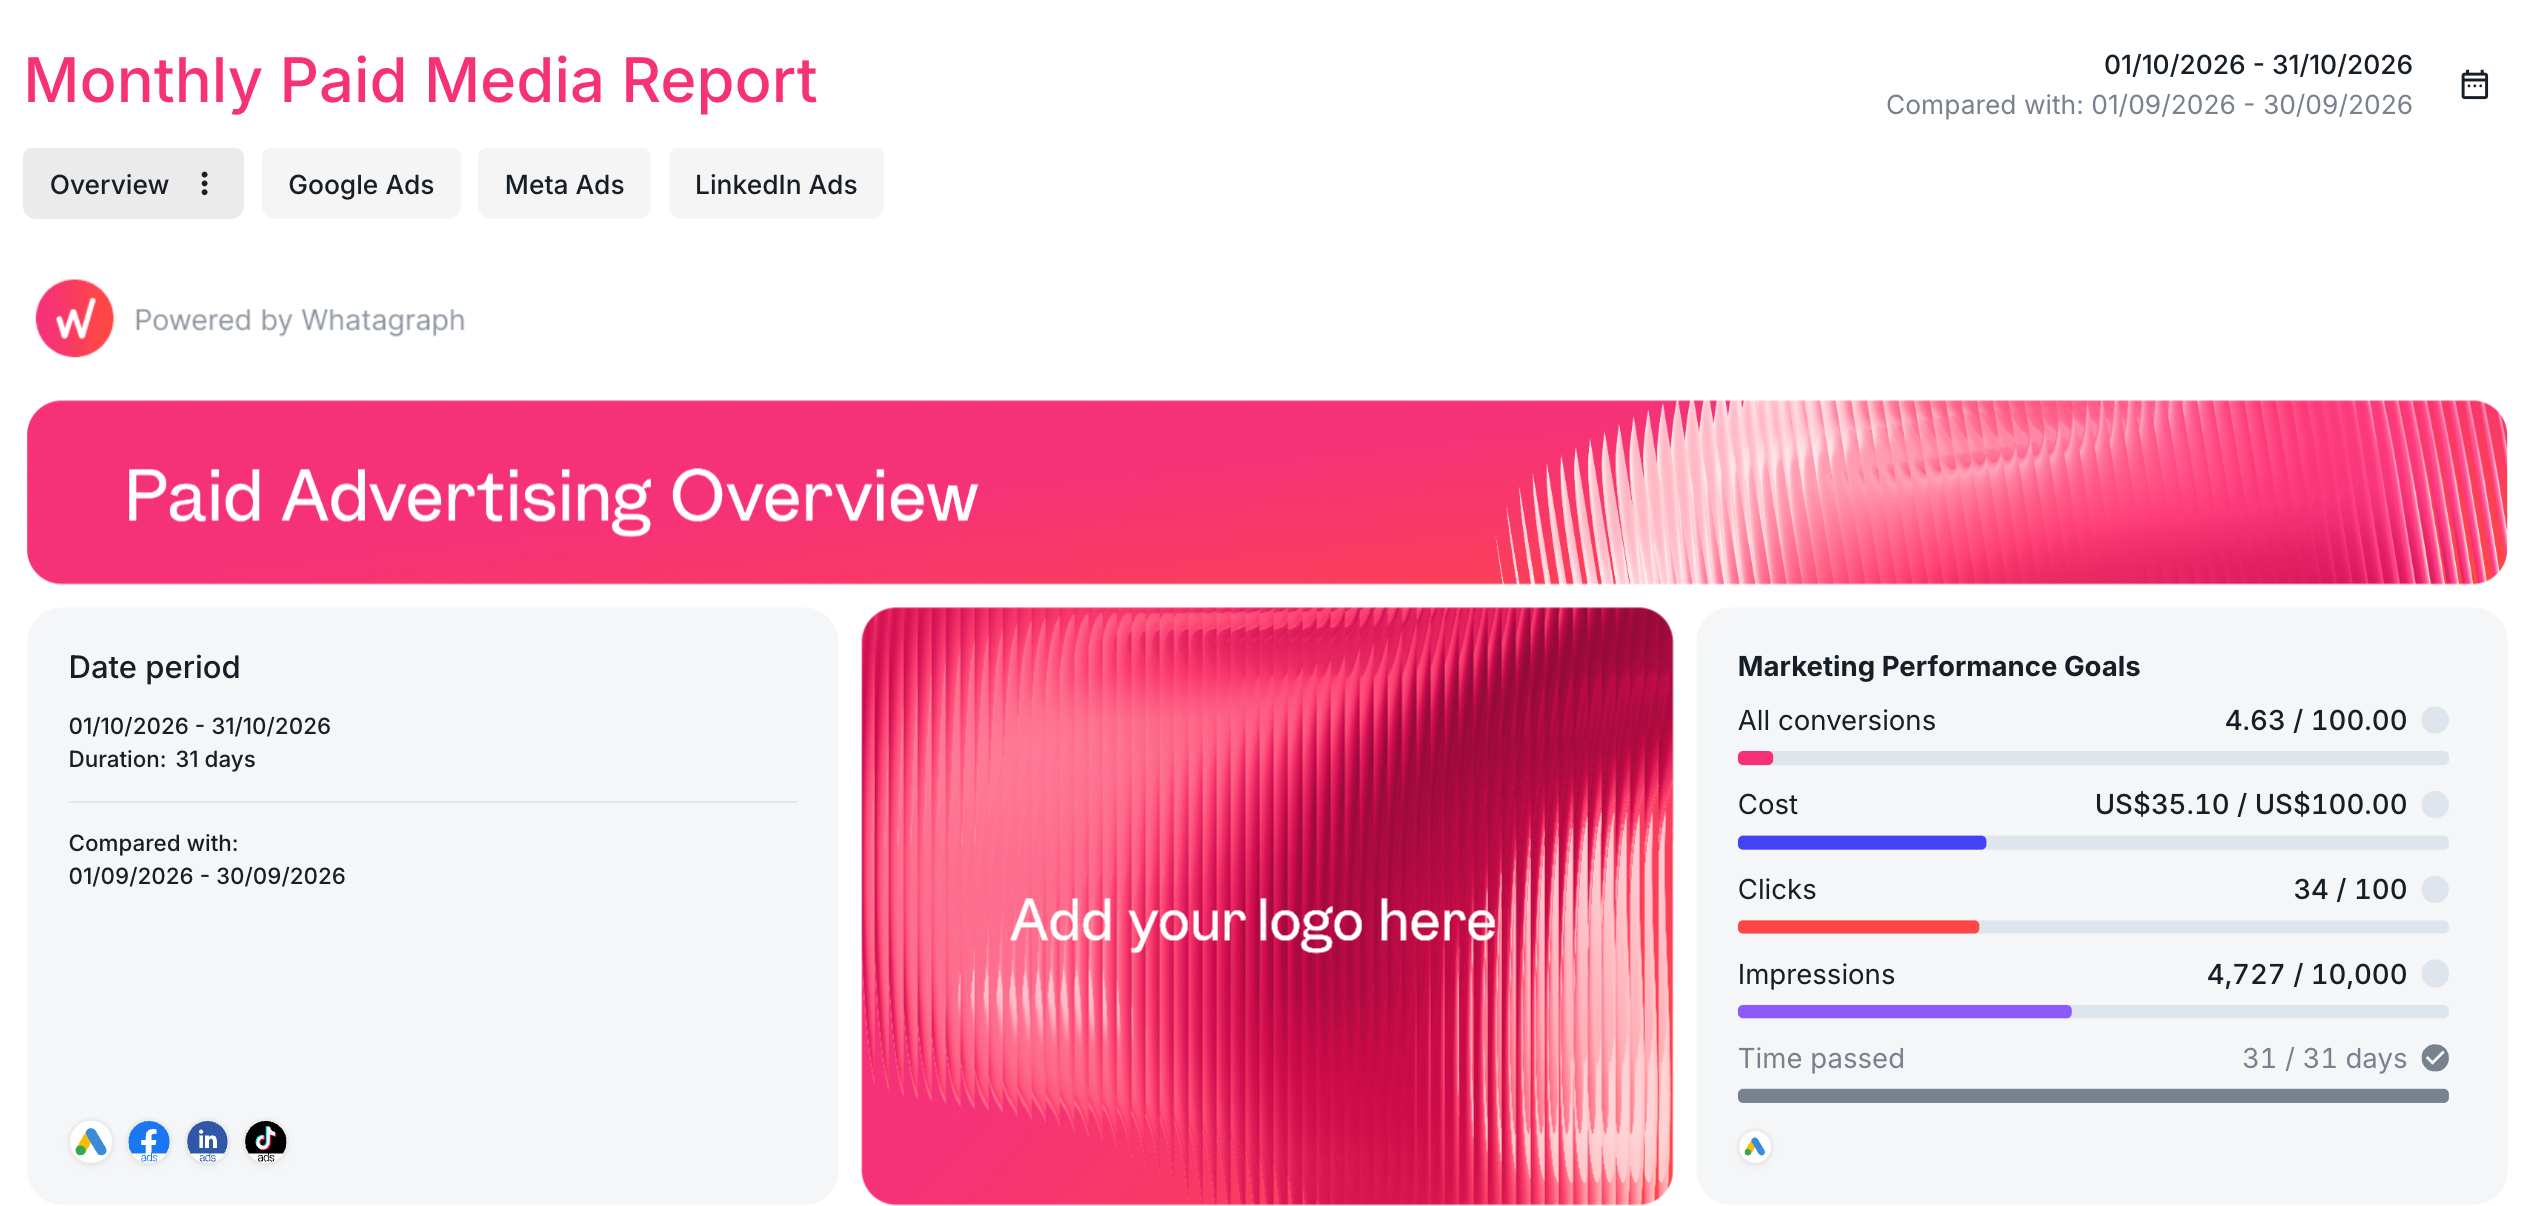
Branding and delivery cover how the report looks and how it reaches the client: your agency's logo next to the client's, a white-label design on your own domain, and a live link or a scheduled PDF on a fixed date.
Lars Maat said:
“When we share a report and it's fully branded, our colors, fonts, logo, and the client's logo, it looks professional. And for clients, this gives them the feeling of 'These guys know what they're doing.' That really matters.”
In fact, this professionalism has helped Dtch. Digitals agency reduce client churn by 50% with Whatagraph.
“Whatagraph really helps us to get clients on board, but also to keep our clients within the agency. Thanks to attractive visuals, clients can see the professionality behind our agency,” Stef Oosterik, Quality Manager at Dtch. Digitals, said.
In Whatagraph you can save each client's branding (fonts, colors, logos, and more) and automatically apply them to all the reports for each client instead of branding them one by one.
All you need to do is ask agents in plain language to save the branding details for you as a theme.
For delivery, Wise Pirates shares a live dashboard link with each client with Whatagraph. André Cardoso, Project and Performance Marketing Manager at Wise Pirates, said:
“It's great that we can share a live link to the dashboard with a client and the client can basically from their side change the dates and see specific numbers of a specific date. That makes the client a bit more autonomous, which makes our work easier and helps us build better relationships with clients.”
In Whatagraph, each client gets the report the way they prefer:
- A live link that always shows fresh data, with optional password protection. Clients don't need a login.
- Client-facing filters on the live link, so clients can slice the data themselves.
- Scheduled emails that send the report as a PDF on a fixed date, with your own subject line and message.
- Marketing decks built with HTML, PowerPoint, or Gamma.
Which marketing agency KPIs and metrics should you track?
Marketing agency KPIs should start with the client's business metric (revenue, leads, CAC or MER), then the channel metrics that explain it. Platform ROAS on its own doesn't tell the client whether they made money.
Two business metrics come up again and again in agency reports:
- MER (marketing efficiency ratio) is total revenue divided by total marketing spend, across every channel.
- POAS (profit on ad spend) is gross profit divided by ad spend, so it accounts for margins that ROAS ignores.
Rasmus Madsen, Founder and Google Ads Specialist at RM Marketing, told our PPC Reporting Hub:
“If you're only looking at Google Ads metrics like ROAS, you're missing the full picture.”
Here's what to lead with for each channel, what to use for diagnosis, and which source to treat as the source of truth:
| Channel | Lead with | Diagnose with | Source of truth |
|---|---|---|---|
| Paid media (Google Ads, Microsoft Advertising) | Conversions, CPA or ROAS against target | CTR, CPC, impression share, conversion rate | GA4 or the CRM for conversions; the ad platform for spend |
| Paid social (Meta Ads, LinkedIn Ads, TikTok Ads) | Cost per result, ROAS | CPM, frequency, CTR, creative-level results | GA4 or the CRM for conversions; the platform for reach and frequency |
| SEO | Organic conversions, non-branded clicks | Rankings for target terms, pages gaining or losing clicks, site health | Google Search Console for clicks; GA4 for conversions |
| AI search (AEO) | Visibility percentage by AI model | Share of voice, citations vs. mentions, AI referral sessions | Your AI visibility tool for mentions; GA4 for referral sessions |
| Organic social | Engagement rate, social-referred traffic or leads | Reach, follower growth, top posts | The platform for engagement; GA4 for traffic |
Paid media KPIs
Paid media KPIs show whether Google Ads and Microsoft Advertising campaigns hit the client's revenue or lead target.
KPIs to lead with:
- Conversions: the sales, leads or sign-ups the campaigns drove
- Cost per acquisition (CPA): ad spend divided by conversions
- ROAS: revenue divided by ad spend, measured against the client's target
Metrics to diagnose changes:
- Click-through rate (CTR)
- Cost per click (CPC)
- Search impression share
- Conversion rate
Chris Coussons, Founder of Visionary Marketing, said:
“We focus on conversion-driven KPIs, not just vanity metrics like impressions or clicks. Things like conversion rate, ROAS (return on ad spend), and cost per acquisition (CPA) tell us whether the campaign is actually making money.”
Paid social KPIs
Paid social KPIs show whether Meta Ads, LinkedIn Ads and TikTok Ads campaigns turn spend into results.
KPIs to lead with:
- Cost per result: spend divided by the result the campaign is optimized for (a lead, purchase or sign-up)
- ROAS: revenue divided by ad spend
Metrics to diagnose changes:
- CPM: the cost per 1,000 impressions
- Frequency: how many times the average person saw the ad
- Click-through rate (CTR)
- Creative-level results
Rising frequency is usually the first sign of creative fatigue.
Keep the diagnostics for your team, not the client's first page. Patrick Cumming, Founder of Ad Juice, put it bluntly in our PPC Reporting Hub:
“CTR, CPMs and CPCs are a total waste of time to track.”
One more thing to flag in every paid social report: Meta Ads counts view-through conversions that GA4 can't see, so platform conversions will run higher than GA4's.
SEO KPIs
SEO KPIs show whether organic search brings the client traffic that converts.
KPIs to lead with:
- Organic conversions in GA4
- Non-branded clicks in Google Search Console: clicks from people who didn't search for the brand name
Metrics to diagnose changes:
- Rankings for target keywords
- Pages gaining or losing clicks
- Site health: crawl errors, indexing issues and page speed
Nikola Baldikov, Founder of InBound Blogging, said:
“Since we are an SEO agency, we report metrics that show keyword rankings, organic traffic, website health, organic conversions, and so on.”
Want a starting point? Use our SEO client report template.
AI search (AEO) KPIs
AI search (AEO) KPIs track how often AI answers mention the client's brand. It matters because AI answers now sit between your client and the click.
When Google showed an AI summary, users clicked a traditional search result in 8% of visits, compared with 15% when no summary appeared, according to a Pew Research Center analysis of 68,879 Google searches by 900 U.S. adults in March 2025.
That means a client's organic clicks can fall while their brand still shows up in the answer. EWR Digital recommends agencies report:
- Visibility percentage: how often AI answers mention the brand for the client's topics
- A breakdown by model: ChatGPT, Gemini, Perplexity and Claude
- Share of voice against competitors
- Citations (a link to the client's site) vs. mentions (the brand named without a link)
- AI referral sessions and conversions in GA4
Treat AI visibility as a leading indicator. The client's revenue KPIs stay the same.
Organic social media KPIs
Organic social media KPIs show whether a client's posts get engagement and send people to their site.
KPIs to lead with:
- Engagement rate: likes, comments, shares and saves divided by reach or followers
- Social-referred traffic and leads in GA4
Metrics for context:
- Reach
- Follower growth on Instagram or LinkedIn
- Top posts by engagement
If a client only cares about likes, show them likes next to the number they pay you for: the traffic and leads those posts sent to their site.
Which marketing agency report templates should you start from?
Below are four examples of marketing agency report templates. Pick the one that matches the conversation you're having with the client, then cut every metric that client doesn't act on.
Monthly client report template
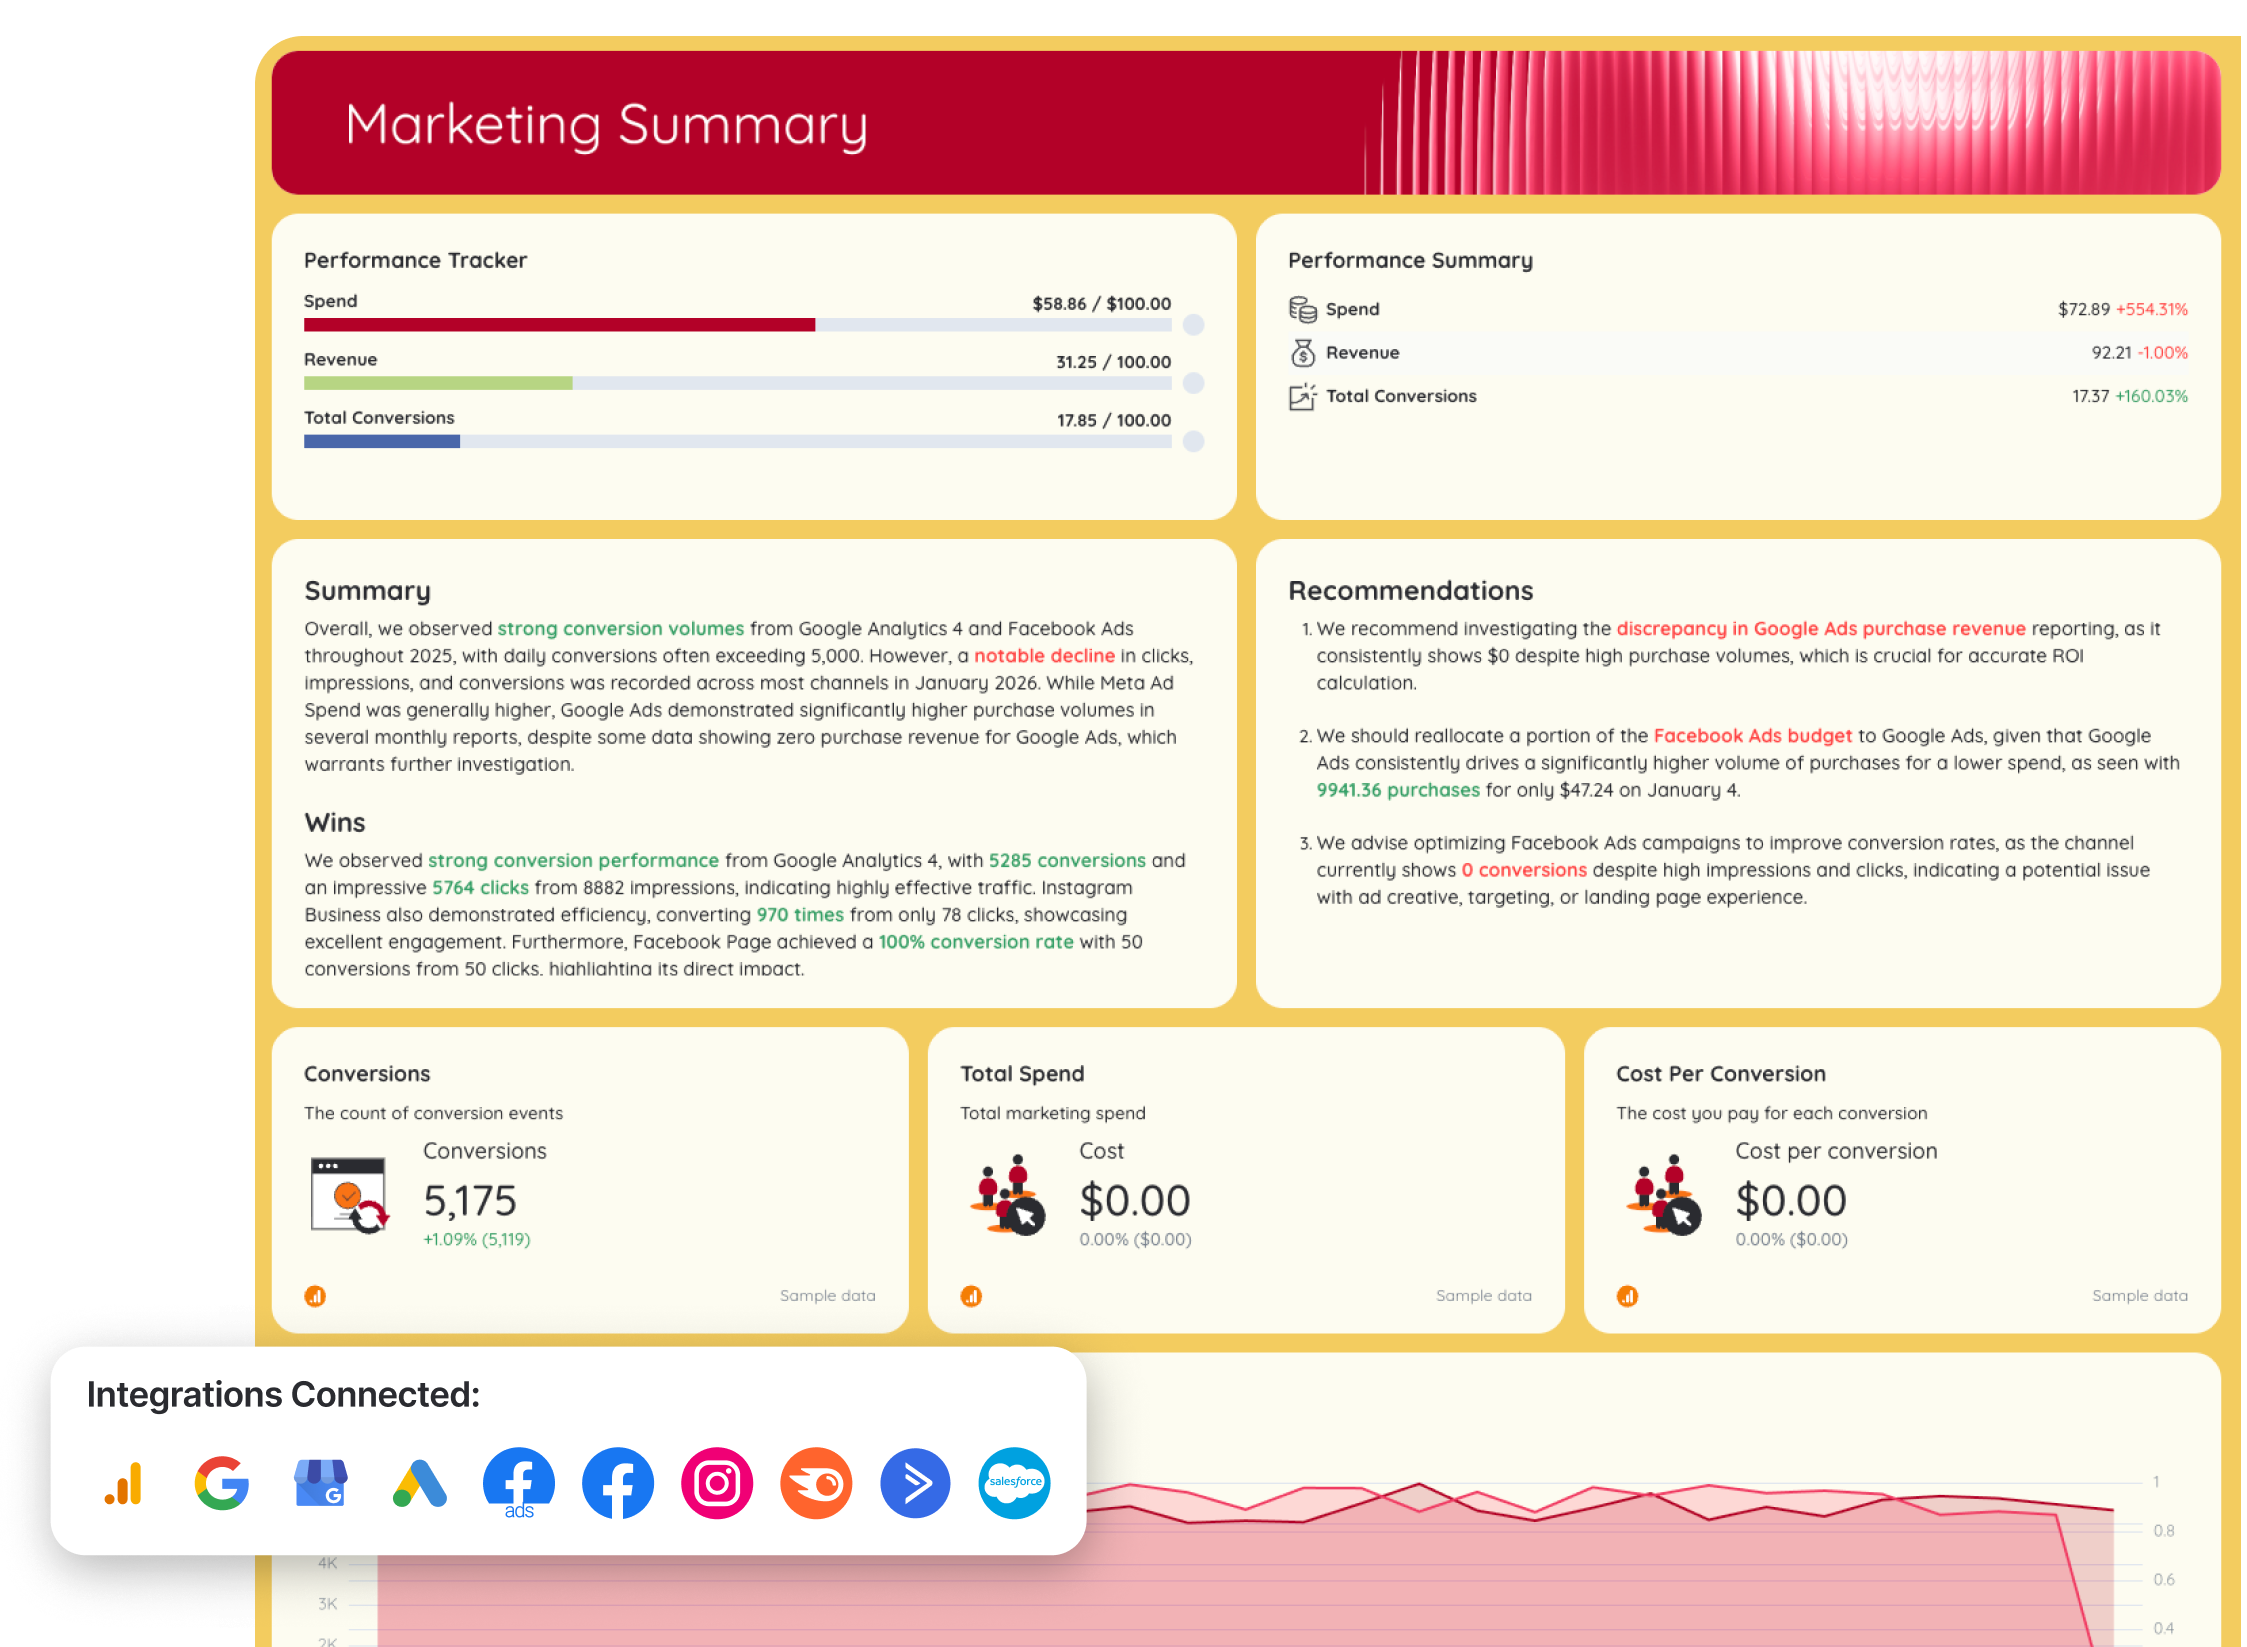
A monthly client report template is the report most agencies send by default. It shows last month's results against the client's goals, what changed, and what you'll do next.
Start from our monthly client reporting template. It includes a goal-tracking widget, so every report shows progress against the client's targets.
You can also change the date range to weekly or quarterly, depending on how often your agency reports to clients.
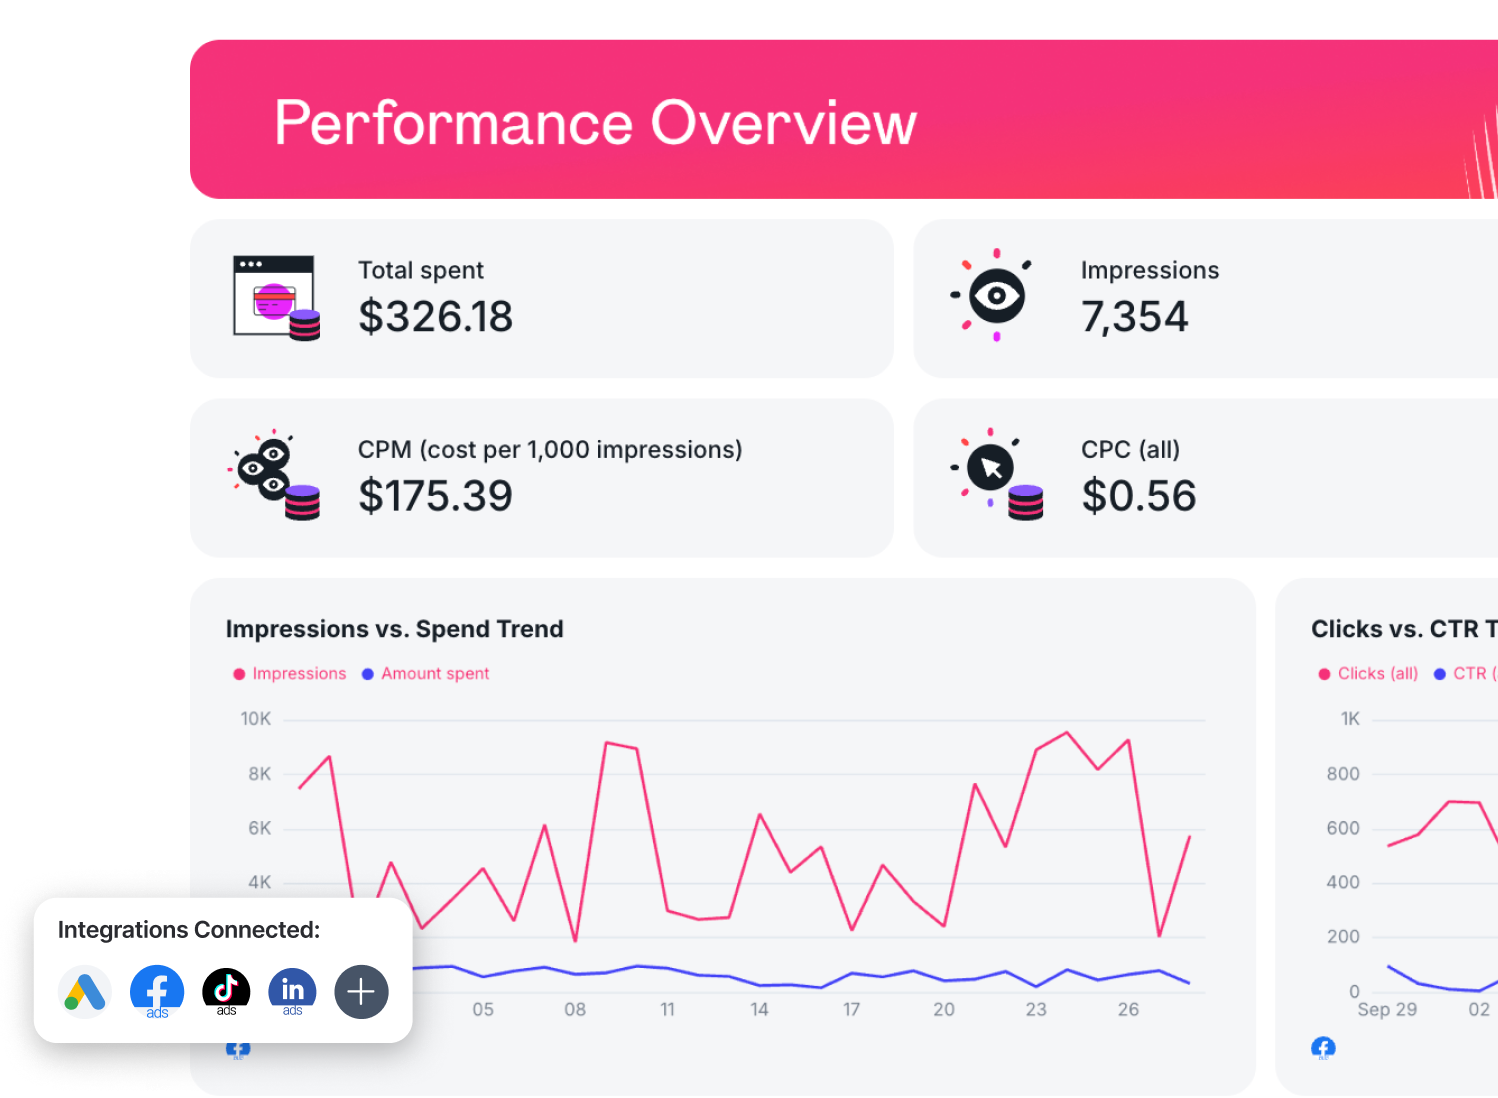
PPC report template
A PPC report template covers spend, conversions, CPA and ROAS for every paid channel. The PPC Reporting Hub has templates built with 11 PPC practitioners, including Lars Maat, Rasmus Madsen and Patrick Cumming. They cover:
- Google Ads, including e-commerce and lead generation versions
- Meta Ads, LinkedIn Ads, TikTok Ads and Pinterest Ads
- Microsoft Ads and Amazon Ads
The hub lays out a simple structure: one overview tab with blended results across channels, then one tab per paid channel.
SEO report template
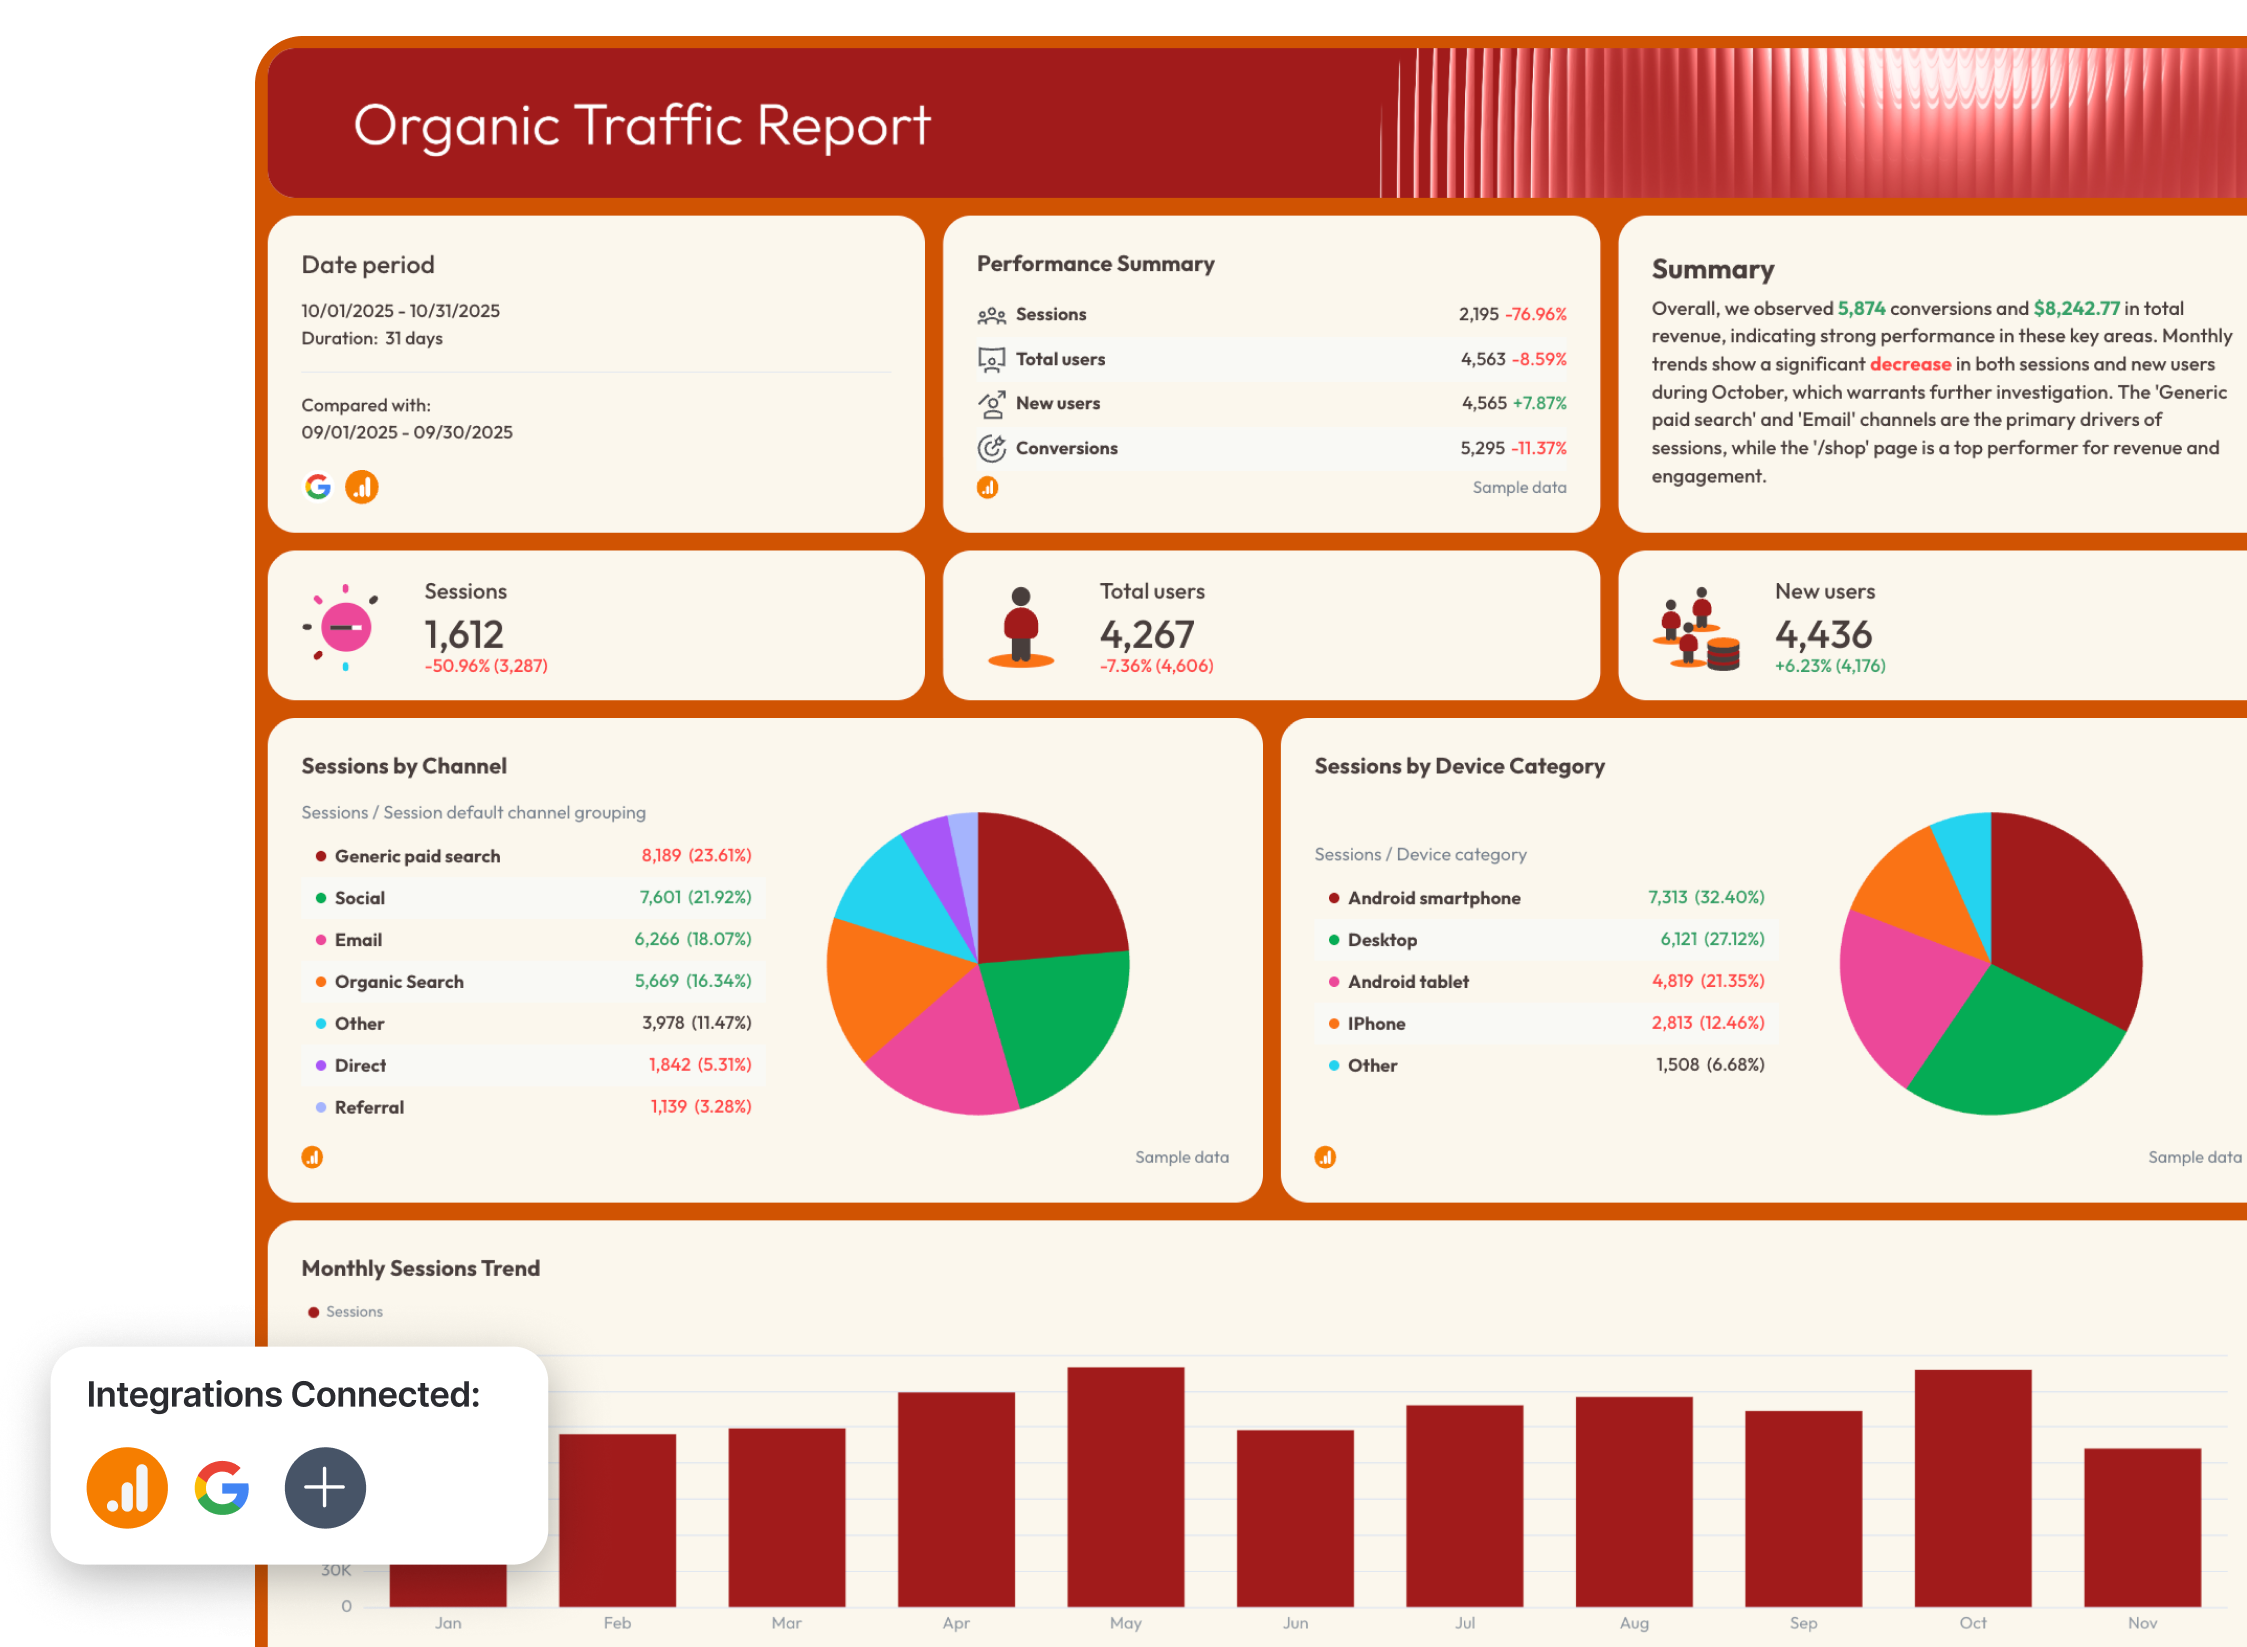
An SEO report template shows whether organic search brings in traffic that converts. Our SEO report template has four tabs:
- Performance summary: KPIs with a month-over-month comparison and recommendations
- Organic visibility: impressions, clicks, CTR and average position from Google Search Console, split into branded and non-branded keywords
- Organic traffic: sessions, users and landing page performance from GA4
- Organic conversions: conversions and revenue by traffic source
Social media report template
A social media report template covers organic performance across a client's social channels. Our social media report template includes:
- An overview with cross-channel KPIs and a written summary
- Instagram: followers, reach, engagement rate and a per-post table
- Facebook: reach, likes, comments, shares and top posts
- YouTube: views, watch time and subscribers gained and lost
Each channel section ends with recommendations.

How do you keep templates consistent across clients?
A template only standardizes reporting if a change to it reaches every client report. Copy a template into 40 client reports, and the first edit you make has to be made 40 times. Miss one, and that client's report drifts from the rest.
Linked templates in Whatagraph fix this. You edit the master report, and every client report linked to it updates.
Want more starting points? See our 9 free digital marketing report templates.
What are the best practices for agency reporting?
The best practices for agency reporting come down to seven habits:
- Start from the client's goalpost and work backwards
- Show what each channel contributed, not just the last click
- Lead with the takeaways and keep the detail on hand
- Turn every number into an insight and an action
- Write for the person reading the report
- Catch the red flags before the client does
- Keep results visible between reports, and present the big ones
They come from seven agency leaders who told us how they report to clients.
Start from the client's goalpost and work backwards
Agree on three things when you onboard a client:
- What counts as success: checkouts, calls, form fills or MQLs
- Which source counts it: GA4, the CRM or the ad platform
- The target for the month or quarter
Every other metric in the report supports that number. Ryan Anderson, President of Markiserv, said:
“No matter what it is, start with their goalpost and work backwards from there on supporting metrics.”
Anton Kovalchuk, Digital Marketer and Manager at QliqQliq, said the same:
“Most clients don't care about every minor metric; they want performance related to revenue or leads, customer acquisition, and the like.”
Show what each channel contributed, not just the last click
Last-click reporting gives all the credit to the final touchpoint. Upper-funnel campaigns look like they drive nothing, and clients cut them. Report assisted conversions, or first-click next to last-click conversions, and connect ad data to CRM outcomes where you can.
Stephen Samuel, Founder of NexFusion, said:
“Tracking assisted conversions prevents clients from mistakenly turning off campaigns that play a crucial role in driving long-term revenue.”
Janet Mesh, CEO and Co-Founder of Aimtal, also reports who engaged, not just how many. Aimtal's attribution report shows the companies, job titles and people engaging with a client's marketing, on one slide. She said:
“All of the quantitative numbers of marketing KPIs like impressions, followers, traffic, and rankings don't matter if you're not connecting with the right audience.”
Lead with the takeaways and keep the detail on hand
Put the three or four results that matter on the first page. Move campaign and keyword breakdowns lower down, for the people who want them. Maatwerk Online did this when it cut its reports down to top KPIs, targets and profitability.
Ryan Anderson said:
“Most leaders will go into the details if they need to, keep that available to them, but make sure you are presenting digestible information.”
Chris Coussons, Founder of Visionary Marketing, said:
“A huge report full of metrics might look impressive, but if the client doesn't understand it, it's useless.”
Turn every number into an insight and an action
A chart with no explanation is a screenshot, not a report. Every section should say what happened, why it happened, and what you'll do next. Ryan Anderson's rule for every report is “Data > Insights > Actions.”
Janet Mesh said:
“Your role is to be a non-fiction storyteller. This means it's your duty to tell a true story of what's working and what's not.”
Nikola Baldikov, Founder of InBound Blogging, put it more simply:
“It's more important to focus on presenting data in a clear way and prioritize actionable insights over a fancy look.”
Write for the person reading the report
A CMO, a founder and an in-house marketer need different levels of detail. Find out what each reader counts as success, define every acronym once, and label charts in plain language.
Ryan Anderson called this the biggest reporting mistake:
“Not understanding your audience. This is the largest problem.”
Tanja Keglić, Performance Marketing Manager at Achtzehn Grad, said clear visuals close the gap:
“We have a lot of clients who don't fully understand marketing, but when everything is visualized clearly, it's much easier for them to follow.”
Catch the red flags before the client does
A few days before the send date, check that every Google Ads, Meta Ads and GA4 connection still pulls data. Then scan for the patterns that point to deeper campaign problems:
- Impression share lost to budget
- CPC rising with no rise in conversions
- A high CTR with a low conversion rate
Chris Coussons said:
“One of the biggest warning signs is a high impression share loss due to budget, which means the ads are working but aren't showing as often as they could be. Addressing these issues before the client even notices builds trust.”
Stephen Samuel explained the third pattern:
“A high click-through rate with a low conversion rate is often a sign of misleading ad messaging.”
If an AI tool writes the first draft of the report, a person reviews it and signs off before it goes to the client.
Keep results visible between reports, and present the big ones
A live dashboard or client portal answers “how are we doing?” without an email thread. Dtch. Digitals sends every client a link to a live dashboard alongside the monthly report.
The big reports still get walked through with the client. Maatwerk Online introduced its new reports to clients in a live webinar.
Ivan Vislavskiy, CEO and Co-founder of Comrade Digital Marketing Agency, said:
“The game changer was transparency, and not just saying, 'We're transparent,' but showing it.”
Comrade emails automated reports to clients, so, in Ivan's words, “They don't even have to ask for it.”
What are the best reporting tools for agencies?
We tested the seven best reporting tools for agencies in our guide to marketing agency reporting tools. Here's how they compare:
| Tool | Who it's best for | Key reporting features | Pricing |
|---|---|---|---|
| Looker Studio | Solo marketers and budget-conscious boutique agencies working within the Google ecosystem | Native Google connectors (GA4, Google Ads, BigQuery, Google Search Console), drag-and-drop canvas, scheduled PDF email exports | Free. Pro from $9 per user per project/month |
| AgencyAnalytics | Small to mid-sized agencies focused on SEO and local business marketing | 85+ integrations, built-in rank tracking and site audits, client portals, automated report delivery | From $18 per client/month, billed annually |
| DashThis | Boutique agencies and small teams | Plug-and-play widgets, white-labeling on all paid plans, 34+ integrations, automated email reports | From $44/month, billed annually |
| Databox | Data-driven agencies that need verified metric definitions | 100+ integrations, semantic layer with verified metrics, Genie AI analyst, scorecards and anomaly alerts | Free plan. Agency plan from $79/month, billed annually (white-labeling is an $80/month add-on) |
| Whatagraph | Mid to large agencies with 10+ clients and hundreds of data sources | Governed cross-channel Data Hub, IQ Agents, linked report templates, white-labeling, unlimited reports and users | Annual plans priced by source credits |
| TapClicks | Large media agencies, franchise brands and enterprise ad operations | 250+ connectors, automated data warehousing, margin and markup automation, Report Studio presentation builder | Custom annual contracts, typically from $500 to $1,000+/month |
| Klipfolio | Technical agencies and analytics teams comfortable writing formulas | Spreadsheet-style custom calculations (Klips), PowerMetrics metric catalog, 130+ connectors, scheduled PDF reports | Klips for Agencies from $160/month, billed annually |
What are the future trends in marketing agency reporting?
Five trends are changing marketing agency reporting:
- Agencies build and buy their reporting stack
- AI agents do the busywork, and people make the calls
- Monitoring moves between reports
- AI search becomes a reporting line
- Metric definitions become infrastructure
Agencies build and buy their reporting stack
More agencies are doing a mix of both building and buying their reporting stack. They buy the data foundation and build the playbooks unique to their own agency.
In our research with 87 agencies, 11 said they were going hybrid, and 10 of them split it the same way: buy what clients see, build what stays internal.
The split usually looks like this:
- Buy: native integrations the vendor fixes when they break, defined metrics, blended data across channels, standardized campaign names and the client-facing reports
- Build: the agency's playbooks, meaning how it reads the numbers, what it flags and what it recommends next
The five-person Dutch team from earlier built its own Meta Ads and Google Ads API connectors before it decided to buy the data layer. Its playbooks still live in its own hub, with scripts that do the calculations so the AI doesn't invent numbers.
Read more in our research on whether to build or buy your reporting stack.
AI agents do the busywork, and people make the calls
AI agents now handle the busywork of reporting, and marketers review the output and make the decisions. Agency teams are ready for it: 93% of staff report confidence using AI tools, and more than half save at least three hours a week, according to the IPREX 2026 Emerging Leaders Staff Survey of mid-career professionals across its member agencies (May 2026).
In Whatagraph, IQ Agents take on the busywork:
- Building each client's monthly report from your template and the latest data
- Writing the first draft of the commentary in your house style
Marketers and specialists then do the part that needs judgment:
- Review the draft and fix what's wrong or missing
- Add the context only they know, like a client's upcoming sales push or a site migration
- Decide what to recommend, and sign off before the report goes to the client
GKV works this way, with one agent per client and an analyst reviewing every draft.
Comparing AI tools? See our guide to AI reporting tools.
Monitoring moves between reports
Checks that used to wait for the monthly report now run on a schedule:
- Budget pacing against each client's budget
- Account checks for broken data source connections
The five-person Dutch team from earlier moved client budgets out of Excel and into Whatagraph, with budget pacing updated daily. Overspend shows up mid-month, while there's still time to fix it.
These checks run on schedules, several times a day if you need them, not in real time.
AI search becomes a reporting line
AI search visibility is joining organic search in the client report. The AEO KPIs above cover what to track. The harder part is knowing what each client expects: 61% of staff in the same IPREX survey have limited or no visibility into client AI requirements or preferences.
Ask at onboarding which AI search metrics the client wants to see, and add them to the report from the first month.
You don't need a separate tool for it. Whatagraph now tracks AI visibility natively, next to every other dashboard:
- Unbranded visibility score
- Top-3 presence rate
- Sentiment
- Citations
- Competitors share of voice
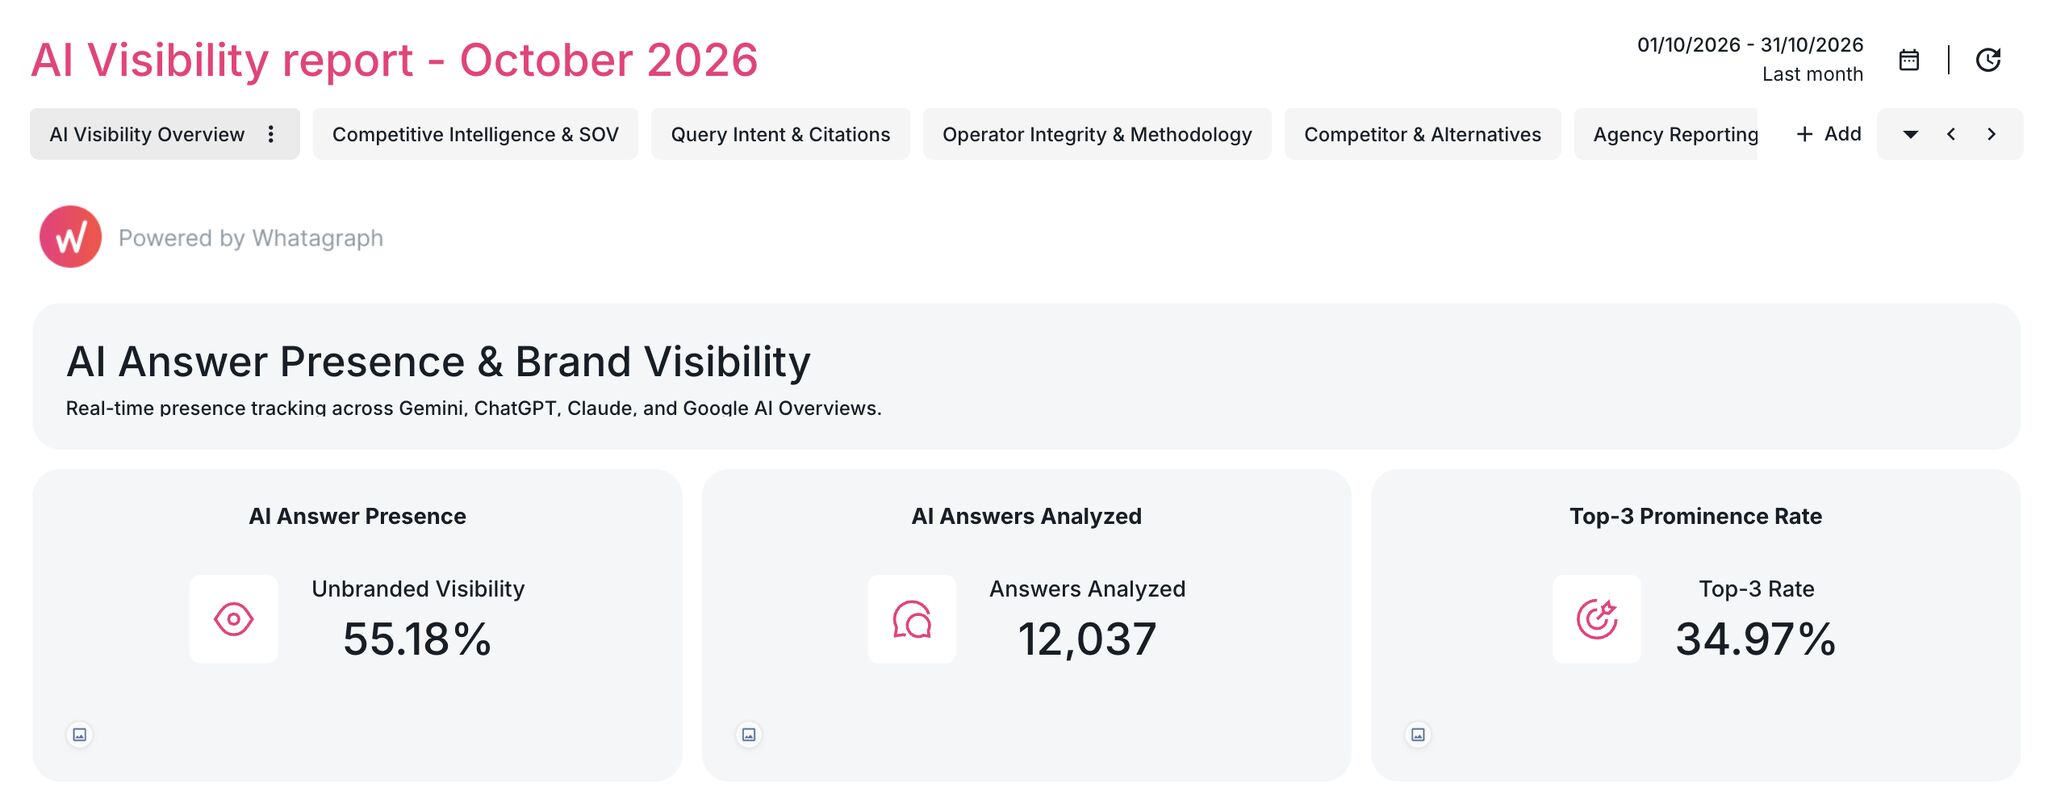
Our own marketing team runs it on Whatagraph's brand. Veta Armonaite, VP of Marketing at Whatagraph, said:
“We use these reports for two things. First, to see how our content shows up in the answers. Second, to see which publishers and influencers get cited for the same prompts, because getting into their content is the fastest way to improve our own visibility.”
Metric definitions become infrastructure
When people build reports, a metric defined three ways causes an argument on the review call. When agents read the data, it produces three different answers, each written up with the same confidence.
Define each KPI once (what counts as a conversion, how you calculate CPA and MER) and use that definition in every report. Then your people and your agents work from the same numbers.
The bottom line on marketing agency reporting
- Marketing agencies are scaling and streamlining reporting using AI agents but keeping humans in the loop at every stage. One agency, GKV, got back 70+ hours from reporting for deeper analysis and proactive optimizations for clients.
- A high-value client report has five core elements: an executive summary with insights and next steps, goals vs. actuals, a cross-channel overview, a channel breakdown, and branding and delivery.
- The future of marketing agency reporting is where agencies buy the underlying data and reporting foundation, but build their agency's expertise and context on top with GitHub or Claude.
Want to scale or streamline reporting? Get a demo for Whatagraph.
Last updated Nov 12 2026
WRITTEN BY
YamonYamon is a Senior Content Marketing Manager at Whatagraph. With an eye for detail and a knack for always considering context, audience, and business goals to guide the narrative, she's on a mission to create genuinely helpful content for marketers. When she’s not working, she’s hiking, meditating, or practicing yoga.