LinkedIn MCP: Connect LinkedIn Ads to Claude & Trust the Answers
You can ask Claude how your LinkedIn campaigns did this month and get a clean, confident answer back in about three seconds.
The real question is - can you trust the answers?
Believe it or not - connecting LinkedIn to Claude is the easy part (and we’ll show you how in a minute).

Jun 18 2026●10 min read


Most of the LinkedIn MCP Claude setups floating around will pull your numbers just fine. What none of them really tell you is whether those numbers are right.
And LinkedIn is a bad place to find out the hard way. The leads cost a fortune, the targeting is layered three ways deep, and Campaign Manager takes ages to dig through.
We've talked to dozens of marketers who say the same thing: the issue isn't getting an answer out of Claude, it's how much you can rely on the answer.
In this article we'll cover:
- Different types of LinkedIn MCP connectors and which one to choose
- How to connect LinkedIn to Claude in 2 ways
So this article isn't only about how to connect LinkedIn Ads to Claude. Plenty of guides cover that bit.
It's about connecting it in a way where you can actually trust what comes back, and then asking it the questions that move money, not just the ones that look good in a screenshot.
TL;DR
- A LinkedIn MCP is a connector that lets Claude read your LinkedIn Campaign Manager data and answer questions about it in plain language, no CSV exports, no clicking through breakdowns.
- There's no official LinkedIn MCP server. Your options are community-built servers you self-host, raw API connectors stitched together, or an MCP that sits on a governed data layer. Only the last one gives you answers you can stand behind.
- LinkedIn Ads is a B2B platform with high CPLs and layered targeting. That makes trustworthy numbers matter more here, especially when you're comparing LinkedIn CPL against Google Ads and Meta in the same view.
- Before you connect, set up your data layer in Whatagraph first: connect your sources, set currencies, organize into Spaces, define your custom metrics, and blend or group your channels.
- Once connected, you can query campaign performance, creative fatigue, audience breakdowns, budget pacing, and cross-channel reporting, all in plain language. There's a full prompt library at the end.
What is a LinkedIn Ads MCP server?
A LinkedIn Ads MCP server is a connector that gives an AI assistant like Claude direct access to your LinkedIn Ads data. Instead of exporting CSVs or clicking through Campaign Manager, you ask a question in plain language and get an answer back about campaign performance, spend, leads, and more.
MCP stands for Model Context Protocol, an open standard Anthropic introduced in late 2024.
Arturas Lazejevas, CTPO of Whatagraph, puts it in plain terms:
Think of MCP as a door that LLMs like Claude or ChatGPT can use to access any of your systems that you connect (through the MCP).
Not all LinkedIn Ads MCP connectors are built the same way though.
From the outside they look identical, same wire protocol, same plain-language chat. It's what sits underneath that splits them into three pretty different products.
Here are 3 different types of LinkedIn Ads connectors and which one to trust:
| Single platform MCP | Stitched connector MCPs | MCP over a governed layer | |
| What it is | A community-built server (no official one exists) wrapping the LinkedIn Marketing API for one account | Several raw API connectors in one Claude chat, with nothing shared between them | A protocol on top of a unified data model, like Whatagraph |
| Cross-channel answer | Not its job. One account by definition | Claude stitches it at query time, so the math drifts | Pre-blended in the data model |
| Same question, same answer? | Yes, within that one account | No. It depends on the prompt | Yes. Metrics are defined once |
| Setup | Developer App, terminal OAuth, local install, config edits, and it breaks on token expiry | The same work, multiplied by every channel you add | Paste a URL and authorize. A few minutes, no code |
| Where it fits | Ad hoc, single-account questions | Quick answers when one channel is enough | Daily cross-channel reporting across clients and accounts |
The setup story alone tells you a lot. A single MCP server for LinkedIn Ads means a Developer App and a token you'll be re-authenticating every time it expires. Stitch in Google and Meta and you're maintaining that for each one.
The deeper issue is trust.
With a stitched setup, Claude reconciles mismatched definitions and converts currencies on the fly, so three people asking the same thing get three different numbers.
With a governed data layer, that reconciliation already happened before Claude ever sees the data.
That's how Whatagraph's MCP is built. As Arturas explains:
Whatagraph doesn't query separate connectors like Facebook, Google Analytics, and Google Ads on the fly and have Claude reason about it. We unify all of that data as it comes in. The MCP is just the query layer on top.
So when you're comparing MCP LinkedIn options, the real question isn't "does it connect?" They all connect. It's "can I trust what comes back?" That depends entirely on which of these three you're using.
How to connect LinkedIn Ads to Claude [2 options]
So how do you actually connect LinkedIn Ads to Claude? There are two routes: self-host your own MCP server, or use a pre-made one like Whatagraph.
Option 1: Self-host a LinkedIn Ads MCP server
Unlike Google or Meta, LinkedIn doesn't publish an official MCP server.
What you'll find instead are community-built, open-source ones that wrap the LinkedIn Marketing API. Two of the most common are linkedin-ads-mcp by Daniel Popa and mcp-linkedin-ads by Radiate B2B, both on GitHub. You can also build your own from scratch with Claude Code.
These can do a lot.
They handle campaign analysis, creative breakdowns, and audience benchmarking for a single account. If you're technical and you just want to ask LinkedIn Ads questions now and then without paying for anything, this is a fine path to go down.
The catch is getting it set up in the first place. To run one of these, you'll usually have to:
- Create a LinkedIn Developer App and request access to the Advertising API product, which usually takes 1 to 3 business days to get approved
- Run a 3-legged OAuth flow to authenticate, with the r_ads and r_ads_reporting scopes for read access
- Install the server locally with npm and build it
- Go into Claude's claude_desktop_config.json file and edit it by hand to register the server
None of that is rocket science, but it's a job for a developer, not a marketer.
Pau Ferrer, a PPC marketer and marketing engineer, built his own connector from scratch using Claude Code. He told us it took him a month and a lot of wrangling with code and scripts.
And then you have to keep it alive.
LinkedIn access tokens expire after 60 days, so every couple of months the connection drops and you go re-authenticate.
The Marketing API only lets you pull 18 metrics per request. It also keeps your performance numbers and your campaign details in two separate places, so you have to join them on campaign ID yourself.
And there's no official Python SDK, so most people just build straight against the API and deal with pagination by hand.
Whichever way you go, what comes back is raw API output. Nothing is normalized, no metrics are defined, and nothing is converted into one currency. All of that is still your job.
A community server can't do a few other things you'll want eventually, either.
It won't refresh your data on a schedule, roll up multiple accounts into one number, join LinkedIn with Google Ads or HubSpot, or remember your business context from one chat to the next. For one account asked the odd question, that's fine. For an agency, you hit a wall pretty quickly.
The work piles up fast once you scale. Laurynas Arminas, Whatagraph's Product Manager, has watched marketing teams try to build and keep their own connectors running:
It's easy to get something 80% done and think you're there. But then you realize how hard that remaining 20% is. Once you're working with seven different channels, seven different places pulling data from MCPs, things start getting confusing. Every time you add a client or a channel, you need to update everything - and things slip through the cracks.
API changes break things. Deprecated metrics need chasing. Campaign naming drifts across clients and accounts.
There's also a middle option: managed connectors from providers like GrowthSpree, which take some of the setup off your plate. But they still hand Claude raw, single-platform output, so the trust and cross-channel problems below stay the same.
At two or three clients on a single channel, a homemade connector does the job. At ten clients across LinkedIn, Google, and Meta, it becomes a maintenance job that can quietly take over your actual job.
Option 2: Connect LinkedIn Ads to Claude with Whatagraph's MCP
If you'd rather skip the building and the babysitting, the better option is a pre-made MCP. And the best one is Whatagraph.
Not because "we have an MCP," but because it's an MCP built on top of a governed data layer. You get answers you can actually trust, without the time and code it takes to build and maintain your own.
Setup takes a few minutes, no code required. And you get the same trustworthy numbers whether you ask on Monday or Friday.
Here's how to get started.
7 steps to connect LinkedIn Ads to Claude with Whatagraph MCP
Setting up Claude's access to your LinkedIn Ads data through Whatagraph takes a few minutes.
Before you start, make sure you have three things ready:
- A Whatagraph account with your LinkedIn Ads account connected (start a 14-day free trial)
- A Claude account
- Owner or Full Admin access to your Claude workspace
If you're on a team plan and don't see the option to add a custom connector, you'll need whoever manages the account to do this part.
A trick: log into your Whatagraph account in the same browser you're using for Claude. It makes the authorization step a one-click thing instead of a whole separate login flow.
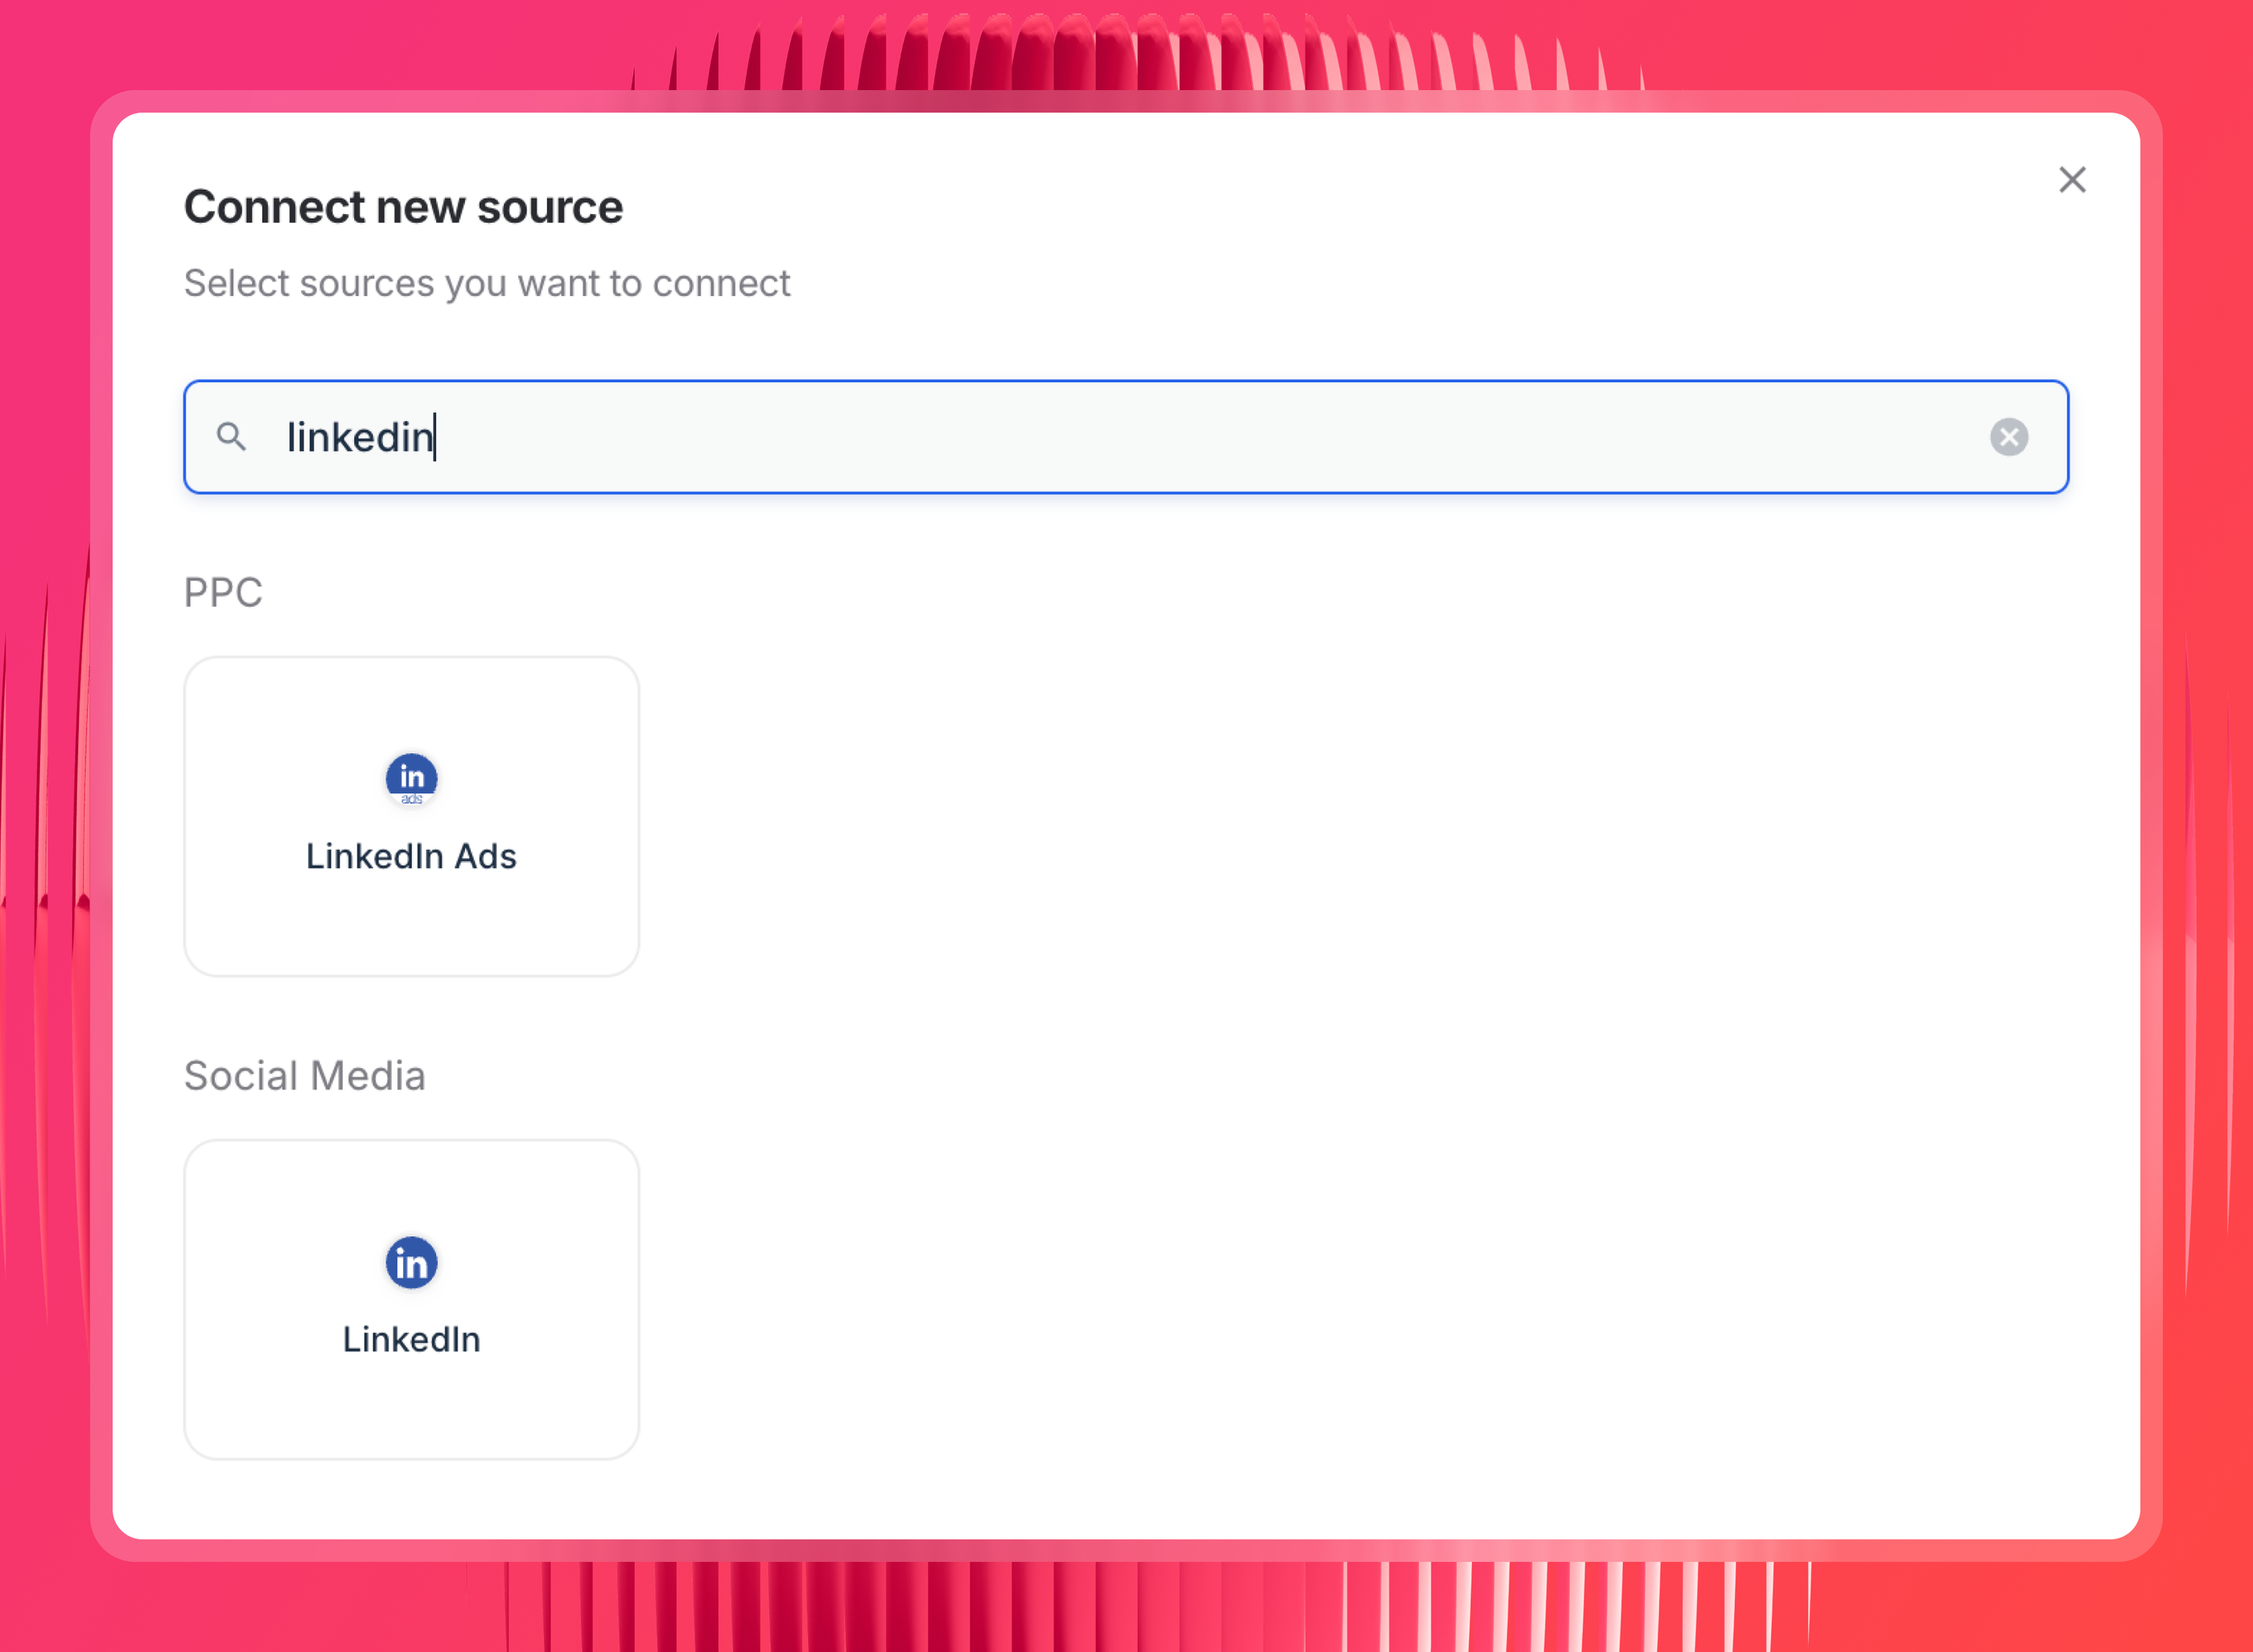
Step 1: Connect your LinkedIn Ads and/or LinkedIn organic account in Whatagraph
If you haven't already, connect LinkedIn Ads as a data source inside Whatagraph. This is where the data actually lives. The MCP just gives Claude a way to query it.
This is also where the connection stops being your problem. Whatagraph maintains the LinkedIn Marketing API connection for you, so a token expiry or an API change doesn't break your setup the way it would with a self-hosted server.
Step 2: Set up your governed data layer in Whatagraph
This is the non-negotiable step. As Arturas puts it:
"My suggestion would be to really embed your business logic into Whatagraph first, so that Claude doesn't need to reason about it. It doesn't need to figure that stuff out every time."
Here's what to set up before you start querying:
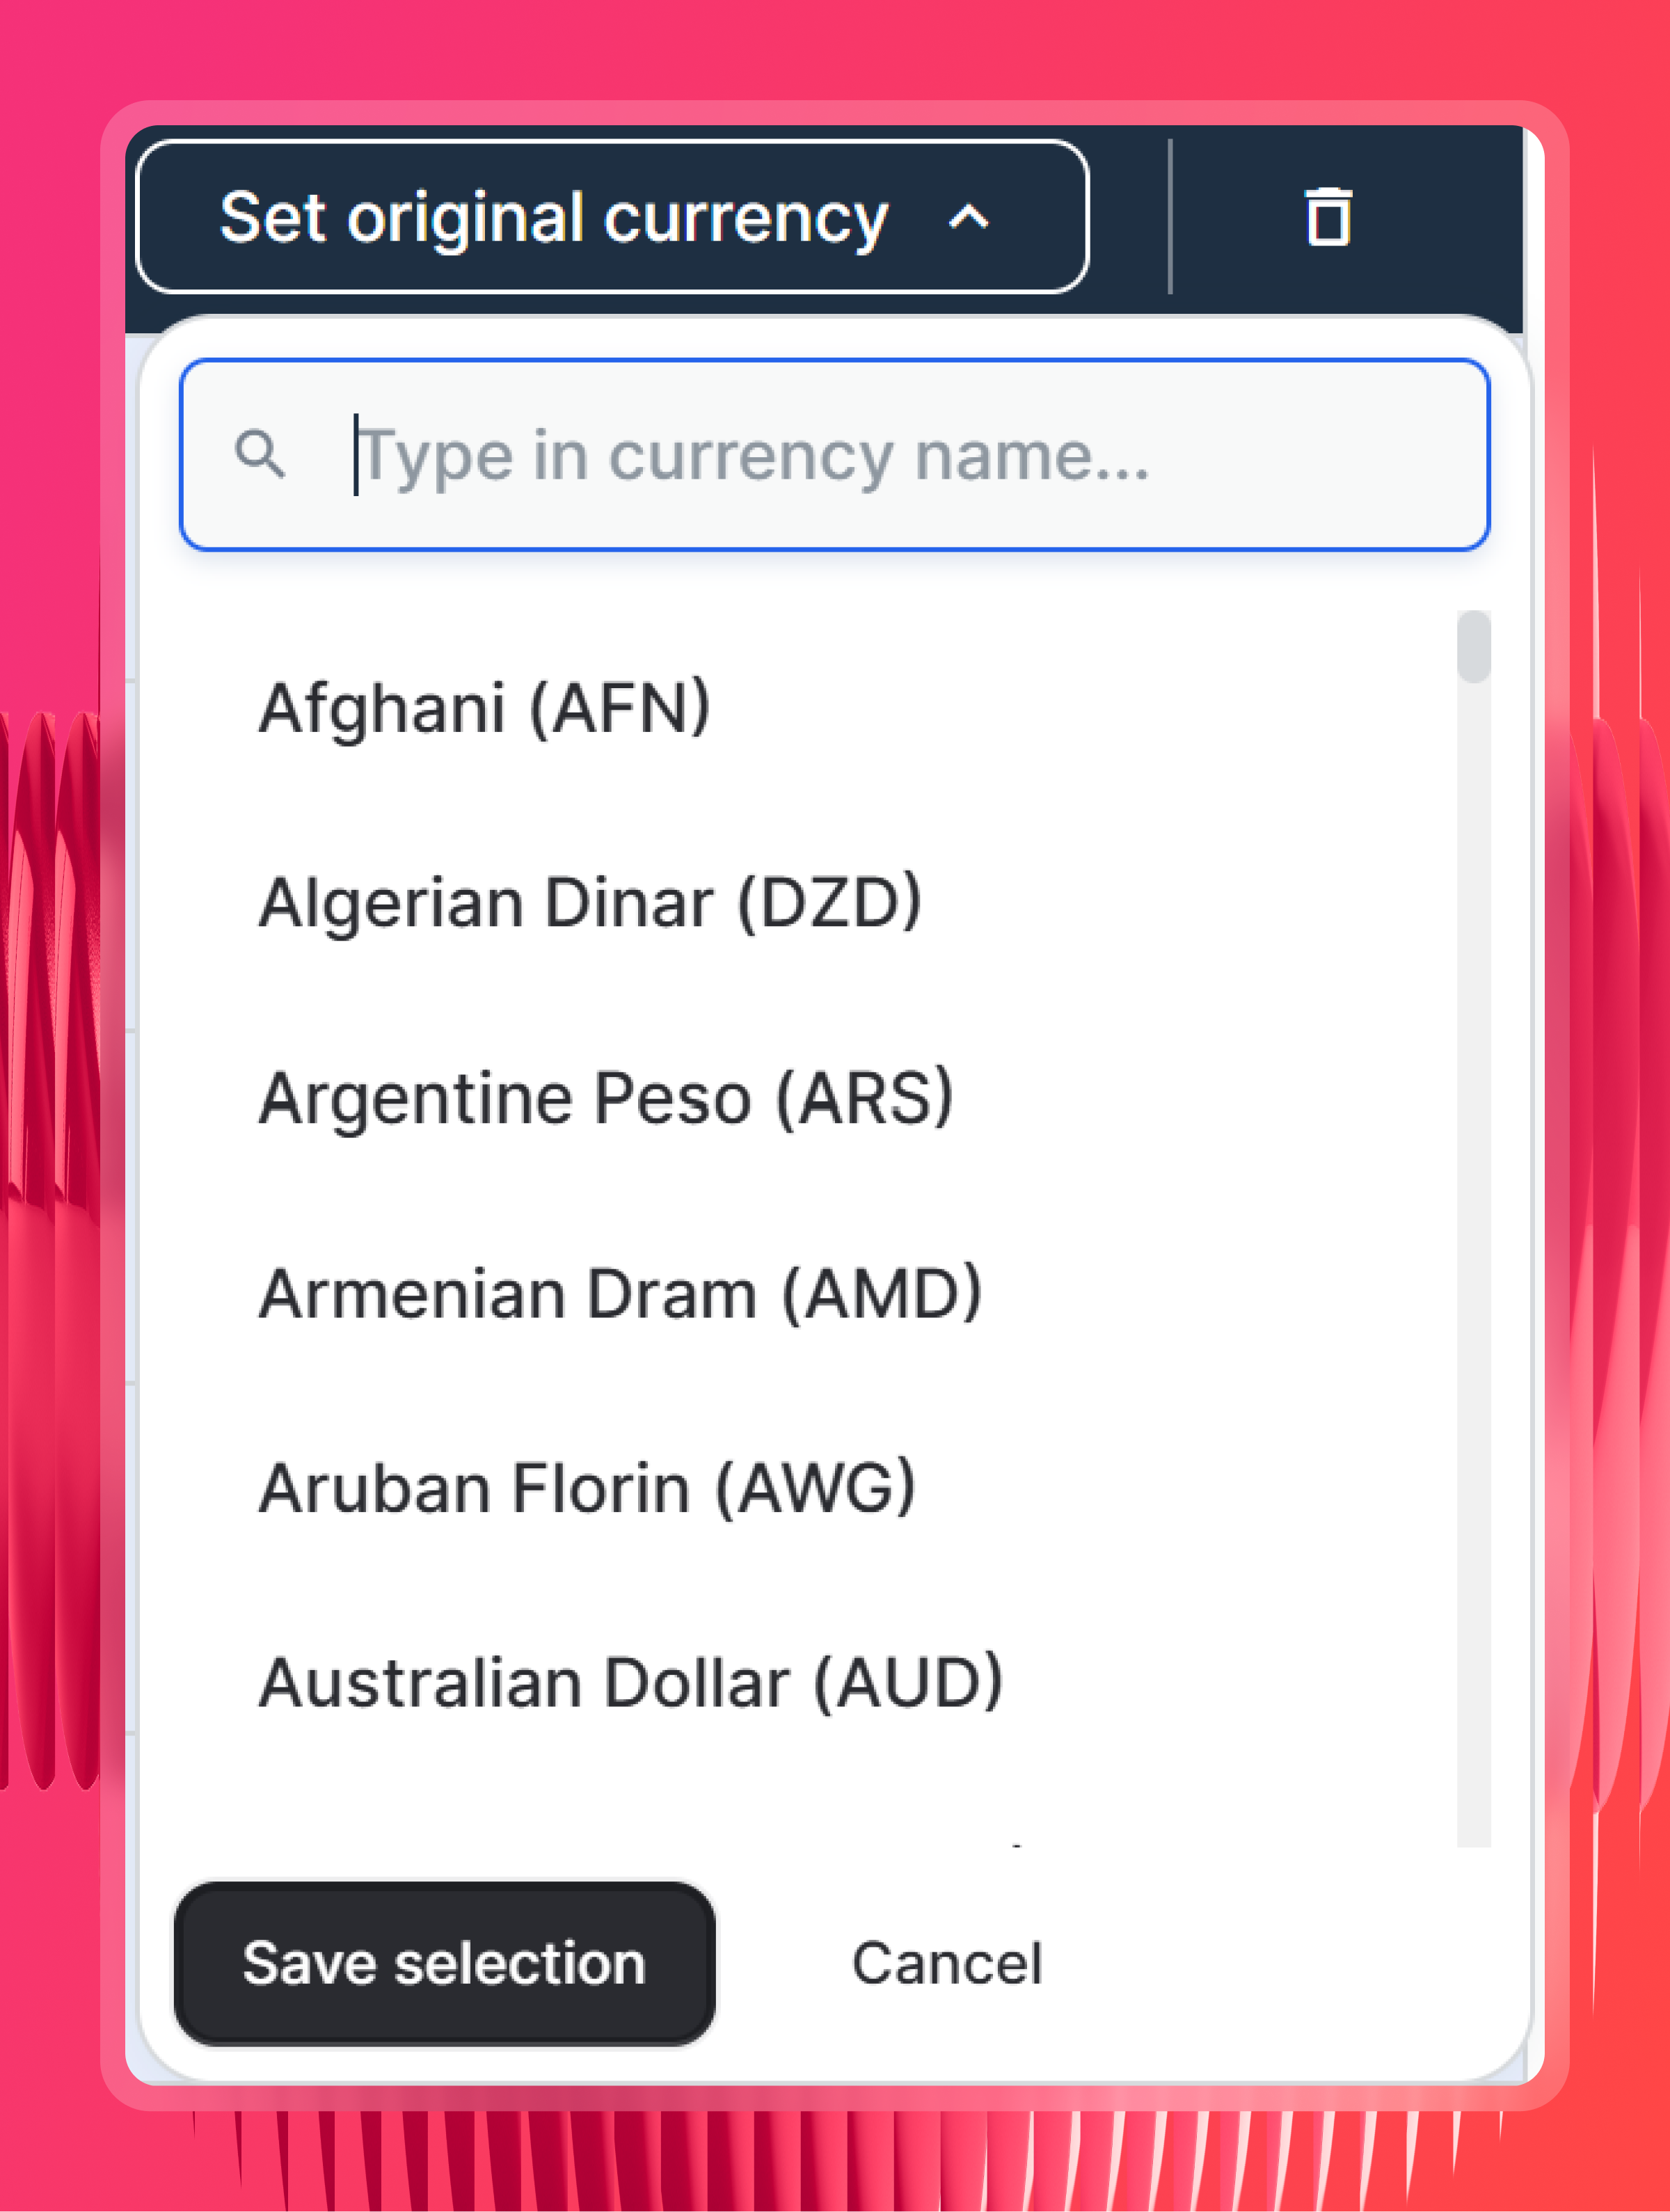
- Check currency settings - Whatagraph detects the original currency for each source automatically. In the rare cases it can't, you can set it manually. This matters the moment you report LinkedIn spend next to Google or Meta in another currency.
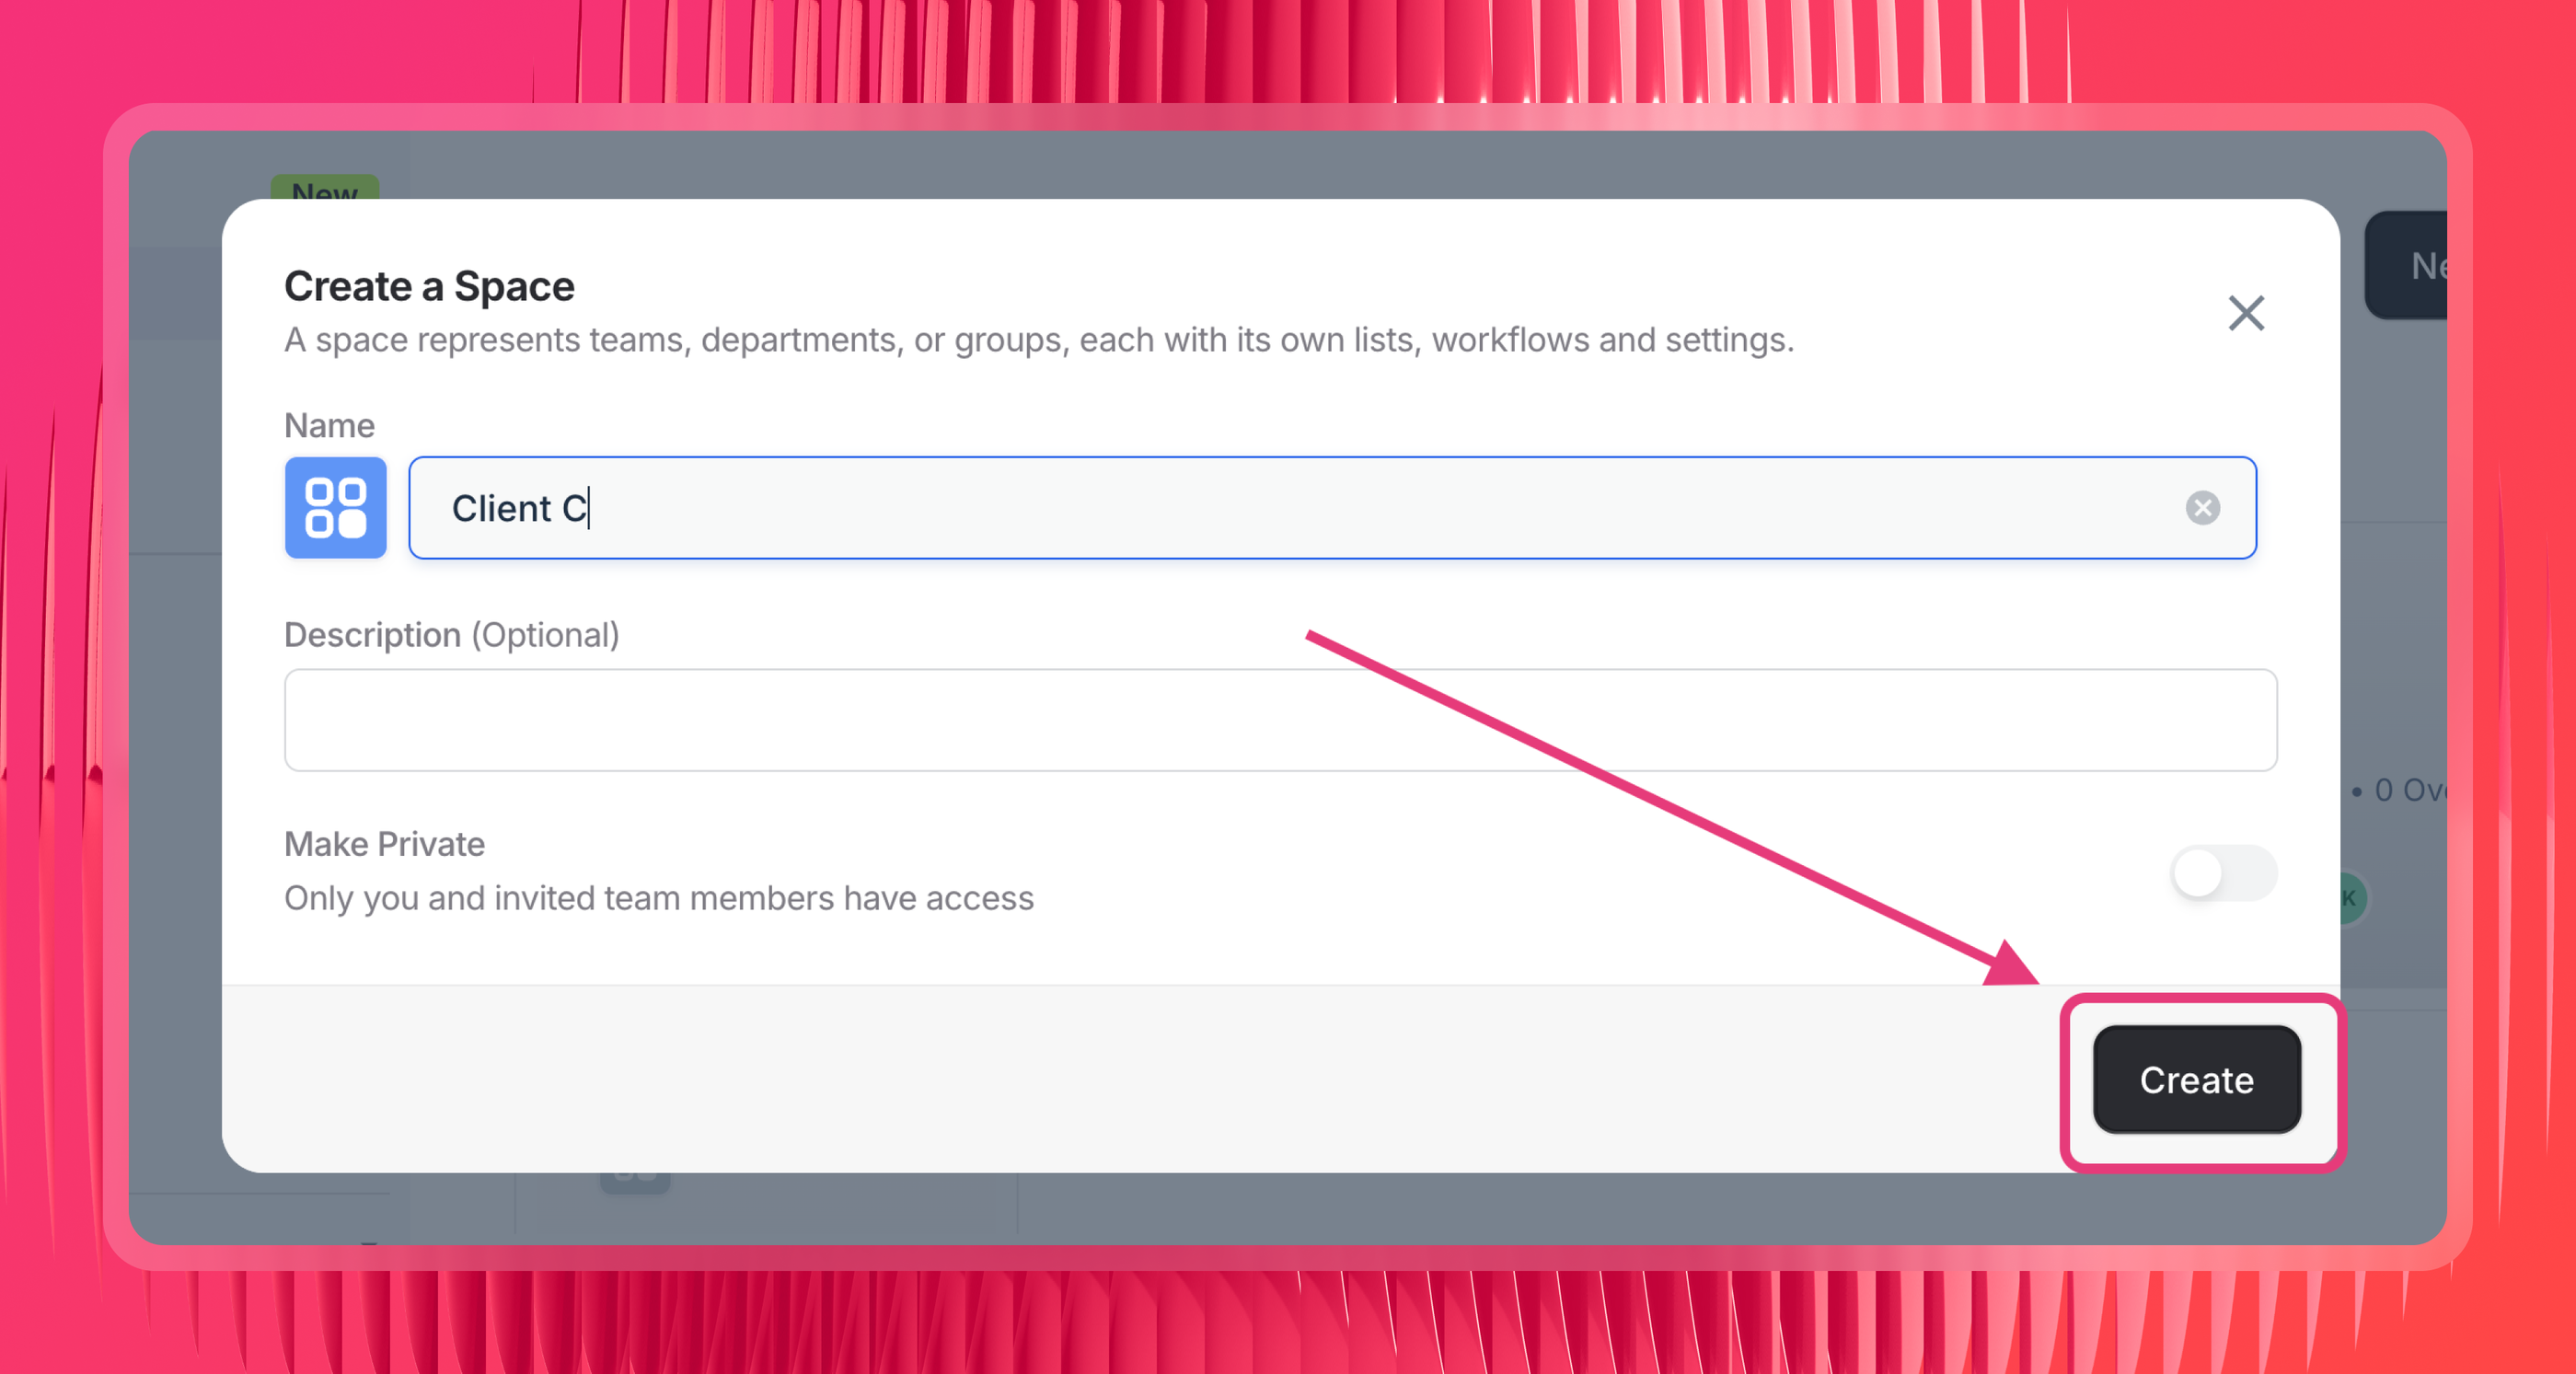
- Organize sources into Spaces by client or location - Name your Spaces after clients and Claude can search data by client name or location name.
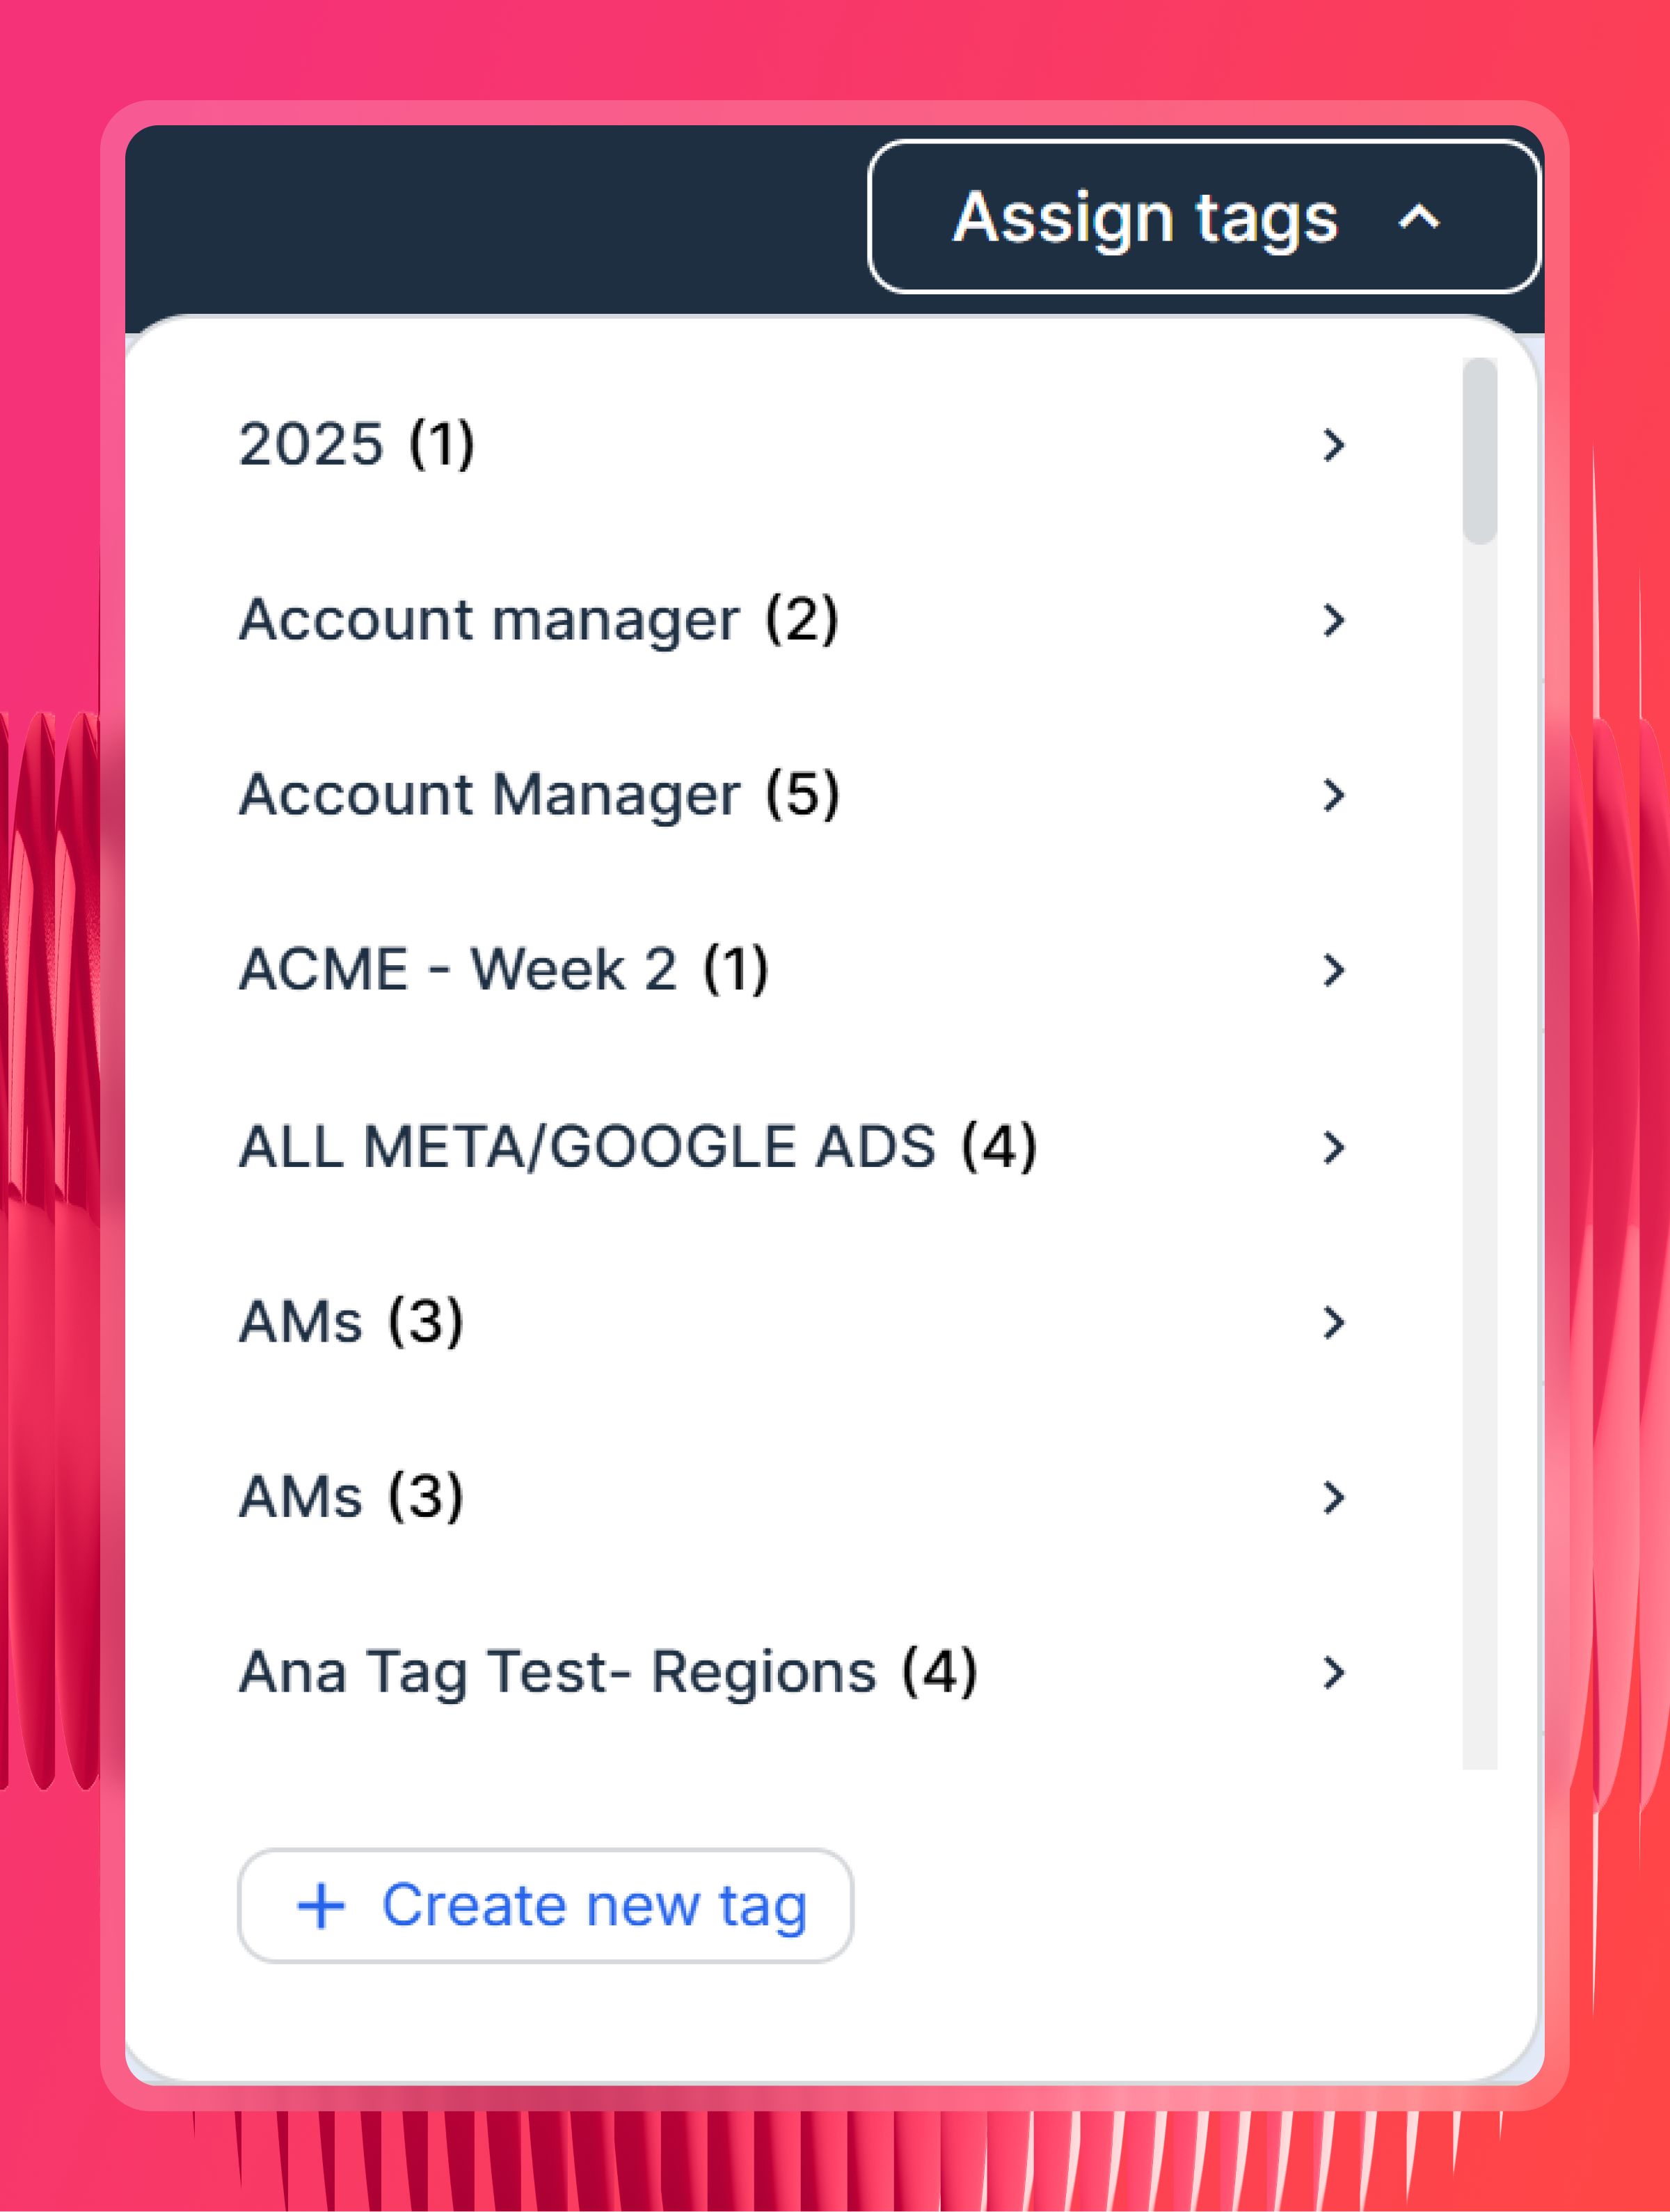
- Tag your sources (optional but useful) - label sources by client, region, or account manager so you can filter by those labels in Claude without spelling out which sources to include every time.
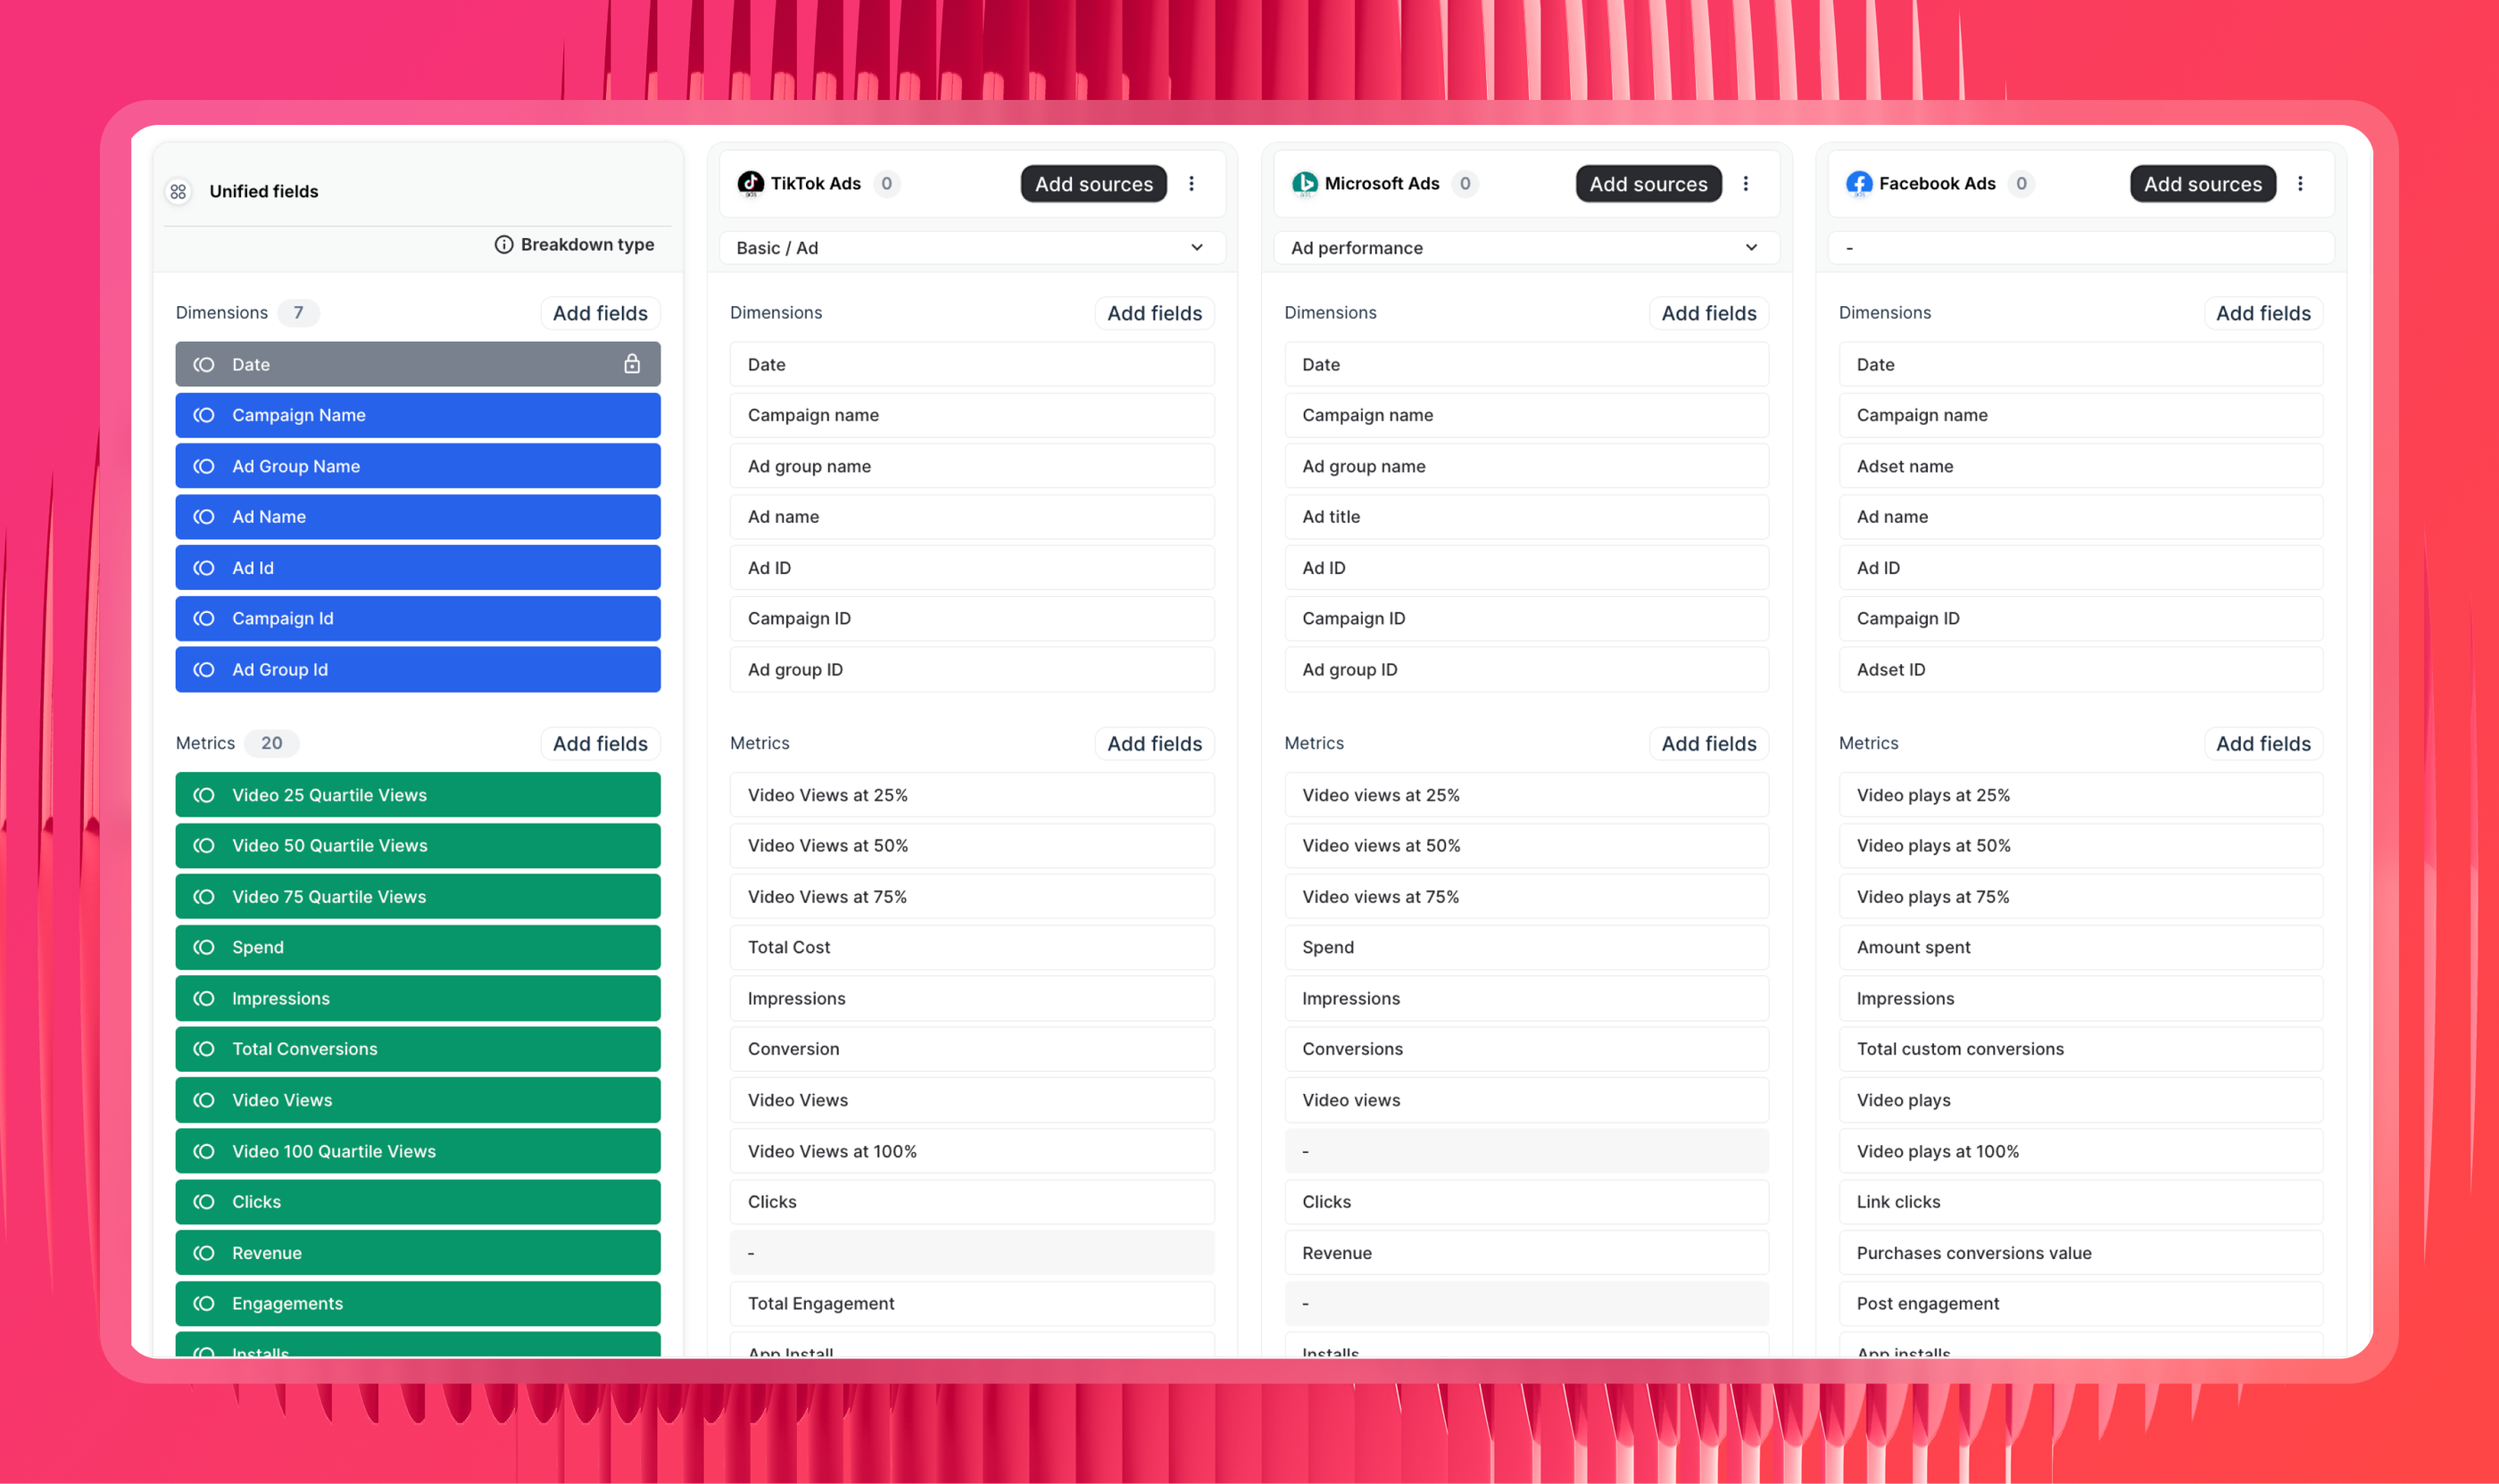
- Create Source Groups for similar channels - if you run LinkedIn Ads across multiple ad accounts, or alongside Google Ads and Meta, aggregate them into a single unified source. Claude can then query across all of them in one go.
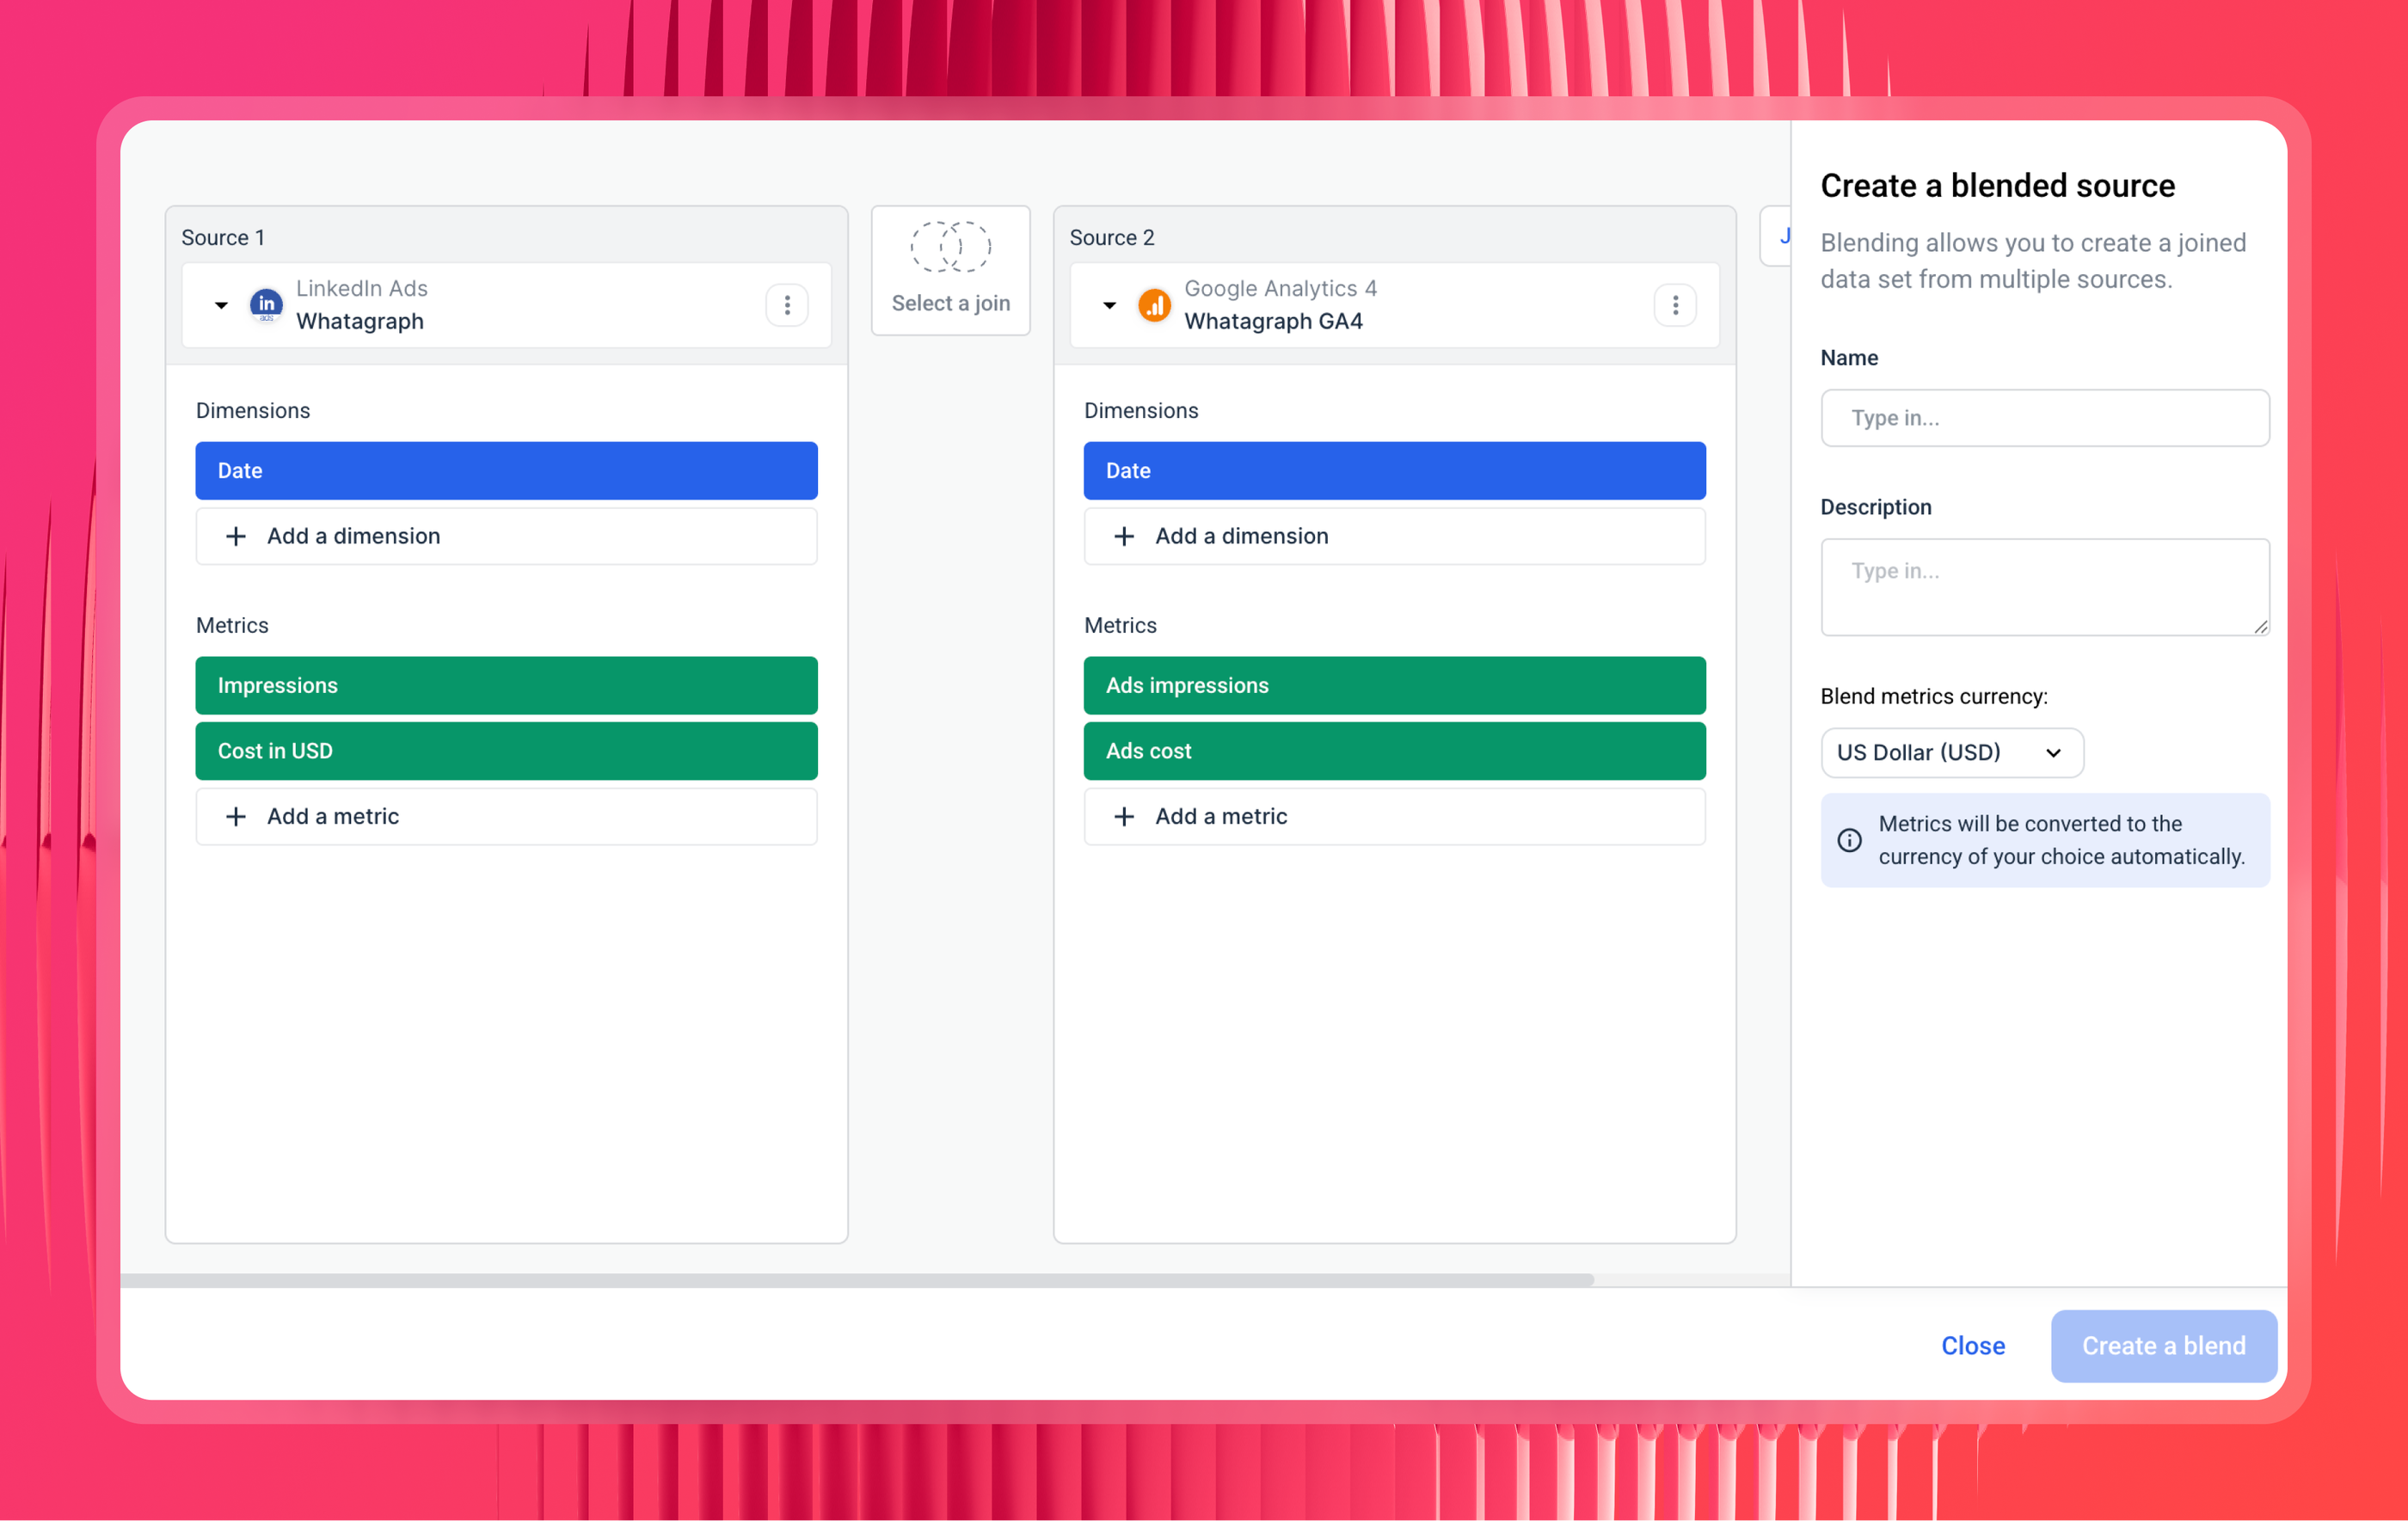
- Create data blends for different channel types - for channels that don't share the same report type, like LinkedIn Ads and GA4 or LinkedIn Ads and HubSpot, use a blend to merge them into one virtual source with a shared join key like date or campaign.
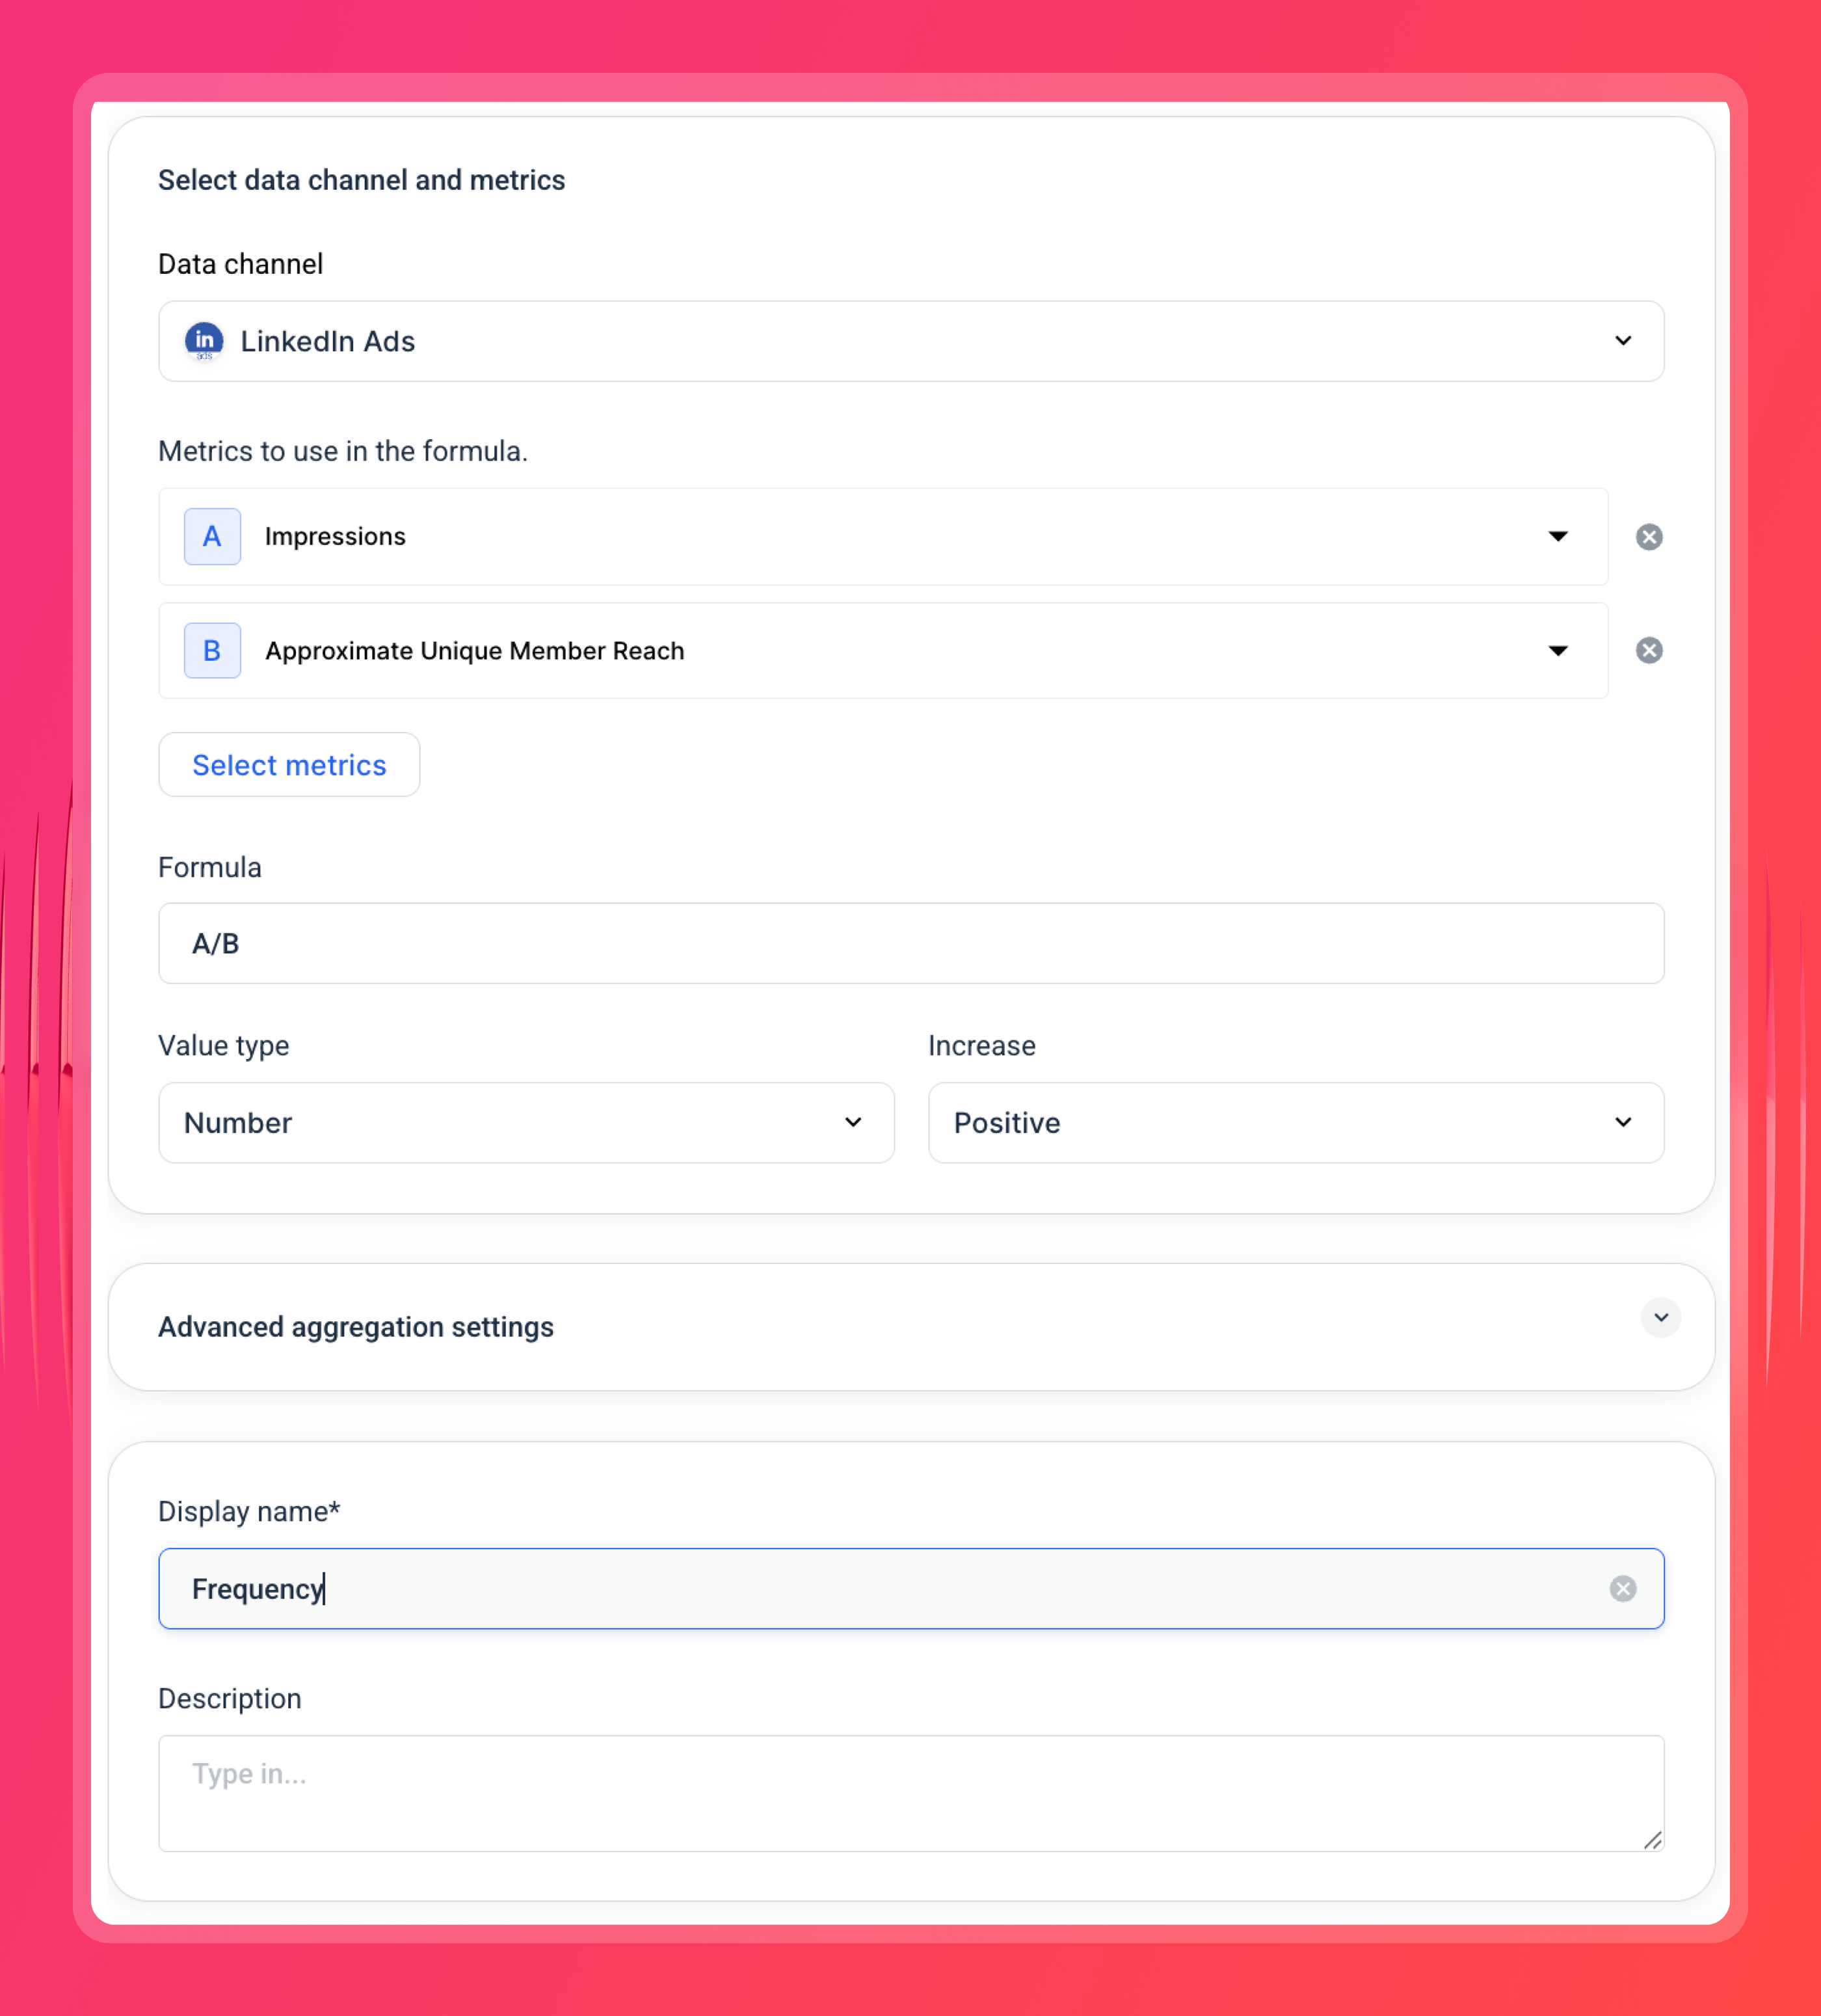
- Define your custom metrics and formulas - create a custom metric like Frequency (Impressions/Reach), your blended ROAS, or define what counts as a conversion.
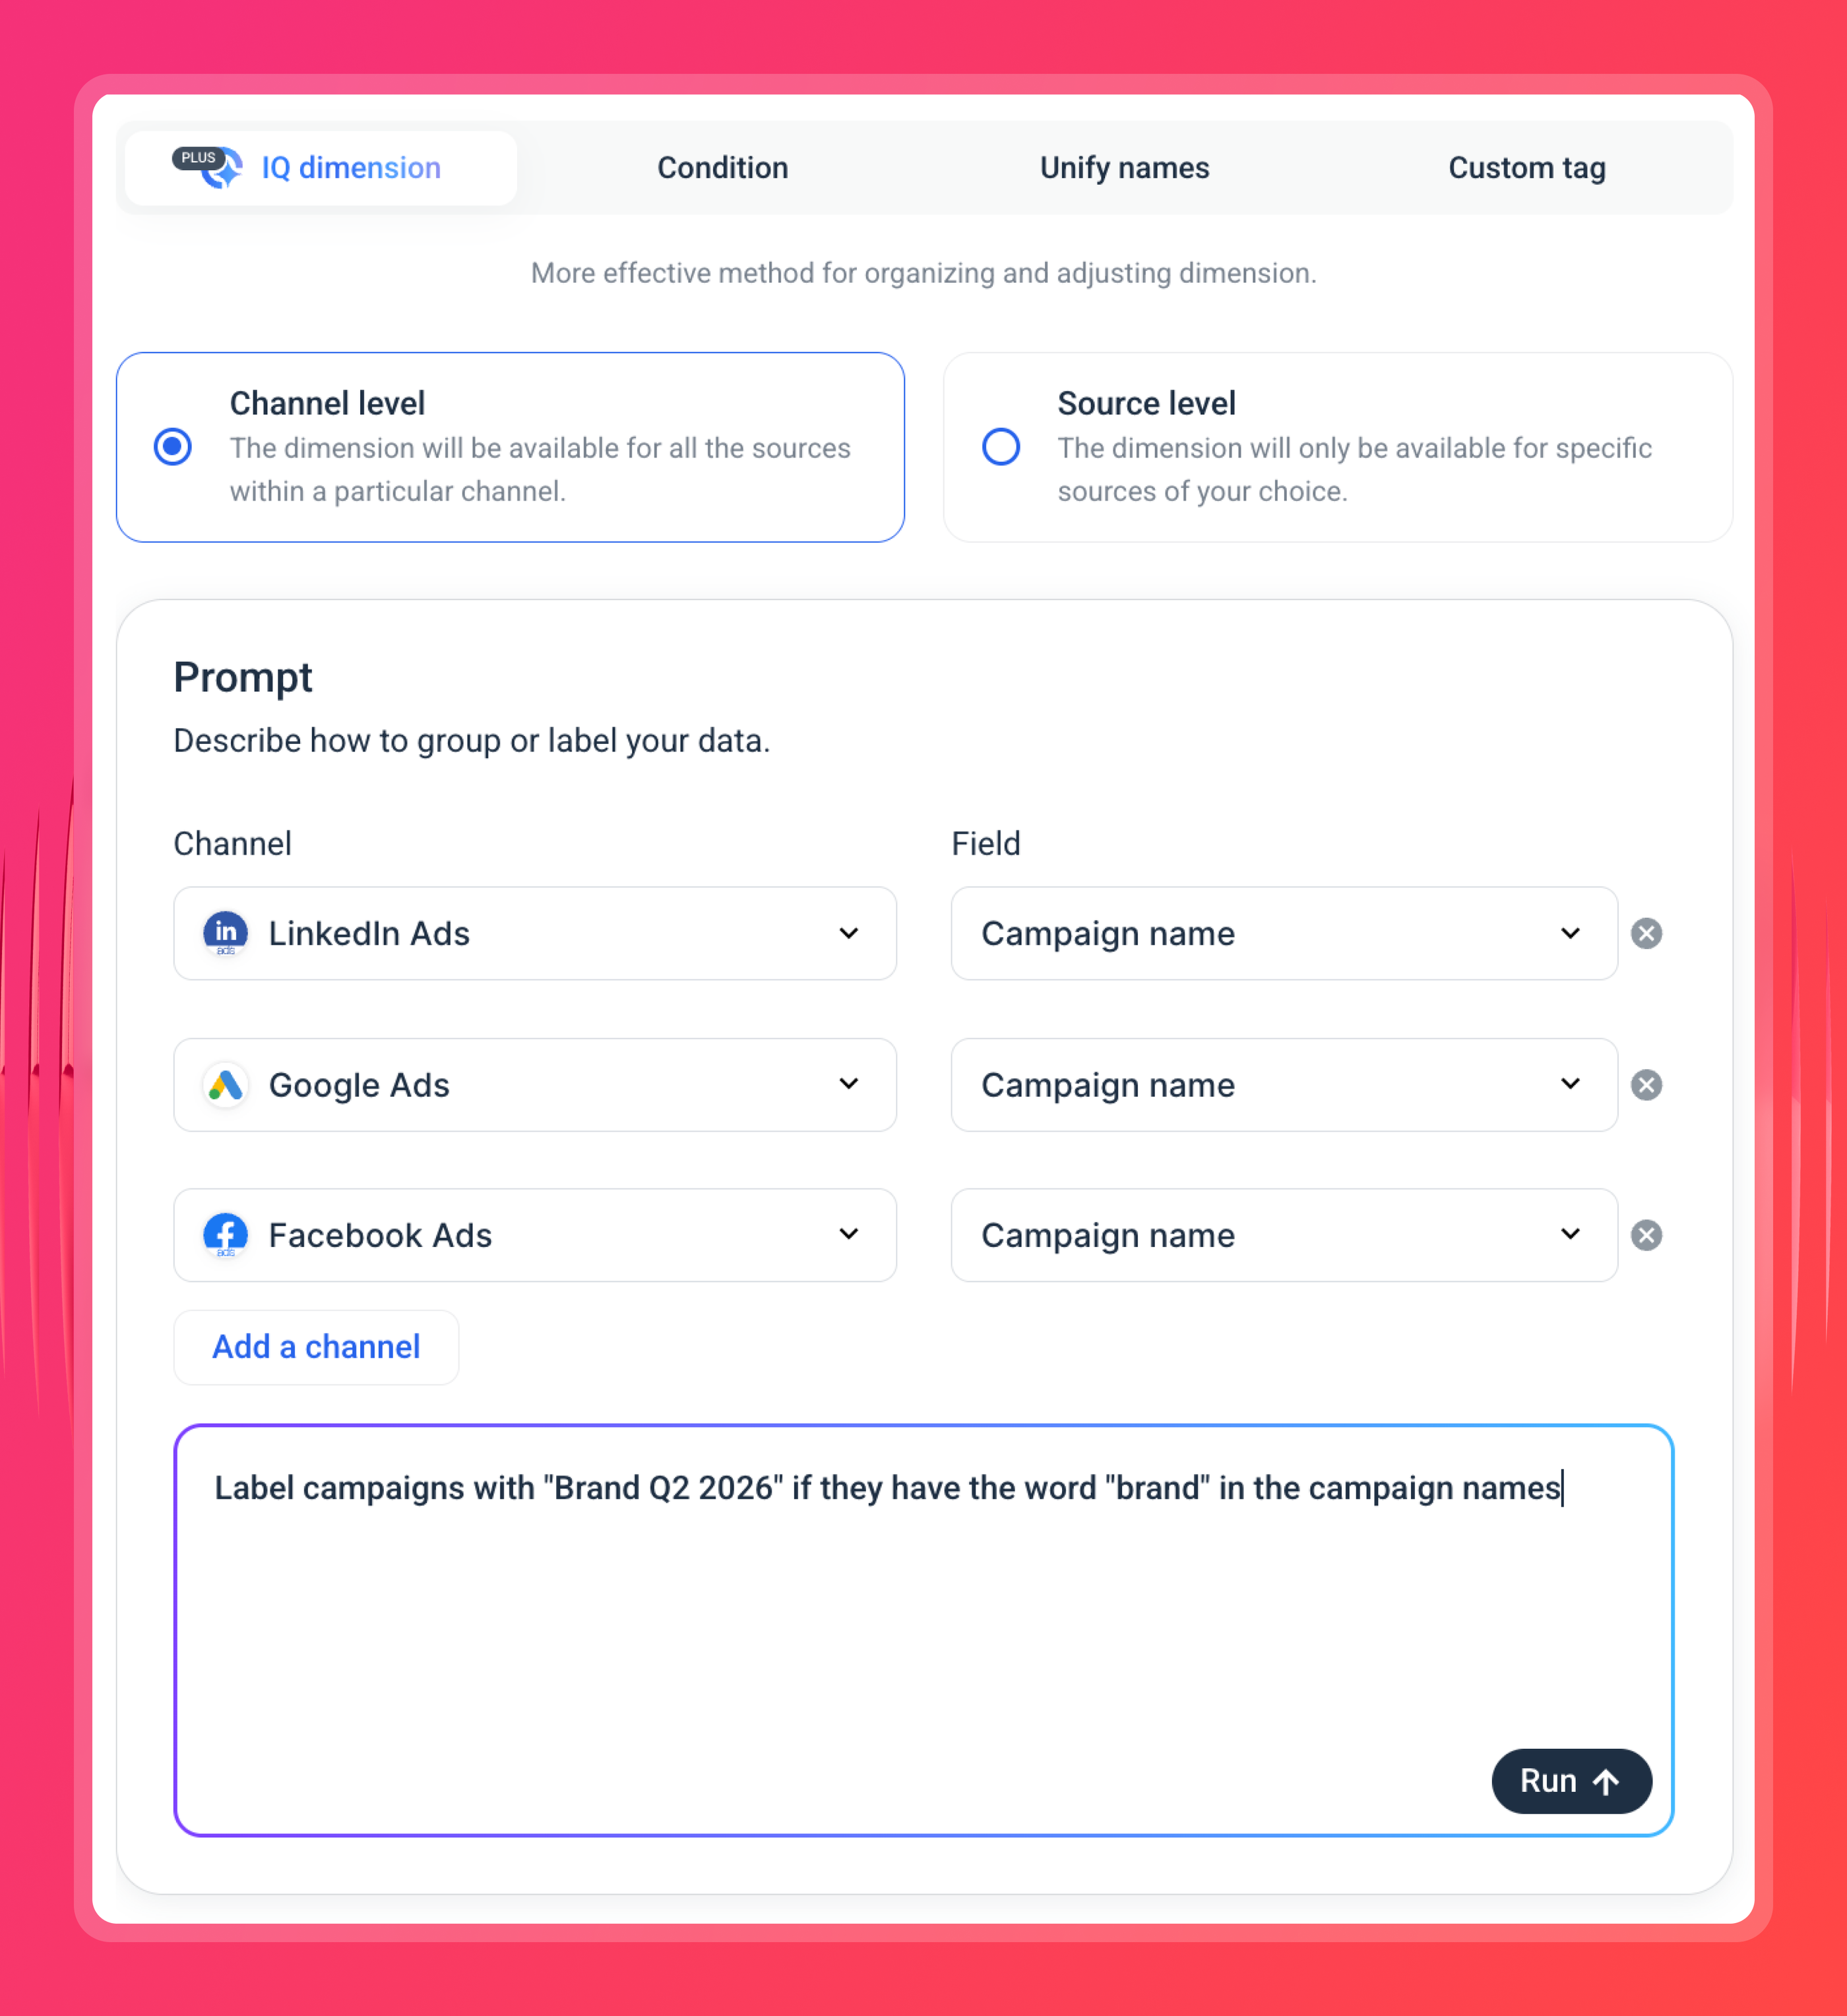
- Define custom dimensions if needed - this is where you tell the platform what things mean to your business. With Whatagraph IQ, you can just select your channels, dimensions, and type in a prompt. Whatagraph will automatically create the custom dimension for you.
The more of this you do upfront, the better Claude's answers will be.
Step 3: Add the Whatagraph MCP connector in Claude
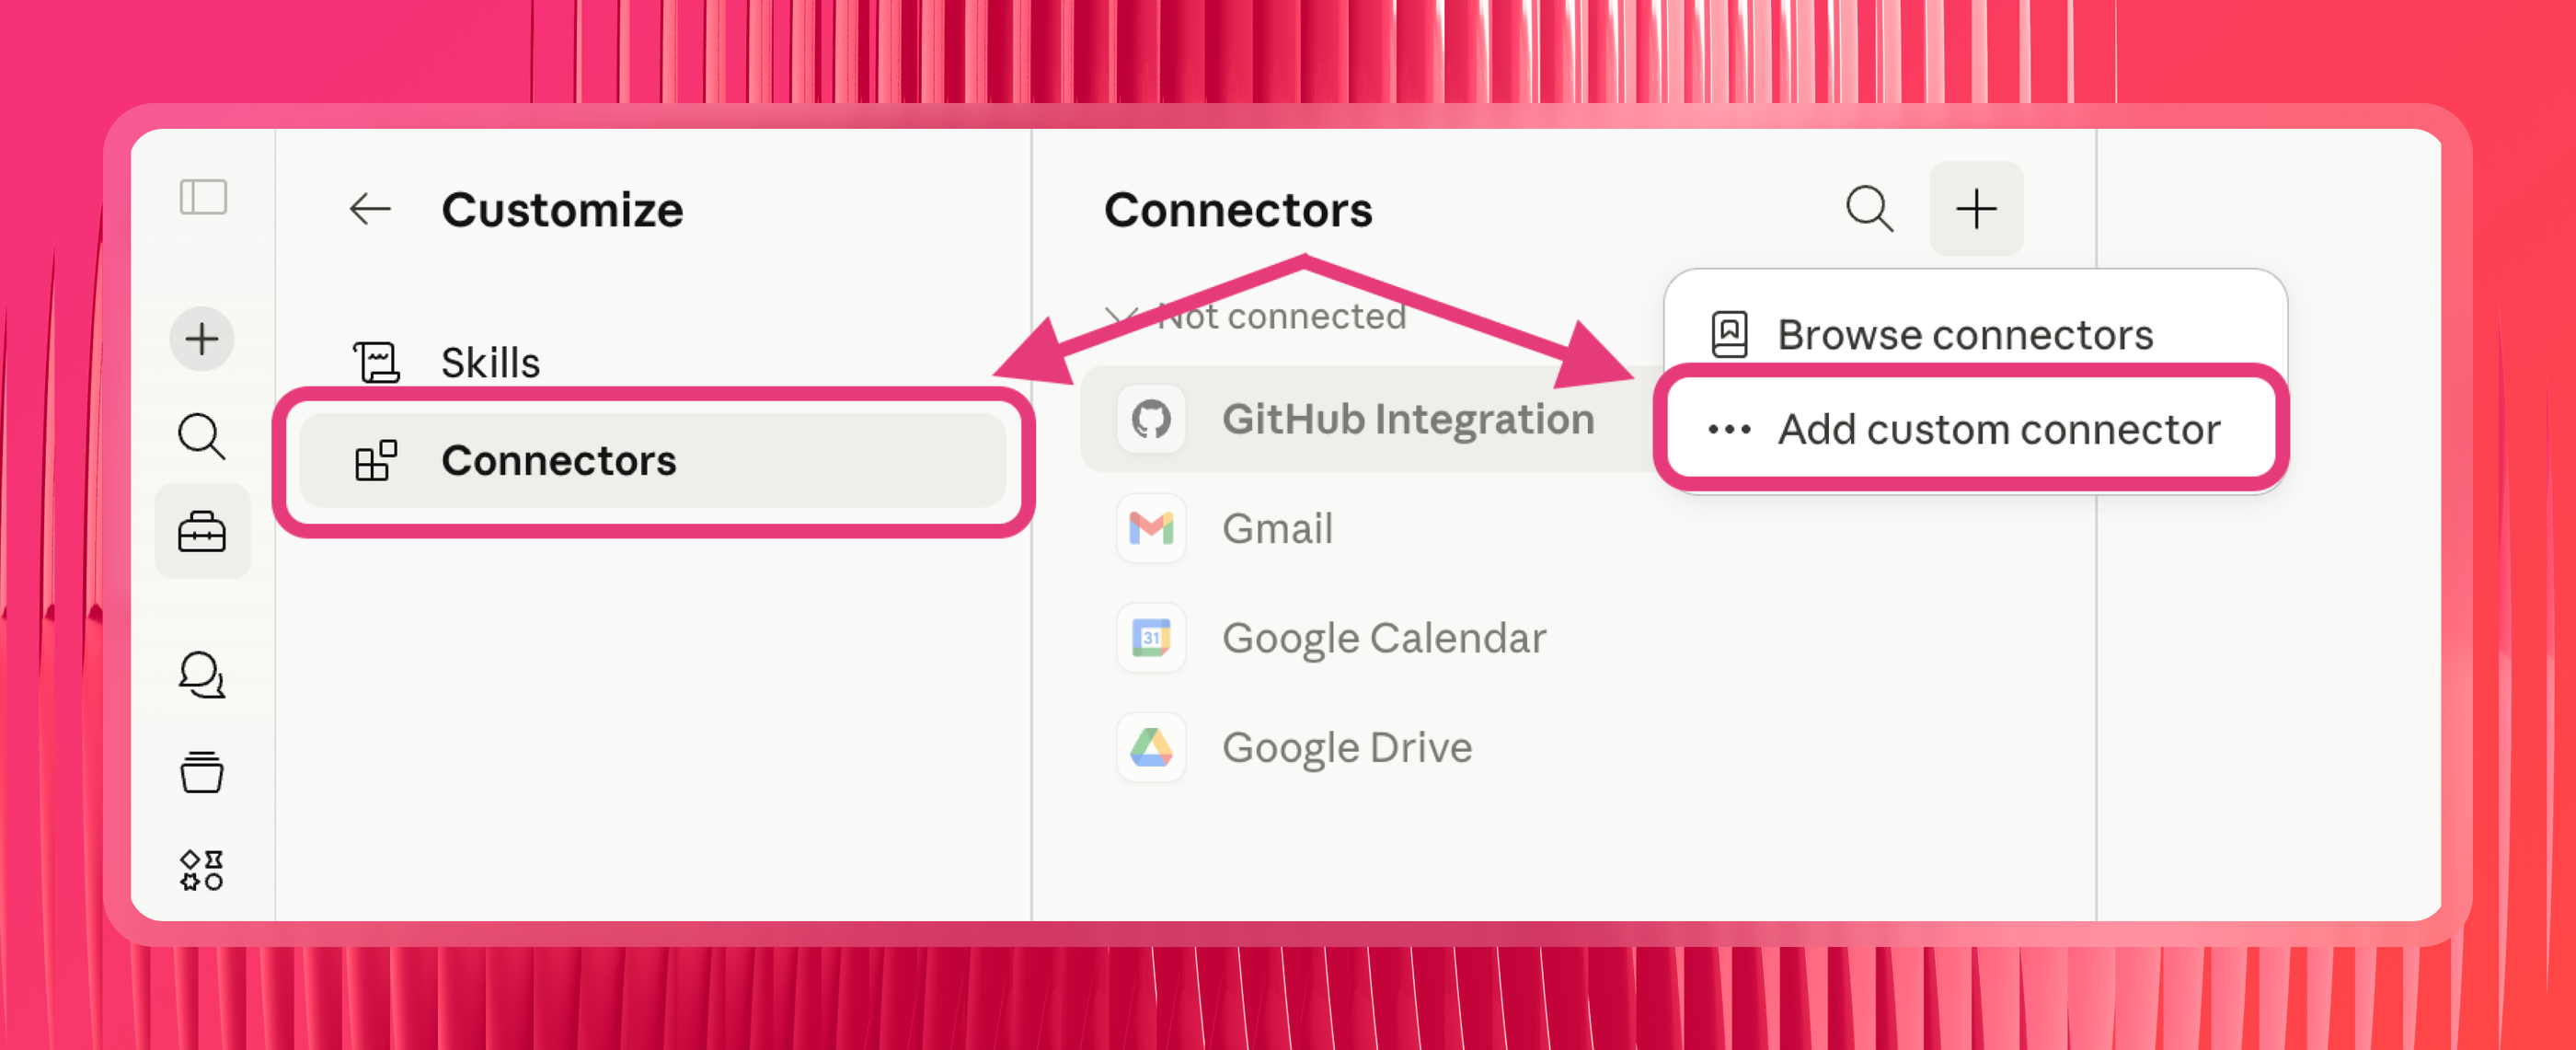
Now go to Claude. Open Settings and navigate to Connectors. Look for the option to add a custom connector.
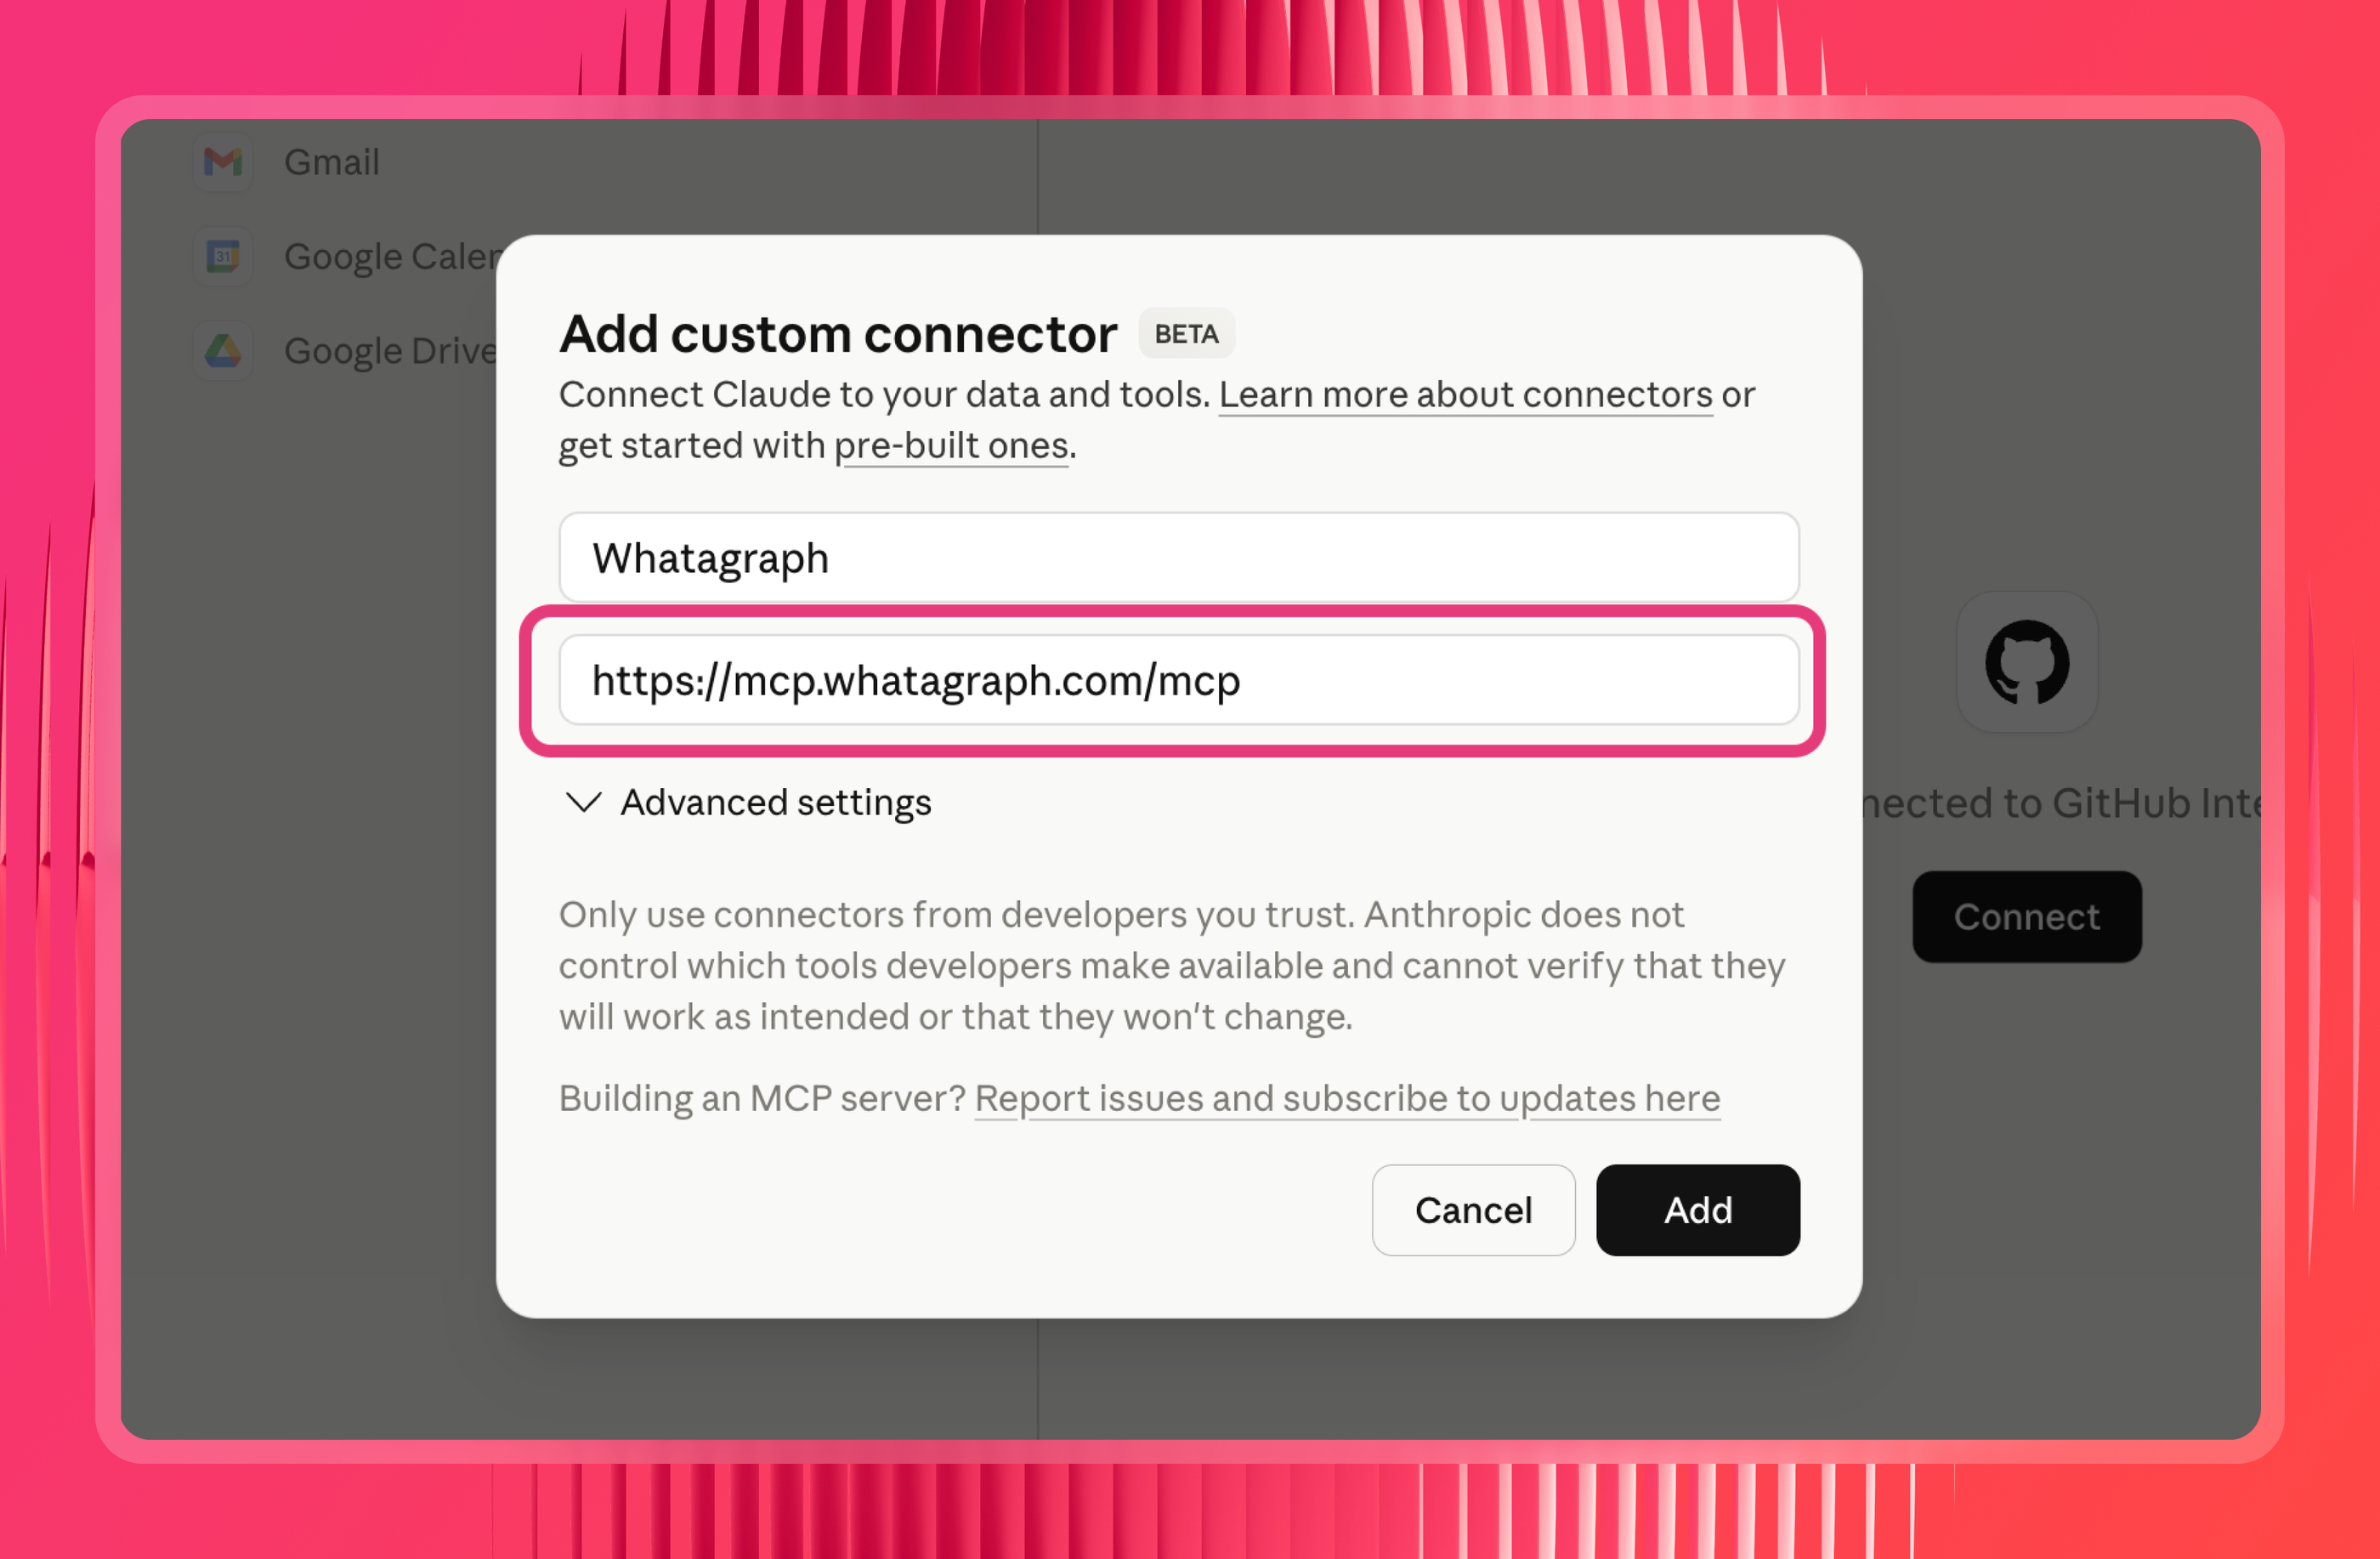
Then paste in the Whatagraph MCP server URL:
https://mcp.whatagraph.com/mcp
For the full walkthrough with screenshots, see Whatagraph's guide on connecting Whatagraph to your AI assistant with MCP.
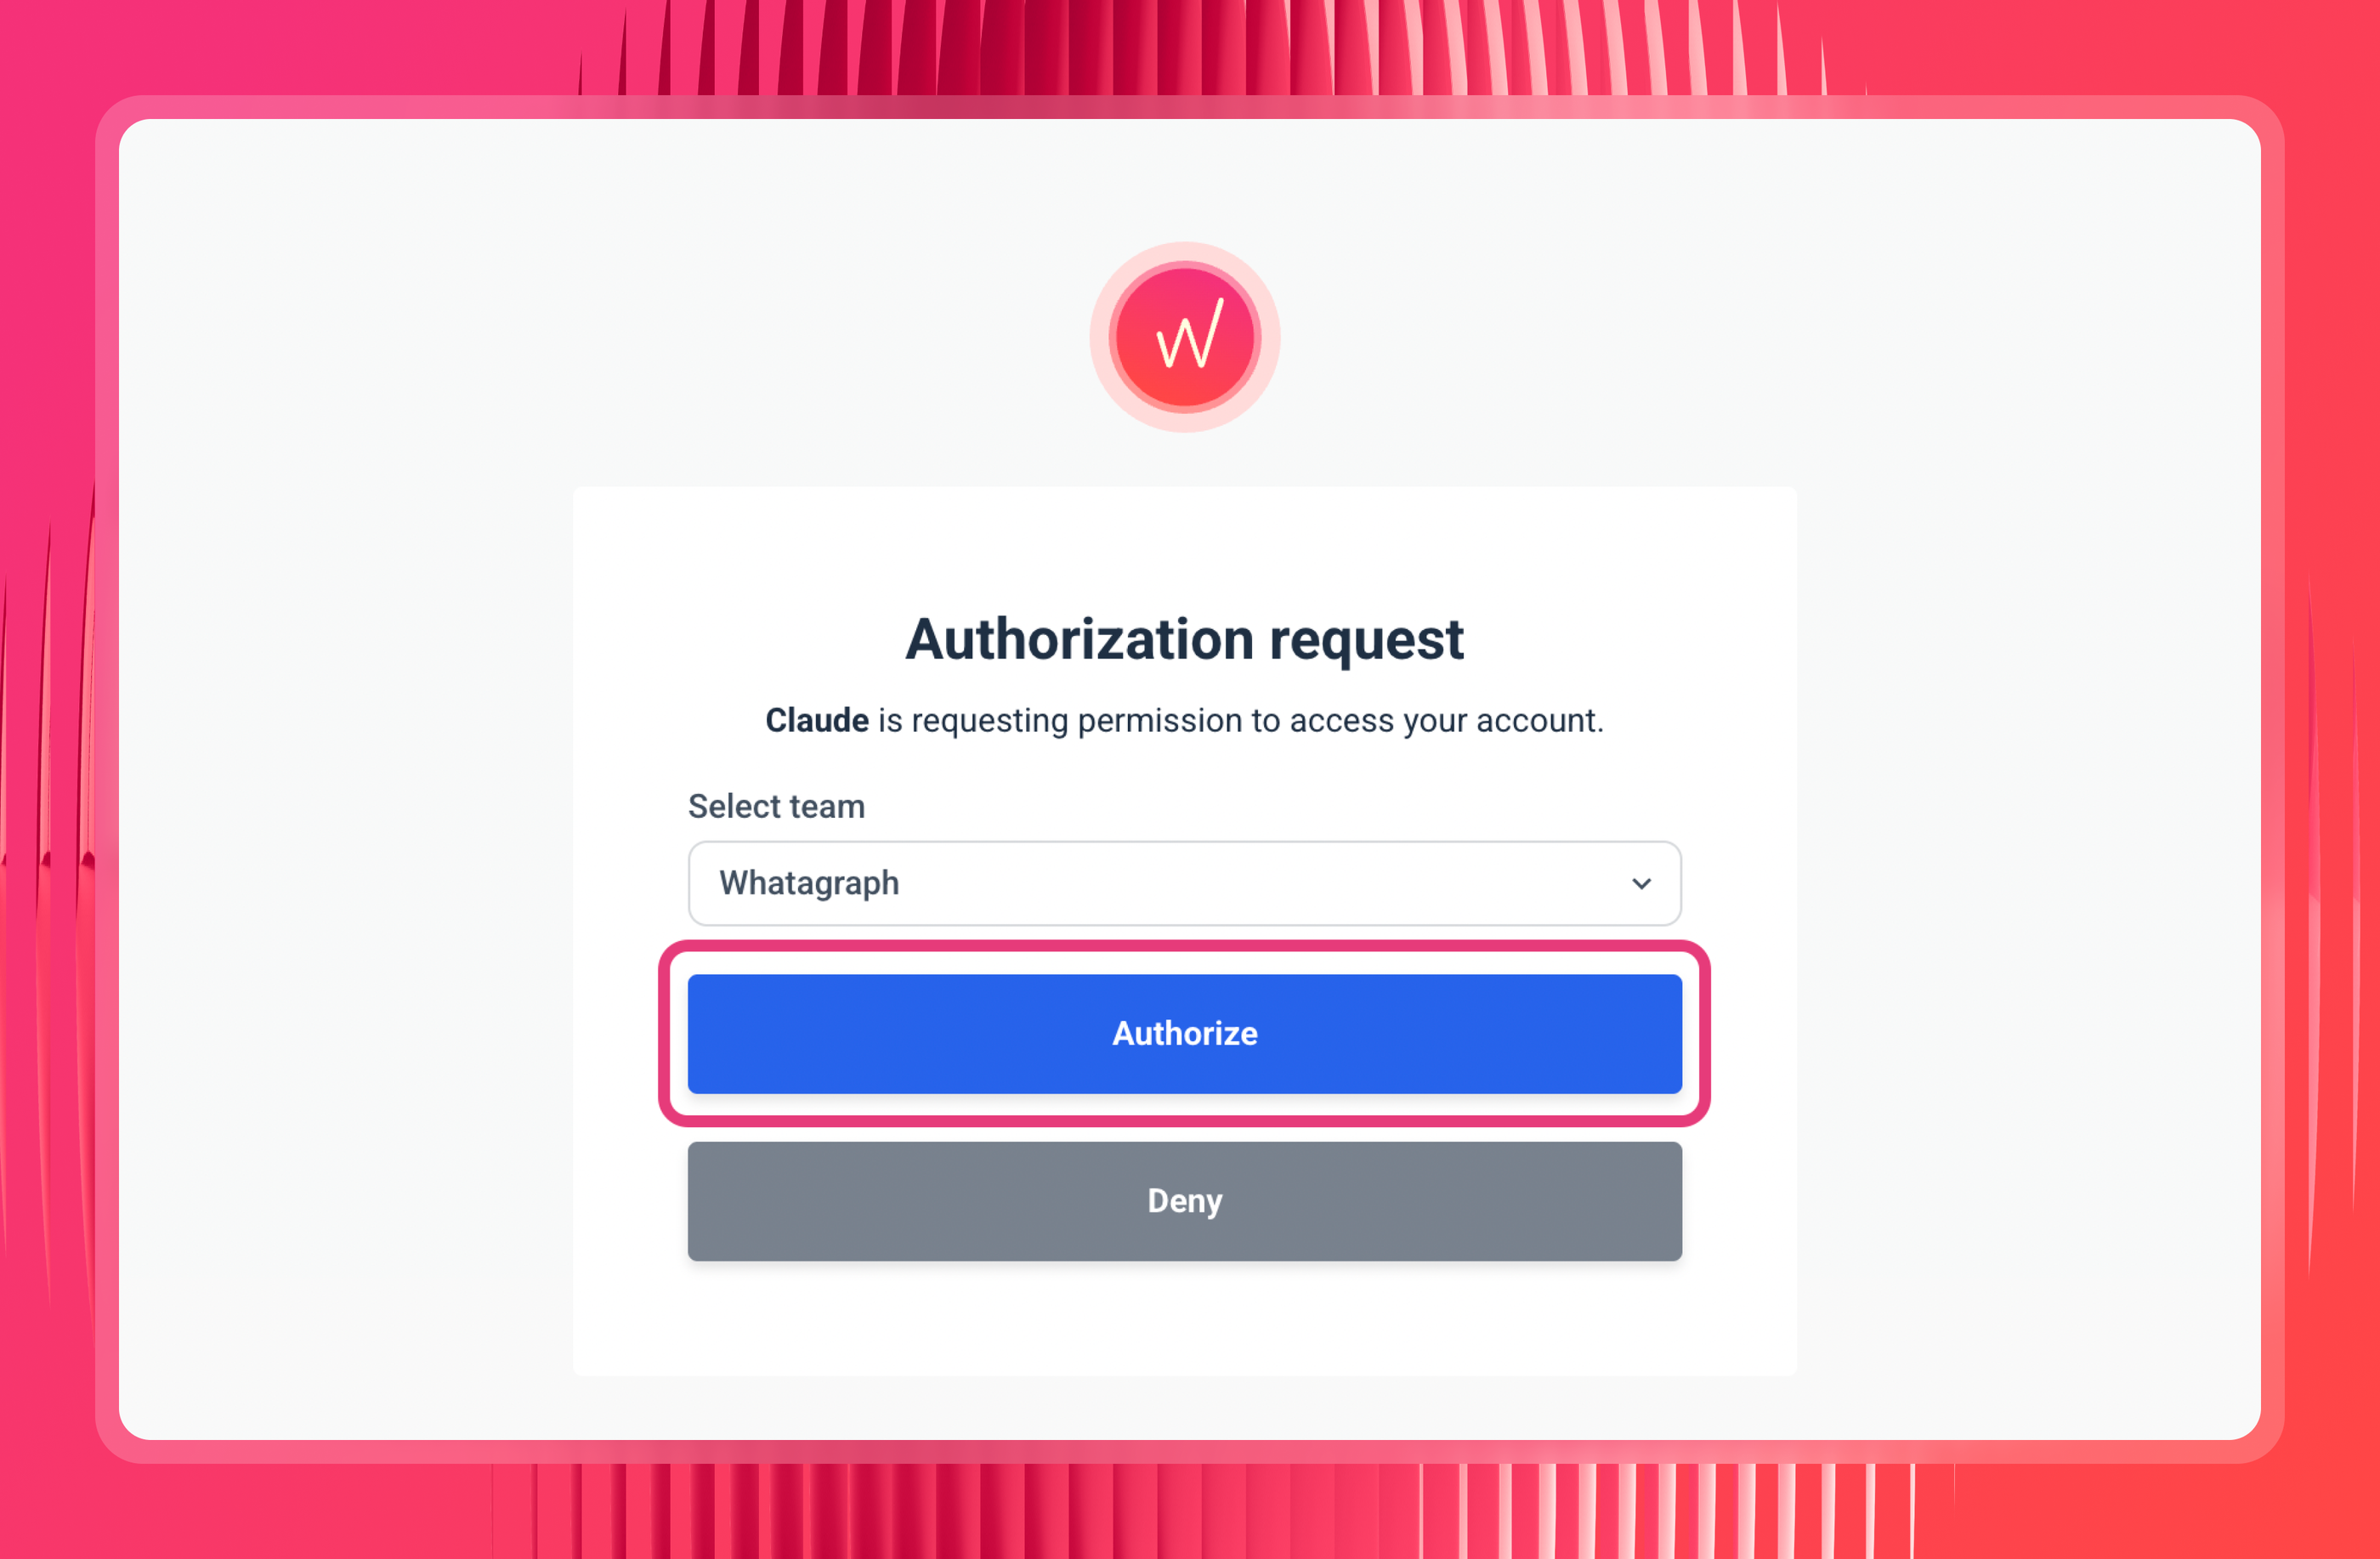
Step 4: Authorize the connection
Claude will open a Whatagraph authorization page. If you're already logged in, you'll go straight to team selection. Pick the team you want Claude to access and click Authorize. No API keys, no passwords, just the one click.
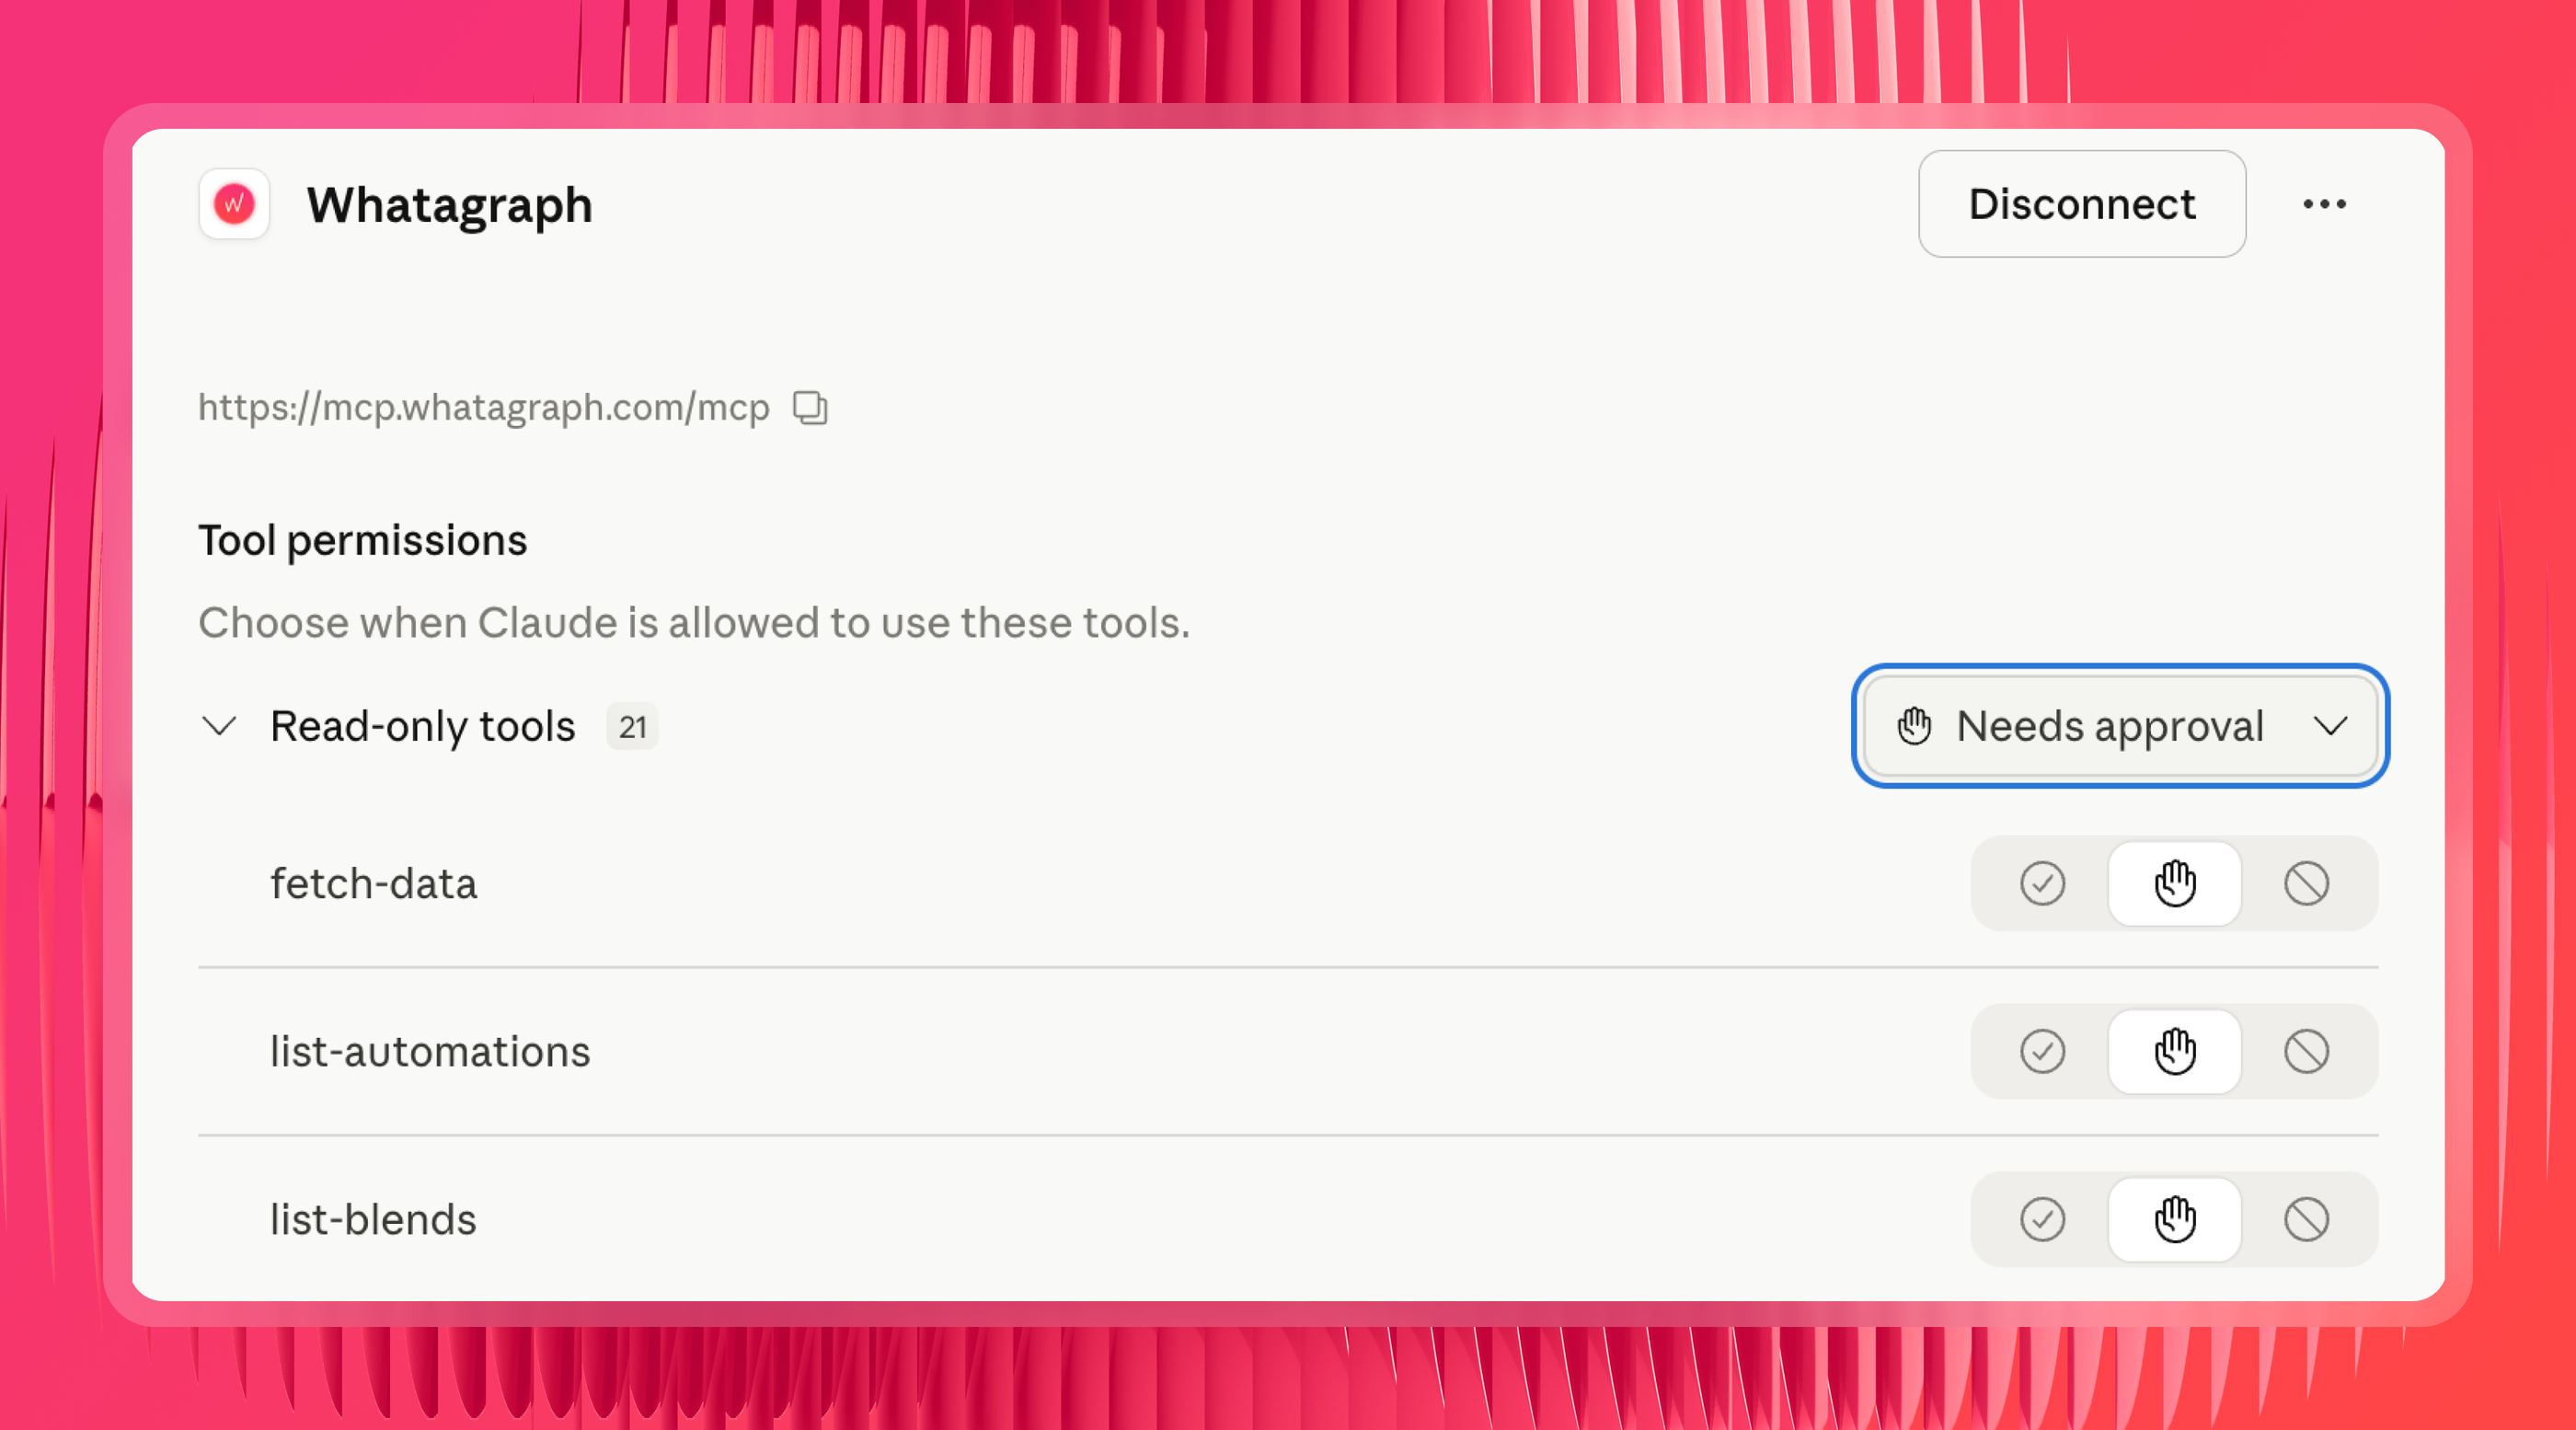
Step 5: Set permissions to "Always allow"
Once connected, you'll see a list of tool permissions. If they're set to "Needs approval," Claude will ask you to authorize every single time it pulls data, which gets old fast. Switch it to "Always allow" to skip that.
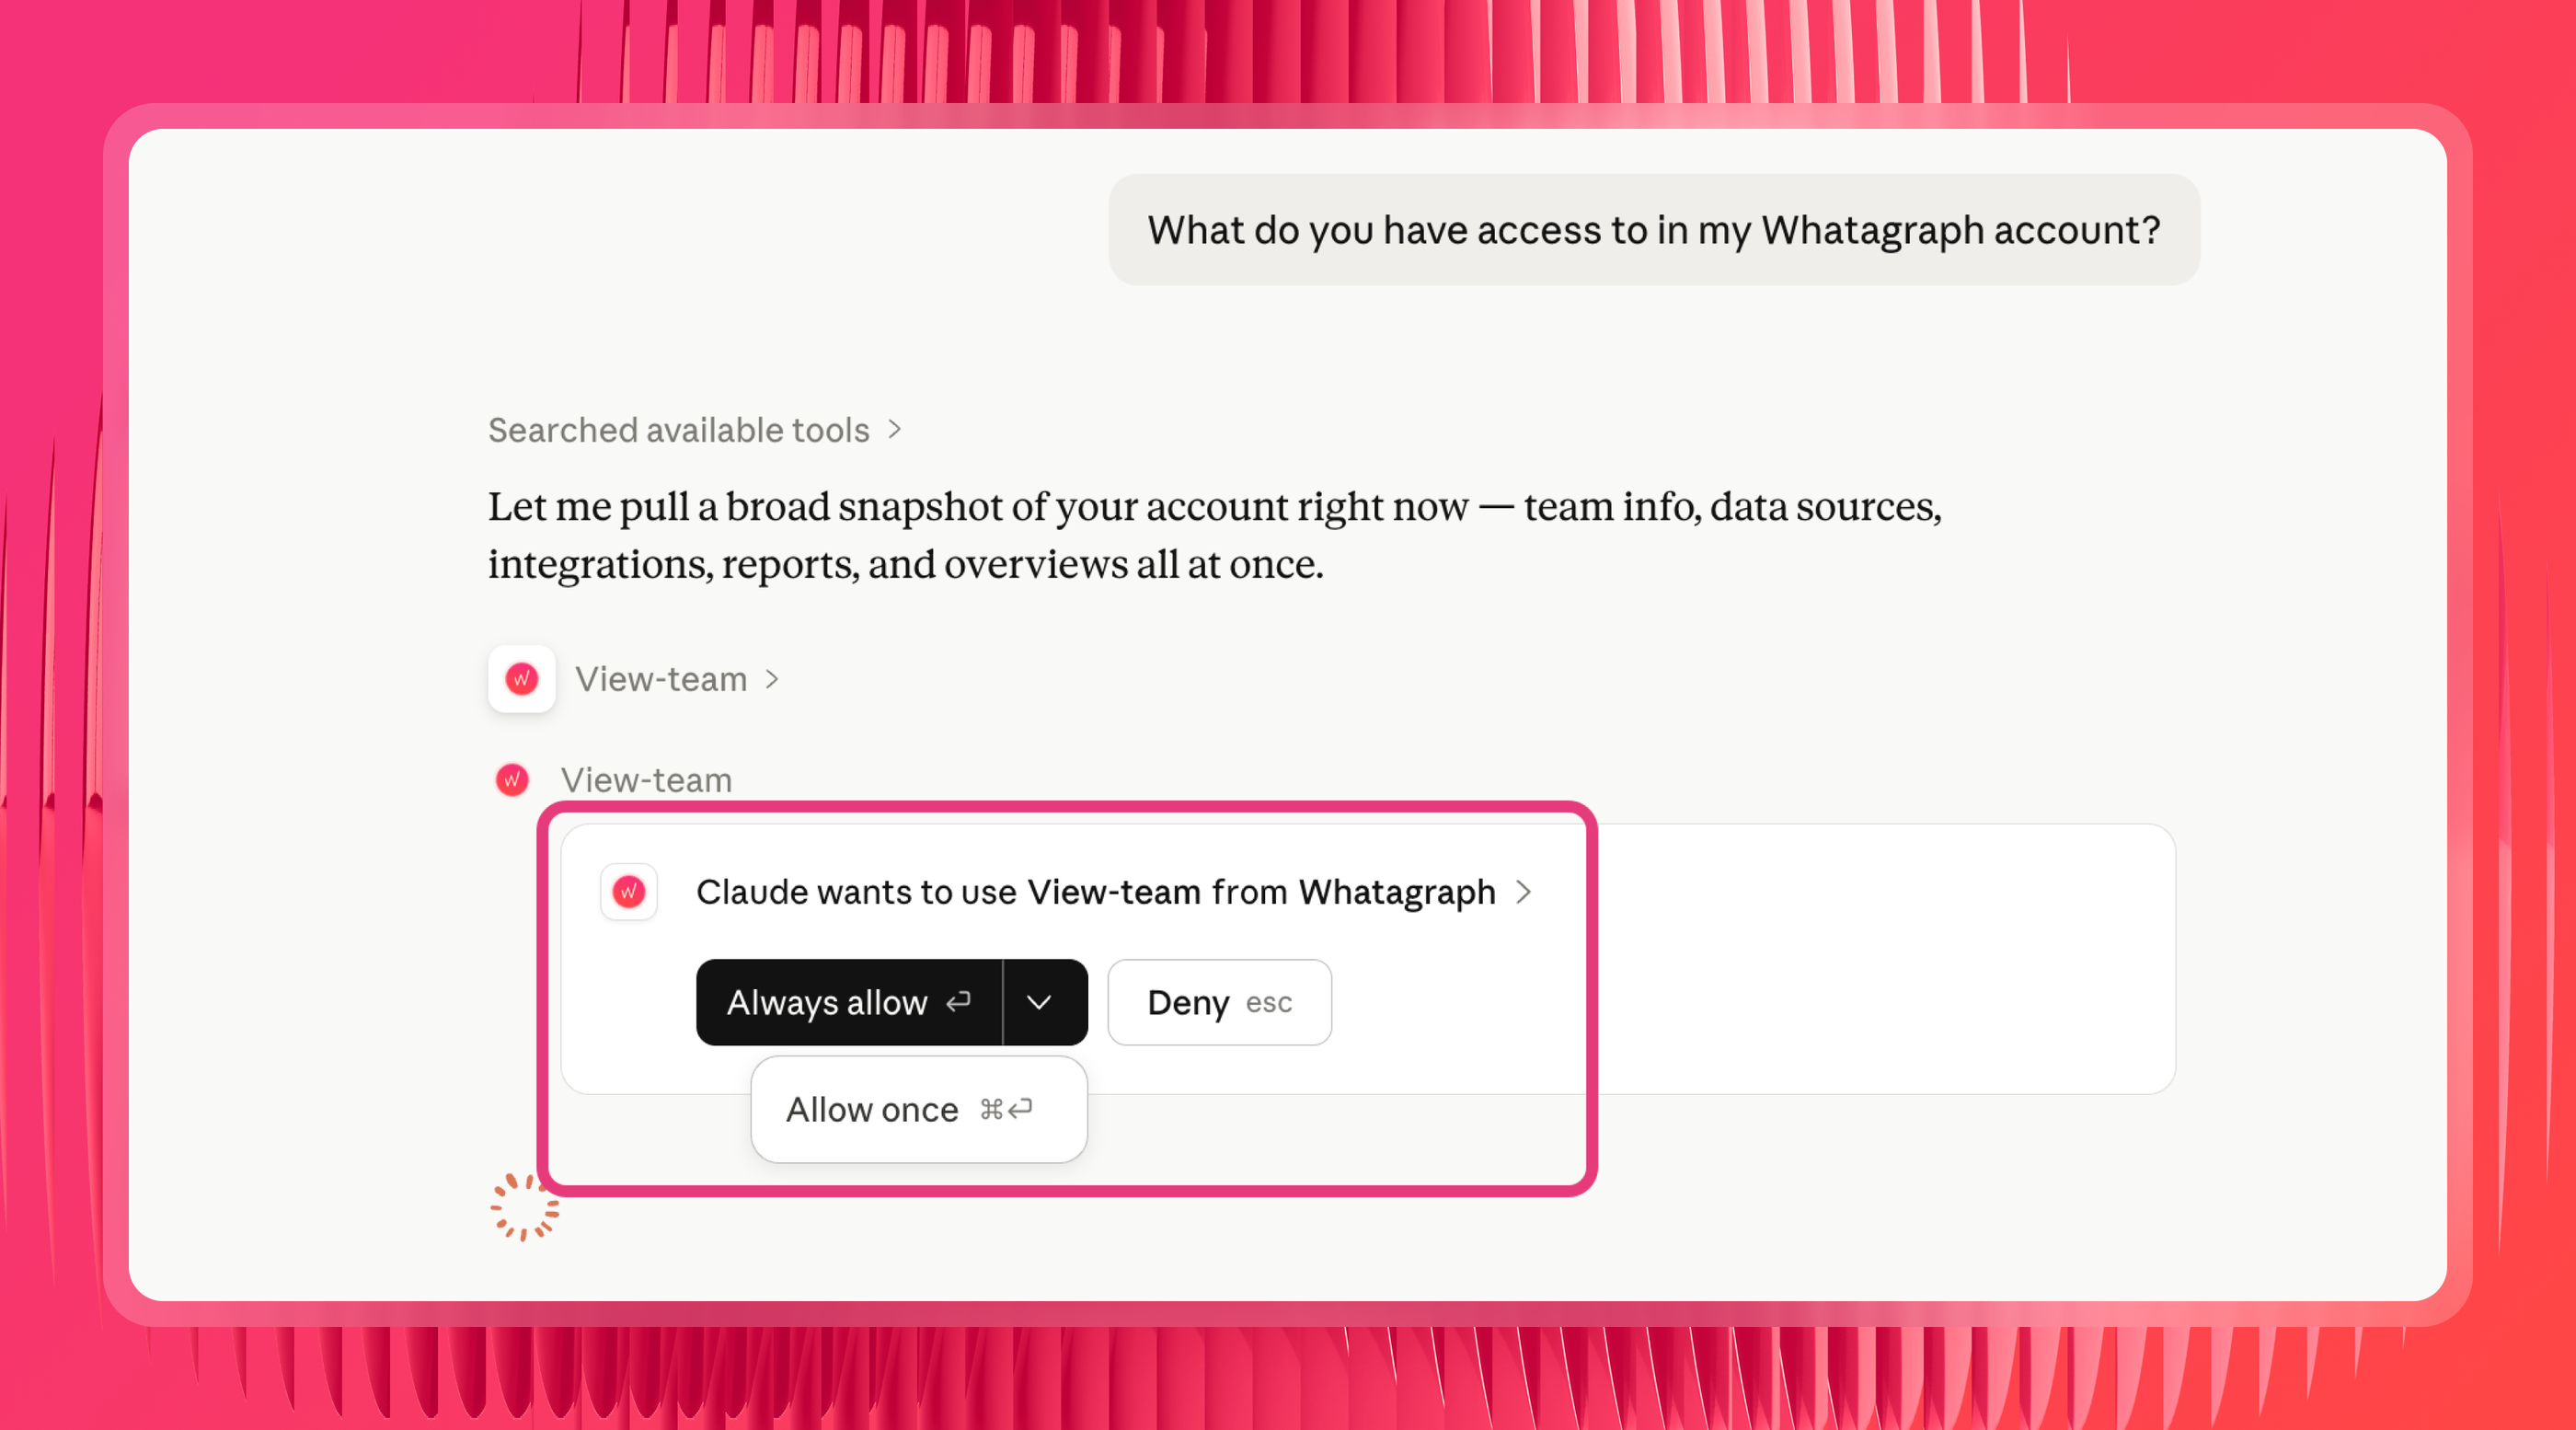
Step 6: Test it
Ask Claude: "What do you have access to in my Whatagraph account?" It should come back with your connected sources and account details. If it does, you're good to go.
Step 7: Add your own organizational context with Claude skills (optional but recommended)
Whatagraph ships with a set of pre-built skills embedded directly in its MCP. So you don't need to create your own or download and upload skills from GitHub to Claude.
As Laurynas explains it:
Each of Whatagraph's pre-made skills either sequences multiple tool calls in a logical order, or brings structured knowledge so you don't have to piece the picture together yourself.
What you can add on top is your own organizational context.
For instance, you can create a custom Claude skill that tells Claude things only you know: which source groups map to which clients, what your CPL formula is, which campaigns to prioritize, which Lead Gen Forms count as real conversions.
Want more pre-made skills? Check out the Claude Skills for Growth Marketing repo made and open-sourced by Pau Ferrer, paid media specialist and marketing engineer.
LinkedIn Ads prompt library by use case
Once your LinkedIn Ads data is connected and your business logic is set up in Whatagraph, you can use these prompts to analyze it in Claude.
The prompts below follow how experienced LinkedIn marketers actually read a campaign: from reach, to relevance, to engagement, to pipeline.
Each group has single-channel LinkedIn Ads prompts first, then cross-channel prompts that pull LinkedIn in alongside Google Ads and Meta Ads.
Reach and audience penetration
For B2B, the first question isn't clicks. It's whether you're actually saturating the target account list.
Audience penetration and frequency are the metrics seasoned LinkedIn marketers watch first, because reaching 80% of your audience often enough is what makes everything downstream work.
As Patrick Cumming, Founder at Ad Juice, puts it:
CTR, CPMs and CPCs are a total waste of time to track. The only things that really matter: are you reaching 80% audience penetration and 10 frequency every 90 days. Is it converting to pipeline or not?
Single-channel LinkedIn Ads prompts:
- "Show me audiencePenetration, reach, and frequency by campaignName this quarter. Which campaigns are under 80% penetration?"
- "Which campaigns have a frequency below 10 over the last 90 days? These audiences may not be seeing ads often enough."
- "Break down reach and costPerThousandMemberAccountsReached by MEMBER_COMPANY_SIZE for my ABM campaigns this month."
- "Show me impressions, reach, and frequency trends week over week for my top campaign. Is saturation building or stalling?"
Cross-channel prompt:
- "Which channel is reaching my target accounts most efficiently this quarter? Compare cost to reach the same audience on LinkedIn Ads, Google Ads, and Meta."
Relevance and audience breakdowns
LinkedIn's edge is B2B targeting, so for B2B marketers this is where the real insight lives. Break performance down by who's actually responding, watch the conversion rate per segment, then trim what isn't earning its budget.
Single-channel LinkedIn Ads prompts:
- "Break down costInLocalCurrency, qualifiedLeads, and costPerLead by MEMBER_JOB_FUNCTION this month. Which job functions convert cheapest?"
- "Show me performance by MEMBER_SENIORITY for my lead gen campaigns in the last 30 days."
- "Compare costPerLead across MEMBER_COMPANY_SIZE segments. Which company sizes justify more budget?"
- "Which MEMBER_INDUSTRY segments have high audiencePenetration but few qualifiedLeads? These may be the wrong fit."
- "Show me MEMBER_COUNTRY_V2 performance for my top campaign so I can see where leads are coming from."
Cross-channel prompts:
- "For my B2B audiences, compare cost per lead on LinkedIn Ads against Google Ads and Meta for the same period."
- "Which channel reaches my target seniority most efficiently this quarter?"
Engagement signals
Engagement is the leading indicator of intent, the early read on whether your message is landing before pipeline shows up weeks later. CTR, dwell time, and video views are worth watching here as signals, not as the scoreboard.
Treat these as early signals, then judge the campaign on penetration and pipeline.
Single-channel LinkedIn Ads prompts:
- "Show me engagementRate, ctr, averageDwellTime, and videoViewRate by campaignName for the last 30 days. Which campaigns signal the strongest intent?"
- "Which Sponsored Content ads had the best ctr and averageDwellTime last week? Include impressions, clicks, and costInLocalCurrency for the top 10."
- "Compare engagementRate and videoViewRate across my ad formats: single image, document, video, and Message Ads."
- "Show me a week-over-week ctr and averageDwellTime trend for my top 5 ad creatives. Which ones are fatiguing?"
Cross-channel prompt:
- "Compare creative ctr and engagementRate across LinkedIn Ads, Google Ads, and Meta for the last 30 days."
Pipeline and lead quality
This is the question that actually matters: is it converting to pipeline or not? Lead Gen Forms, qualified leads, and SQLs are where LinkedIn campaigns prove their worth for B2B teams.
Single-channel LinkedIn Ads prompts:
- "Show me oneClickLeads, qualifiedLeads, costPerLead, and oneClickLeadFormOpens by campaignName for the last 30 days. Which forms convert best after opening?"
- "Which Lead Gen Form campaigns have a high oneClickLeadFormOpens count but a low completion rate right now?"
- "Compare costPerLead between my Lead Gen Form campaigns and my website-conversion campaigns this month."
- "Find campaigns where qualifiedLeads dropped but spend went up compared to last month."
- "Plot qualifiedLeads over the last 365 days so I can see the pipeline trend, not just this month's snapshot."
Cross-channel prompt:
- "Compare cost per qualified lead from LinkedIn against Google Ads and Meta for this quarter. Which channel is actually feeding pipeline?"
Creative fatigue
LinkedIn creatives wear out slower than they do on Meta, more like 35 to 45 days, but they still wear out. The trick is catching it before performance fully tips over.
The real signal isn't a single bad week; it's a creative whose CTR is sliding from its own peak while frequency climbs and you're just hitting the same people again.
A quick note on dates: pull at least 4 to 6 weeks so you get enough weekly points to see a trend, not just a snapshot.
Single-channel LinkedIn Ads prompts:
- "For my active creatives over the last 42 days, pull clicks, impressions, and ctr by creativeName and week. Flag any creative whose weekly CTR has dropped more than 50% from its peak week and is still sliding."
- "Calculate frequency for each creative as impressions divided by approximateMemberReach for the last 42 days. Flag anything above 4x on cold audiences or 5x on retargeting, that's saturation."
- "Pull audiencePenetration by campaignName. Which campaigns are past 65% penetration on cold audiences, where I'm mostly just re-showing ads to people who've already seen them?"
- "Show me weekly approximateMemberReach per creative. Where is reach dropping while impressions stay flat? That's frequency piling onto fewer people."
- "Show costInLocalCurrency, impressions, and CPM by creative and week. Flag creatives where CPM climbed more than 10% week over week for two weeks running."
- "For my video creatives, pull videoViews and the 25, 50, 75, and 100% quartile views by week. Where are viewers dropping off earlier each week? And which videos have a completion rate under 15% after 1,000 impressions?"
- "Find active creatives with zero spend in two or more of the last weeks. LinkedIn has probably stopped serving them, so treat those as urgent."
Want the whole thing scored for you? Ask: "Score every active LinkedIn creative as urgent, warning, or healthy based on CTR drop from peak, frequency, CPM trend, and days running. Then give me a rotation schedule: what to pause this week, what to watch, and which campaigns need fresh ad creatives."
One thing worth saying: if a whole campaign's creatives go tired at the same time, that's usually audience exhaustion, not a creative problem.
So the fix is expanding the audience, not just swapping the ads. And a video with a very low completion rate isn't fatigued, it's a content issue in the first few seconds, which is a different fix entirely.
Budget and pacing
Ask Claude where you are mid-month and whether you're on track, without logging into each platform.
Single-channel LinkedIn Ads prompts:
- "How much have I spent on LinkedIn Ads so far this month, and what's the daily average?"
- "If my monthly LinkedIn Ads budget is €10,000, how much should I have spent by today?"
- "Which LinkedIn campaigns are pacing ahead of budget this month based on current spend?"
Cross-channel prompts:
- "How much have I spent across LinkedIn Ads, Google Ads, and Meta in the last 30 days? Show the split by channel."
- "What percentage of total paid budget went to each channel this month?"
- "Which channel is pacing ahead of budget and which is behind?"
Note: for goal-line tracking against a specific budget target, set up Goals in Whatagraph first. Claude can then read those targets alongside current spend.
Cross-channel reporting
This is the part a governed layer is actually good for. You ask one question and get one blended answer across every paid channel, with the math already sorted out beforehand.
A practical reason this matters for LinkedIn specifically: the channel often influences deals that last-click attribution credits to Google or direct. As Marc Woodland, CEO at Winbox, puts it:
LinkedIn influences buying journeys in ways traditional attribution models can't see, meaning marketers often under-credit the channel, even when it's driving real demand.
When LinkedIn spend sits in the same governed view as everything else, it's easier to see its real contribution instead of under-crediting it.
Try these prompts:
- "Give me a channel comparison: spend, qualifiedLeads, and cost per qualified lead across LinkedIn Ads, Google Ads, and Meta for this month."
- "What's my blended cost per lead across all paid channels in the last 30 days?"
- "Which channels are improving and which are declining compared to last month?"
- "Fetch data from my [Blend Name] blend and show me the combined paid performance."
- "Build me a single view of all paid spend this quarter, split by channel and by client."
Because these numbers come from Whatagraph's governed layer, currencies are already converted and metrics are already defined the same way across channels. Claude isn't stitching APIs together in the chat, so the blended numbers hold up.
Account health and auditing
Check the health of your connected sources and audit reports before they reach a client.
Try these prompts:
- "Are there any broken or disconnected sources right now?"
- "Show me all sources that are failing and which space they belong to."
- "My LinkedIn Ads spend in Whatagraph looks lower than in Campaign Manager. Why might that be?"
- "Are there any filters applied to [Report Name] that might be excluding data?"
- "Show me a day-by-day breakdown of oneClickLeads for the last two weeks so I can spot where it diverges."
- "Do I have any reports that aren't set up with automated delivery?"
Client reporting
Ask Claude for plain-language summaries and executive briefings before client calls, without opening multiple tabs.
Try these prompts:
- "Give me an executive summary of [Client Name]'s LinkedIn Ads performance for the last 14 days."
- "What were the top 5 LinkedIn campaigns by qualifiedLeads for [Client Name] this month, and how do they compare to last month?"
- "Write me a client update in three parts: a Summary, a Wins and Issues section, and Recommendations. Use [Client Name]'s LinkedIn Ads data for this month vs last."
- "Using LinkedIn Ads data for [client name], this month vs last: compare audiencePenetration, frequency, qualifiedLeads, costPerLead, and engagementRate. Lead with the headline result, explain the two biggest drivers, and give one recommendation for next month."
- "Which clients improved most week-over-week on LinkedIn, and which declined?"
Want Claude to structure these the same way every time? Load a skill from the Whatagraph skills library so the output comes back as a consistent executive summary rather than a raw table.
Now, you’re all set! Start a 14-day free trial with Whatagraph, start connecting LinkedIn Ads to Claude, and get back answers you can trust.
Want a more personalized walkthrough? Book a demo with our team.
Published on Jun 18 2026
WRITTEN BY
YamonYamon is a Senior Content Marketing Manager at Whatagraph. With an eye for detail and a knack for always considering context, audience, and business goals to guide the narrative, she's on a mission to create genuinely helpful content for marketers. When she’s not working, she’s hiking, meditating, or practicing yoga.