9 Best Marketing Reporting Software for Agencies in 2025
There are dozens of marketing reporting software in the market. How do you find one that works for you, rather than against you?
In this article, we'll review the creme-of-the-crop marketing reporting tools that agencies are actually using to deliver stunning reports for their clients.

Mar 24 2025●8 min read


In the last 3 months, I've talked to dozens of marketing agency leaders and Performance Marketers (who are now our customers).
During their search for a marketing reporting software, they told me they compared different tools based on these features:
✅ No. of integrations – The reporting tool must connect with all the platforms you’re currently using. No native integrations available? You should be able to upload offline data, or use APIs to build custom connections.
✅ Stable and seamless integrations – It’s not just about how many integrations there are, but also how stable they are. You don’t want to open up a report 30 minutes before a meeting and see all the data is broken.
✅ Comprehensive data blending and custom metrics – You should be able to blend data from different channels (e.g. Google Ads and Facebook Ads) to get a holistic view of marketing performance.
✅ Fully-customizable reports – Customization is key to create reports that are easy for clients to read and understand. You should be able to upload your own images, set color schemes, send reports from a custom domain, and even choose your own icons for metrics.
✅ Ease of use – Anyone on your team, whether that’s the CEO or the Account Manager, should be able to log in and see insights right away.
If you’re looking for the same, you’re in for a treat.
In this article, we’ll be reviewing 9 best marketing reporting tools that check these boxes (some more than others).
9 Best Marketing Reporting Software for Agencies in 2025
Here is our list of the best marketing agency reporting software based on their distinctive features, pros and cons, and pricing:
- Whatagraph
- Looker Studio
- AgencyAnalytics
- Klipfolio
- DashThis
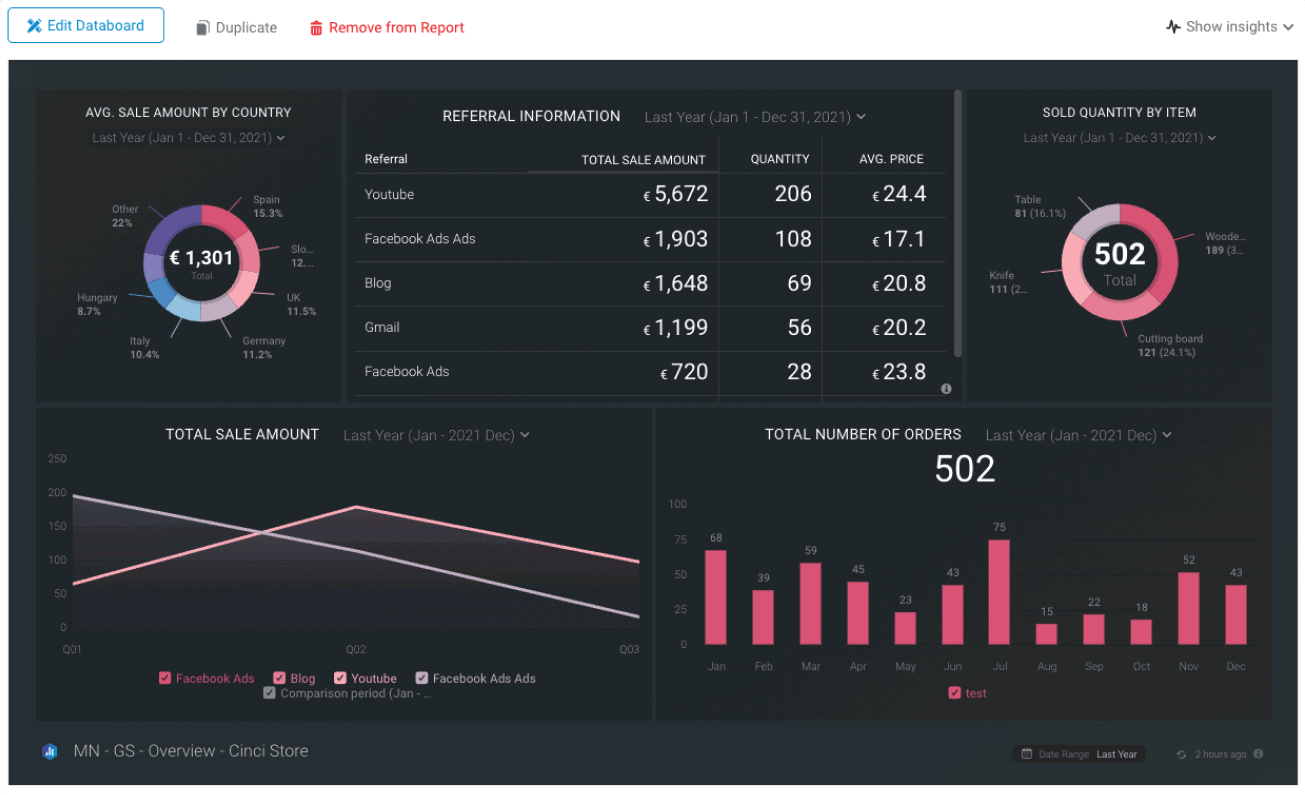
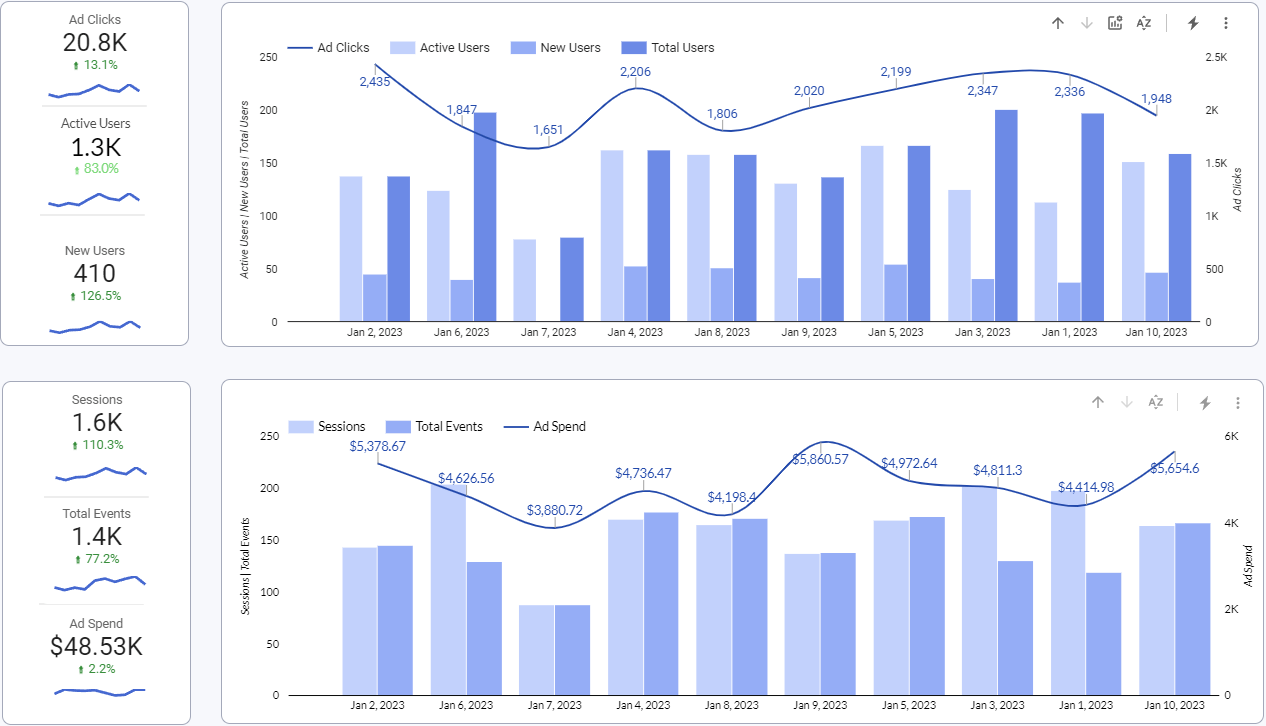
- Databox
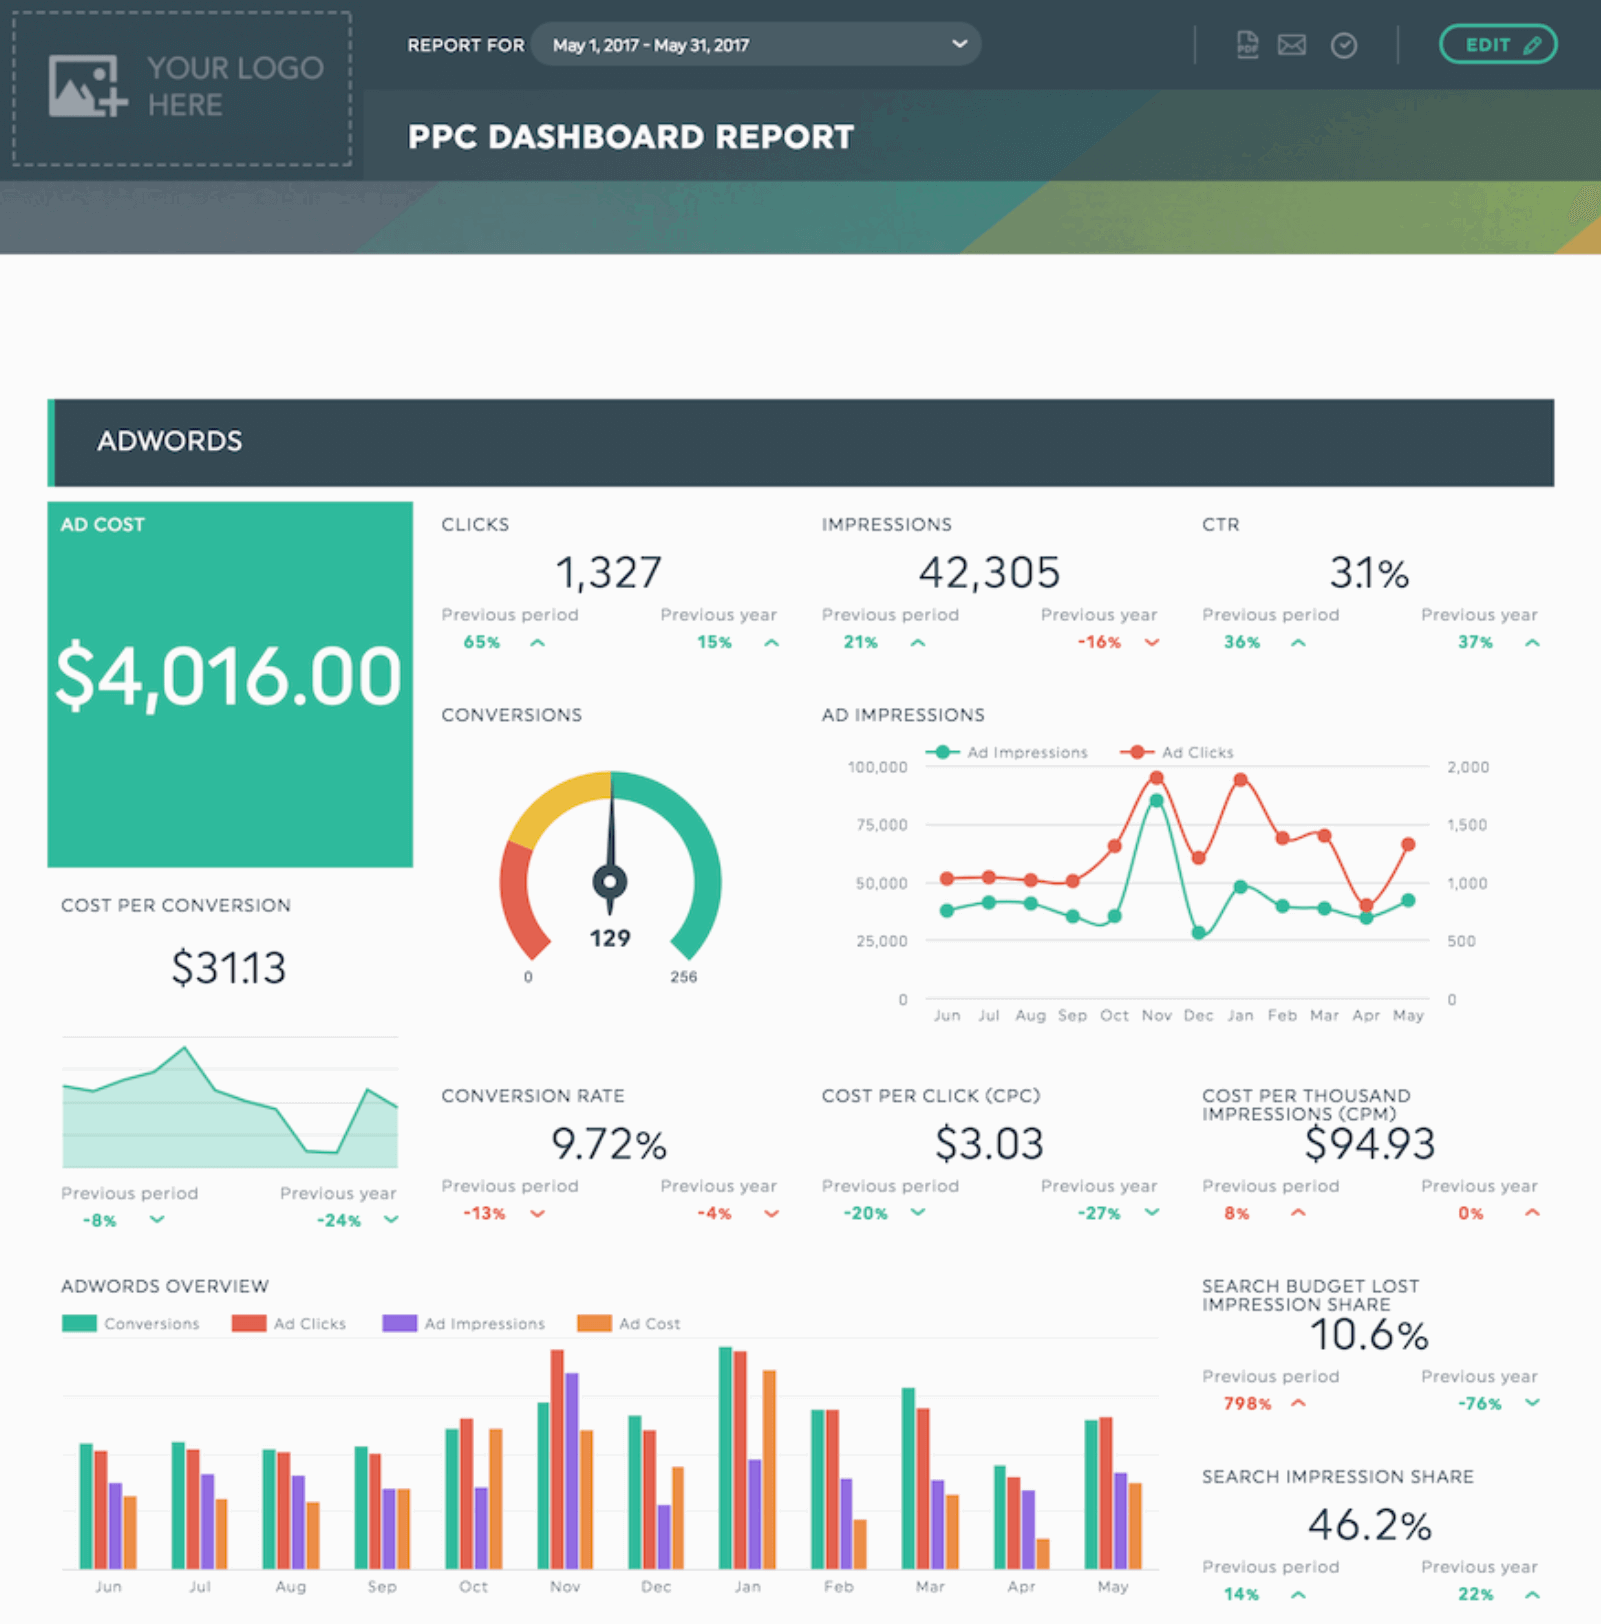
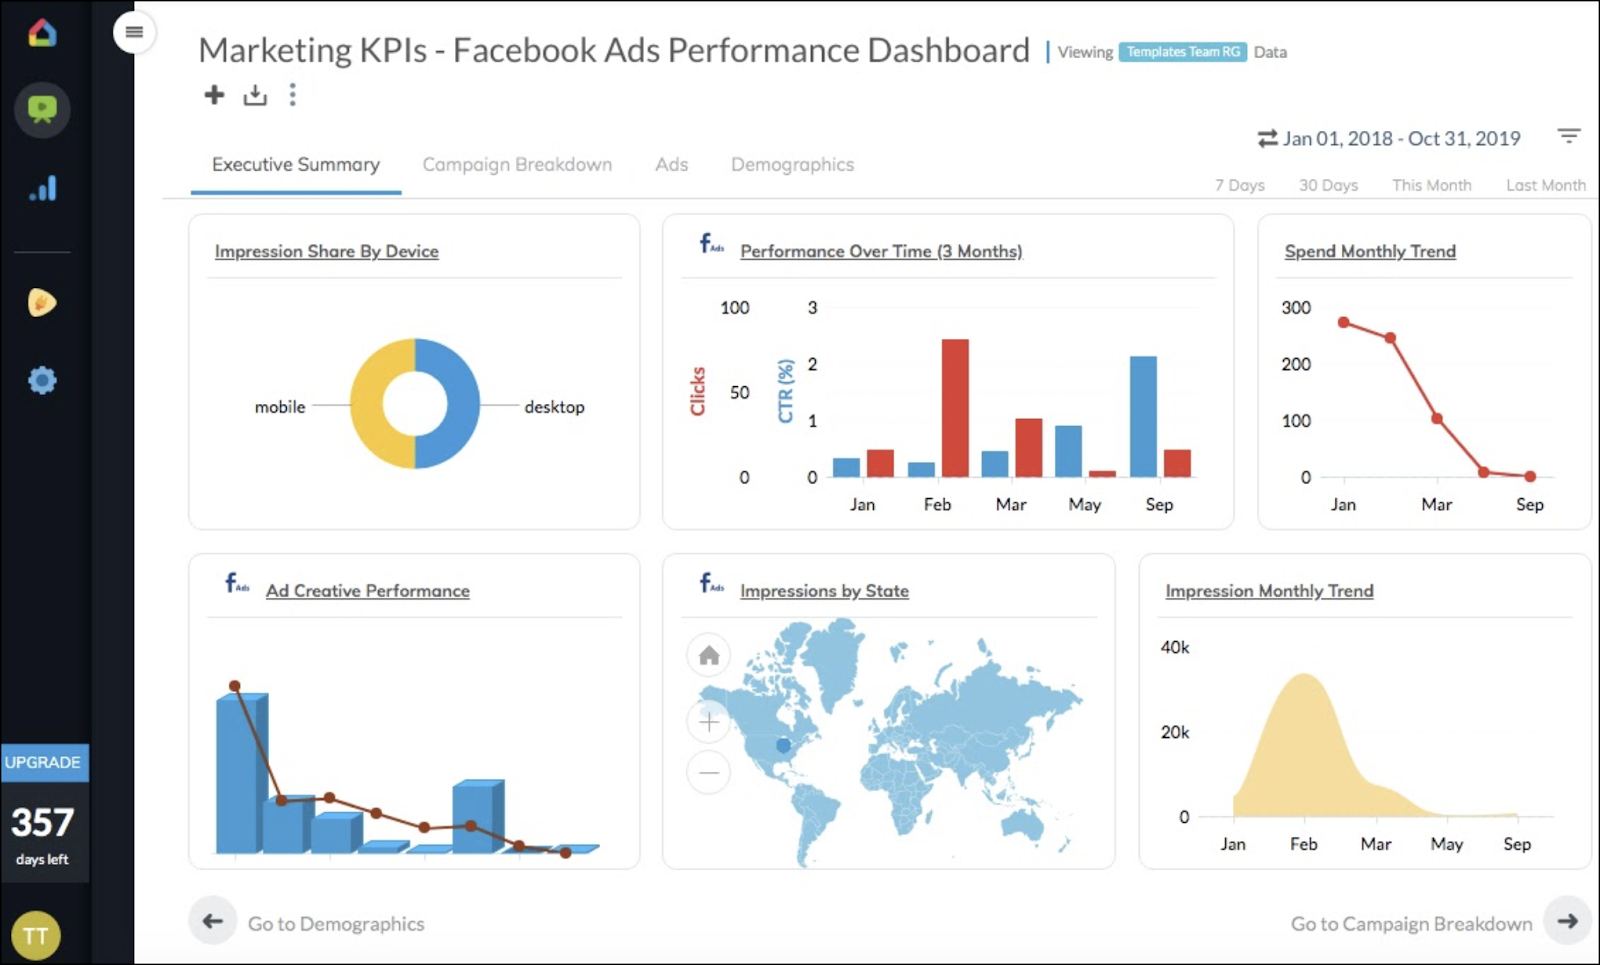
- ReportGarden
- Improvado
- Tableau
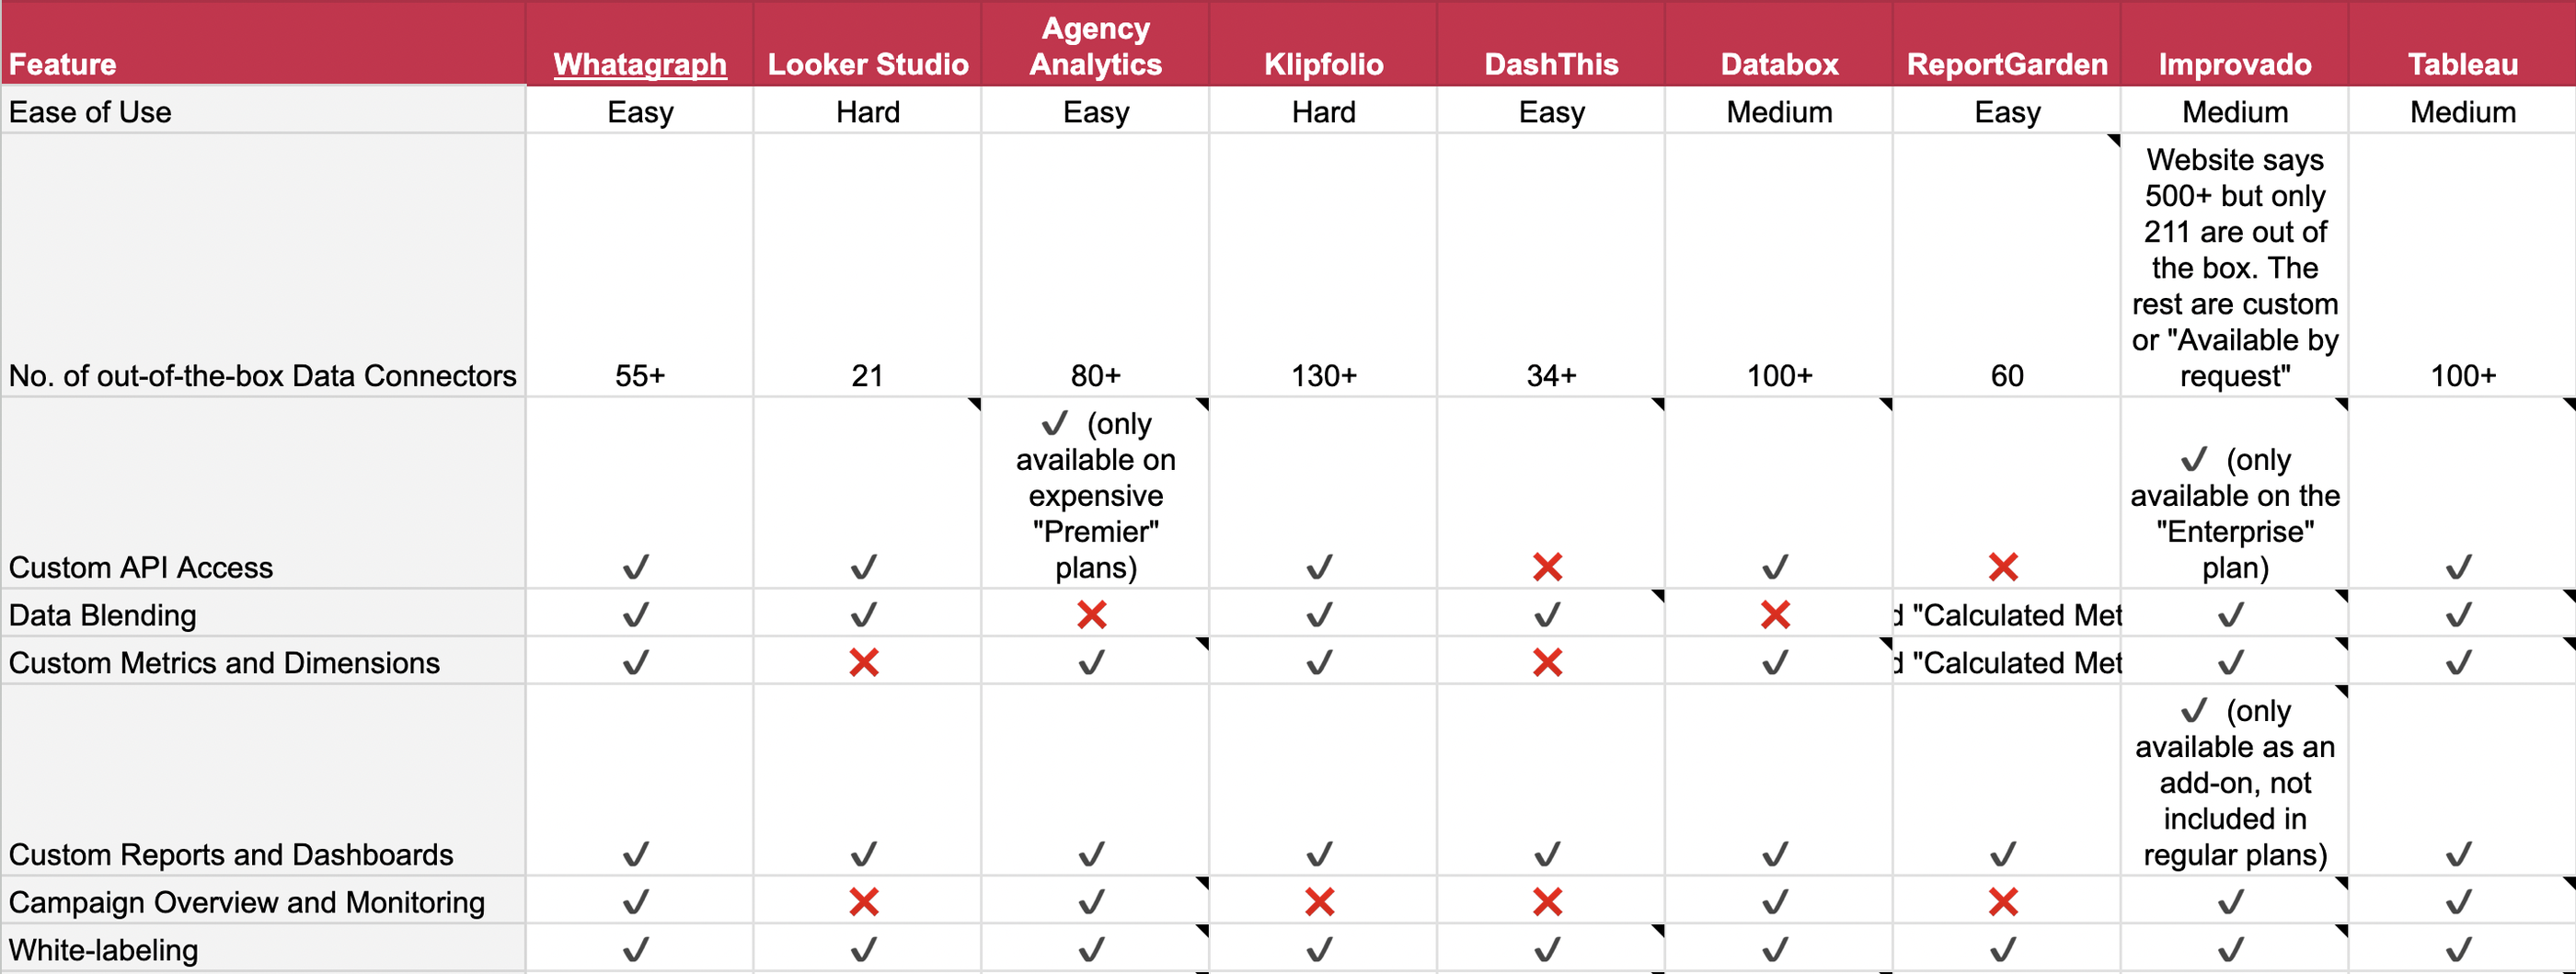
Have a list of features you’re looking for? Compare them in this Excel table (you can copy it for your own use):
→ Marketing Reporting Software for Agencies – Feature Checklist
Here's a sneak peek:
Now let's dive into each of these tools.
1. Whatagraph
Whatagraph is a holistic marketing intelligence platform that makes it ridiculously easy to collect, analyze, and report on your marketing data—whether that’s PPC, social media, SEO, or more.
Unlike other tools like Looker Studio, you can get Whatagraph up and running in a few hours (not days or weeks).
You also don’t need to hire a data scientist or spend thousands of dollars on an implementation partner.
Anyone on your team—whether that’s an Account Manager or a data analyst—can start analyzing data and building reports right away.
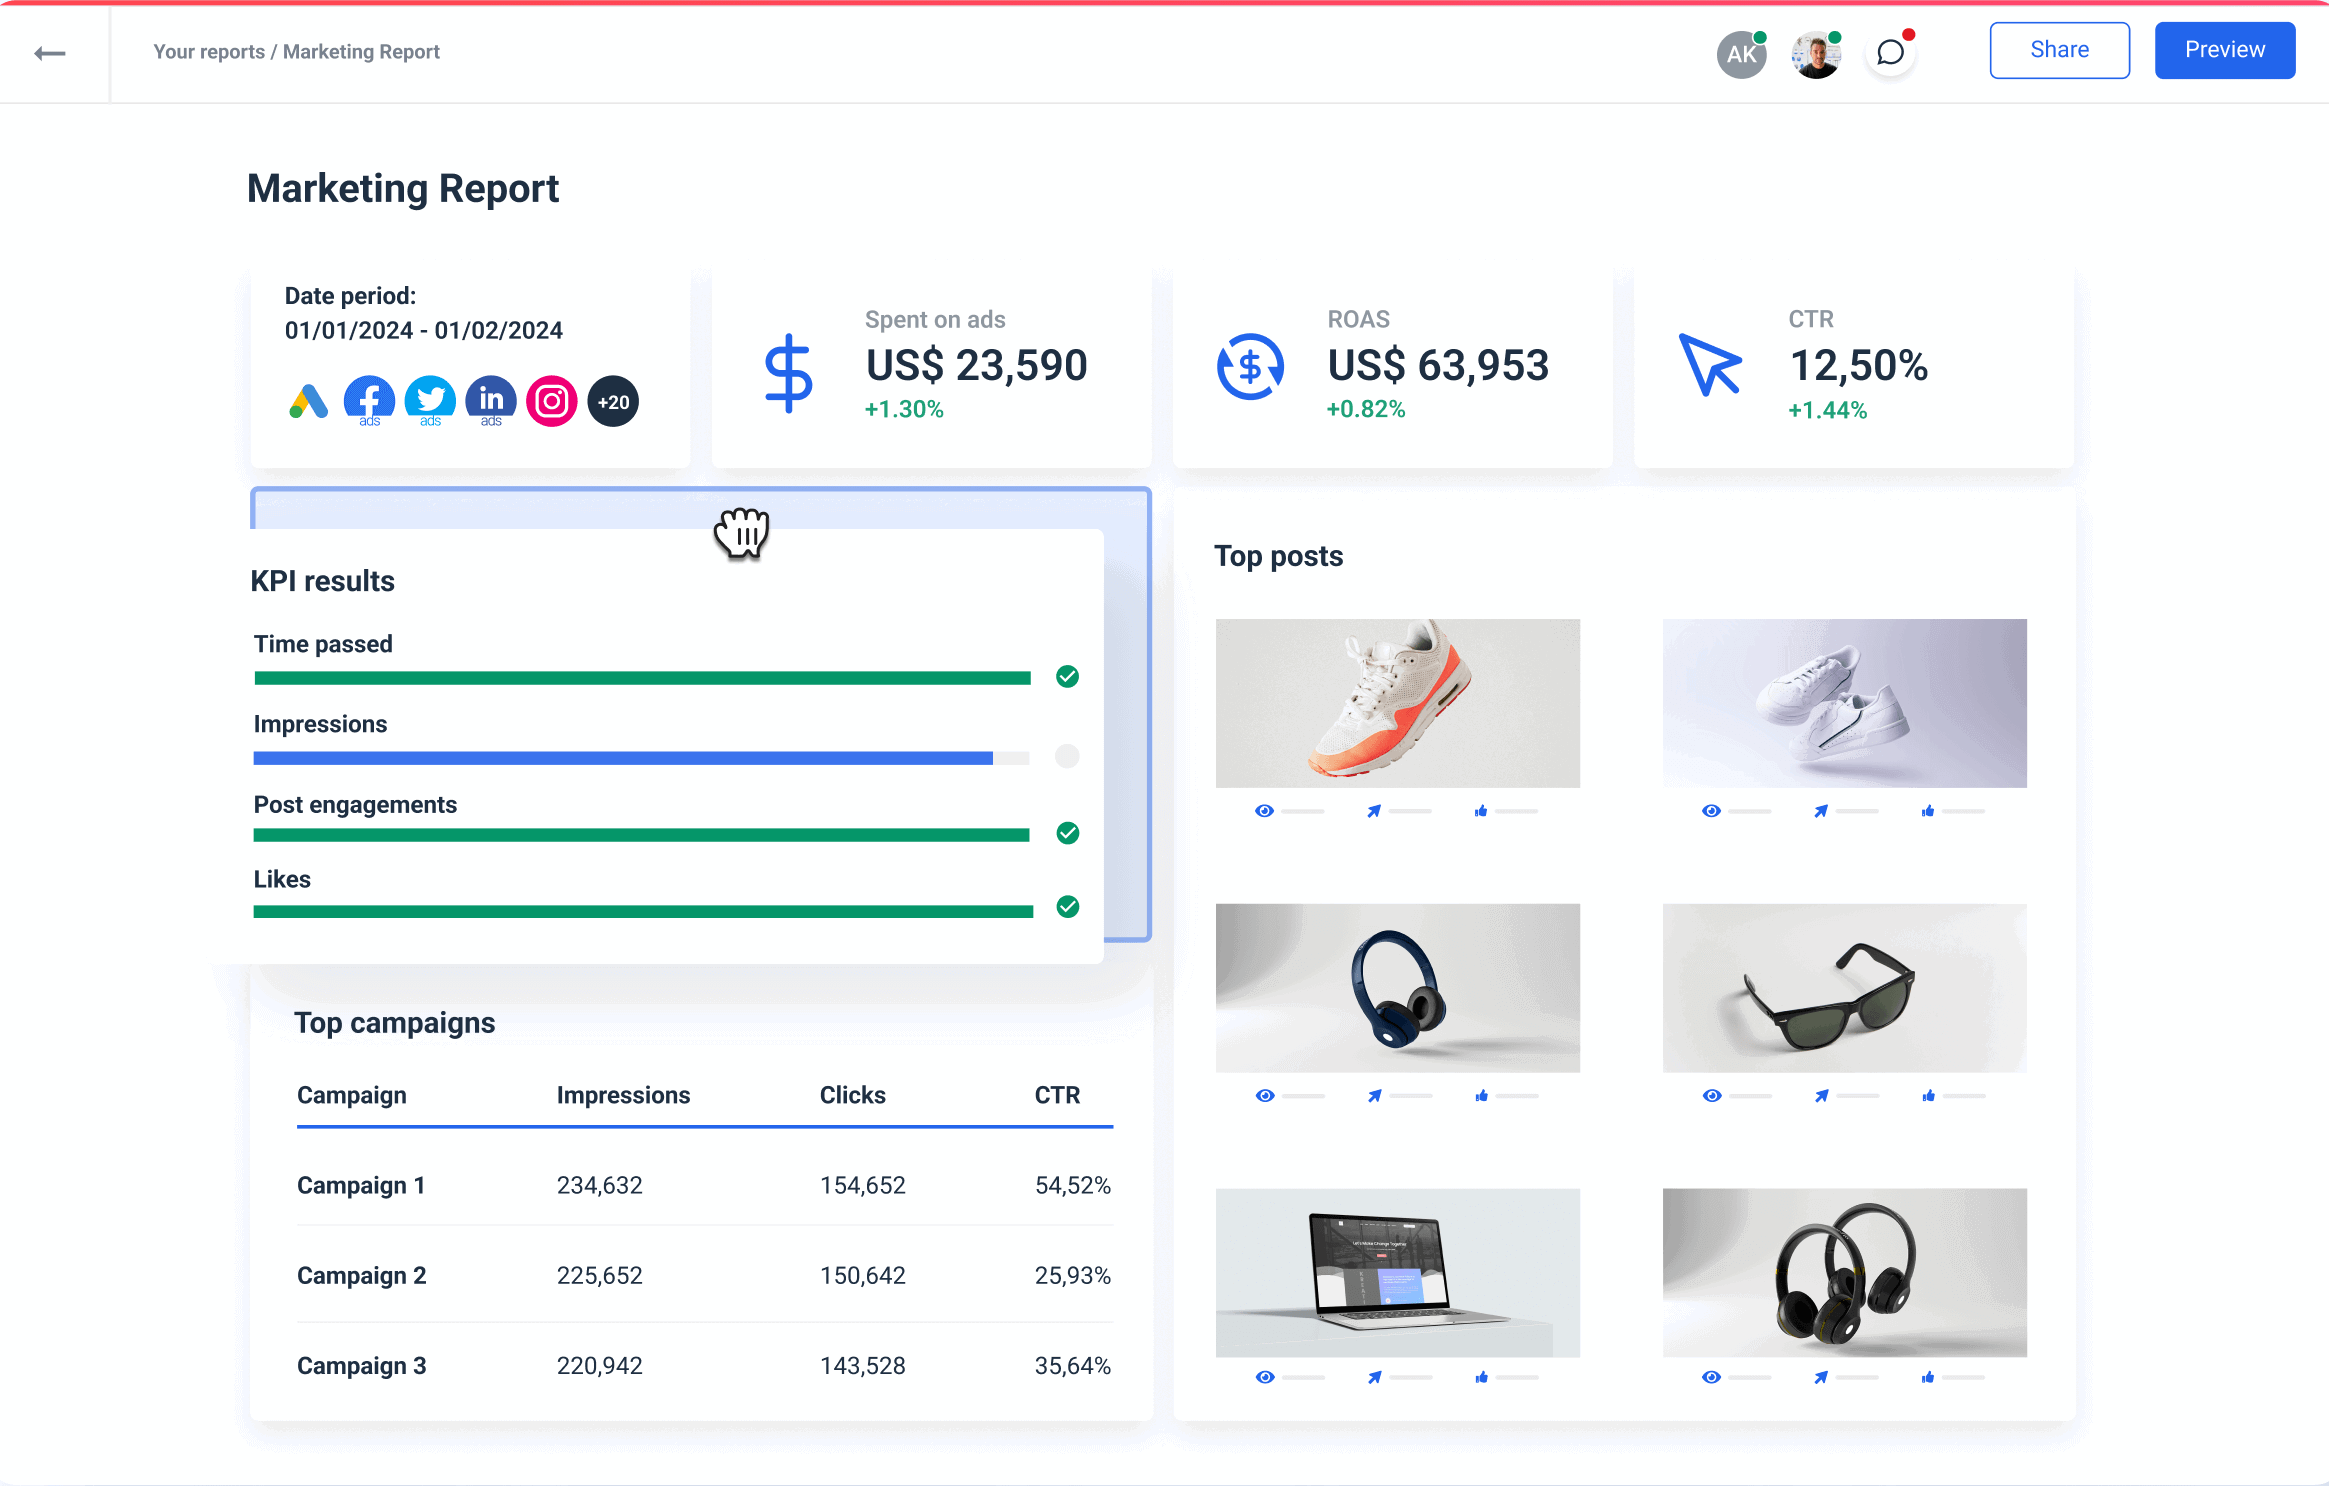
Here’s how Whatagraph works:
- Connect to your data sources and channels in a few clicks. Your data will flow in automatically.
- Organize and unify your data to prepare it for analysis. Create data blends, custom metrics, and dimensions—without writing a single line of code.
- Visualize your data using drag-and-drop widgets or ready-made templates. Create white-labeled reports with custom logos, domains, and color schemes.
- Monitor your campaign performance through an internal monitoring dashboard. Slice and dice data by client, campaign, Account Manager, or more.
- Ask our AI chatbot anything about your marketing performance. Get succinct summaries and add them directly to your reports (or edit them to fit your brand voice).
- Share reports as live links, PDFs, Excel spreadsheets, or automated emails. You can also transfer your data to BigQuery and Looker Studio through Whatagraph.
All of this on a single platform means:
- Your reports are stunning and easy to understand for clients.
- Anyone in the organization can easily see and track performance at all times.
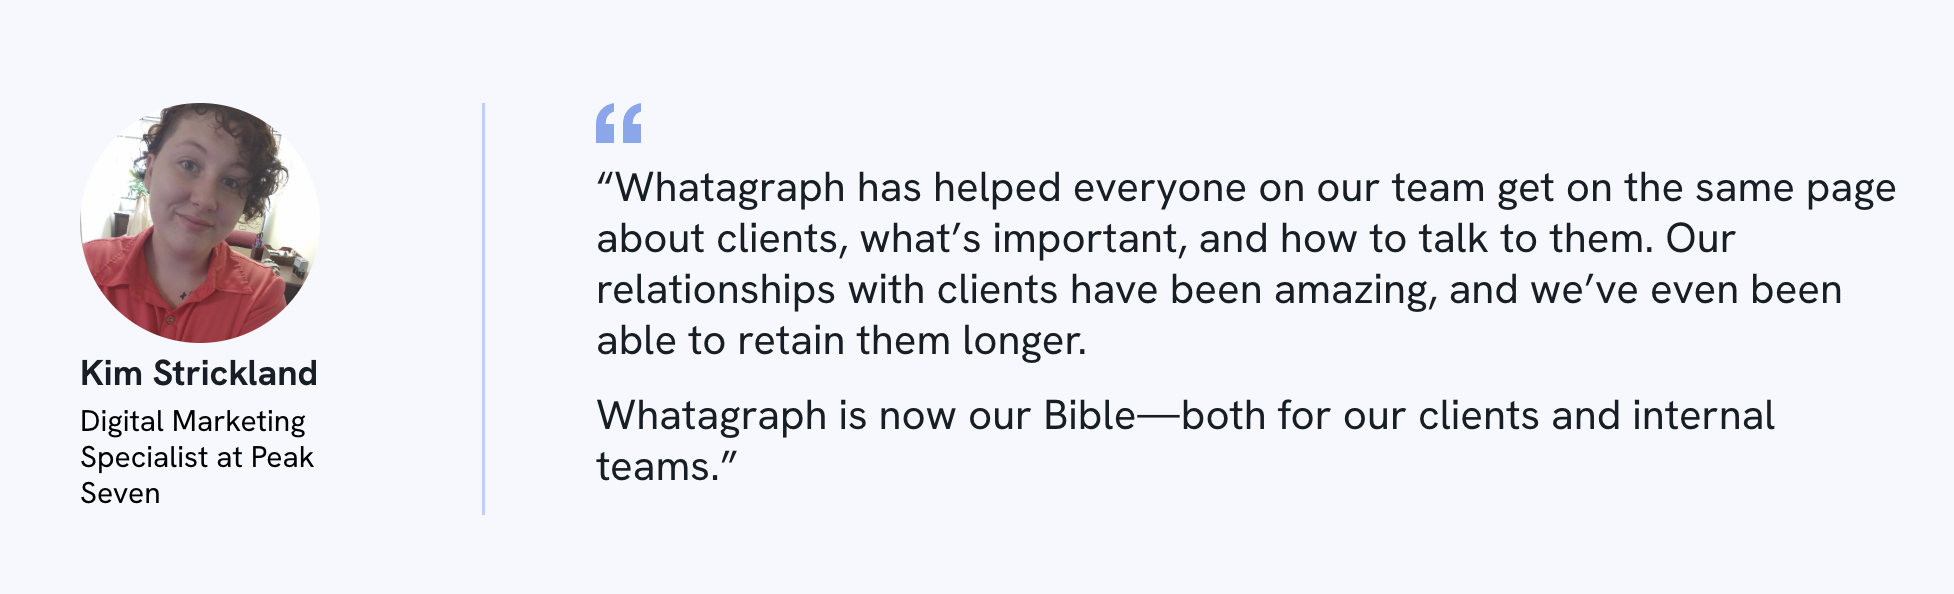
- Reporting is totally automated, saving you 60+ hours a month (just like Peak Seven).
Key features:
- 55+ native integrations to popular marketing sources
- Connect any data source using Custom API, Google Sheets, or BigQuery
- Custom data blends, metrics, and dimensions
- Drag-and-drop visualization builder
- 100+ report templates
- Internal performance monitoring dashboard
- Save reports as templates and edit multiple reports in bulk
- AI chatbot and summaries
- Custom logos, colors, images, icons, and email domains
- Automated report sharing
- No-code data transfers to BigQuery and Looker Studio
Pros:
- All-in-one marketing analytics solution
- Easy to use by anyone on your team
- Engaging visual reports
- Fast campaign performance and insights
- Results easy to interpret
- Excellent live chat customer support that responds within 1 minute
Cons:
- No freemium plan
- No alerts and notifications (yet)
Pricing:
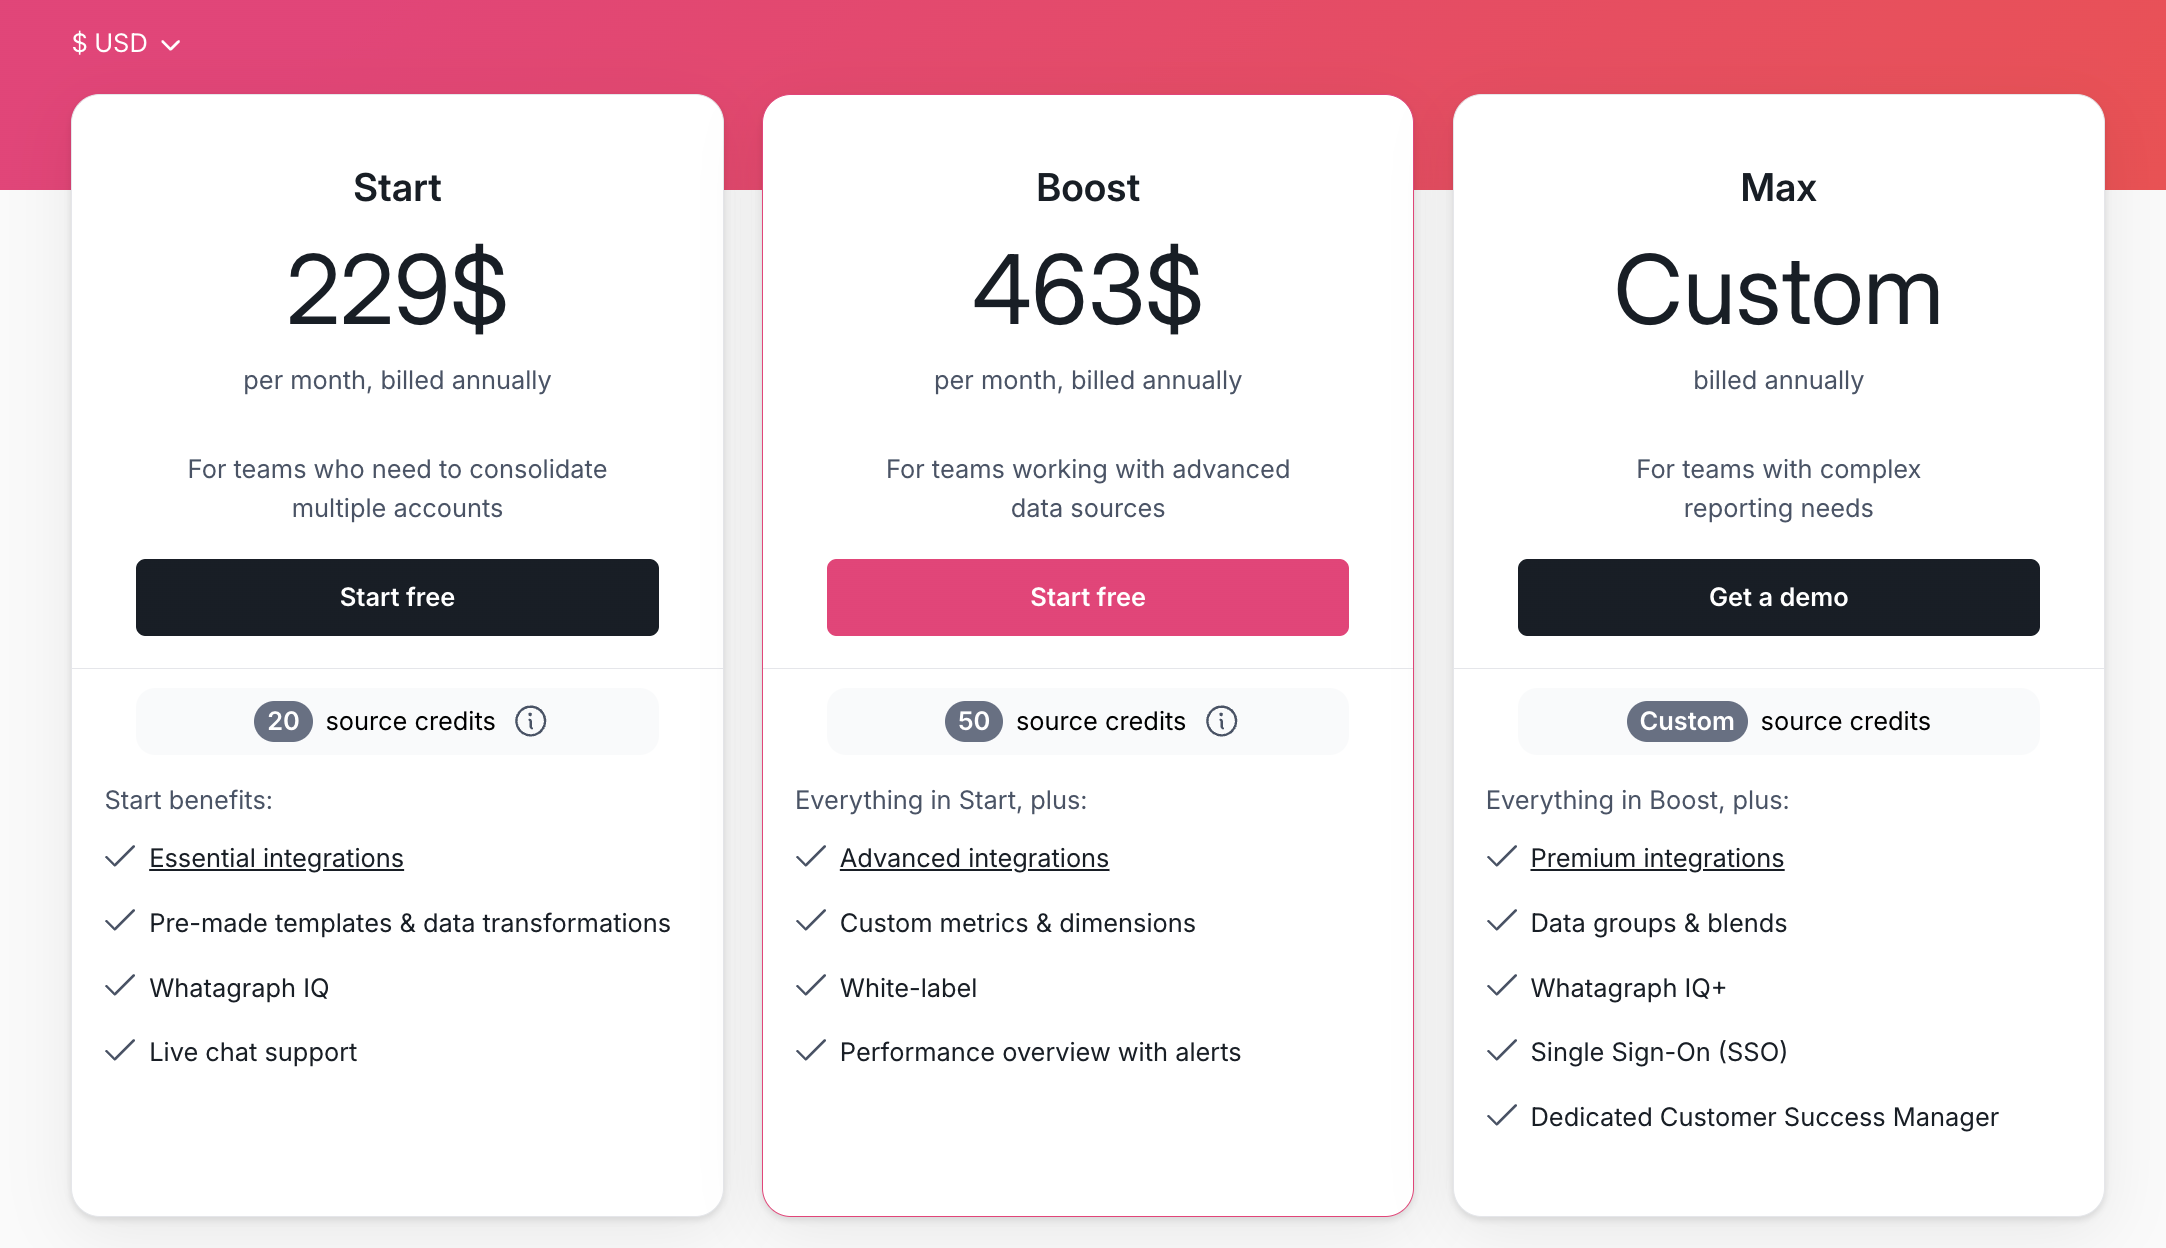
Whatagraph offers four pricing plans:
- Forever-free – lets you get started at no cost, with 5 source credits, Whatagraph IQ basics, templates, and live chat support.
- Start ($229/mo billed annually) – includes 20 source credits and essential integrations
- Boost ($463/mo billed annually) – jumps up to 50 source credits, adds advanced integrations, custom metrics & dimensions, white-labeling, and performance overview with alerts
- Max (custom pricing) – for enterprise/complex teams, with custom source credits, premium integrations, data groups and blends, Whatagraph IQ+, SSO, and dedicated Customer Success Manager
Whatagraph reviews from real users
“Amazing reporting tool to showcase channel performance and to create blended performance reports for yourself or for clients.” (Source)
“We used to have to make our reports by either screenshotting lots of different platforms (which looked awful), or by manually taking all the data and then inputting it into our own reports. This was very time consuming and subject to human error.
Whatagraph has removed that problem and by automating our reporting, has saved our team a lot of time. Also their customer support is excellent.” (Source)
“Whatagraph has a simple user interface that is easy to navigate even for those who don't have analytical skills.” (Source)
2. Looker Studio
Most suitable for: Freelancers and boutique agencies
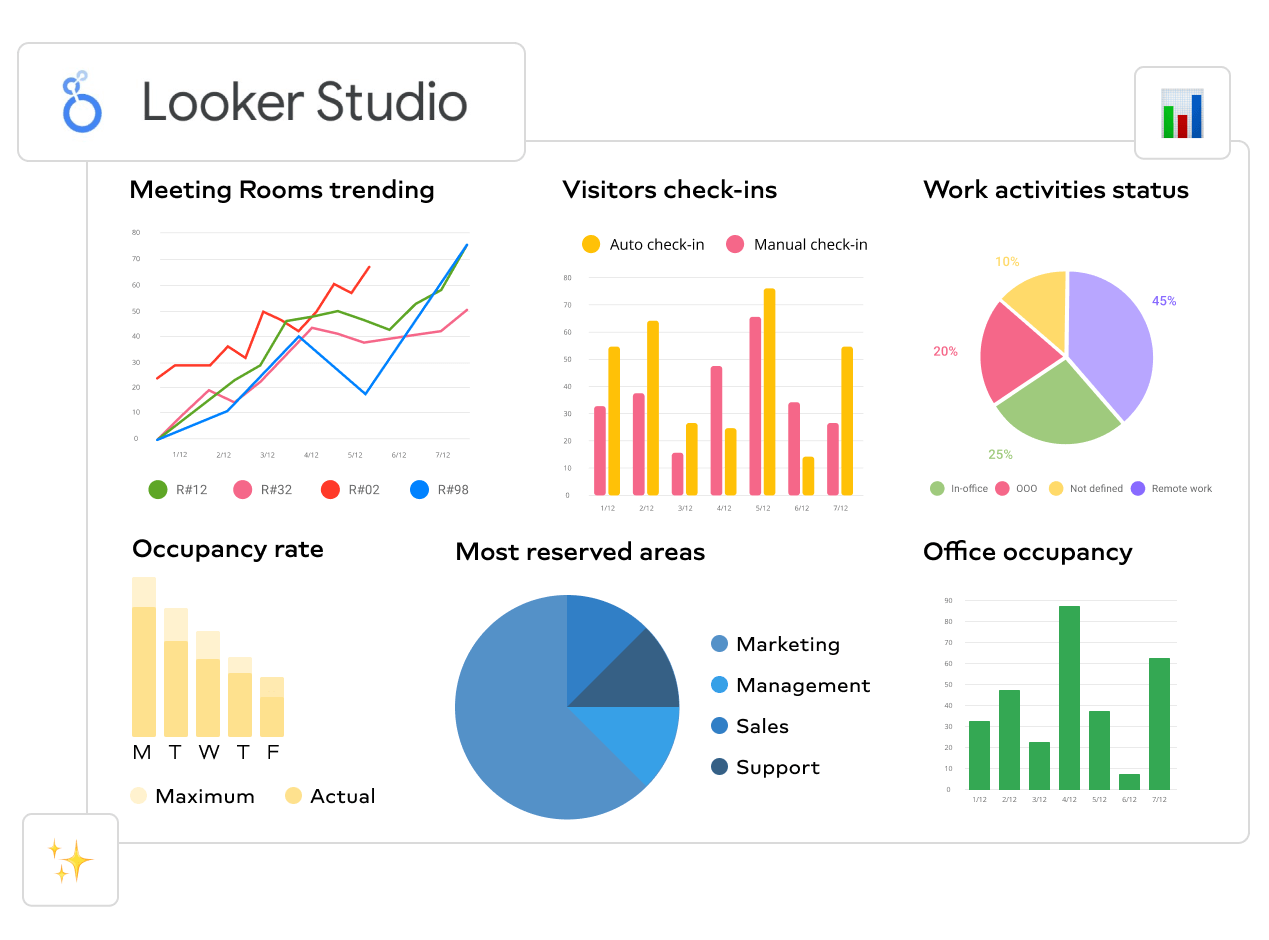
Looker Studio (previously known as Google Data Studio) is one of the most versatile online marketing reporting tools. And on paper, it seems like an ideal choice. It’s free, it has integrations to hundreds of different sources, and it turns them into interactive reports.
Its biggest perk is probably excellent data integration with Google’s marketing platform. If you rely heavily on Google Analytics, Google Search Console, Google Ads, or YouTube, you’ll find connecting data and creating reports super easy. You can then customize those reports and share them with clients.
However, things change a bit when you try to import data sources that are not part of Google’s ecosystem, such as Facebook Ads, Semrush, LinkedIn, or HubSpot. To connect this data, you need to purchase third-party connectors, which have proven multiple times not to be as reliable as Google’s native ones, leading to slow Looker Studio performance and instability.
Another downside is that Looker Studio reports lack real-time updates. Its core sources, which are mostly Google apps, refresh every 15 minutes, which might be an issue for you.
A bigger issue is that although it’s free to use with Google’s sources, Looker Studio can cost you more than you planned when you start connecting outside sources via third-party connectors and paying for each separately.
We’ve heard similar issues from many digital agencies that feel they have outgrown Looker Studio. This became especially evident when they wanted to scale their business by signing on more clients and connecting more marketing channels outside the Google universe.
Key features:
- Big collection of pre-built report templates
- More than 650 connectors built by third-parties
- A large variety of graphs and other visualization types
- Embed dashboards on any site using shortcode
Pros:
- Wide customization options
- Large number of connectors
- Free with most Google sources
- Interactive reports
Cons:
- Can get slow with more data sources
- Limited blending capabilities
- Report performance depends on the performance of individual data connectors
- No way to save custom visualizations
- Steep learning curve
Pricing:
Looker Studio is free if you use data from the supported Google products. If you want to include data sources outside the Google platform, you need to pay a monthly subscription and purchase third-party connectors for those data sources.
There’s also the paid version called Looker Studio Pro. This is a premium version that has additional features like team access, connection to Google Cloud projects, and better support. The price is tailored to every customer based on their specific needs.
Looker Studio reviews from real users
“I love the way you can present data from multiple sources in one report. I also love the ability to blend different tables and show the information in one chart.” (Source)
“Unfortunately, connectors break quite regularly and reports containing a lot of data can take a lengthy time to load.” (Source)
“Looker studio needs more report downloading options such as Word and PDF.” (Source)
3. AgencyAnalytics
Most suitable for: SEO and content marketing agencies
AgencyAnalytics is a marketing reporting tool that caters primarily to marketing agencies looking to automate their reporting process. You can connect your clients’ analytics or marketing platforms and create custom reports that help them make informed decisions.
AgencyAnalytics includes several SEO auditing tools, such as a keyword rank tracker that can scan your client’s sites automatically and raise alerts in case of any issues with search engine optimization.
This marketing agency reporting tool has a user-friendly interface that allows non-technical team members to create custom reports for different scenarios. To an extent, you can also customize overall colors and chart fields for improved branding and communication.
On the downside, if you regularly need to organize data, you may have to look for another tool, as AgencyAnalytics offers very few data transformation functions. Actions like blending, aggregating data from multiple sources, or unifying names of metrics and dimensions to align with the client’s internal communication are not available with AgencyAnalytics.
Key features:
- White-label reporting
- Integrates with 80+ different data sources
- Cross-campaign data
Pros:
- Intuitive user interface
- Automated marketing reporting
- Responsive customer service
- Lightweight and straightforward platform
- Live reports
Cons:
- Limited widget customization
- Basic data transformation functions
- Steep learning curve
- No bulk report edit
- Reports older than 60 days get deleted
- No way to push data to other business intelligence, visualization, or analytics tools
- No support for data warehouses
- Not suitable for mid-market or large agencies and enterprises
Pricing:
As of March 2025, AgencyAnalytics offers three pricing plans (all monthly billing):
- Freelancer: $79/month for 5 clients
- Agency: $239/month for 10 clients
- Agency Pro: $479/month for 15 clients
Optional Add-ons:
- Rank tracker: $50/month per 500 keywords
- Database connectors like MySQL and Google BigQuery: custom quote
- “Concierge Implementation”: custom quote
AgencyAnalytics reviews from real users
“AgencyAnalytics helps me create quick, automated, and clean reports for our clients which saves me a ton of time.” (Source)
“It can sometimes be a little buggy and take time to load. Adding new integrations can sometimes be challenging because of this.” (Source)
“I would like the capability of merging data from different platforms in graphs and metrics (e.g. using data from Google Ads with GA4) in the same section. I also don't like that some platforms aren't yet available (e.g. Reddit).” (Source)
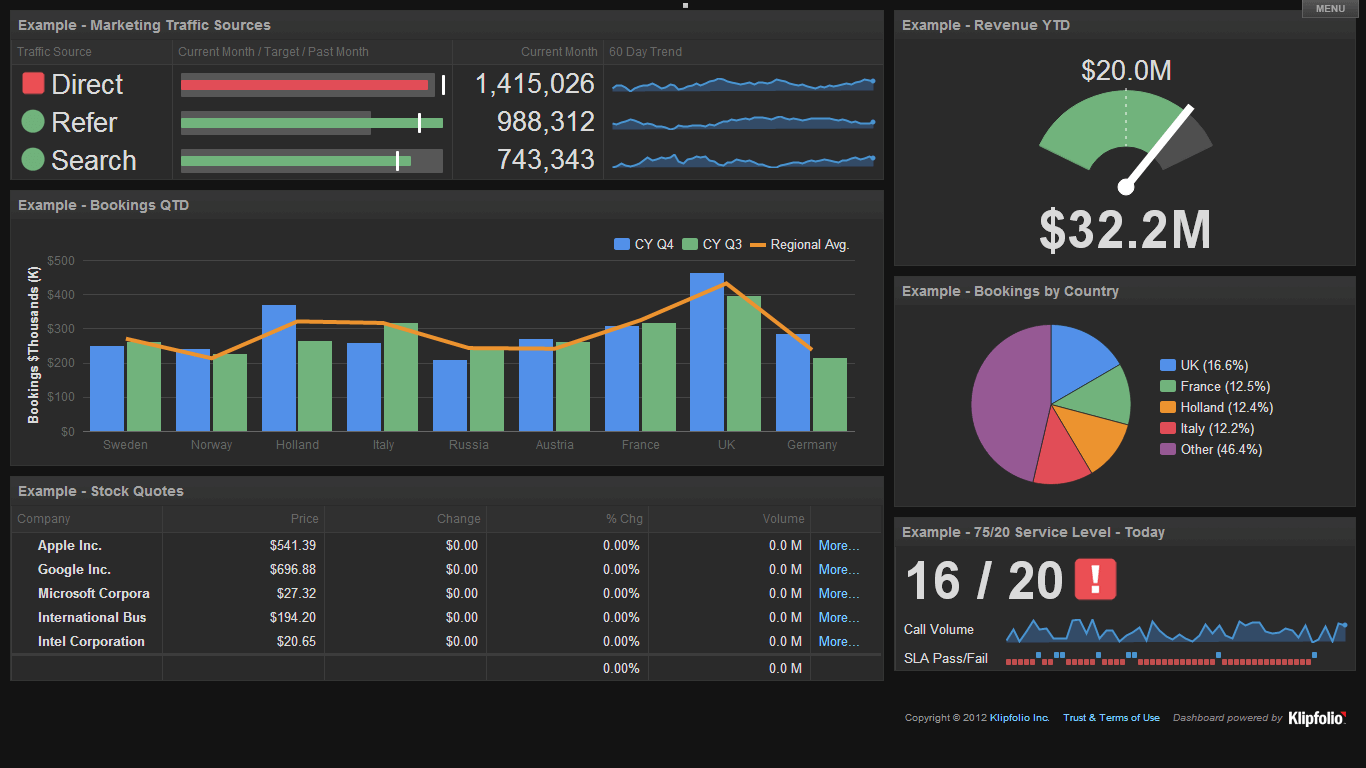
4. Klipfolio
Most suitable for: Large data teams at companies and large agencies
Klipfolio is a marketing data software that comes out of the box with a huge library of report templates that you can connect to multiple data sources. With the ability to track your marketing data history, identify trends, and monitor performance metrics over time, Klipfolio easily found its way to our list.
As a bonus, Klipfolio allows more technically oriented agency users to gain deeper insights through complex formulas, data modeling, and machine learning functionalities.
Klipfolio also allows users to get their hands “dirty” to explore metrics themselves and create reports from scratch. You can connect scattered data sources into a centralized hub, which other team members can use to access shared, updated information necessary for decision-making.
This data sharing among team members is made easier thanks to multiple-user accounts in which you can organize users into groups and assign them specific permissions.
Klipfolio also offers a complementary analytics tool called Powermetrics, which is designed for large agencies. This tool can help you segment and visualize client data effortlessly using different filters and visualization types.
However, before you consider Klipfolio as your solution to digital client reporting, remember that the pricing plan you choose affects both the data refresh rate and historical data limits.
The same applies to the number of reports you can have at any given time — it is tied to your package. While simpler Klips are easy to create, building anything more customized might take you a lot of time, especially since only a handful of pre-made templates are available.
Klipfolio is made with wide application in mind, sometimes resulting in a lack of data granularity and the inability to perform in-depth analysis. Another common customer complaint is that Klipfolio does not provide real-time data in reports, as it claims to do. Also, the platform tends to slow down, even if processing small datasets.
Key features:
- Customized report builder
- Report sharing and collaboration
- Predictive modeling
- Live connection to external data
- Data presentation and storage
- Interactive visualizations on mobile
- My SQL server
Pros:
- Easy to create complex reports using drag-and-drop
- No-code integrations
- Good user support and documentation
- Large choice of templates
- Custom metrics and calculated fields
- Pixel-level control of visualizations made thanks to CSS, HTML, and JavaScript support
Cons:
- Steep learning curve
- Limitations in uploaded file size
- Klips can be confusing for people with no coding skills
- Every Klip is configured in a separate environment
- The number of reports depends on the pricing plan
Pricing:
As of March 2025, Klipfolio offers four pricing plans for agencies:
- Starter: $110/month for 5 dashboards and clients, and 4 hr data refresh rate. Essential features like “scheduled reports”, “custom domain”, and “custom theme” are not included.
- Lite: $210/month for 15 dashboards and clients, and 1 hr data refresh rate. Features like “priority support”, “custom domain”, and “custom theme” are not included.
- Pro: $420/month for 30 dashboards and clients, and 30 min data refresh rate. Features like “custom onboarding” and “custom theme” are not included.
- Premier: $1,025/month for 80 dashboards and clients, and 30 min data refresh rate.
Klipfolio reviews from real users
“Klipfolio has a user-friendly interface. It can be easily connected with databases, Excel sheets, and Google sheets which makes data integration very smooth and easy.” (Source)
“I love the full range of capabilities that are possible when building a Klipfolio dashboard (specifically with their Klips product).” (Source)
“Every time I contact support I get the impression that I am bothering them. I will not be renewing this platform because I do not feel valued as a customer.” (Source)
5. DashThis
Most suitable for: Small businesses and freelancers
DashThis is an online marketing reporting software that allows agencies to create functional, flexible, and effective reports for their clients. The software integrates with over 35 marketing channels, including the most popular ones like Google Analytics, Semrush, Google Ads, Facebook Ads, and more.
Apart from these integrations, you can connect any custom data via Google Sheets or import data using the platform’s CSV tool. Still, some customers report inconsistent data quality while pushing data through flat-file integration. A Custom API would be a much better solution, but DashThis hasn’t developed that feature yet.
The pre-made DashThis reports are flexible and support cross-channel analytics with metrics from multiple platforms. Users can also clone widgets or report templates and easily replicate a report for another client.
With severely limited data transformation features, DashThis is more oriented to smaller marketing agencies that don’t serve clients with complex data needs. The lack of cross-channel overview and bulk report editing only confirms its position as a reporting tool for smaller agencies. Scaling your agency with DashThis would be difficult as it has few time-saving features that would help you allocate time to onboarding new clients.
Key features:
- 35+ digital marketing tool integrations
- Unlimited users in a single account
- Pre-made report templates and widgets
- Simple report sharing
Pros:
- White-label reports
- Wide choice of data visualizations
Cons:
- Limited data granularity
- Lacks enterprise-level or large agency functionalities
- No data transformation
- You may run into API call limits when working with large volumes of data
- No live chat
Pricing:
As of March 2025, DashThis offers four pricing plans:
- Individual: $49 / month. Includes 3 dashboards. No white-labeling features, personalized onboarding, or priority support.
- Professional: $159 / month. Includes 10 dashboards. No personalized onboarding or priority support.
- Business: $309 / month. Includes 25 dashboards, white-labeling, personalized onboarding, and priority support.
- Standard: $479 / month. Includes 50 dashboards, white-labeling, personalized onboarding, and priority support.
DashThis reviews from real users
“DashThis is super user friendly. I am someone who doesn't know too much about Data Dashboards, but this platform was super easy to use.” (Source)
“There are some limitations to what you can bring in and they don't yet offer custom calculations.” (Source)
“It is a little annoying to move things around in a dashboard. You have to move each individual widget to a new section rather than moving an entire section in a dashboard.” (Source)
6. Databox
Most suitable for: Boutique agencies and small businesses
Databox is a marketing reporting software solution that helps marketing teams track business performance across multiple channels and marketing campaigns. Its biggest advantage over competitors is integrations with a large number of marketing data sources including SQL databases.
You can modify the data using a simple drag-and-drop feature, which makes it popular among non-experts. Databox lets you easily visualize weekly and monthly KPIs for decision-makers across departments: sales, marketing, e-commerce, customer service, etc.
The Databox interface is highly intuitive, which makes it easy for everyone to create custom reports with data from over 100 integrations. There's also a unique feature called “Looped Dashboards,” which allows you to connect dashboards and create a master report.
But before you grab a phone and schedule a meeting with the Databox sales team, you should also know the downsides.
The refresh time depends on your pricing plan, which can range between once a day and 1 hour. Some customers have also complained about the quality of data source connectors. In some cases, when the connector breaks off, the historical data from the source is also lost.
While it allows you to unify metrics and dimensions names, Databox doesn’t support data blending and aggregation. Both of these features are often requested by large agencies and enterprise marketing teams.
The lack of data warehouse support and the ability to export data in spreadsheets for further analysis clearly position Databox as a marketing reporting software for small businesses and marketing agencies serving small businesses.
Key features:
- Intuitive workflow and visual reporting
- Unified view across devices
- Goal setting and performance tracking
Pros:
- User-friendly drag-and-drop builder interface
- 70+ direct and 2000+ third-party integrations
- No coding required
- Multiple display options, including desktop, mobile TV, and Apple Watch
- Automated notifications
Cons:
- Some integrations are difficult to optimize
- Limited report customization and control over data
- Some types of data can be tracked only 2 months back
- No data blending & aggregation
- Live chat support works well only on the highest plan
- Data refresh rate depends on the plan
Pricing:
As of March 2025, Databox offers four pricing plans:
- Free: Limited to 3 users, data sources, and dashboards. No custom metrics, data calculations, or report automation available.
- Starter: $388/month for 50 data sources, 5 users, and unlimited dashboards.
- Professional: $528/month for 50 data sources, 15 users, and unlimited dashboards. Includes custom metrics and data calculations.
- Growth: $728/month for 50 data sources, and unlimited users and dashboards.
- Premium: $999/month for 100 data sources, and unlimited users and dashboards.
Databox reviews from real users
“Databox makes it simple to interact with data in ways you never thought possible.” (Source)
“I'm not sure what has happened with the customer support team at Databox but they are fairly unresponsive these days.” (Source)
"After 2 years I left. Templates always break, individual metrics always break, lack of good support." (Source)
7. ReportGarden
Most suitable for: Small businesses and boutique agencies
ReportGarden is a marketing reporting tool that helps marketing agencies and their clients monitor online marketing campaigns. The software is positioned as an all-in-one solution for building reports that consolidate KPIs across different channels, including PPC, social media, SEO, email marketing, and others.
Marketers can easily create tailored reports with real-time data on traffic sources, conversion rates, and other metrics essential to the campaign's performance. Using automated report scheduling, you can save time on reporting and ensure every client and stakeholder receives their report on time.
However, the tool has a couple of significant downsides that keep it from joining the big players.
The first drawback is the lack of a custom API for connecting data. That wouldn’t be such an issue if ReportGarden could add a data warehouse as a source — but it can’t.
This limits the software’s ability to connect custom data sources at scale.
Another area where ReportGarden still needs work is data transformation. Apart from calculated metrics, there are no other ways to organize data before visualizing it.
This might not be an issue for less demanding users. However, for large organizations and agencies, the ability to unify, rename, and translate data outputs at scale, aggregate data to create tiers or totals, and blend cross-channel data into one source is a regular requirement.
Key features:
- 50+ integrations for data sources
- Report builder and automation
- Custom branding
- Client Portal
- Budget tracking
Pros:
- Clients can check their reports 24/7 using the Client Portal
- Report templates
- Cross-platform reporting
- White-label options
Cons:
- Lacks in-depth data analytics
- No data warehouse integration
- Very basic data transformation
- No way to edit reports in bulk
Pricing:
ReportGarden used to offer four pricing plans back in 2024, but since then they’ve switched to displaying only one plan on their website, which starts from $74 per month.
ReportGarden reviews from real users
“Multichannel report in an easy way. Very good user interface.” (Source)
“We are long-time users of ReportGarden. Their product has allowed us to streamline and optimize our agency's operations specifically areas related to our client's advertising budget management.” (Source)
“The design was very simplistic and didn't allow for manual calculations.” (Source)
8. Improvado
Most suitable for: Data teams at large agencies
Improvado is one of the best marketing reporting platform solutions designed for enterprise-size companies and large marketing agencies.
Positioned as an end-to-end solution that combines marketing intelligence and automated reporting, Improvado helps marketers at every stage of the reporting cycle, from collecting data to transformation and insight discovery.
Thanks to more than 500 pre-built data connectors to CRMs, social media platforms, and e-commerce tools, this reporting platform can collect data from a wide range of sources, helping companies get a unified view of their marketing efforts. The next step is intelligent data transformation, where data is cleaned and prepared before being pushed to any destination of choice.
Improvado uses Looker Studio, Tableau, and other BI or visualization tools to create reports
Since Improvado doesn’t have a native visualization layer, it offers integrations with Looker Studio, Power BI, Tableau, Grafana, Domo, and many other data visualization, business intelligence, and analytics platforms.
Another feature that streamlines analytics processes is Improvado’s AI Agent. This search-based analytics tool connects to your database and allows you to ask performance questions via an intuitive UI.
The Agent analyzes your data and notifies you of any anomalies or opportunities. There’s also an option to send out weekly or monthly reports to help you track different aspects of your marketing campaigns.
Key features:
- Collects data from online and offline sources
- Data integration
- Data transformation
- Business data QA
- AI-powered instant intelligence
- Data warehouse support
Pros:
- A large number of integrations
- Multiple customization options
- AI-powered data transformation
- Can process large volumes of data to the size of petabytes
- Flexible pricing
Cons:
- Designed for enterprise users, might be too late for small businesses
- No native visualization and reporting — you need to integrate another tool
- Initial setup takes some time
- Steep learning curve
Pricing:
Improvado has a custom pricing model tailored to the needs of each team or marketing agency. Users pay only for the features they actually use, and the cost of individual features and data limits is discussed on a demo call. Pricing is not publicly available, however.
Improvado reviews from real users
“There are a lot of ETL tools and a growing amount of AI companies, but Improvado's customer relationships and willingness to go above and beyond really sets them apart.” (Source)
“The best aspect of Improvado is their extensive range of integrations across major social, search, and ad-server platforms.” (Source)
“Improvado can be expensive, particularly for smaller businesses or startups with limited budgets.” (Source)
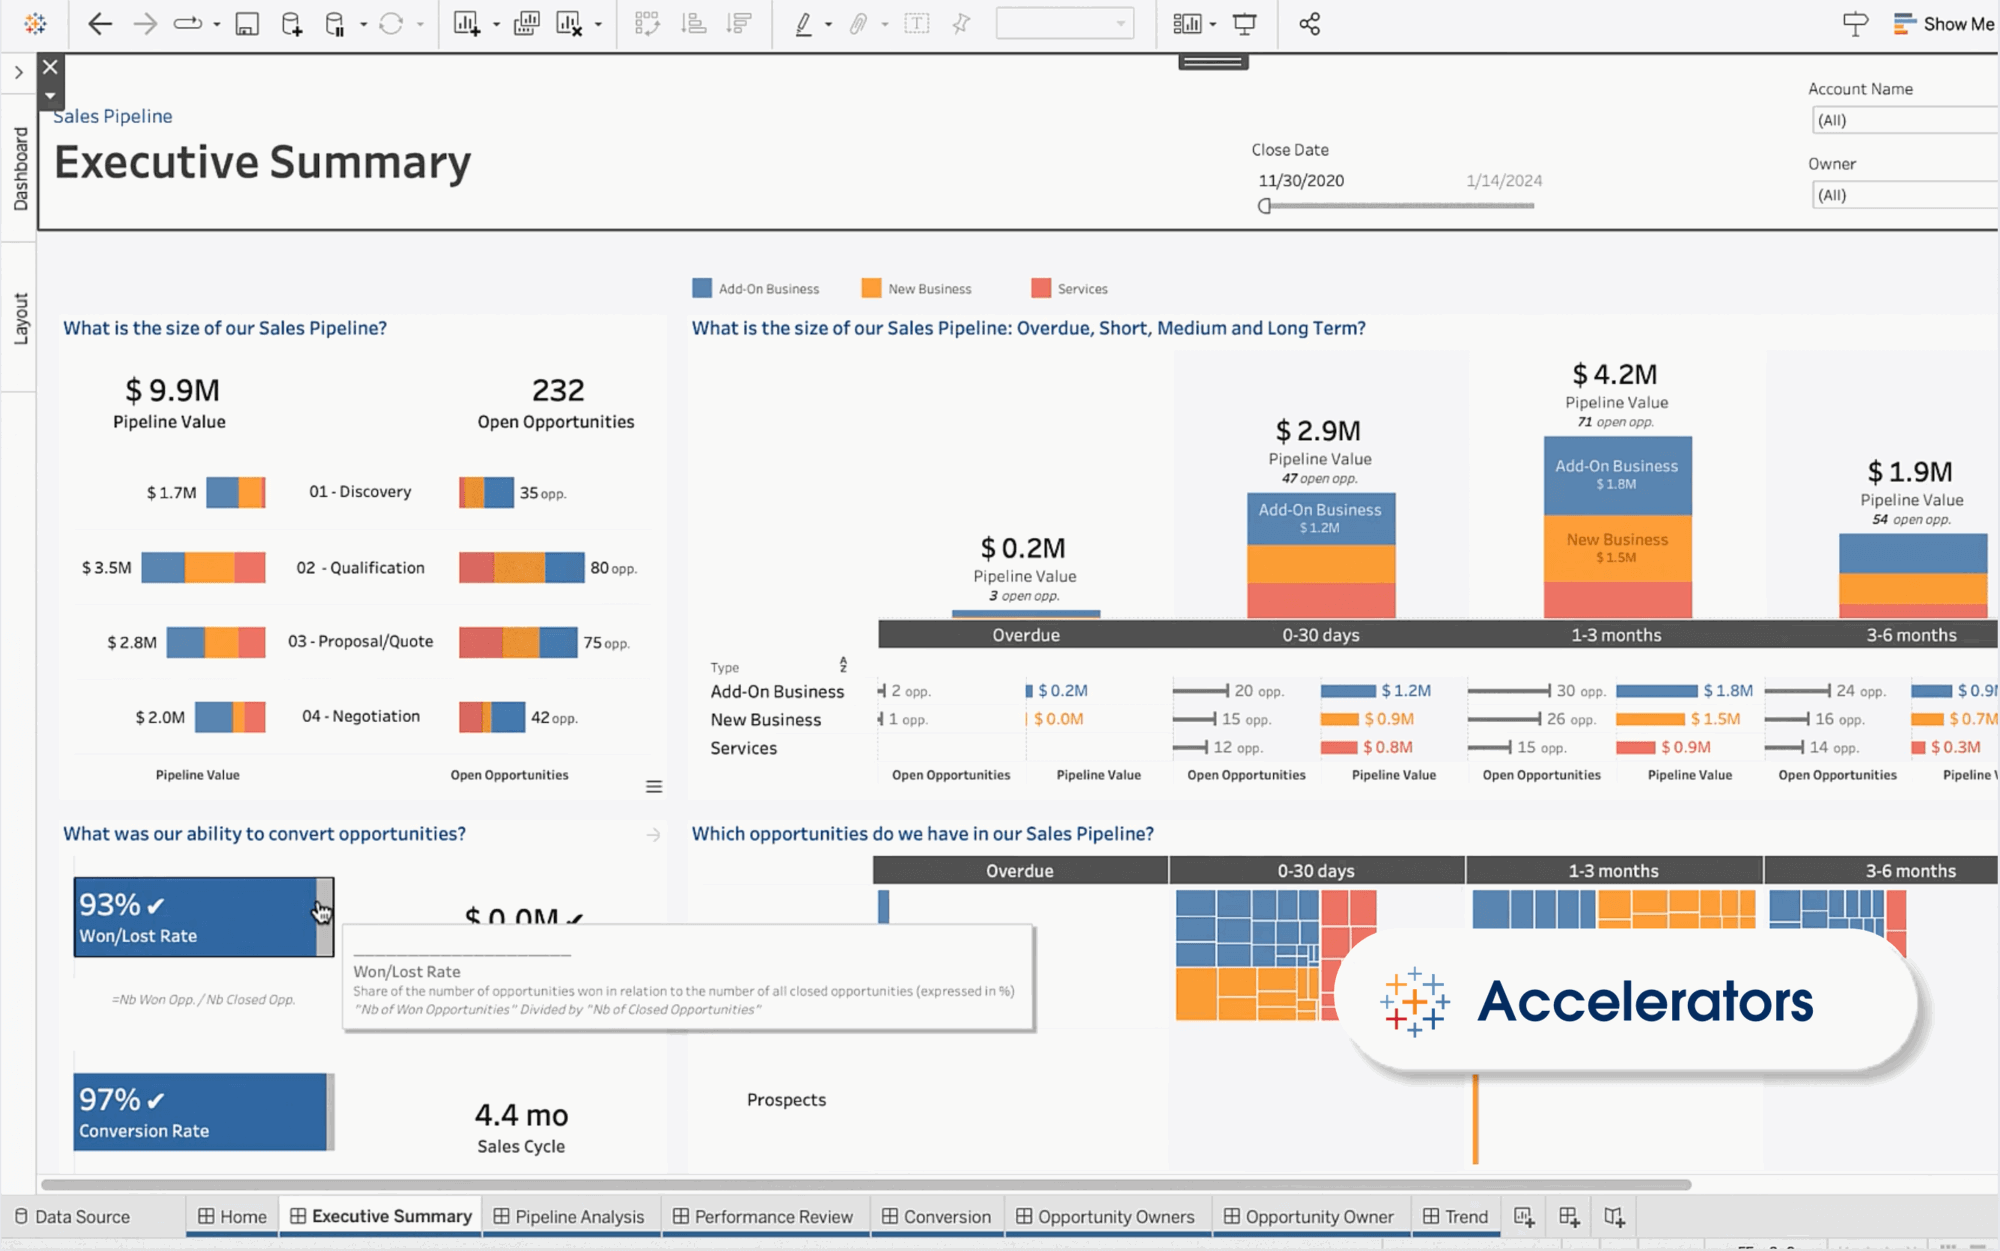
9. Tableau
Tableau is a reporting tool that comes at a fairly reasonable price. Although it has a steep learning curve, once you master it, you can easily create graphs and charts and customize them according to your agency's needs.
For many SaaS businesses, Tableau is a household name for a business report. However, it’s not a rare case that digital agencies also use it due to its versatile analytics features and a large number of integrations from various data sources such as Salesforce and Google Analytics. You can easily import data from all your client’s sources and generate a detailed report of their performance.
Key features:
- Embedded analytics
- Geospatial analysis
- Ready-to-use Accelerator reports
- Data grouping bins
- Predictive modeling
- Tableau Catalog
- Data stories
- Metadata API
Pros:
- Visualization version control
- Huge library of templates
- Interactive fiscal calendar
- Marketing data management
- Custom SQL queries
- AI and machine learning functionalities
Cons:
- Setting up data automation requires some Python programming
- The cloud version lacks some visualization and formatting settings that are available on the desktop version
- Limited programming options for predictive functions
- Steep learning curve
Pricing
As of March 2025, Tableau offers three pricing packages:
Package 1: Tableau
- Tableau Creator: $75 / user / month
- Tableau Explorer: $42 / user / month
- Tableau Viewer: $15 / user /month
Package 2: Enterprise
- Enterprise Creator: $115 / user / month
- Enterprise Explorer: $70 / user / month
- Enterprise Viewer: $35 / user / month
Package 3: Tableau+
- Custom quote only
Tableau reviews from real users
“Tableau allows me to create my own structured data from a lot of unstructured data.” (Source)
Tableau has an uncanny ability to transform complex data into visually stunning and easily understandable representations.” (Source)
“Tableau can be costly, particularly for startups.” (Source)
Your new marketing reporting software is waiting
Choosing the right marketing reporting software can significantly streamline the reporting process in your agency. Each tool on our list has been selected for its unique features and capabilities and proven track record in helping marketers demonstrate value to their clients.
Whatagraph is one of those tools that removes many steps between the client’s data sources and actionable reports.
Apart from multiple time-saving and scalable features built primarily for agencies, Whatagraph is a marketing reporting platform that covers the entire data journey — from connecting scattered sources to creating beautiful reports.
Talk to us to see Whatagraph in action.
Published on Aug 22 2024
WRITTEN BY
YamonYamon is a Senior Content Marketing Manager at Whatagraph. With an eye for detail and a knack for always considering context, audience, and business goals to guide the narrative, she's on a mission to create genuinely helpful content for marketers. When she’s not working, she’s hiking, meditating, or practicing yoga.