5 Key Metrics for Marketing Data Analysis
Many metrics can be extracted from a single marketing campaign. But which ones are the ones the marketing professionals need to keep track of?

Aug 24 2021 ● 4 min read

Marketing data analysis is an integral part of building and executing a marketing strategy. It determines investment avenues, focus points, indicates reachable customers and calls to action.
Using marketing data, agencies and marketing professionals can determine the best course of action for digital marketing campaigns. That is why right now, over 25% of US CMOs list content marketing as the top most important digital marketing strategy in 2021. Organic search is a close second type of marketing investment.
Why do these CMOs choose content marketing as their key strategy? Because this strategy delivers on key metrics that indicate healthy returns on marketing investment and you can learn how to improve content marketing strategy based on data analysis.
How do they know which metrics are the best indicators? Market analysis and experimentation with marketing analytics best practices are the best ways to find out these metrics. Luckily, we have done the crunch for you and present the key metrics for marketing data analysis you should add to your marketing reports. There are data analysis tools that can be used.
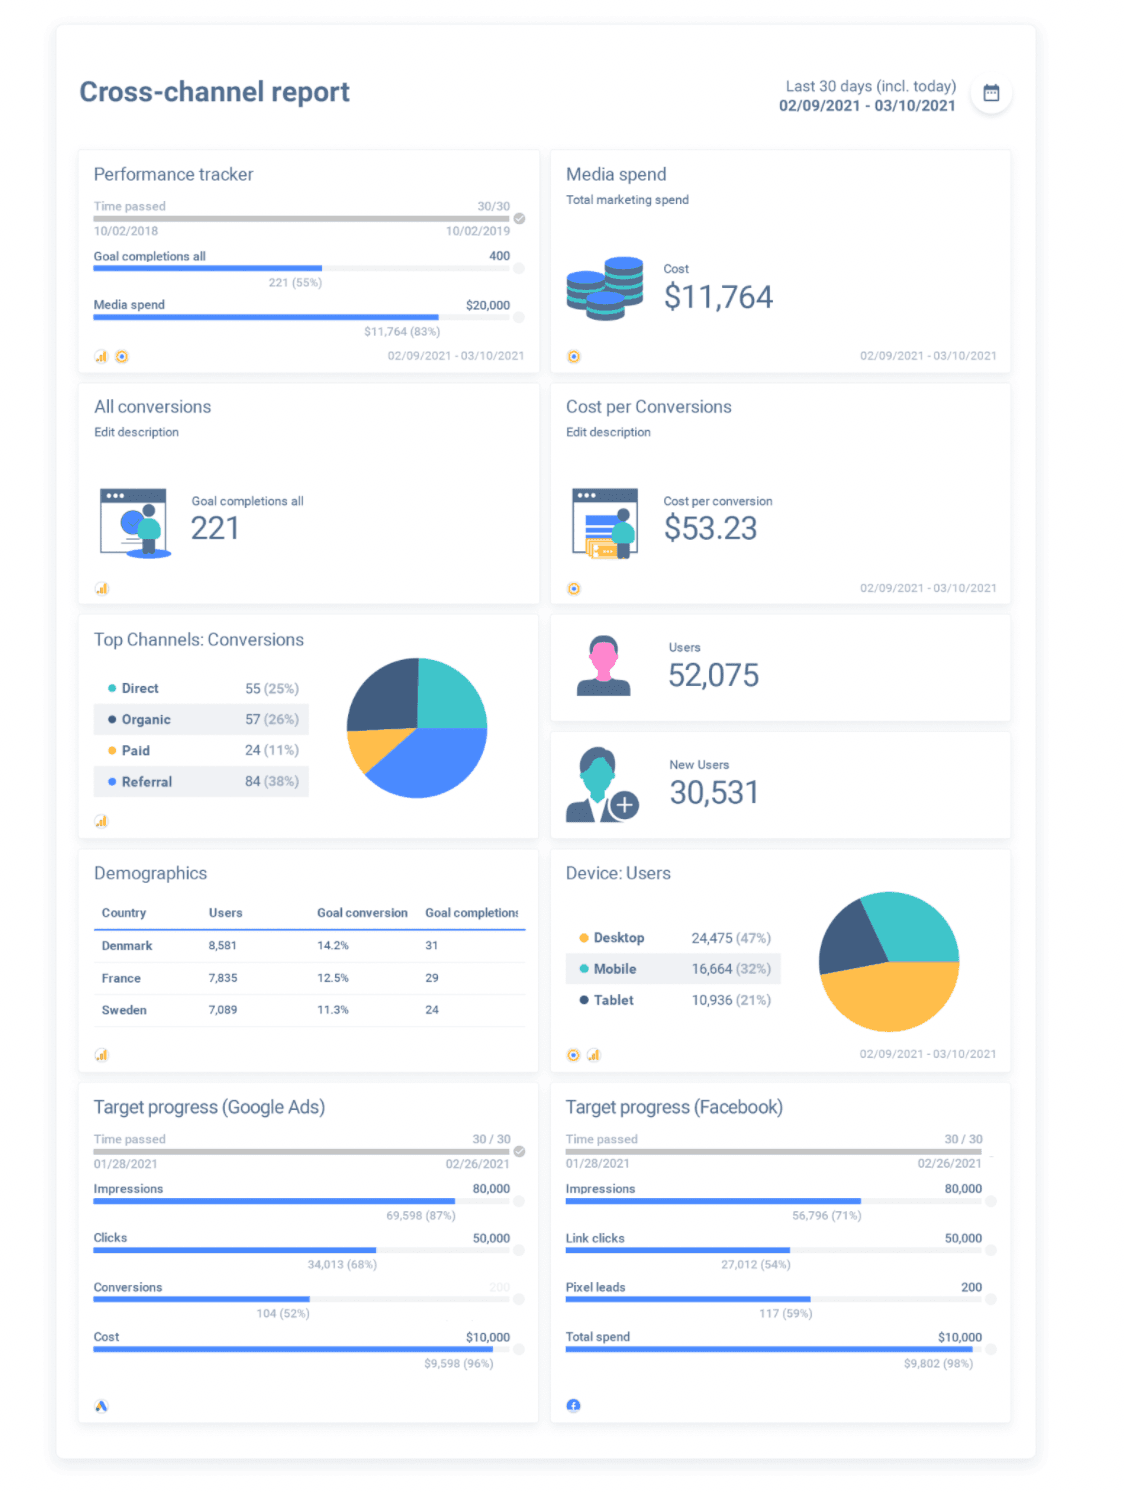
To illustrate how these metrics can be showcased, we present a cross-channel marketing data analysis produced with Whatagraph using our sample data. You can reproduce this same report with your own data channels for free right now or when you’re done going through the metrics. So here we go!
1. Leads & prospects
Easily the most important metric an agency or marketing department can deliver on. Healthy, strong leads will go down the pipeline towards the sales department, where they will become paying clients. This is the ultimate goal.
2. Conversions
Before anyone you target can become a lead, they must first become a conversion. A conversion happens when a member of your audience clicks on your call to action and completes it. All marketing steps are built around converting a percentage of the audience into leads.
Our cross-channel marketing report showcases how the media spend translates into goal completion. The goal here being conversions. It also showcases the most valuable channels in terms of conversions and does so in a chosen time interval.
3. Audience
Before converting, determining the correct audience is a key factor in any successful marketing strategy. According to SurveyMonkey, 44% of people find ads they are shown irrelevant. That is an alarming number, indicating that not enough time is spent on researching the audience needs.
Our cross-channel report showcases the demographics and audience device preferences. Additionally, it’s also worth looking at the change in audience size and demographics over time, which is possible when editing or building your own report. Understanding who you’re trying to reach is crucial.
4. Engagement
This is where you bait your audience into checking out what you do. Click on a link in your blog post, liking your social media post or clicking on your ad will generate engagement. This metric varies depending on the channel, as is exemplified in our cross-channel report. Here, Facebook engagement goals are impressions and likes, while Google Ads are clicks and straight-up conversions.
5. Industry review & competitive landscape
While you might not find this in a cross-channel report - because you can only have direct access to your own channels - this industry review is still possible via custom formulas. So, what should the industry overview contain?
Predominantly, there are four main components:
- The size of the market,
- Current trends,
- The projected growth of the market.
- Your Share of Voice.
All this information can undoubtedly be purchased from professionals like Nielsen or Business Insider. However, it will still need to be processed and presented in a visually appealing way. That’s where custom formulas will aid you.
Together with your usual cross-channel report, you can insert big-picture information about the general state of the industry. This will showcase what you’re doing well, how you’re staying on trend and where you can still grow or completely take over.
Final notes
Many different components go into a marketing strategy: coming back to the example of content strategy, around 30% of businesses compile their content plans from company goals, competitor analysis, audience needs and digital data. That’s a lot of moving parts, but they can all be kept together with clearly defined and closely tracked metrics - preferably in a single cross-channel report. You can try these metrics out now for free with Whatagraph!
Published on Aug 24 2021
WRITTEN BY
Indrė Jankutė-CarmaciuIndrė is a copywriter at Whatagraph with extensive experience in search engine optimization and public relations. She holds a degree in International Relations, while her professional background includes different marketing and advertising niches. She manages to merge marketing strategy and public speaking while educating readers on how to automate their businesses.