Digital Marketing Reporting in 2025: The Ultimate Guide With Templates, Dashboards, Tools and Metrics
What are the benefits of digital marketing reporting? What templates to use, and how often should you send reports? Here is a digital marketing reporting guide containing all the information you need to create compelling reports to help you monitor and execute marketing campaigns and strategies.

Aug 03 2022●6 min read


- What is digital marketing reporting?
- Digital marketing report vs. digital marketing dashboard
- What is a digital marketing analytics report?
- What to include in a marketing report
- How often should you create marketing reports?
- 5 tips for writing marketing reports
- Types of marketing reports
- Marketing report formats
- How to create a marketing report
- Why should you use digital marketing report templates?
- 3 digital marketing report templates to get started
- The benefits of digital marketing reporting
- Why create marketing reports in Whatagraph?
- Bottom line
What is digital marketing reporting?
Digital marketing reporting is the process of collecting and analyzing marketing data to create clear and actionable reports. Digital marketing reporting aims to understand campaign results, evaluate current campaign status, and predict future campaign outcomes. As a marketer's job is to tie everything to return on investment (ROI), digital marketing reporting helps ensure that the company profits from every marketing action the agency takes.
For successful reporting, agencies and marketers use reporting software that provide reliable and visible proof of our actions and outcomes via marketing reports and dashboards.
Like torches in the dark, these reports and dashboards help us explore the depths of our marketing data and unearth valuable insights.
In a nutshell, the goal of digital marketing reporting is to analyze and understand the performance of marketing activities and find ways to improve them.
Digital marketing report vs. digital marketing dashboard
What is a digital marketing dashboard?
A marketing dashboard is a document that includes live data of what is happening right now. Usually, this format is short, single–screen and has only the most essential marketing KPIs.
What is a digital marketing report?
A digital marketing report is a summary of data and insights from different online marketing channels, like social media, SEO, and email. It shows how your campaigns are performing, tracks key metrics, and helps you make informed decisions to improve future strategies.
Similarities
- Both the digital marketing report and reporting dashboard display data;
- Both can be customized;
- Both can be automated.
Differences
- A digital marketing report has huge volumes of data, while a dashboard provides a high-level quick overview of the most important KPIs you can present to the board or C-level stakeholders;
- The digital marketing report provides both historical and real-time data, while a dashboard provides only real-time data;
- Digital marketing reports are longer, focusing more on providing valuable data than the report's length. A dashboard, however, is usually brief and to the point.
Find out more about marketing reports and dashboards and when to use each.
What is a digital marketing analytics report?
A digital marketing analytics report is a document that tracks, measures and analyzes the performance of online marketing efforts. It includes data on metrics like website traffic, social media engagement, conversions, and ROI, helping you make informed decisions for future campaigns.
What to include in a marketing report
Your digital marketing report should highlight your results and key strategies you’re implementing through these sections:
- Executive summary
- Goals and objectives
- Marketing analysis
- Comparison table for metrics
- Completed actions
- Next steps and recommendations
Executive summary
The executive summary is a brief overview at the beginning of your marketing report. Its purpose is to grab the reader’s attention and briefly overview your marketing efforts for a specific period.
Goals and objectives
This is where you outline your marketing goals to add context to your activities and help everyone understand why you’re doing what you’re doing. This action-oriented approach works in any marketing campaign.
Marketing analysis
The marketing analysis should comprise the bulk of your report, as it’s essential for assessing your performance. It allows your team and clients to understand your progress towards the goals.
The analysis should never reiterate results, as that would only mean you’re turning metrics into words.
The idea here is to give more context to the numbers in the report. For example, let’s say the clicks are down because the CTR dropped. When segmented by device, it should be clear what caused it — for example, a drop in absolute top impression share on the desktop.
Comparison tables for metrics
By comparing metrics from different periods, you can spot trends and which channels have significantly impacted your goals and objectives. For example, in SEO reports, the focus will be on a year-over-year organic traffic comparison.
A month-over-month comparison is also used, but YoY provides the most accurate insight into whether the efforts brought a positive change without being influenced by seasonal trends.
- Seasonality is the predictable effect of seasons or commercial holidays on marketing and sales. It impacts every industry differently. For example, an ice cream vendor hopes to sell more in the summer than during the winter months. For a B2B SaaS company, leads and sales might be lower during the summer, as prospects will likely be out of the office or on vacation.
Completed actions
It’s normal to assume that your stakeholders or clients will want to know how you have invested your time. By highlighting the completed actions, you’re showing your worth and gaining more trust to launch more experiments and campaigns.
Next steps and recommendations
Highlighting your next steps is a great way to keep your clients involved and show how you're developing strategies based on understanding historical data. When you outline the next steps, you demonstrate proactivity in addressing any problems with the performance.
How often should you create marketing reports?
“Reporting can be done daily, weekly, bimonthly, monthly, quarterly, or annually, depending on your requirements,” says Aaron Crewe, Managing Director at Novi.Digital.
However, Ruler Analytics found that 32% of marketers track campaign success monthly, while 43% measure weekly performance.
Here is how different intervals would benefit your agency:
- Weekly reporting — Provides essential insights into your latest marketing initiatives' success. This data is valuable for developing an action plan for the coming weeks, so maybe you should learn how to write a weekly marketing report.
- Monthly reports — Provide a broader overview of your marketing initiatives and their performance. This data is valuable when understanding how these initiatives influence core KPIs. Here’s what you should include in a monthly marketing report.
- Quarterly reports — Provide crucial metrics when assessing quarters’ performance.
Usually, marketing agencies examine:
- Revenue growth and deals won;
- New leads and conversion rates across different channels;
- Paid advertising spend and ROI;
- Social media marketing performance and growth, etc.
Choose the frequency that would provide the most value to your agency and marketing team, depending on your goals and needs.
Usually, clients aren’t tech-savvy and don’t need huge volumes of data in a report. They need a report with key insights into how your marketing agency is delivering on promises and meeting goals.
So, how often should you send client reports?
We surveyed over 160 mid-size agencies and agency clients worldwide to better understand the landscape of agency-client reporting and lay the groundwork for report monetization.
And we discovered that:
- The majority of agencies report on a monthly and weekly basis.
- Clients, on the other hand, appear to have slightly different expectations. Monthly and real-time reporting received equal votes, with weekly reporting coming in second and daily reporting coming in third.
5 tips for writing marketing reports
Now that we’ve covered the content of marketing reports and the ways to create one, let's give you a few more valuable tips to communicate your results the best.
1. Keep your audience in mind
Marketing is a form of communication at the most basic level, and marketing reporting should follow suit. Before writing a marketing report, consider who you report to and what is most important to those people.
There are many kinds of reports, and what matters to one person might be irrelevant to another.
For example, your marketing team would like to know why the bounce rate is not improving, while the leadership will be more interested in high-level indicators. Ask your recipients about their goals and what they care about most.
2. Focus on KPIs that matter
As a cross-channel marketing data platform, Whatagraph tracks detailed metrics such as conversions, sessions, and clicks. But if you try tracking too many metrics simultaneously, your report can be too complicated to understand.
However, there’s no rule on how many metrics you should include.
Some campaigns require reporting only specific metrics, while multi-channel ones require many more to gauge cross-channel performance.
The only rule and advice we can share is to think carefully about your goals and choose the metrics that impact them. Keep your metrics aligned with the company’s vision and mission, and clients or stakeholders will have no trouble understanding your actions.
3. Explain your data
A common mistake that inexperienced marketers make is to send out detailed reports without giving any background or explaining what the numbers mean and how they impact the business.
The interested parties need to understand exactly what results you’ve achieved, why they are essential, and how they benefit their company.
It means little to say that your traffic went up 35% last month without explaining why. In the same way, the number of visitors in a table without context offers little value.
But if you say that the traffic went up due to specific keyword targeting, that changes the entire perspective.
4. Show the impact on business goals
For most clients, the whole point of marketing is to make more money, which means they want to see a return from marketing.
You need to show how your actions directly impact revenue whenever you can — in other words, by focusing on metrics like return on marketing investment (ROMI) and return on ad spend (ROAS).
Still tracking ROMI can be both your best friend and your worst nightmare.
It can help you make more data-driven decisions and streamline your marketing campaigns for maximum revenue.
On the other hand, it can be hard to isolate, especially if you have multiple channels working simultaneously to drive new opportunities.
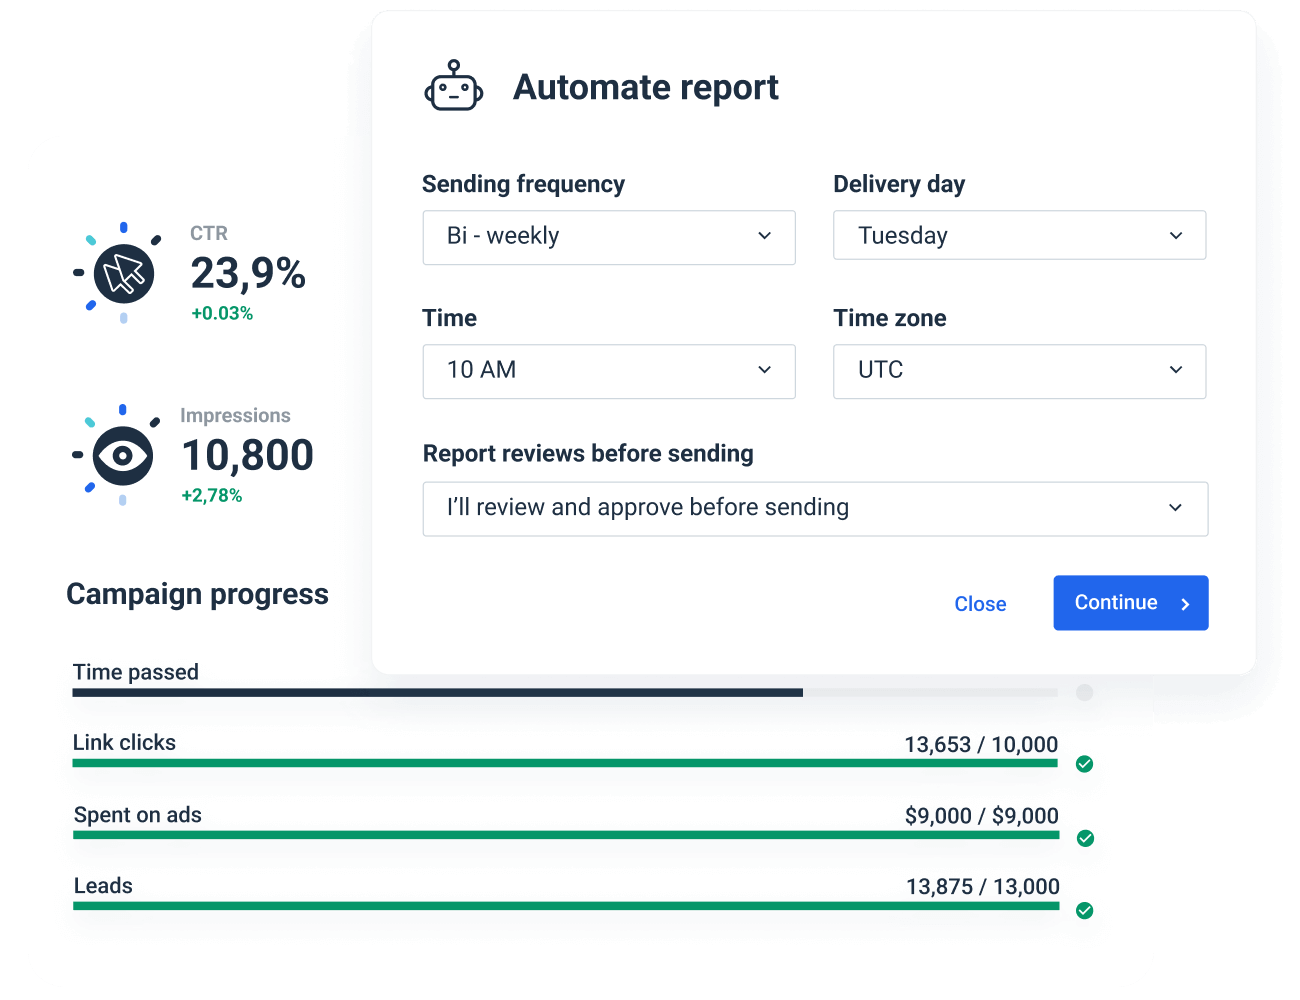
5. Automate whatever you can
Spend too much time on reporting, and you’re missing out on other productive tasks that move your agency forward.
By automating your reporting processes, you eliminate repetitive tasks and focus on driving better results.
As a marketing data platform with advanced reporting capabilities, Whatagraph has multiple features that automate different aspects of reporting.
Automated email send-outs at chosen intervals is the most popular automation, but there are others.
For example, instead of editing one report at a time, you can change multiple reports simultaneously. This is a big timesaver for agencies that work in specific industries where most clients have the same needs.
Also, once you customize a report widget, you can save it and use it in all reports you create in the future without having to go through the process again.
Types of marketing reports
We have a great blog post about 6 marketing report examples where you can learn about different report types. But while you’re here, let’s just break down the most common report formats.
Marketing report formats
Dashboard
A dashboard is the quickest way to report to a client or anyone inside the company. Share the link once, and stakeholders can always access the latest results. However, since a dashboard mostly uses simple charts and single-value widgets, it might not be informative or understandable enough for some recipients. In that case, you need a:
PDF report
A PDF report gives you more room to present your data. Often sprawling on several pages, you can also include historical data to show how the numbers have changed over time. In Whatagraph reports, you can easily add a comment or conclusion next to each widget, which is a good way to provide context on the spot.
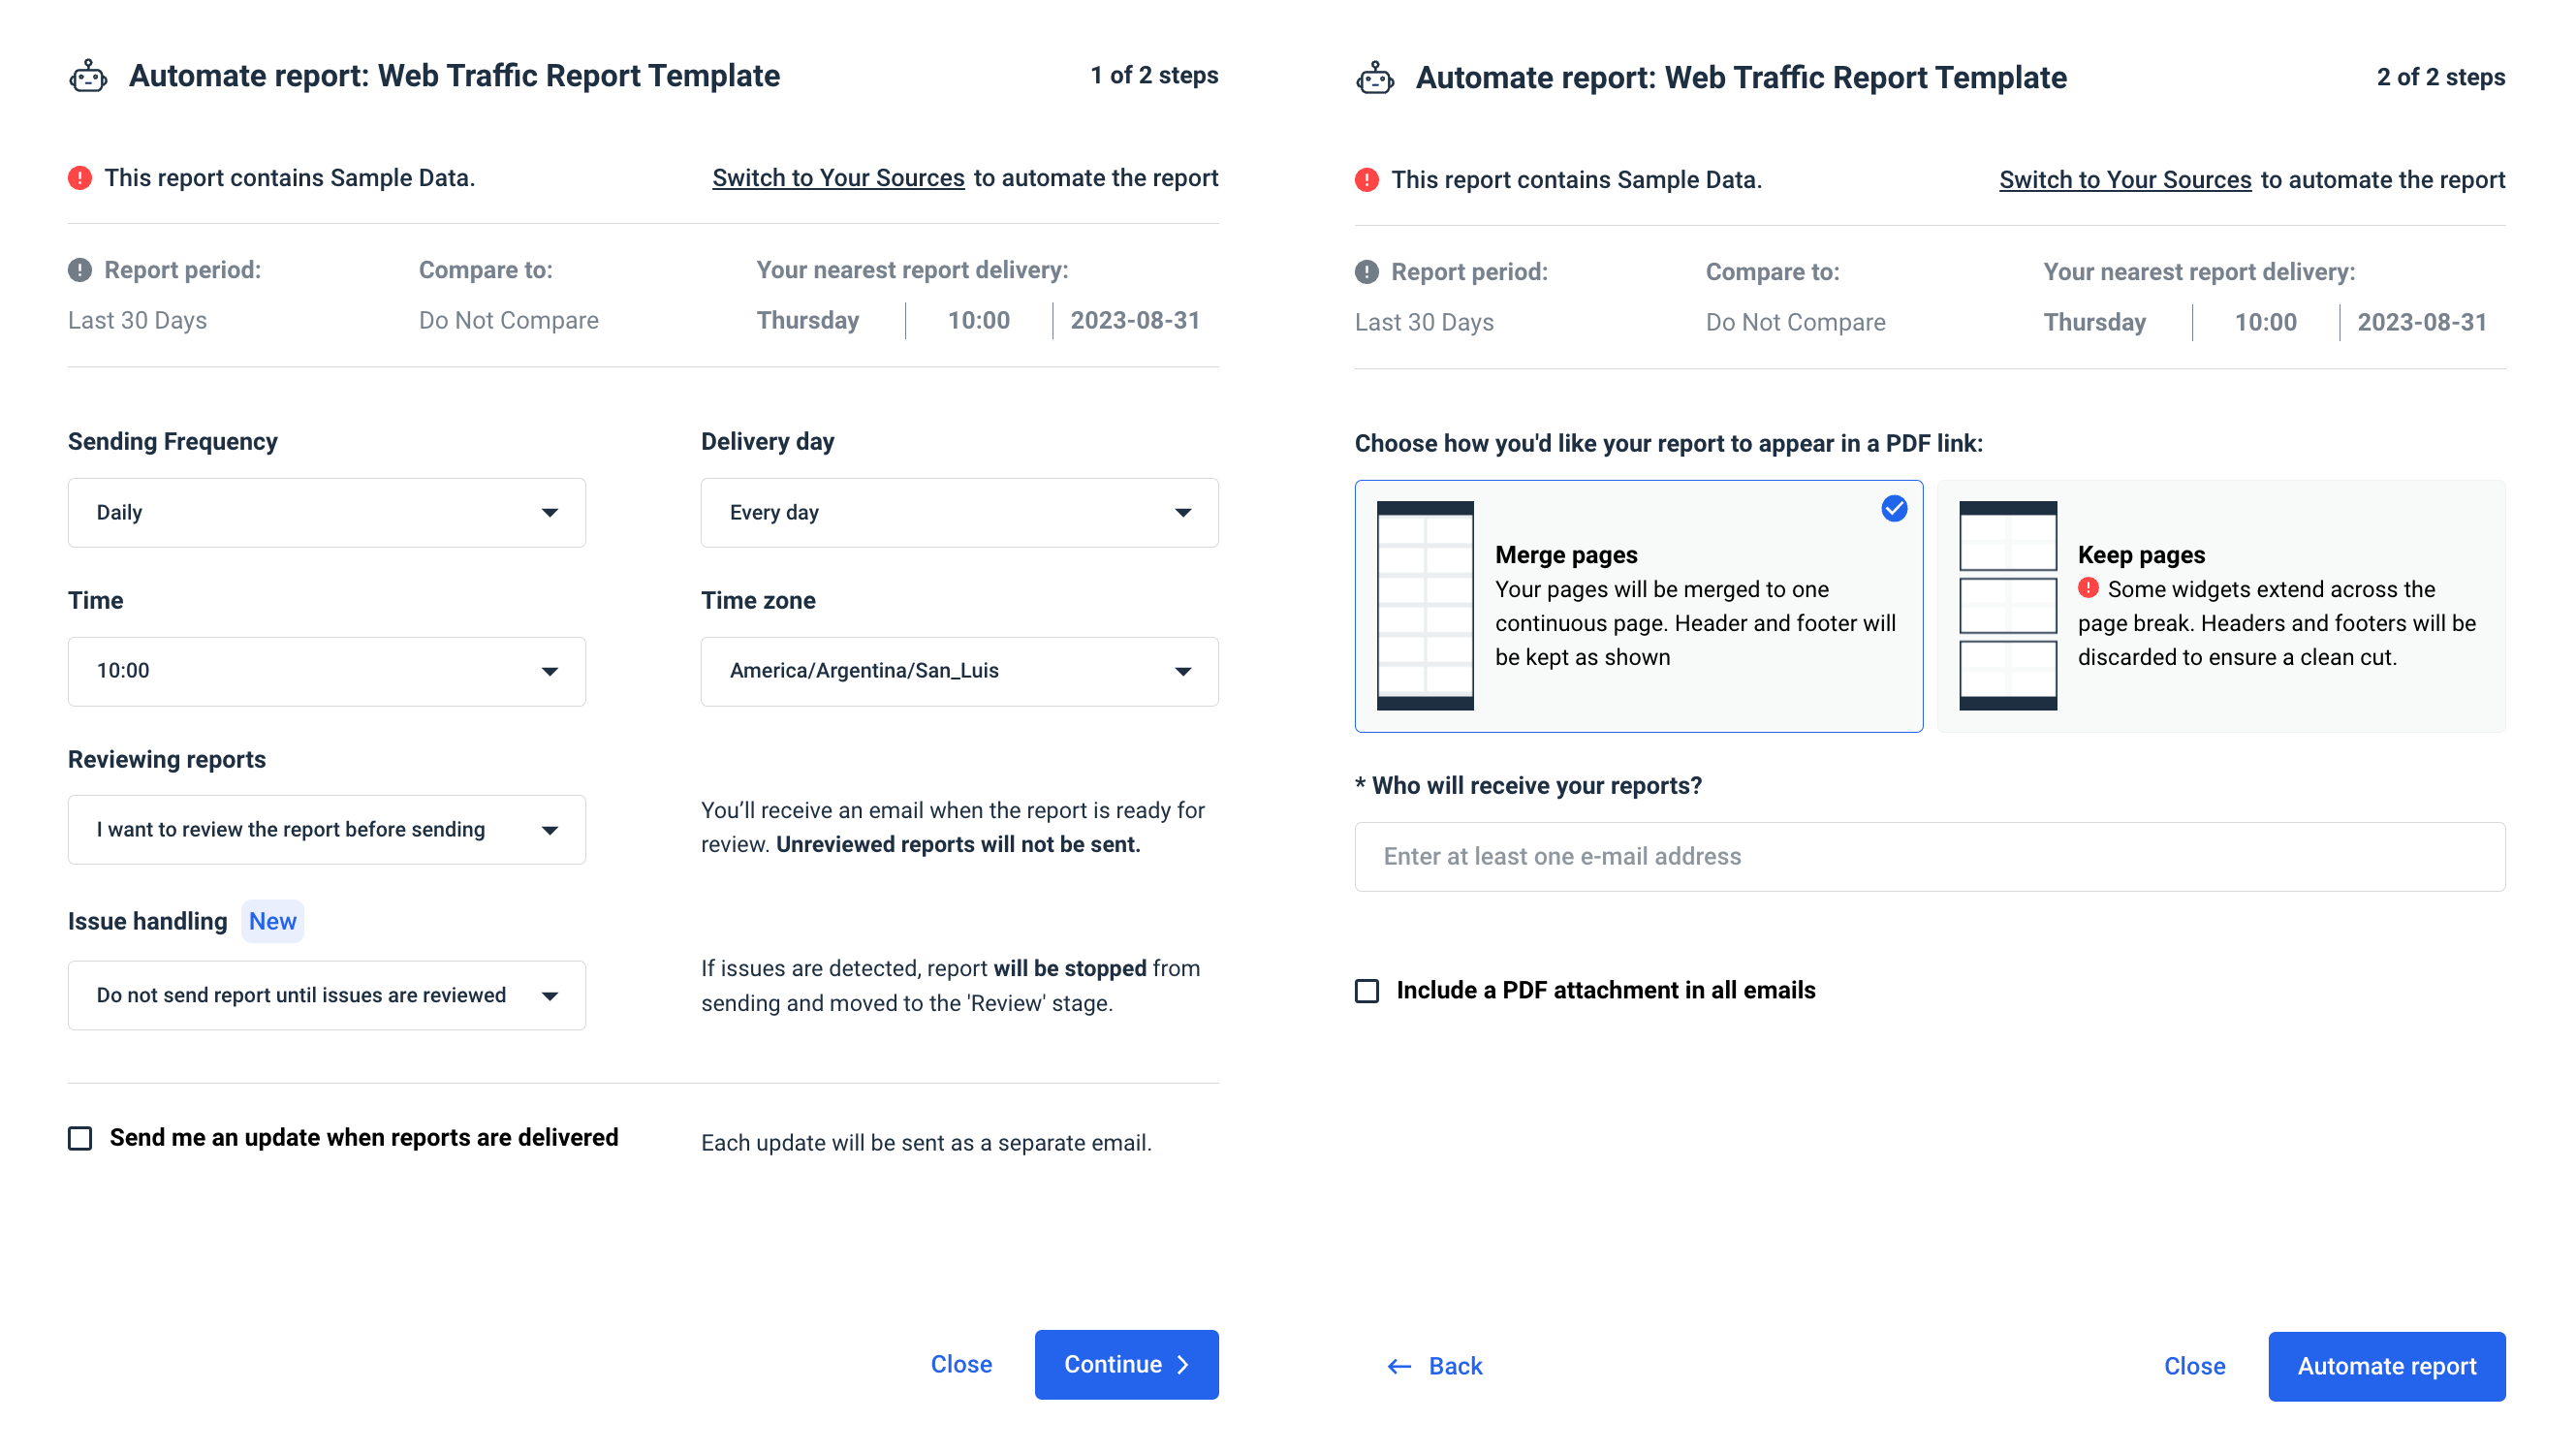
To share this type of report, you can download it as a PDF and share it any way you want. On the other hand, Whatagraph gives you the option to automate the sending:
Email
But what if you have a client who doesn’t need a detailed report? For those who still prefer doing things the old-fashioned way, you can offer to send the most important conversion metrics by email once a week. Still, this type of marketing report is rarely used, especially since Whatagraph reports allow you to easily present the executive summary at the very top of every report. For high-level execs who don’t have time to go through the whole thing.
Presentation
You can share a link to your marketing dashboard or send PDFs every week, but occasionally, you may also present the results and discuss them with clients or stakeholders in person. This kind of meeting report is a good opportunity to propose new initiatives or ask for a higher marketing campaign budget — if your results justify the investment.
How to create a marketing report
There are three common ways marketing agencies create marketing reports:
- manually,
- from a template,
- using a reporting tool from scratch.
Create reports manually
Manual reporting has been the only way marketing agencies have created reports for decades.
Yet, it has so many cons that it is no longer the ideal way to analyze data:
- Time-intensive — It takes many hours to create advertising reports by hand. Because you need to cover all these marketing channels and campaigns, typing the data and results from each will take valuable time.
- Resources-intensive — Because creating reports manually takes a lot of time, some marketing agencies might need additional staff.
- Prone to human errors — As you can imagine, typing numbers for hours requires total concentration. Because of that, there is a high chance of data inaccuracies and misplaced and mishandled data.
Create reports from templates in Whatagraph
Here at Whatagraph, we know that manually creating reports is far from ideal. That’s why we offer a library of ready-to-use templates for marketing reports.
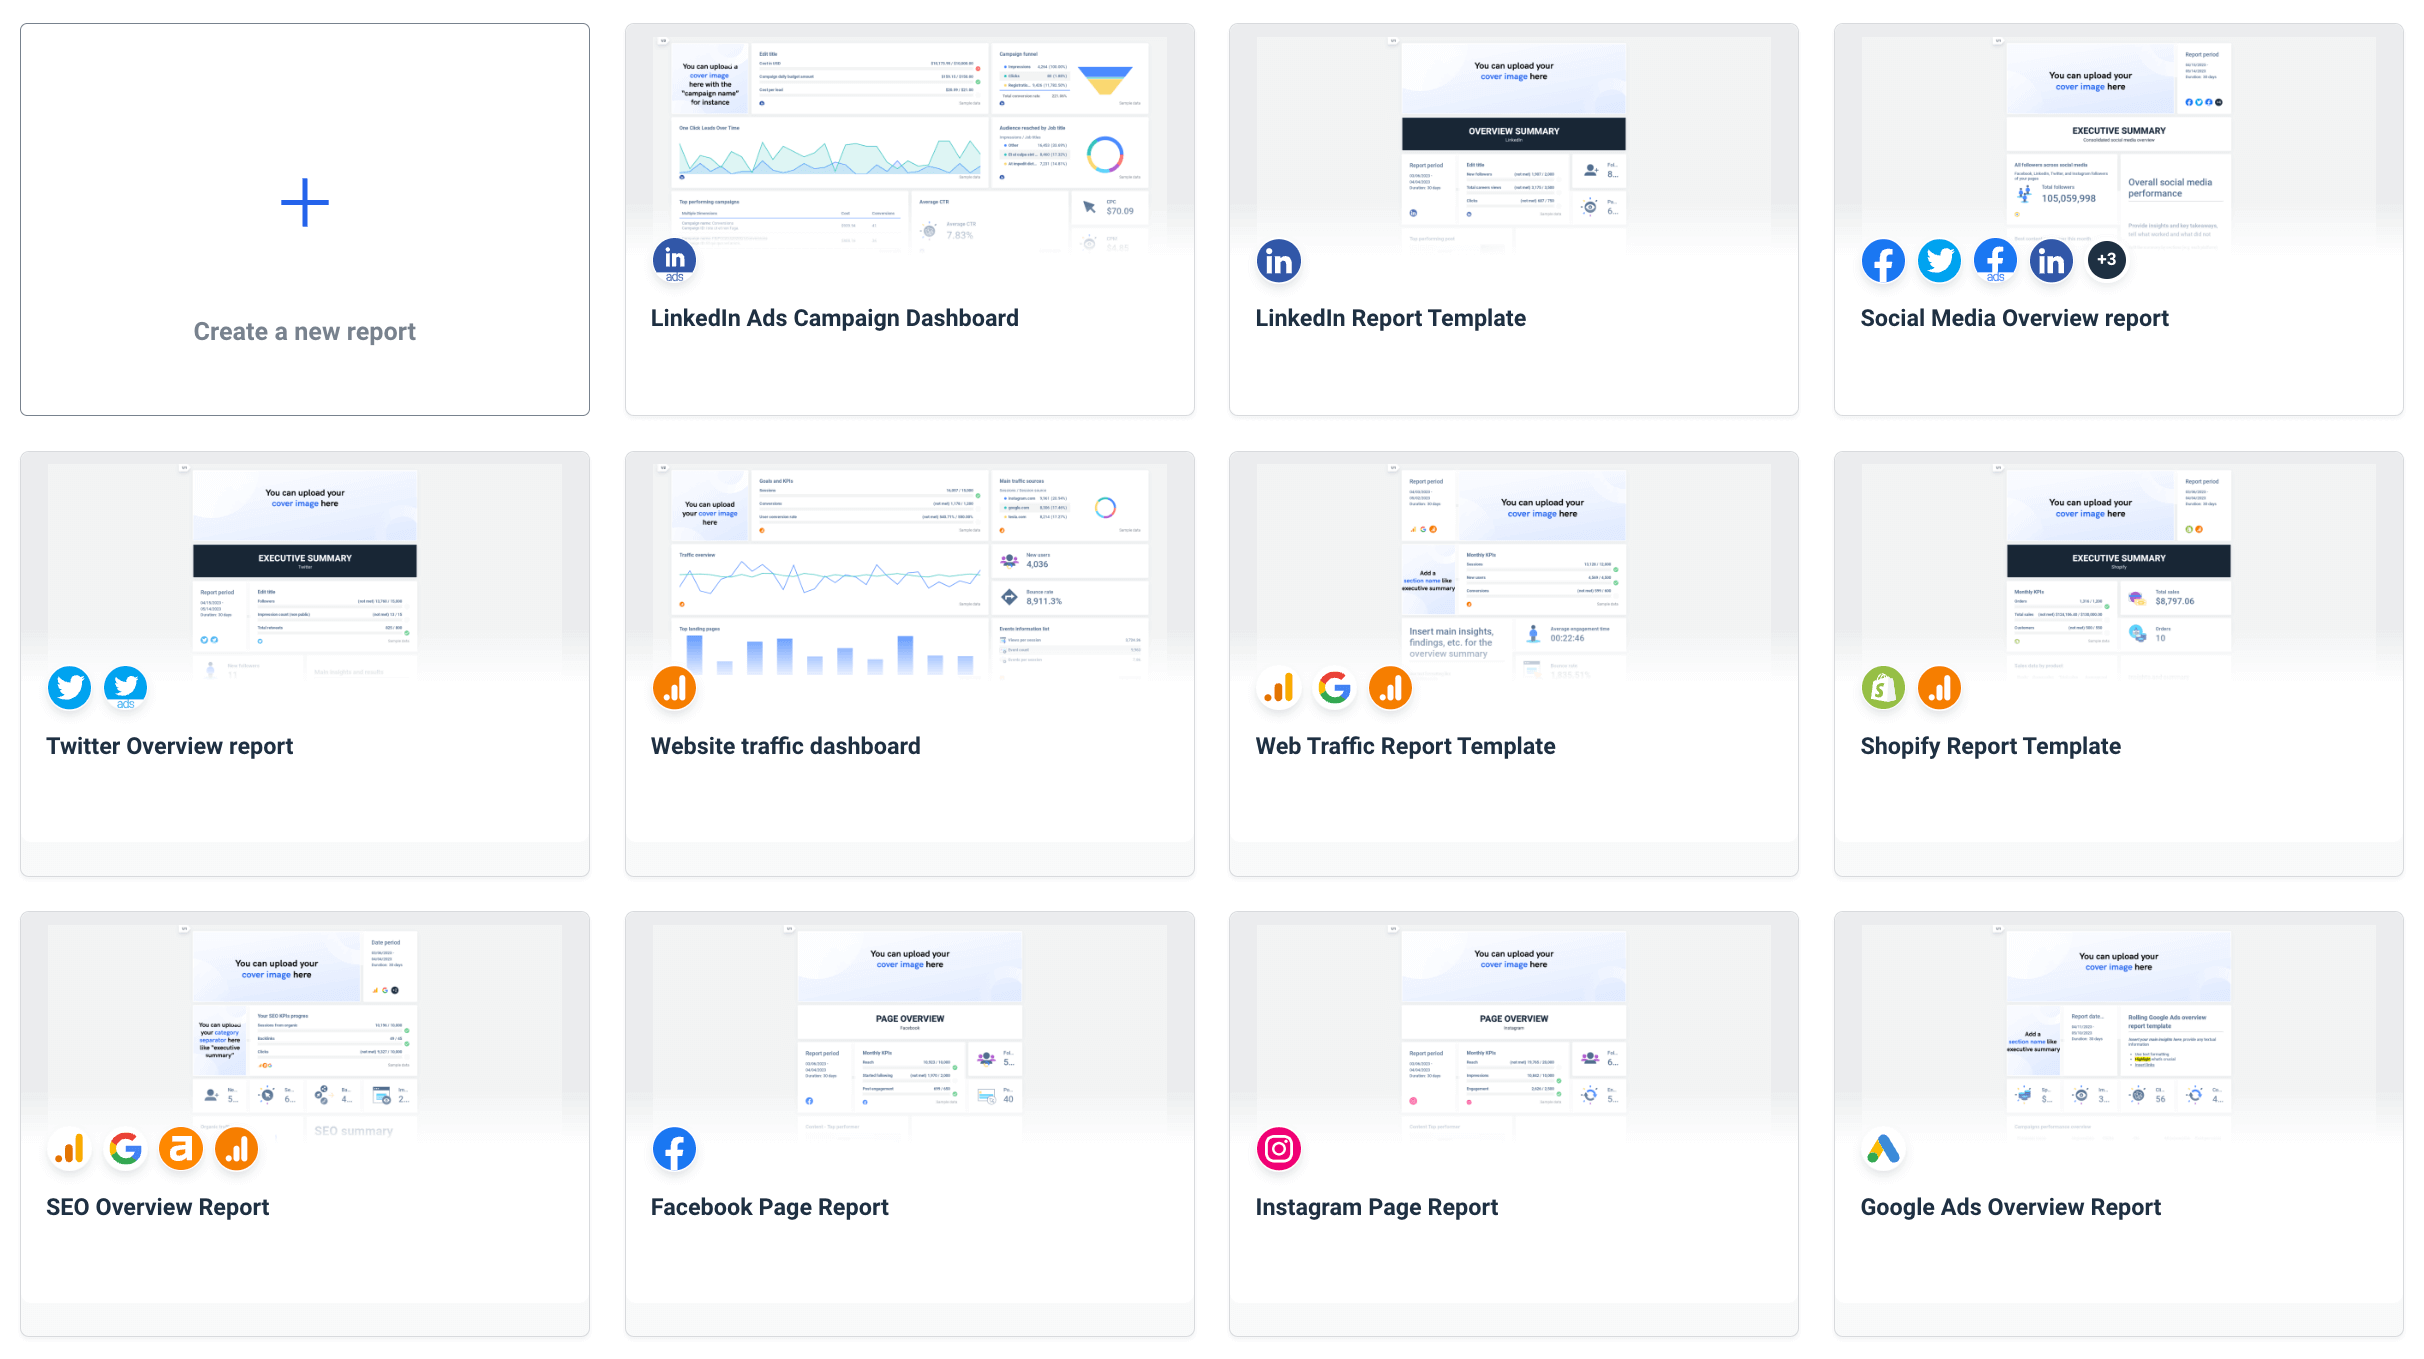
Use any of these pre-made templates and save hours for data reporting.
But templates alone don’t mean much without the Whatagraph environment.
Whatagraph is an all-in-one marketing data platform for connecting, visualizing, and sharing marketing data from various data sources.
You can use the same tool to pull and visualize data without requiring third-party connectors.
The ability to connect, visualize, and share data puts Whatagraph ahead of competitors like Looker Studio, which needs another tool to connect sources. Other Whatagraph alternatives, like Supermetrics and Funnel.io, only act as data connectors and require a separate tool to visualize data.
Thanks to over 45 native integrations with popular marketing platforms, you can easily access client data and create digital marketing dashboards or reports in no time. Whatagraph’s native data visualization function allows you to include key metrics and KPIs and effortlessly manage multiple clients.
Let’s say you want to create a monthly marketing analytics report for your client.
Nothing easier.
Just grab a marketing analytics report template, add your client’s marketing channels, and tweak the report to customize it for the client in question.
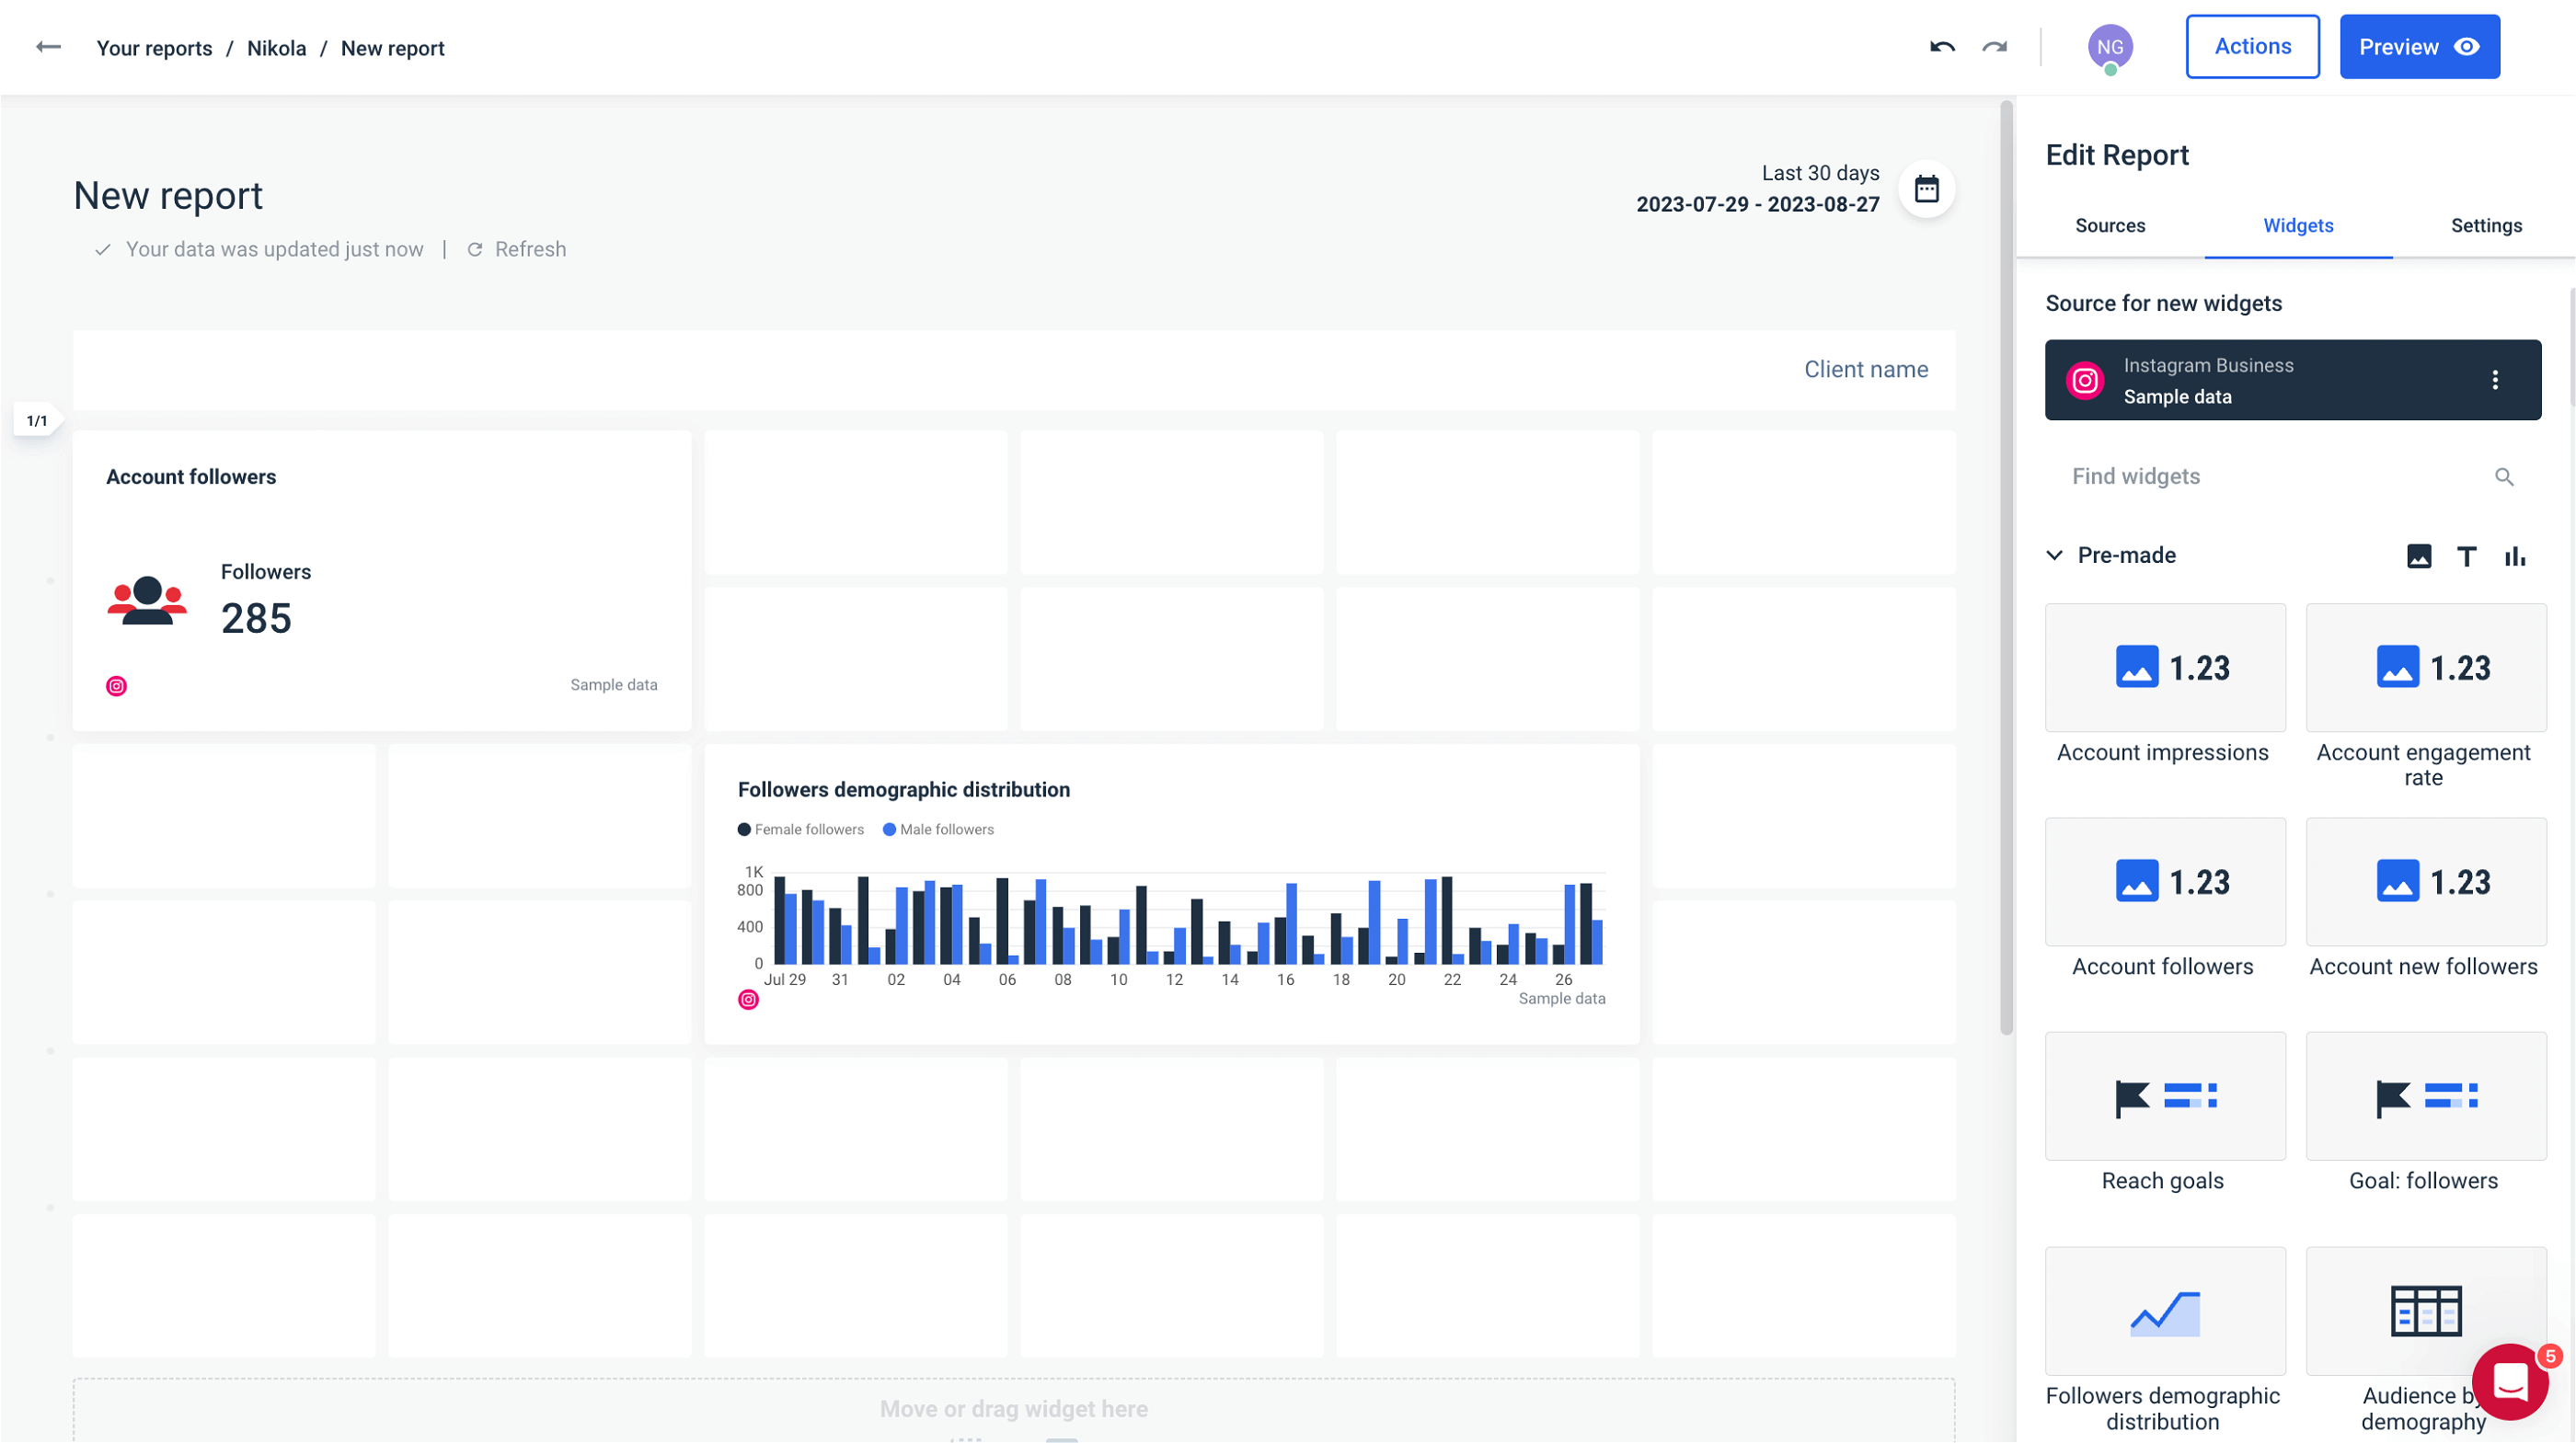
Create a report from scratch in Whatagraph
Creating reports from a blank page in Whatagraph is easy, and even a non-tech-savvy person can do it.
All you have to do is connect your client’s accounts and the marketing tools you use to promote their business and pull the data.
After that, drag and drop widgets that best represent your strategy’s performance and progress, depending on the KPIs and metrics you report on.
Why should you use digital marketing report templates?
Using digital marketing report templates has many advantages for both agencies and in-house marketers. They can help you:
Save time
Marketing templates are tools that are always ready to go and present data quickly.
Need a Facebook Ads report? Go to the template library, select the Facebook Ads template, and have a report presented in a few seconds.
By saving precious time, you can use it for more creative tasks.
For example, you could build better client-agency relationships, run different experiments, or look for different channels to generate leads.
Our suggestion is simple — leave reporting to Whatagraph, while you take care of other agency-related things.
Avoid mistakes
Marketing report templates are useful because they pull data automatically.
This means you don’t need to worry about inaccurate or unreliable data.
Improve brand consistency
Create a report using Whatagraph’s template; you can customize it, white-label it, and save it for future use.
Change colors, report domains, and logos; your clients will consistently receive reports matching your agency’s branding. Such brand consistency gives you 3.5x better visibility compared to brands with inconsistent presentation.
3 digital marketing report templates to get started
Let’s look at three marketing report templates you can try in Whatagraph.
SEO report template
Use the SEO report template to examine your client’s website performance KPIs, keywords, SERP positions, organic search, and other critical engine optimization metrics.
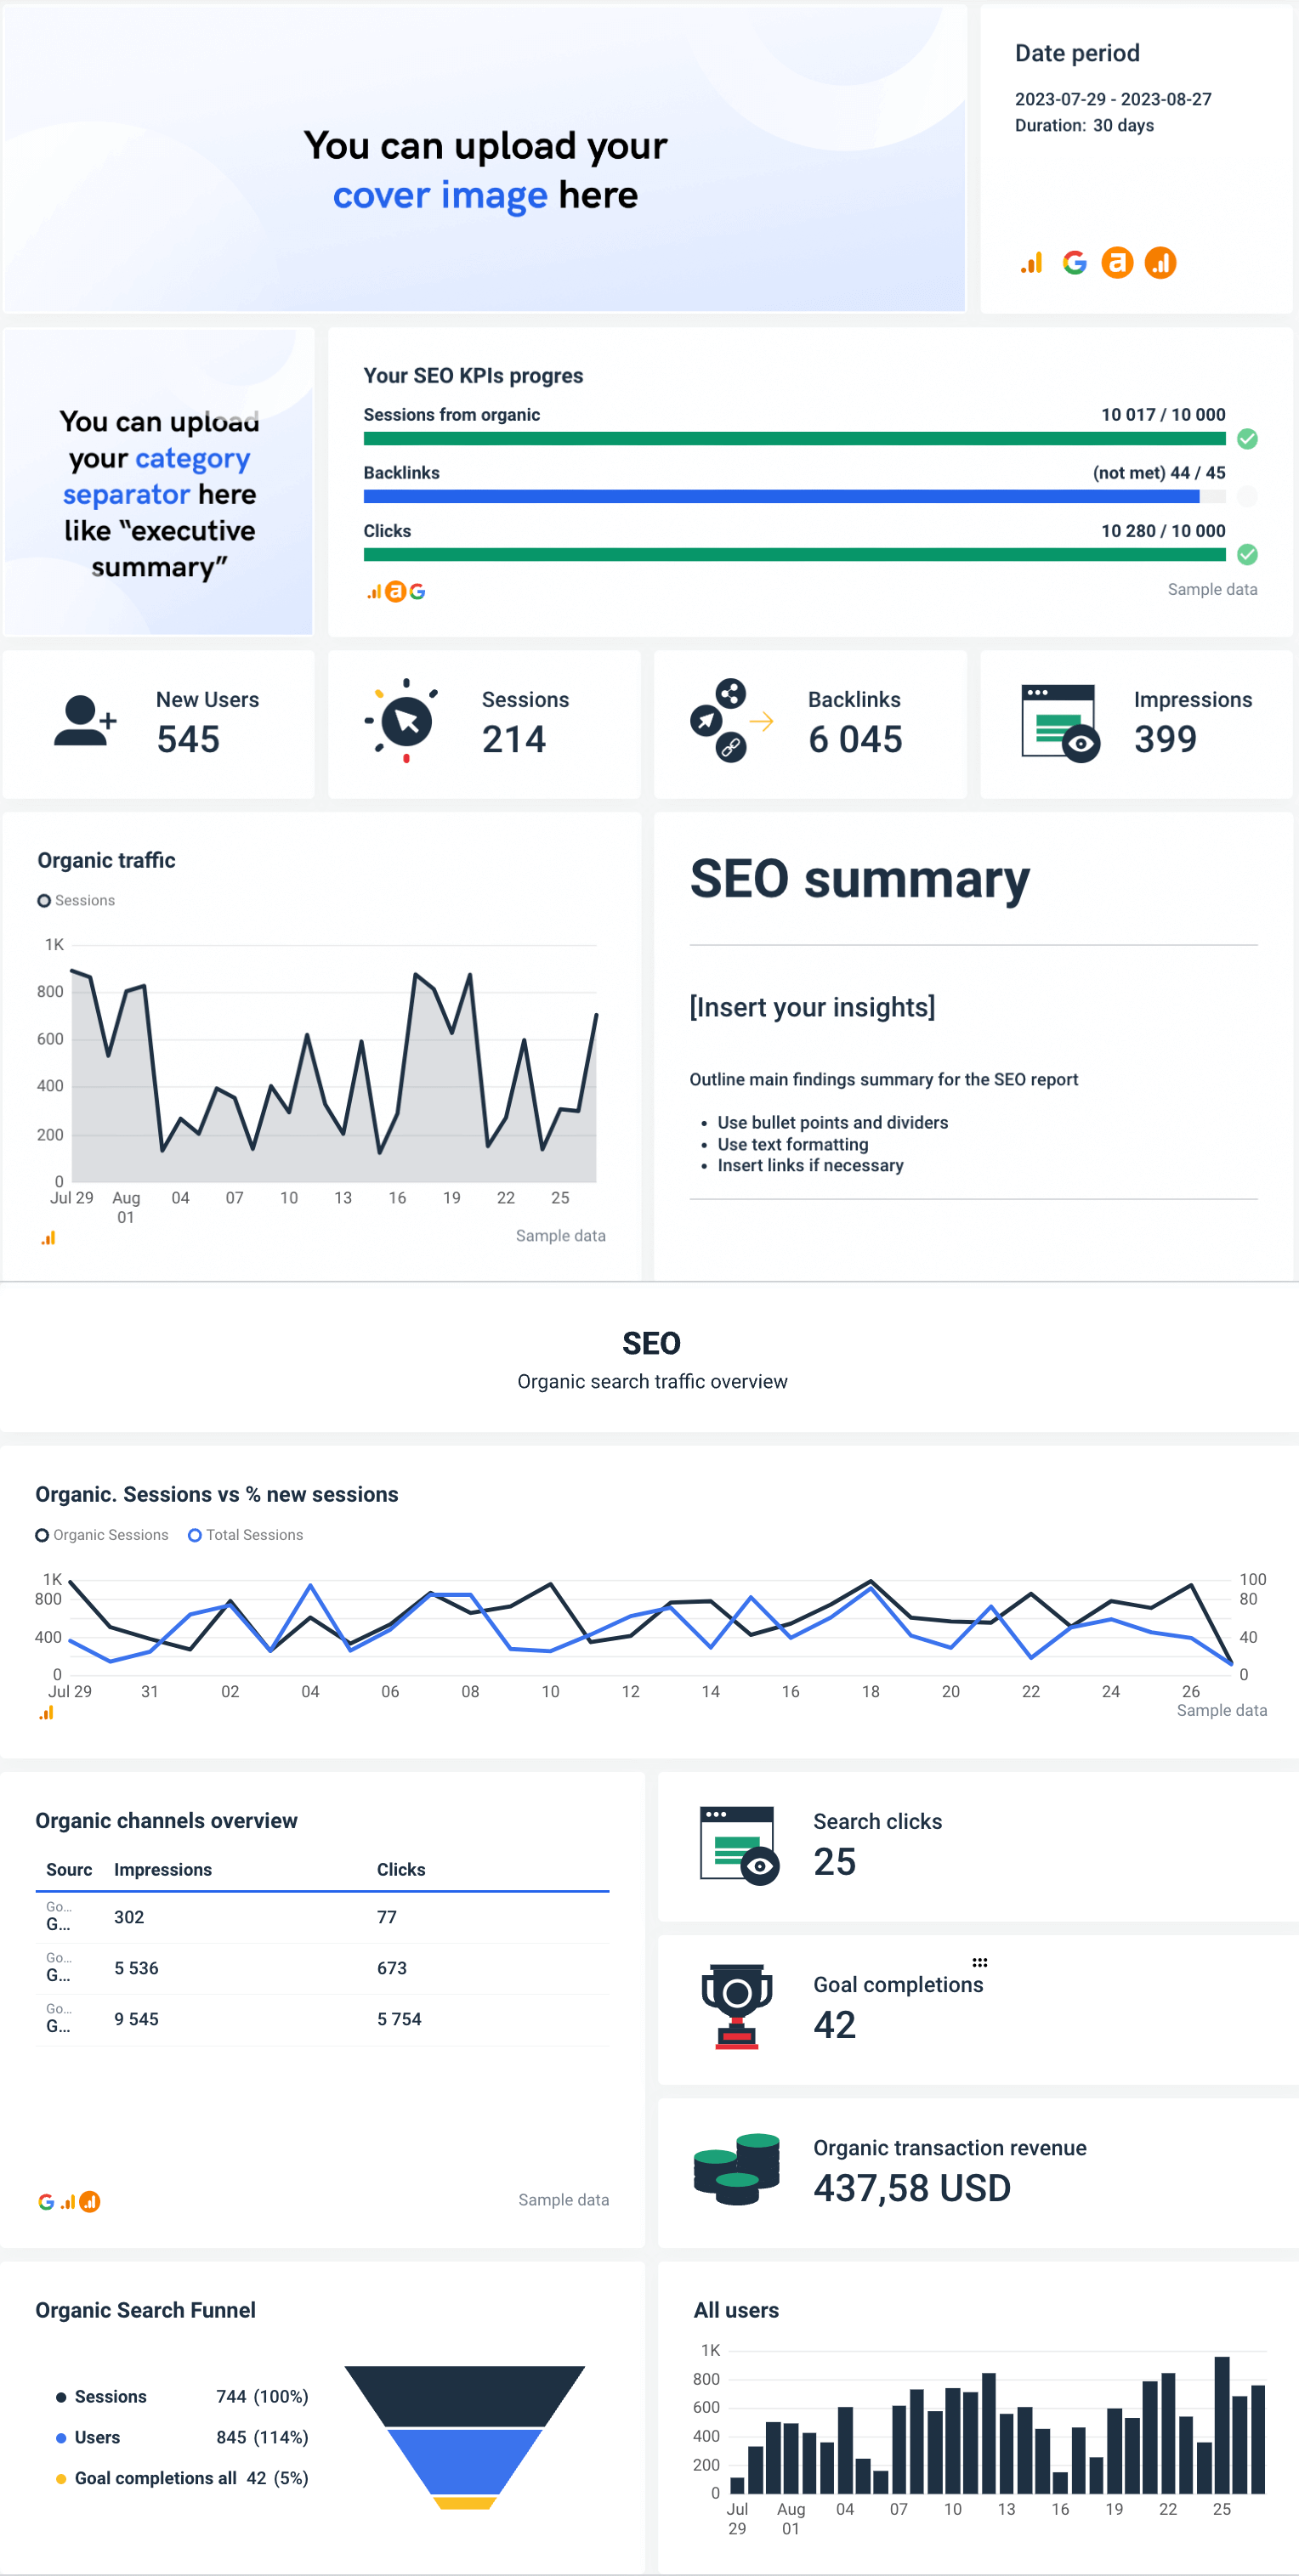
This SEO report template provides detailed data to your clients in just a few clicks. Track and display your client’s website organic traffic, clicks, rankings, impressions, click-through rate (CTR), bounce rate, link-building analytics, and more. Learn how your marketing efforts are faring and progressing, and then optimize based on this data.
Cross-channel marketing report template
Marketing agencies work with various clients and conduct marketing campaigns through various channels. A cross-channel marketing report template gathers data from various sources and compares how each performs on its own and in relation to the others. With Whatagraph's cross-channel reporting, you can easily track the campaign performance of LinkedIn and Facebook Ads and compare them with Google Analytics 4 insights, for example.
Social media report template
Probably the most popular report template is the social media report template.
Whatagraph can integrate the most common social media channels, including Instagram, TikTok, LinkedIn, Facebook, and YouTube.
Whatagraph's social media report is handy because it is organized across multiple channels. You can quickly see how much ROI you get from each social media platform. You can assess where you should invest more time and attention by creating divisions for each social media site — one for Facebook, one for TikTok, one for LinkedIn, and so on.
The benefits of digital marketing reporting
Whether you are an agency, an in-house marketer, or a freelancer, you must report on your digital marketing activities to understand how you perform. Here are four other benefits of creating marketing reports:
Keep clients/managers up to date
From time to time, marketing agencies get questions about how a specific campaign is doing.
There may also be bi-weekly meetings with a client or manager to discuss updates on your marketing campaigns.
A good rapport with clients is important for marketing agencies, and there’s no better way to establish it than by providing regular updates on campaign or strategy performance.
Studies show that 68% of customers leave an agency when they believe it doesn't care about them. The same percentage of people are willing to pay extra for the service if the customer service is spot-on.
You should consider automated reporting to have better client retention rates and keep your clients and managers happy.
Automated reporting keeps you accountable, educates your clients regularly, and provides updates on your successes and failures.
With Whatagraph, you don’t even need to send reports manually. Create a visual report using our intuitive drag-and-drop builder, and schedule an automated send-out at your desired frequencies.
Here are two case studies of how marketing agencies managed to increase productivity and save time by using Whatagraph as a reporting automation tool:
UpTick Marketing, for example, saved 40 hours per month on reporting by switching to Whatagraph as its automated reporting software.
That’s a whole workweek!
This digital agency from Birmingham, Alabama, has reduced its client reporting time to just 10-20 hours a month by using Whatagraph to effortlessly create cross-channel marketing reports for its clients.
Market Solutions is another example of a company that saved between 30 and 70% of time on each report by shifting from manual to automated reporting. This marketing agency from Sweden struggled to scale, as its employees used to spend from 5-10 hours on average creating a single report.
With Whatagraph, this agency didn’t only find native integrations, an intuitive report builder, and easy sharing, but also the option to leave comments explaining each visualization — something their clients are used to having.
The agency managed to serve 150+ clients with only 15 employees — deliver reports on time and increase productivity.
Pro-tip for agencies: Learn how to turn client reports into an additional source of revenue.
Make better marketing decisions
Marketing agencies depend on reports to look at ad campaigns, lead-generating keywords, pages, or website traffic for any noticeable anomalies or shifts in marketing performance metrics.
They look at month-over-month (MoM) and year-over-year (YoY) traffic and interpret marketing data to craft actionable next-step recommendations.
A digital marketing report is not only useful when you’re launching a new experiment, project, or initiative. It’s also essential for getting historical data for future launches.
Take, for instance, Whatagraph. You can create a cross-channel dashboard with interactive graphs for a real-time view of your initiatives. But if you want to develop a new strategy for the upcoming quarter, you need data to support your decisions.
This is when you create a cross-channel marketing report.
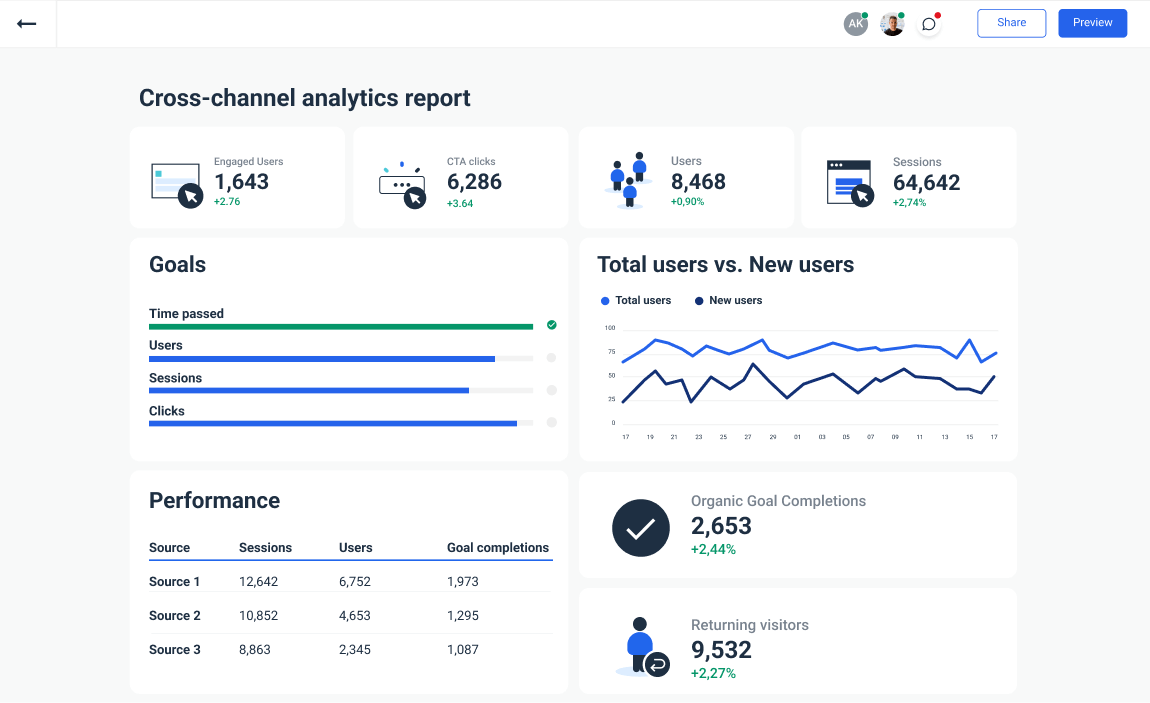
A cross-channel report is beneficial for any marketing agency because it:
- Pulls data from multiple sources in a single report;
- Showcases customer behavior, ad performance, channel, and campaign patterns;
- Provides historical data that you can use to make more informed decisions.
Keep budget under control
Marketing agencies usually use one or all of these digital marketing strategies:
- Sponsored content;
- Social media ads;
- Ad retargeting;
- Banner ads;
- Influencer marketing;
- Events.
Not only that, but they usually run these campaigns along the way:
- PPC campaign;
- Lead generation campaign;
- Product marketing campaign;
- Sales promotion campaign;
- PR campaign;
- Email marketing campaign.
As you can see, that’s a lot of paid initiatives.
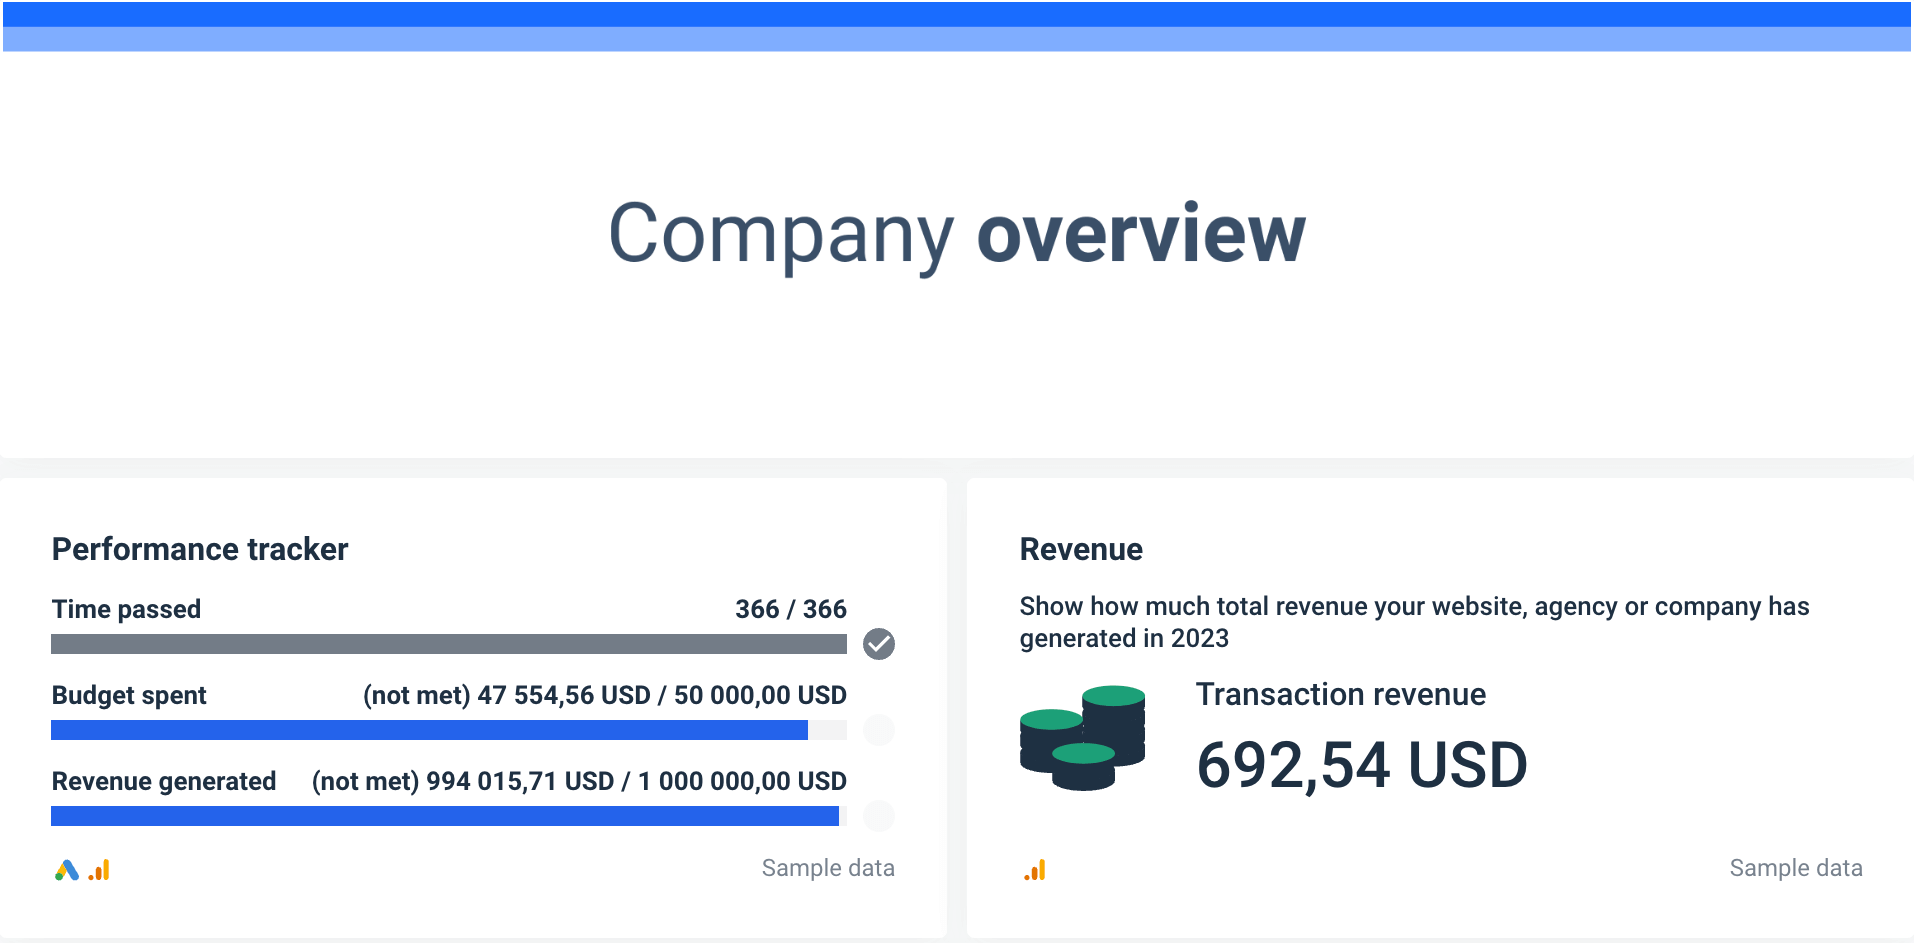
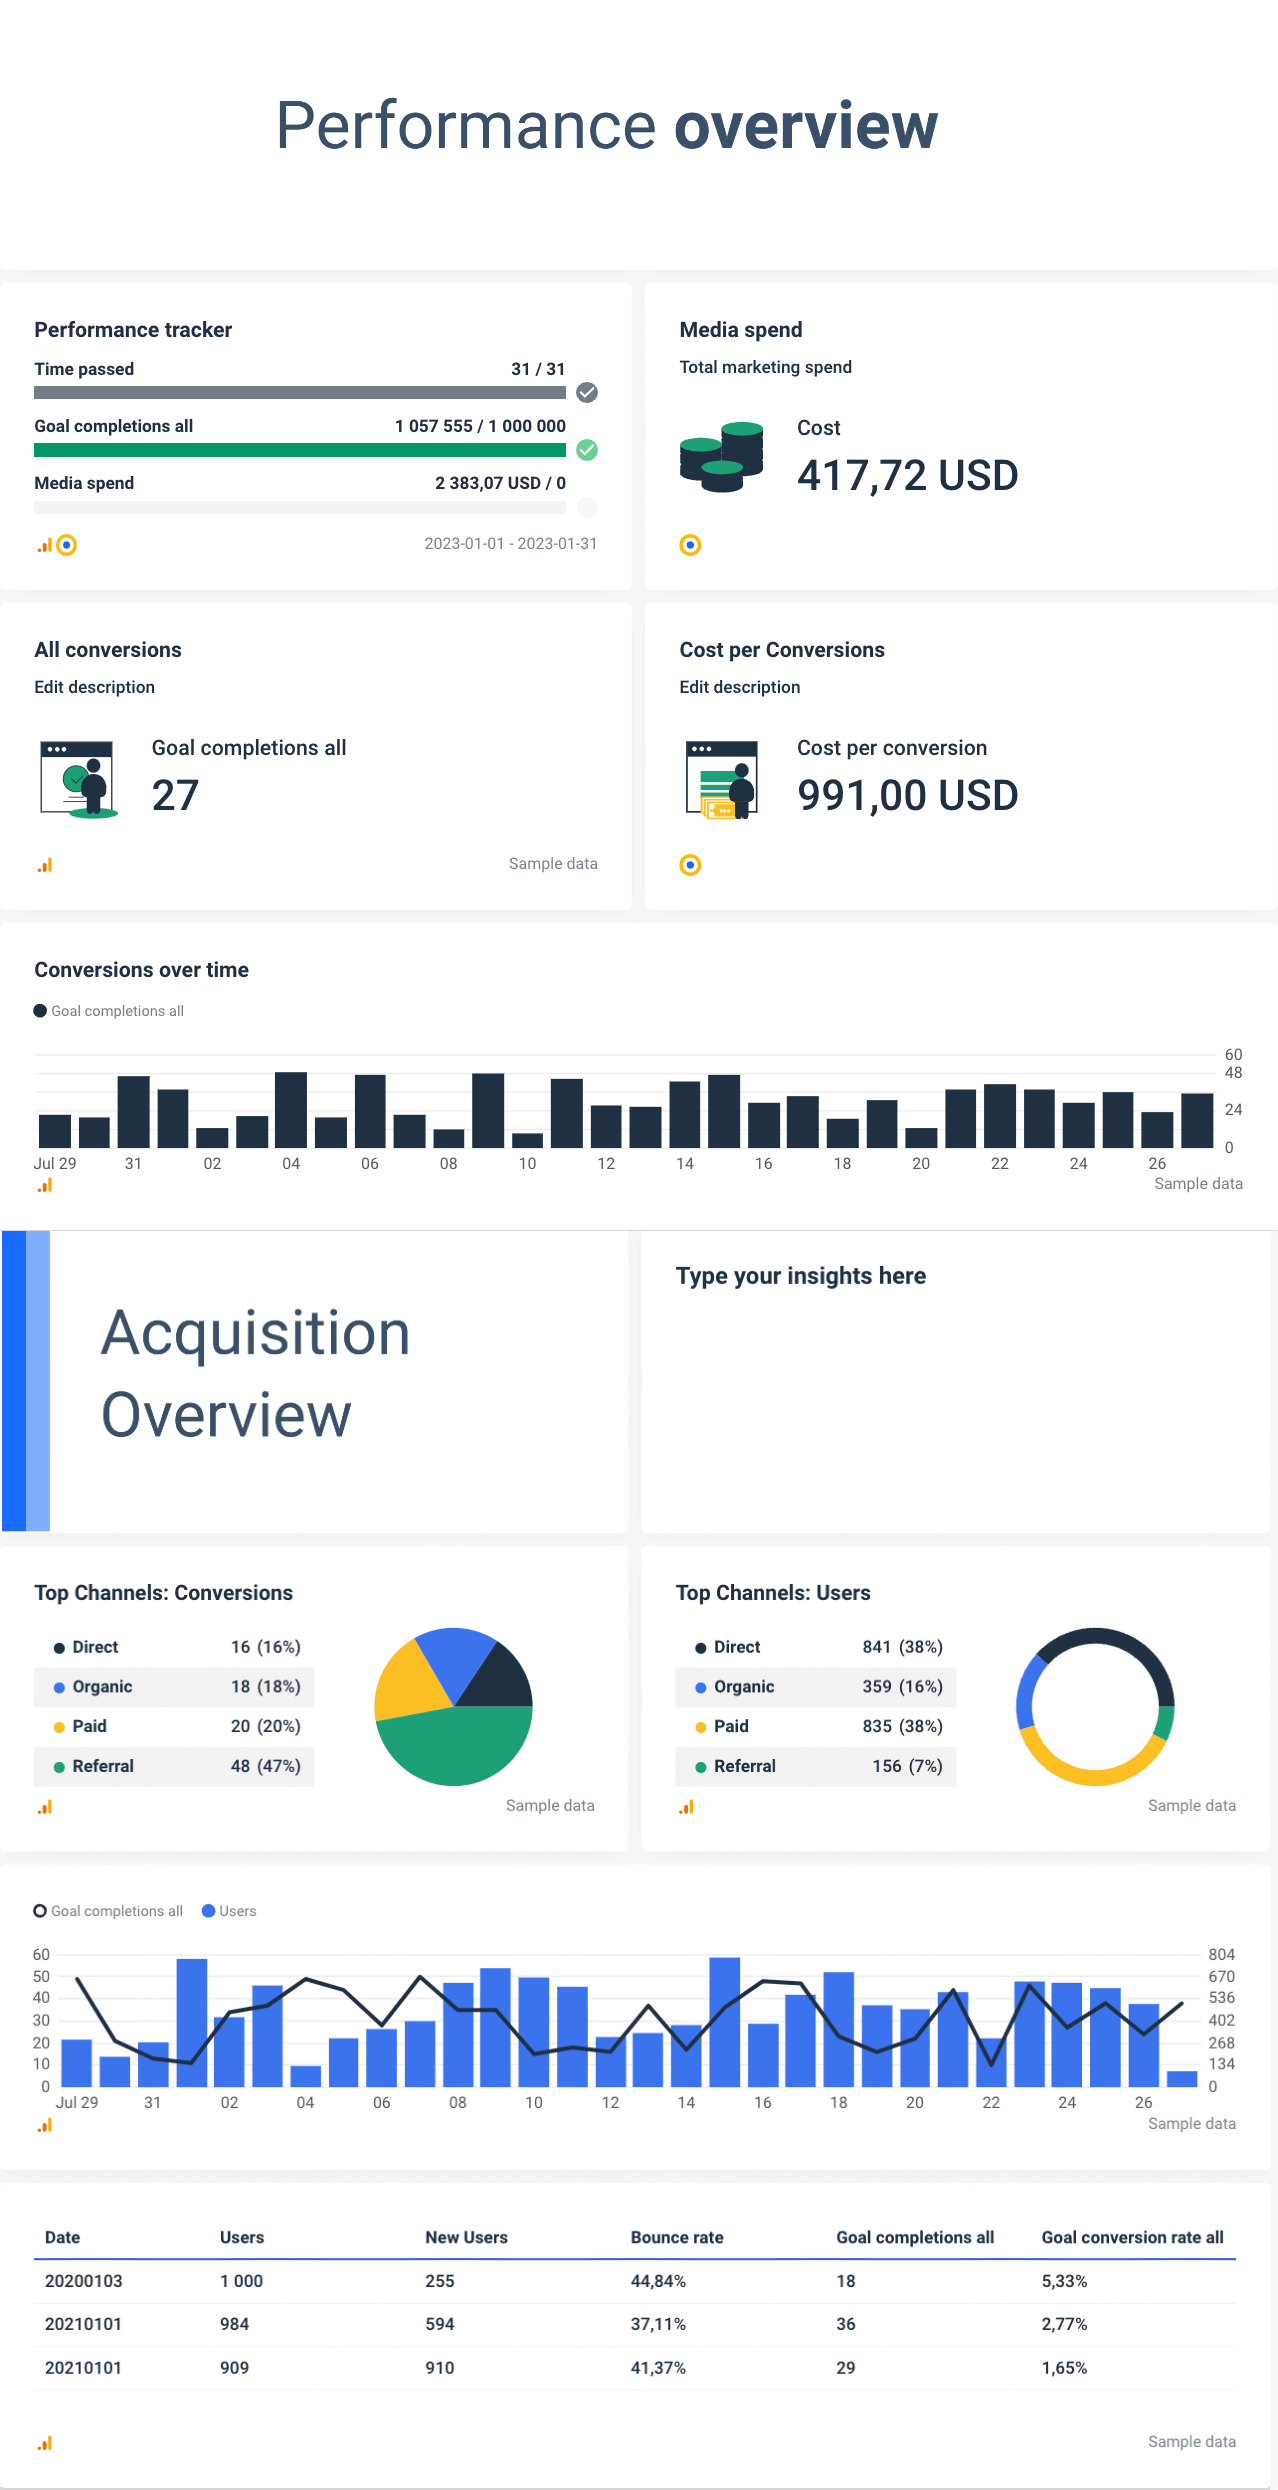
You can filter a digital marketing report to display your total budget spent on any given initiative.
Here, for example, what a report should look like:
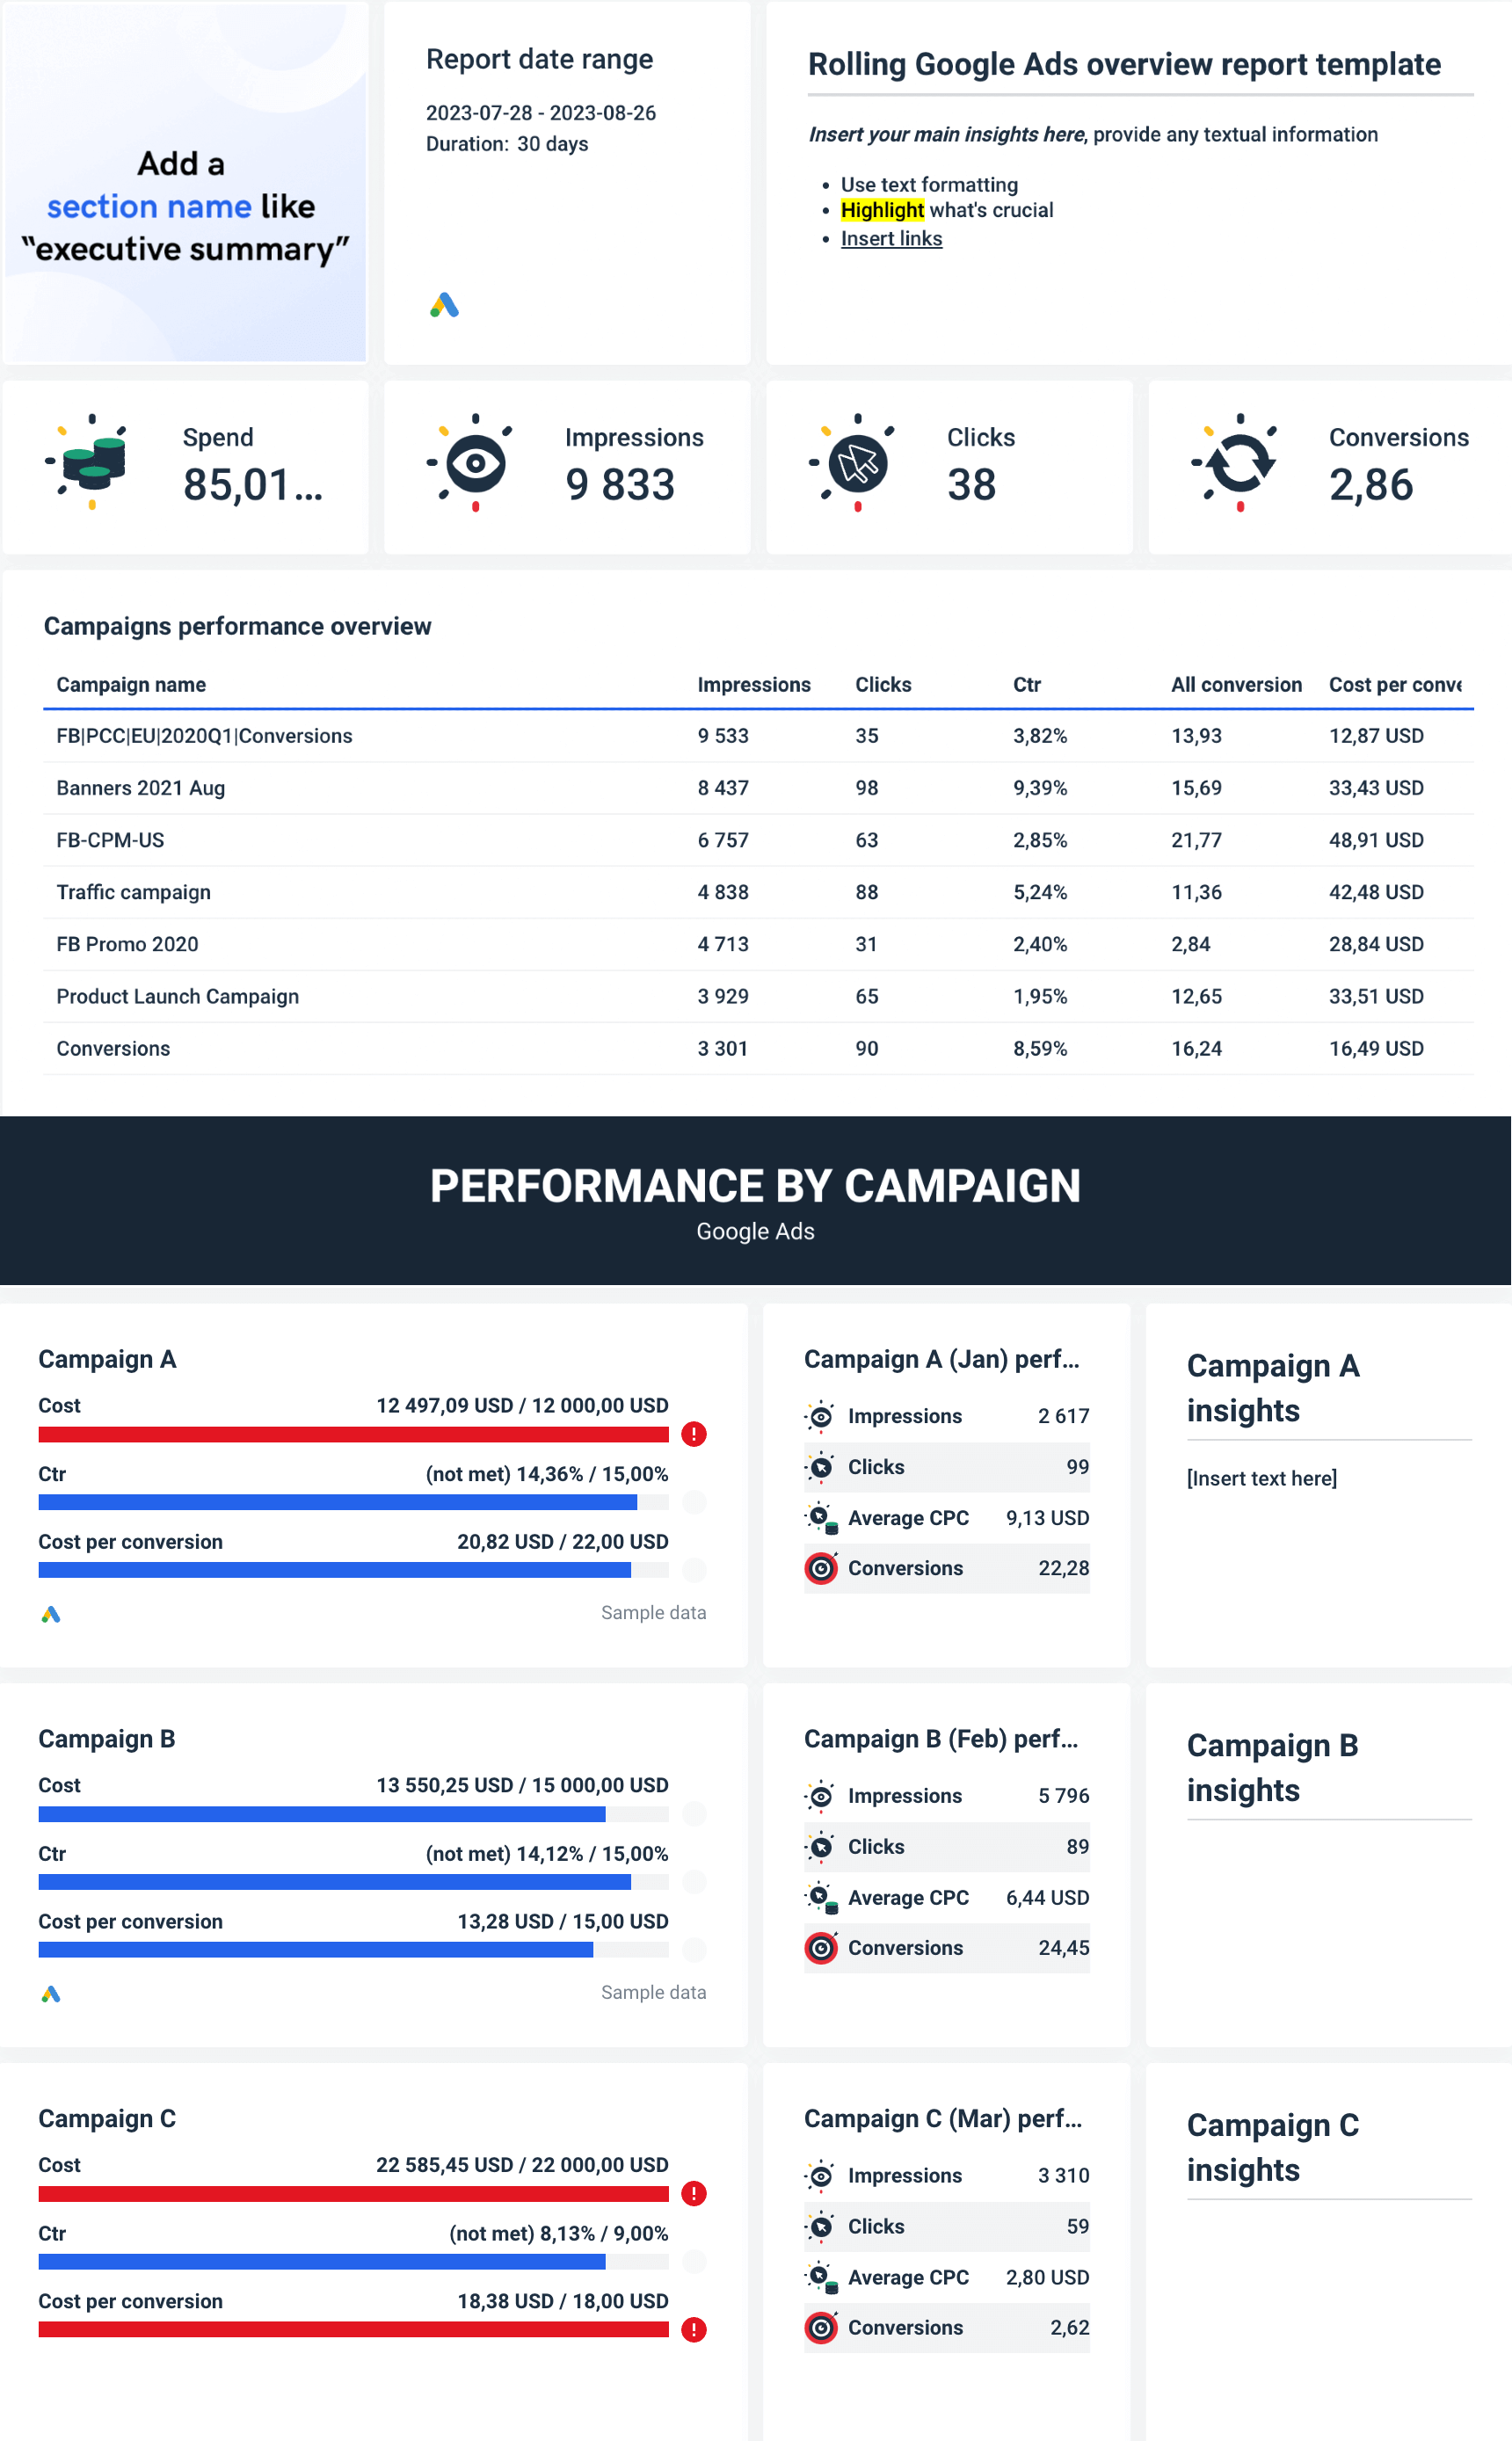
Key takeaways from Google Ads Campaign performance report example:
1. Shows the total ad cost during a specific period.
This data can help anticipate scope change, forecast resource usage, and prevent over- or underspending.
If the costs exceed expectations, you can adjust the ads or stop the whole ad campaign altogether.
Consistent forecasting helps marketing agencies ensure that the Google Ads campaigns use the appropriate amount of money — not too little or too much.
2. Highlights the transaction revenue.
Marketing agencies need to know how much money they spend on ads and how much revenue they generate from these transactions.
3. Provides historical ad cost data.
As you can see, the report has three widgets tracking three different campaigns from January to March.
This goal widget shows how much a business spends on ads and whether or not they meet their business goals.
Tracking and comparing month-to-month shows patterns and trends of your ad spend. This data is needed and valuable when setting future ad budgets and adjusting ad campaigns.
Even though we analyzed a specific case —- the Google Ads campaign — all the takeaways apply to any case.
Pro tip: Develop a digital marketing report to track all your spending. Ensure you have a goal widget in a report to see how your initiative performs financially. Include historical data and use it as a reference when building future strategies and experiments.
Provide a benchmark for future marketing campaigns
Digital marketing reports benefit marketing agencies because they include historical performance data.
By having historical data and examining key performance indicators (KPIs) over time, it is possible to identify benchmarks to:
- Set long-term marketing goals;
- Optimize your marketing strategy;
- Develop data-driven initiatives;
- Identify which initiatives need improvement;
- Measure progress;
- Identify gaps in the strategy.
To effectively benchmark your marketing initiatives, narrow down your experiments and initiatives.
You should analyze your blog, email, website analytics, and social media performance separately.
Then, choose the right marketing metrics and KPIs.
Your benchmarks need to be detailed and specific. Otherwise, they lose their value. Think about your goals and actions in the past. Then, identify the metrics that would best support your marketing activities.
Why create marketing reports in Whatagraph?
Many software solutions advertise as reporting tools. However, when choosing your reporting software, ensure it covers all the steps in reporting.
Here’s where Whatagraph beats the competition:
One platform
Whatagraph is an all-in-one marketing data platform that connects, visualizes, and shares marketing data. When you go with one platform, you can report cross-channel data instead of reporting on data from separate sources.
Also, an all-inclusive solution is always more stable and faster, as your reports don’t depend on other software.
Finally, Whatagraph boasts native integrations with popular marketing platforms, so there’s no risk of third-party connectors breaking off.
Linked report templates
Instead of changing reports individually, edit multiple reports simultaneously from one place. This feature is especially helpful for agencies and enterprises which can now save considerable time in making group changes.
One of these companies is Rekom Group, a global leader in the nightlife industry. When you operate 200+ venues in four countries and regularly create both high-level and granular reports, the bulk edit option can really save your day.
Report folders
The ability to organize your data and reports by client, region, account manager, etc., is another feature that means a lot to agencies that serve many clients.
Easy to use
In this day and age, a solution that isn’t user-friendly doesn’t stand much chance. Unfortunately, not all reporting tools are made the same, and you have to try Whatagraph to tell the difference.
Access our template gallery, report automation, and 45 integrations to pull data from.
Create beautiful reports your clients can actually engage with and save more time for creative tasks. Request a free trial of Whatagraph today!
Bottom line
Digital marketing reporting is an essential part of the marketing process, but it shouldn’t be something marketing agencies spend most of their time on.
When writing a marketing report, always keep your audience in mind and focus only on KPIs and metrics contributing to your marketing goals. Don’t forget to recommend the next steps to show that you really understand the impact of your marketing results.
Marketing reporting software can save a lot of time by eliminating manual work and second-guessing while helping users create professional reports that are easy to understand.
However, not all reporting platforms are made the same, so always pick an all-in-one solution that connects, visualizes, and shares data under “one roof”.
Published on Aug 03 2022
WRITTEN BY
Dominyka VaičiūnaitėDominyka is a copywriter at Whatagraph with a background in product marketing and customer success. Her degree in Mass Communications/Media Studies helps her to use simple words to explain complex ideas. In addition to adding value to our landing pages, you can find her name behind numerous product releases, in-app notifications, and guides in our help center.