7 Marketing Report Examples (+ Templates, KPIs, & Best Practices)
I’ve worked as a LinkedIn Brand Manager, Digital Communications Manager, and Marketing Executive—and I know one thing: most marketing reports are…not that great.
They’re failed attempts built to justify marketing's existence, not drive real results.
Here are 7 marketing report examples with the exact metrics, structures, and expert techniques that prove your marketing isn't just activity—it's revenue.

Mar 29 2025●10 min read


- 7 Digital Marketing Report Examples To Steal (+ Templates for Inspiration)
- 1. Cross-channel marketing analytics report
- 2. SEO performance report
- 3. Pay-per-click (PPC) report
- 4. Organic social media marketing report
- 5. Email marketing report
- 6. Google Analytics (GA4) report
- 7. Shopify report
- Make marketing reports that actually get read
Most marketing reports are built for marketers, not clients or leadership.
They’re packed with metrics, charts, and acronyms that only make sense to marketers, but don’t tell a clear story.
And when your clients or higher-ups can’t make sense of what they’re looking at? They get bored, and they tune out.
That’s a huge problem. Because if your reports don’t show the value you’re driving, it’s like that value doesn’t exist. And if you’re an agency, it puts your client relationships—and revenue—at risk.
In this article, I’ll show you 7 best marketing report examples that agencies are using to:
- Prove results clearly and visually
- Get clients to actually read the reports
- Reduce churn by making your wins impossible to ignore
For each report example, I’ll also share best practices collected from marketing experts and agency leaders.
Let’s dig in.
7 Digital Marketing Report Examples To Steal (+ Templates for Inspiration)
Here's a list of all the marketing report examples I'll share today:
- Cross-channel marketing analytics report
- SEO performance report
- Pay-per-click (PPC) report
- Organic social media marketing report
- Email marketing report
- Google Analytics (GA4) report
- Shopify report
For each marketing report sample, we’ll cover four key questions:
- What is it best used for?
- What key performance indicators should you include?
- How do you structure it?
- What best practices should you follow for a report that gets read?
BTW, if you’re a Whatagraph customer, you can build your first report in 30 minutes using one of our ready-made report templates.
1. Cross-channel marketing analytics report
A cross-channel analytics report aggregates data from multiple channels—such as PPC, social media, SEO, and email—to show a 360-view of marketing performance.
Best for: A comprehensive snapshot of overall marketing effectiveness and budget allocation.
Key metrics to include:
- Customer acquisition cost (CAC): Shows how efficiently you’re acquiring new customers.
- Lifetime value (LTV): Helps determine the long-term profitability of customer acquisition strategies.
- Cost per click (CPC): Essential for evaluating advertising cost-effectiveness.
- Cost per acquisition (CPA): Priority metric to ensure sustainable growth by balancing costs and volume.
- Conversion rates: Indicates the effectiveness of your marketing efforts across all platforms.
On choosing KPIs that actually matter, Chris Coussons, Founder at Visionary Marketing says that, “A report is only useful if it answers the question: is this marketing actually working?”
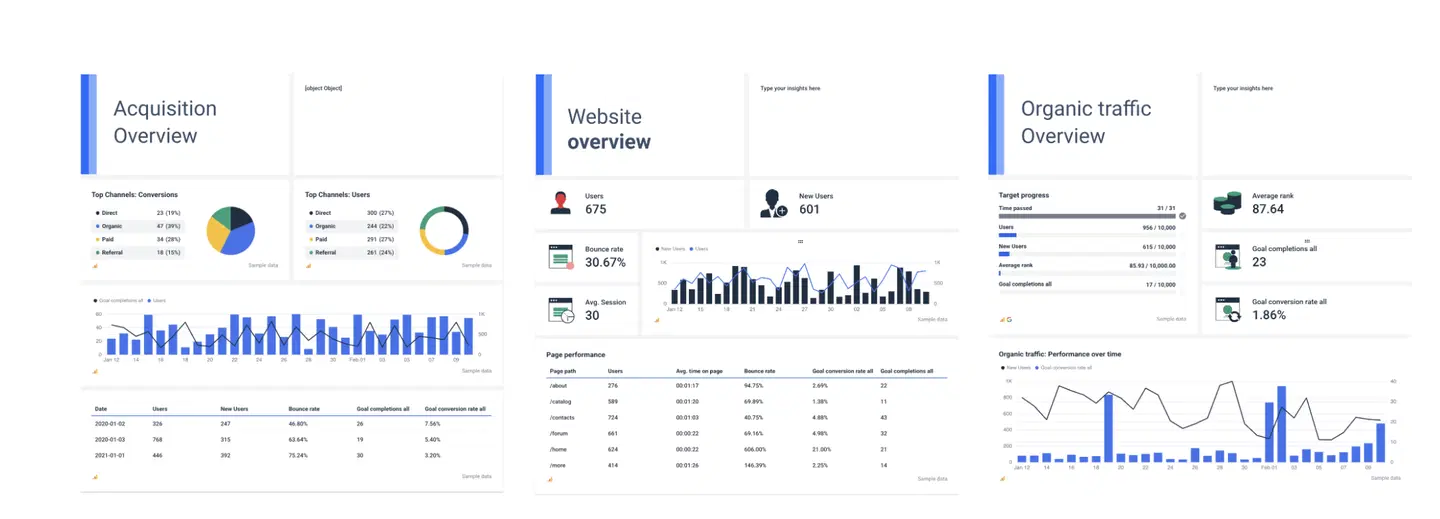
How to structure it:
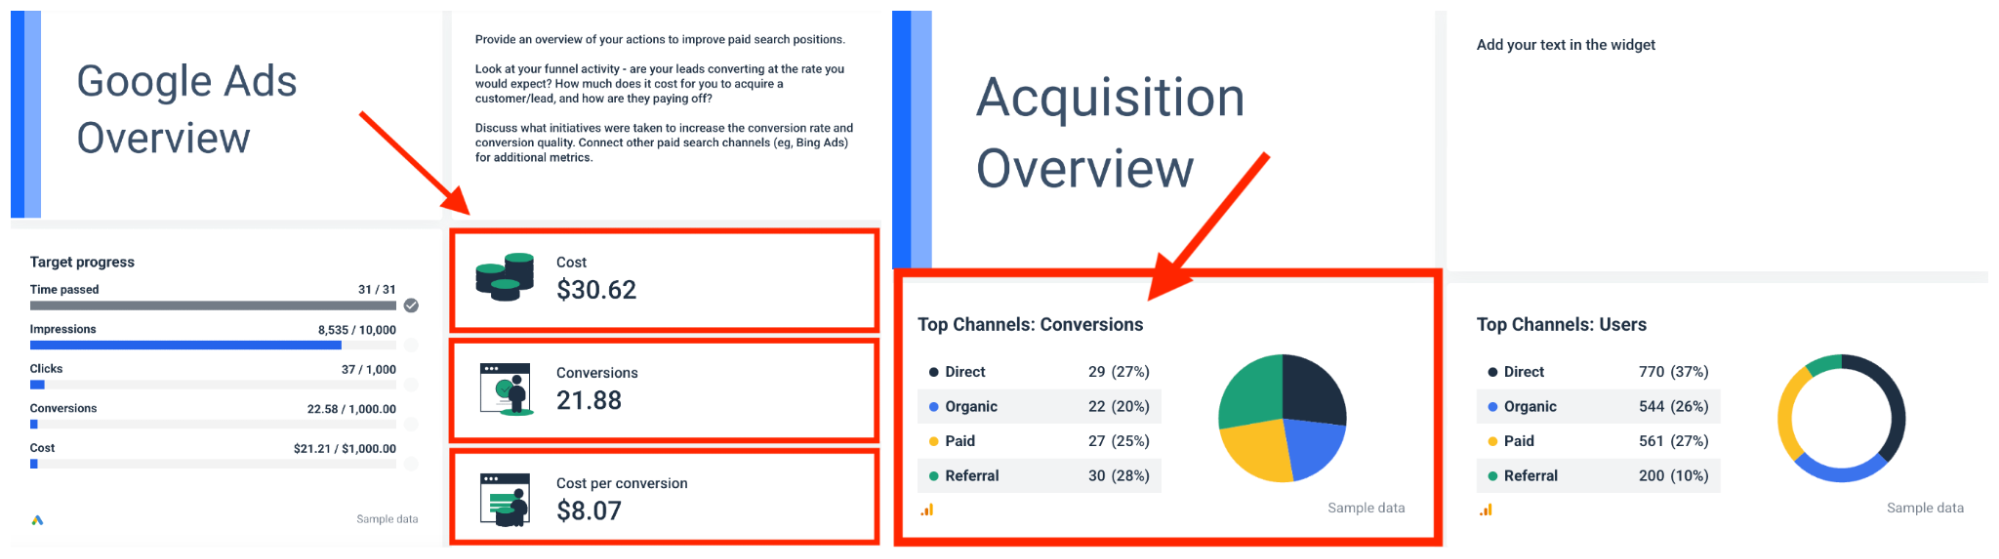
- Performance overview: Show total conversions, media spend, and cost per conversion. Quickly see what’s working or not month-to-month.
- Acquisition overview: Identify which channels bring the most visitors. Highlight new vs. returning users, bounce rates, and conversion success.
- Website overview: Provide a snapshot of user activity—visits, bounce rate, and how long users stay—to spot engagement issues.
- Audience overview: Clearly show who your visitors are, their interests, devices used, and demographics. Use these insights to sharpen targeting.
- PPC channels overview: Pull together key ad metrics like impressions, clicks, conversions, and spend. Spot trends and manage budgets more effectively.
- Organic overview: Track how well your website ranks organically. Include average search positions and traffic patterns to guide your SEO improvements.
- Recommendations: Clearly summarize actionable steps based on your insights, focusing on optimizing spend, improving channel effectiveness, and boosting ROI.

✨Get inspired by our Cross-Channel Marketing Analytics Report Template here. ✨
Alternatively, you can now build and style your own report in seconds using Whatagraph IQ. No need to hunt around for report templates or drag-and-drop anything anymore.
Here’s how it works:
- Create full reports with a single prompt. Just tell IQ what kind of report you want and it’ll build it for you—complete with the exact widgets, charts, and tables you want.
- Add and edit on the fly. Need to edit widgets or create another tab? Simply type it in, and IQ updates your report in seconds.
- Brand reports automatically. To style your reports, all you need to do is upload a screenshot of your brandbook or type in a prompt. We’ll automatically detect the fonts and colors and apply them to your reports.
You can still manually fine-tune them, and when you’re satisfied, save them as “Global themes” and re-use them across all your reports.
- Get actionable insights right away. Tired of manually writing out performance summaries in reports?Just ask IQ to write it for you in 18 different languages and four formats.
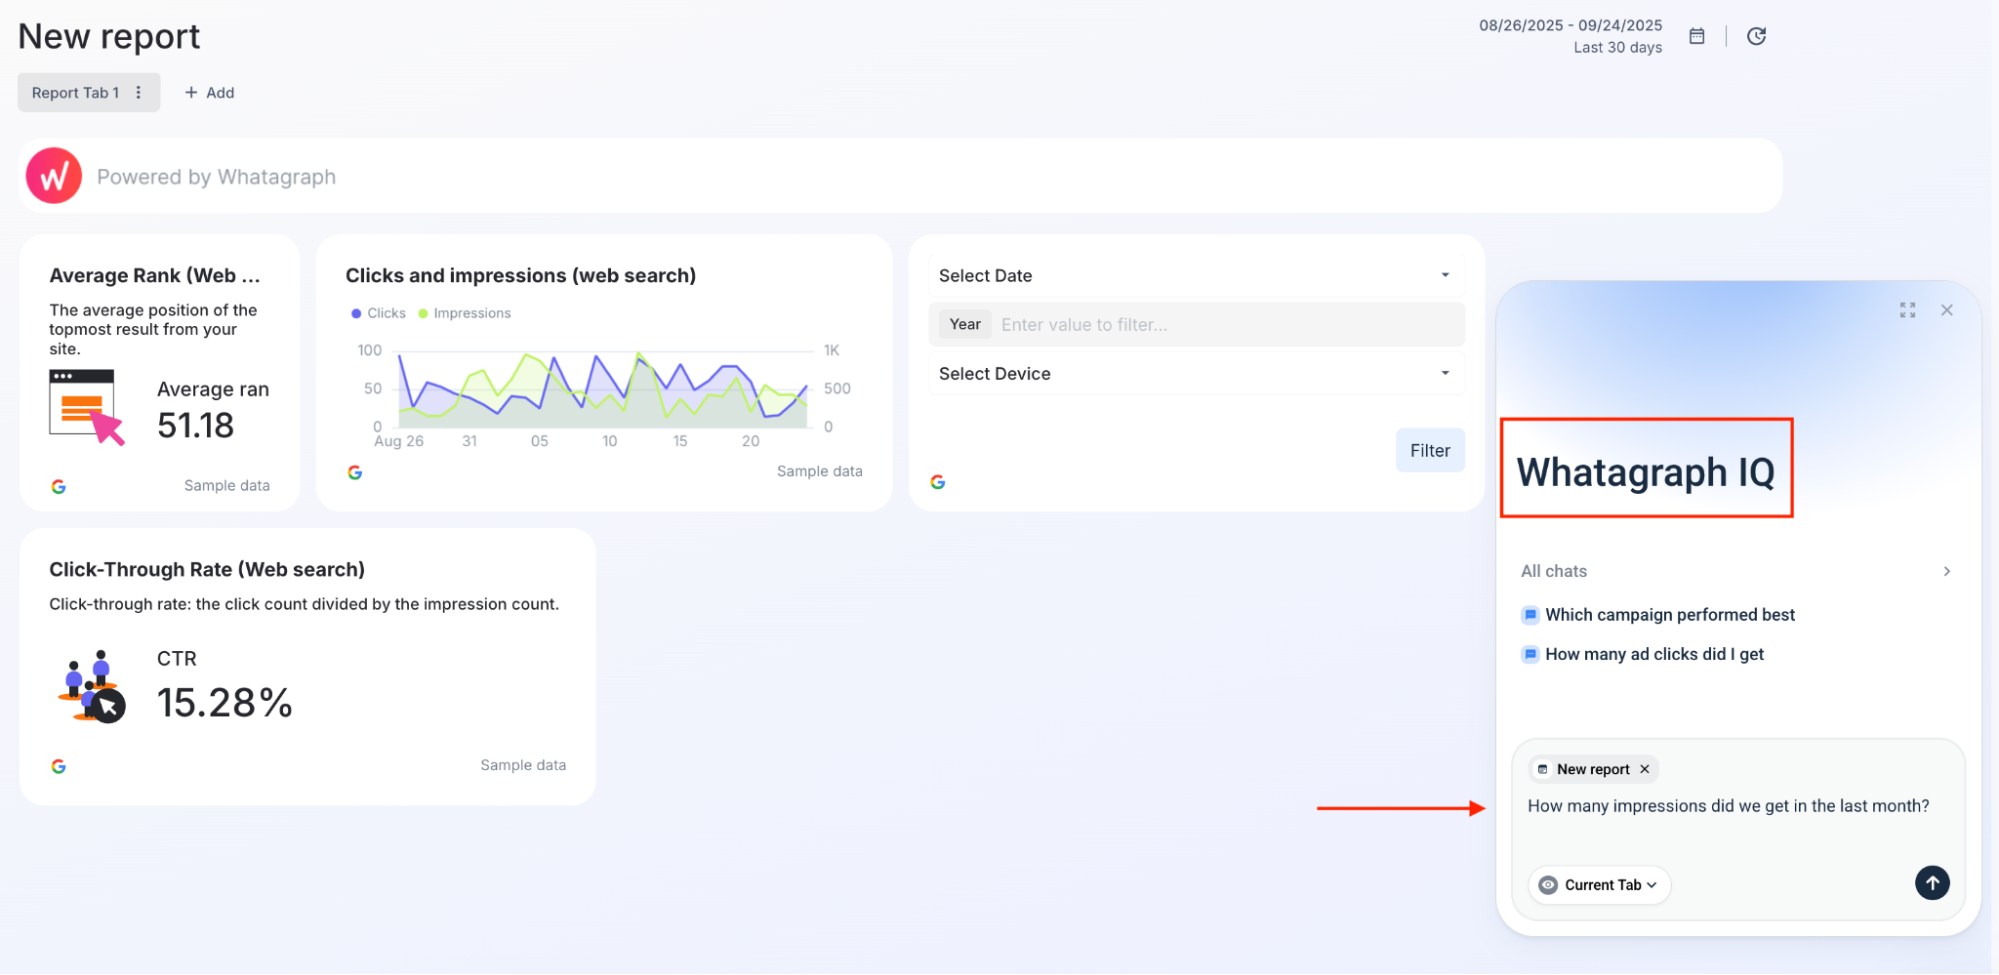
Need to answer your client’s or your manager’s questions ASAP? Just ask IQ and it’ll give you succinct, accurate answers in seconds.
Early adopters like Maatwerk Online agency are already saving 100 hours a month on reporting. Here’s what Laars Maat, Co-Founder, says:
Whatagraph’s AI saves time and energy for our marketing specialists. And the hours we’re saving is just pure profit. We now have the time to focus on more strategic things that help both our agency and our clients grow.
Start free with Whatagraph today.
Best practices for building a cross-channel marketing report
How do real industry leaders tackle cross-channel reporting?
1. Focus on the “who” behind your data. Janet Mesh, CEO and Co-Founder at Aimtal, emphasizes focusing your report on real people:
We focus on the who in our reports and ask the question: ‘Who cares?’ Show the companies, job titles, and people who are actually engaging with marketing and sales and have the most qualification to move through the marketing to sales funnel.
2. Tell a clear, true story. Don't overwhelm readers with endless charts and graphs. Mesh explains this clearly:
One of the biggest mistakes that marketers make when creating reports is just adding screenshots of performance charts without any context or analysis.
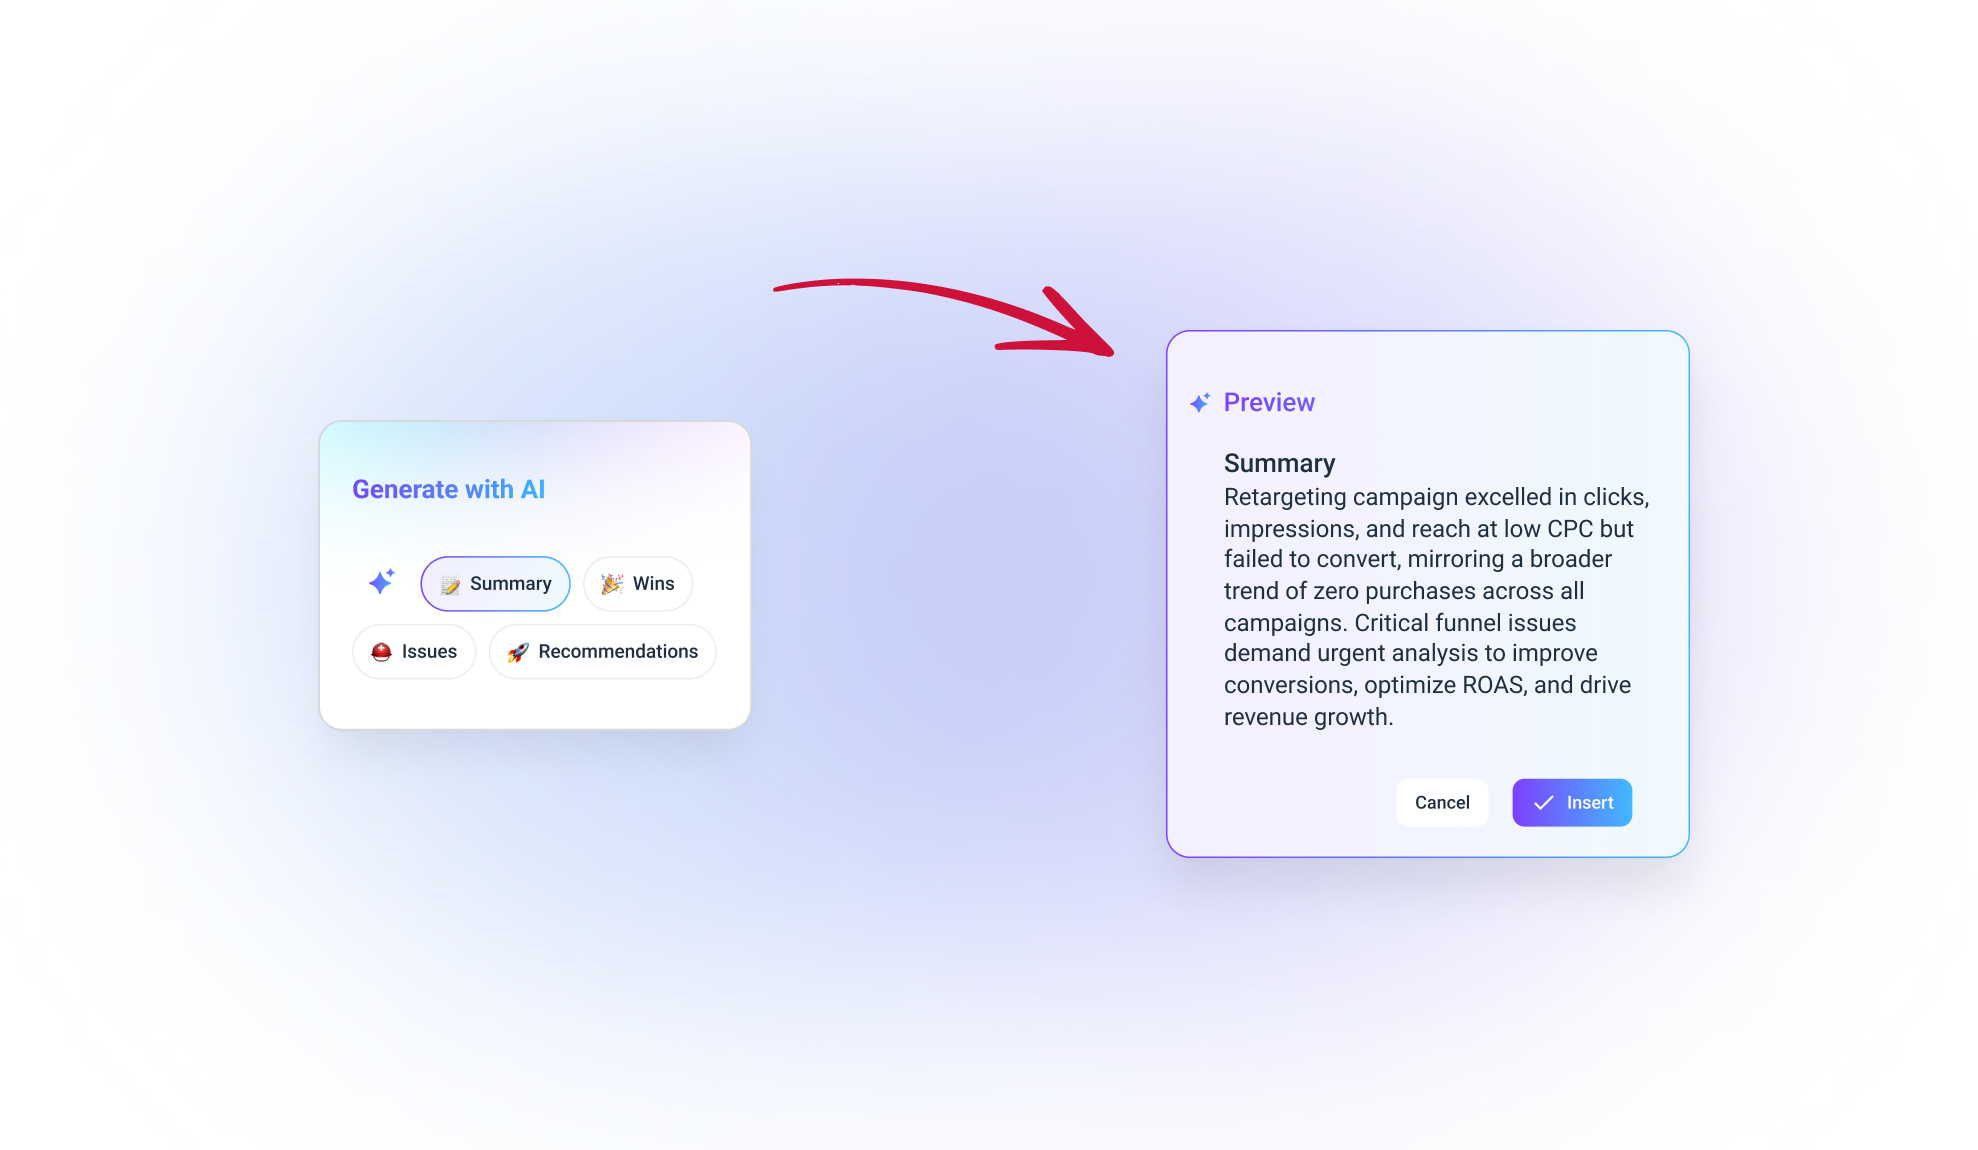
Skip the painful process of manually explaining every metric. On Whatagraph, you can just add a “text” widget to your report and ask AI to write performance summaries for you in seconds. You can customize exactly what you want to highlight on your report, like:
- Summary
- Wins
- Recommendations
- Issues
You can also toggle between long and short formats depending on who's reading. Busy executives get the quick version. Detail-oriented marketing managers get the full analysis:
Also, Whatagraph's AI chatbot turns data questions into instant answers. Ask "Why did our Facebook numbers tank?" or "Where should we spend more?" and get immediate answers—like having a data intern on standby 24/7.
3. Turn data into clear actions. Ryan Anderson, President at Markiserv, recommends structuring reports around three simple steps: Data → Insights → Actions. Clearly state what the numbers mean and exactly what you should do next.
For example:
- Data: Facebook ads drove the most conversions.
- Insight: Facebook ads resonate best with our target audience.
- Action: Increase budget for Facebook ads by 25% next month.
4. Make it visual and simple. According to Anderson, visuals are key:
Visuals! We are marketers, that is what we do best! Make it appealing, and simplify it for your audience. Simple as that.
Luckily, this is where Whatagraph sparkles.
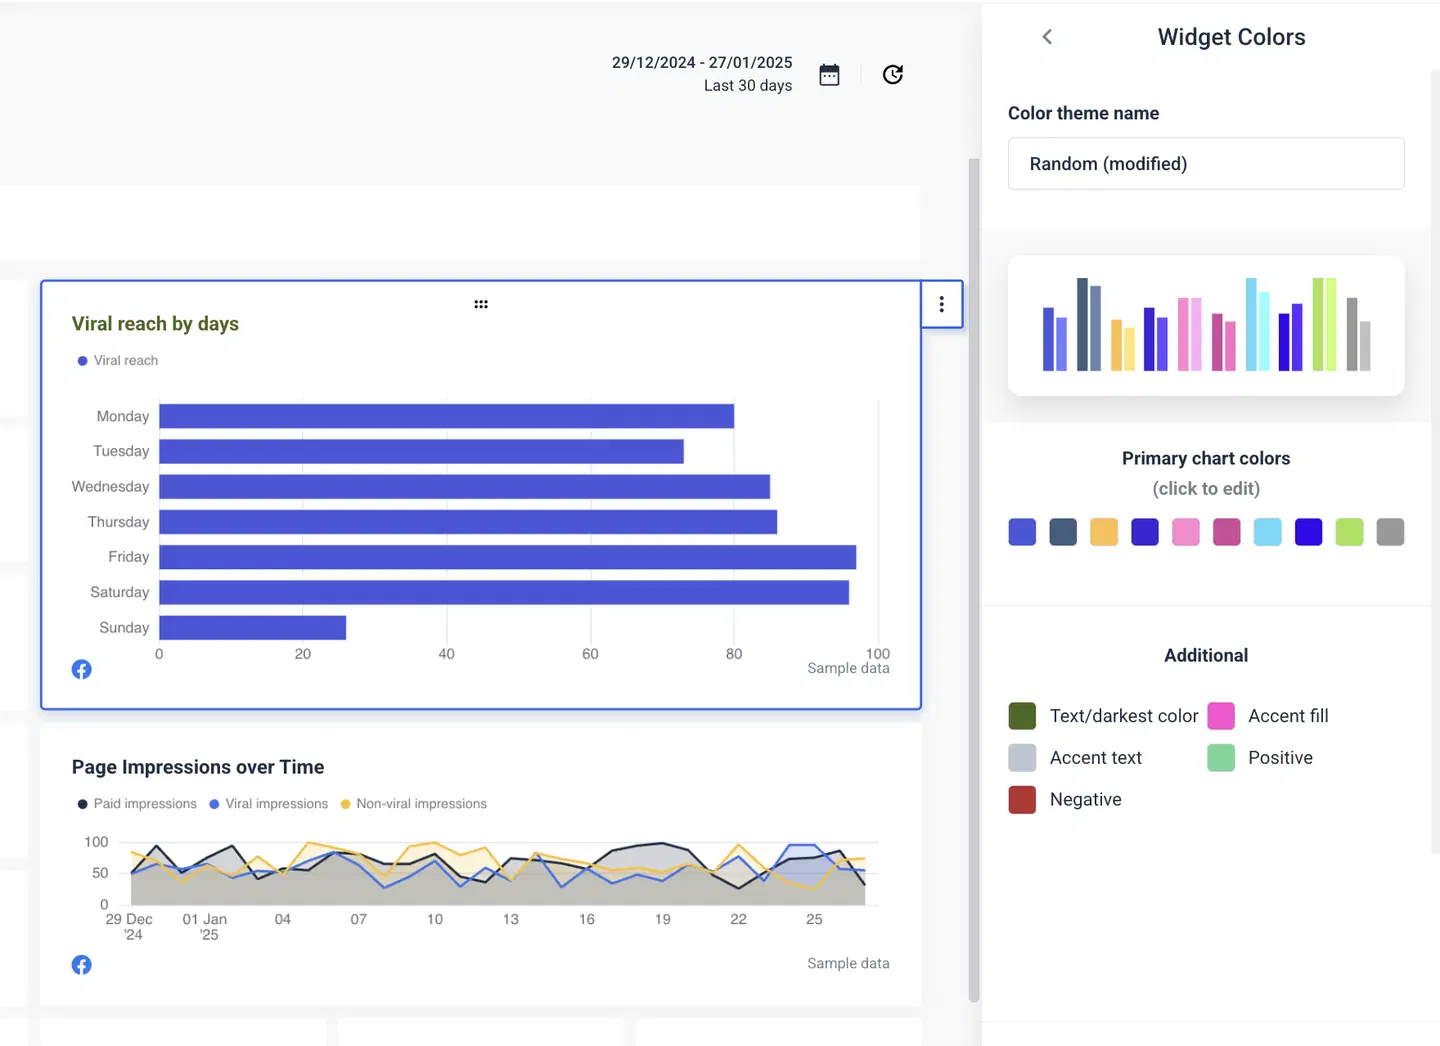
Whatagraph makes creating visual reports easy—and they look stunning, too. You can customize every visual, from graphs and charts to color schemes, perfectly matching your agency’s or client’s brand identity.
Quickly pick brand colors for every visual element. Save your favorite color schemes to reuse them instantly, making your reports consistently polished.
Add your client’s logo or your agency’s branding to every report. Completely remove any mention of Whatagraph—keeping your reports truly white-label.
Swap out generic icons for custom ones. Want to make your engagement metric stand out with a playful emoji or branded graphic? It’s just a click away!
![]()
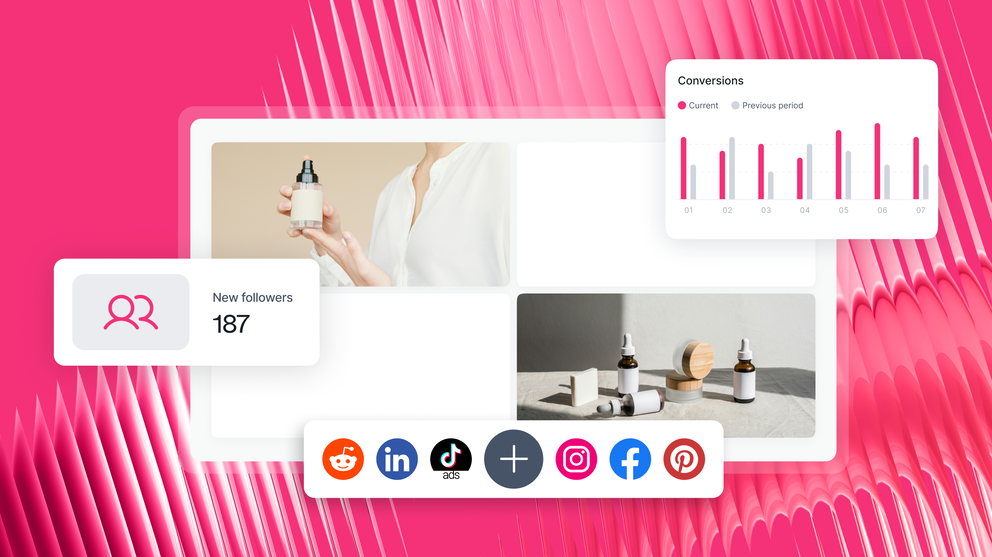
Another way to make your cross-channel reports pop visually is by showing your best-performing social media posts directly within the report using Whatagraph’s media widget.
Just choose between the compact or expanded view, drag-and-drop it onto your report, and select exactly which metrics—like engagement rate, impressions, or clicks—you want to highlight. Within seconds, your client sees their top Instagram or Facebook post clearly displayed alongside meaningful results.
No complicated setups or workarounds—just quick, attractive visuals that highlight your wins.
5. Automate your reports. Go to “Actions,” click on “Automate report” and select the day, time, frequency, and whether or not you’d like to receive an update when the report is delivered.
That’s all it takes—literally 10 seconds. You’re free to go for your Friday evening beers instead of sending yet another “Monthly Report Attached” email.
Beyond automated emails, Whatagraph lets you distribute reports via always-updated live links, static PDFs for meetings, or Excel exports for the raw data and tables. Choose the right marketing report format for each client's preferences and workflow.
2. SEO performance report
An SEO performance report tracks your content marketing effectiveness and website’s visibility on search engines, providing actionable insights into organic traffic growth, keyword rankings, and overall SEO health. This is especially important in SaaS marketing, where organic growth and keyword rankings often determine long-term customer acquisition success.
Best for: Assessing how well your SEO strategy attracts organic traffic and converts that traffic into measurable business outcomes.
I asked Ben Goodey, Founder of a successful SEO agency, Spicy Margarita, and he begins by saying:
“I hate reporting.”
I mean, he does have a good reason…
The most painful thing is making them—it takes SO long. I wish you could just drag, drop, and ask AI to make reports with integrations into everything.
Ding, ding, ding! I hear Whatagraph calling!
Whatagraph is refreshingly simple to use. Any team member, from account manager to intern, can log in and effortlessly build beautiful SEO reports right away:
- Start fresh with a blank page and simply drag-and-drop metrics.
- Let the Smart Builder instantly assemble dashboards for platforms like Google Ads and Facebook Ads.
- OR use our ready-to-go SEO Report Template and customize as needed!
Key metrics to include:
Ben includes leading indicators in their own reports to prove ROI to their clients, focusing on the most important metrics:
We prove ROI by measuring the actual hand raisers. People booking sales meetings and demo requests. Then downstream, how many convert to paying customers? That’s the main thing.
- Organic sessions: Track how many visitors find your site through search engines.
- Organic conversions: Measure meaningful actions, like demo requests, bookings, or sales, that directly reflect your SEO’s effectiveness.
- Organic landing pages: Identify pages driving the most organic traffic and conversions.
- Keyword rankings: Monitor keyword positions to see how visibility changes over time.
- Demo requests and sales meetings: Direct indicators of high-intent leads generated from organic efforts.
- Customer conversion rate: Track the percentage of organic leads who convert into paying customers.
 How to structure it:
Ben says that most marketing reports suck because:
They don't tell you what you need to know easily. Or without 10 integrations. Or a business intelligence person laboring away on it.
Whatagraph’s SEO Report Template comes with the first five sections pre-loaded, important SEO integrations like SE Ranker, Ahrefs, Google Analytics, etc., and an AI summarizer for when you need quick, ready-to-insert insights.
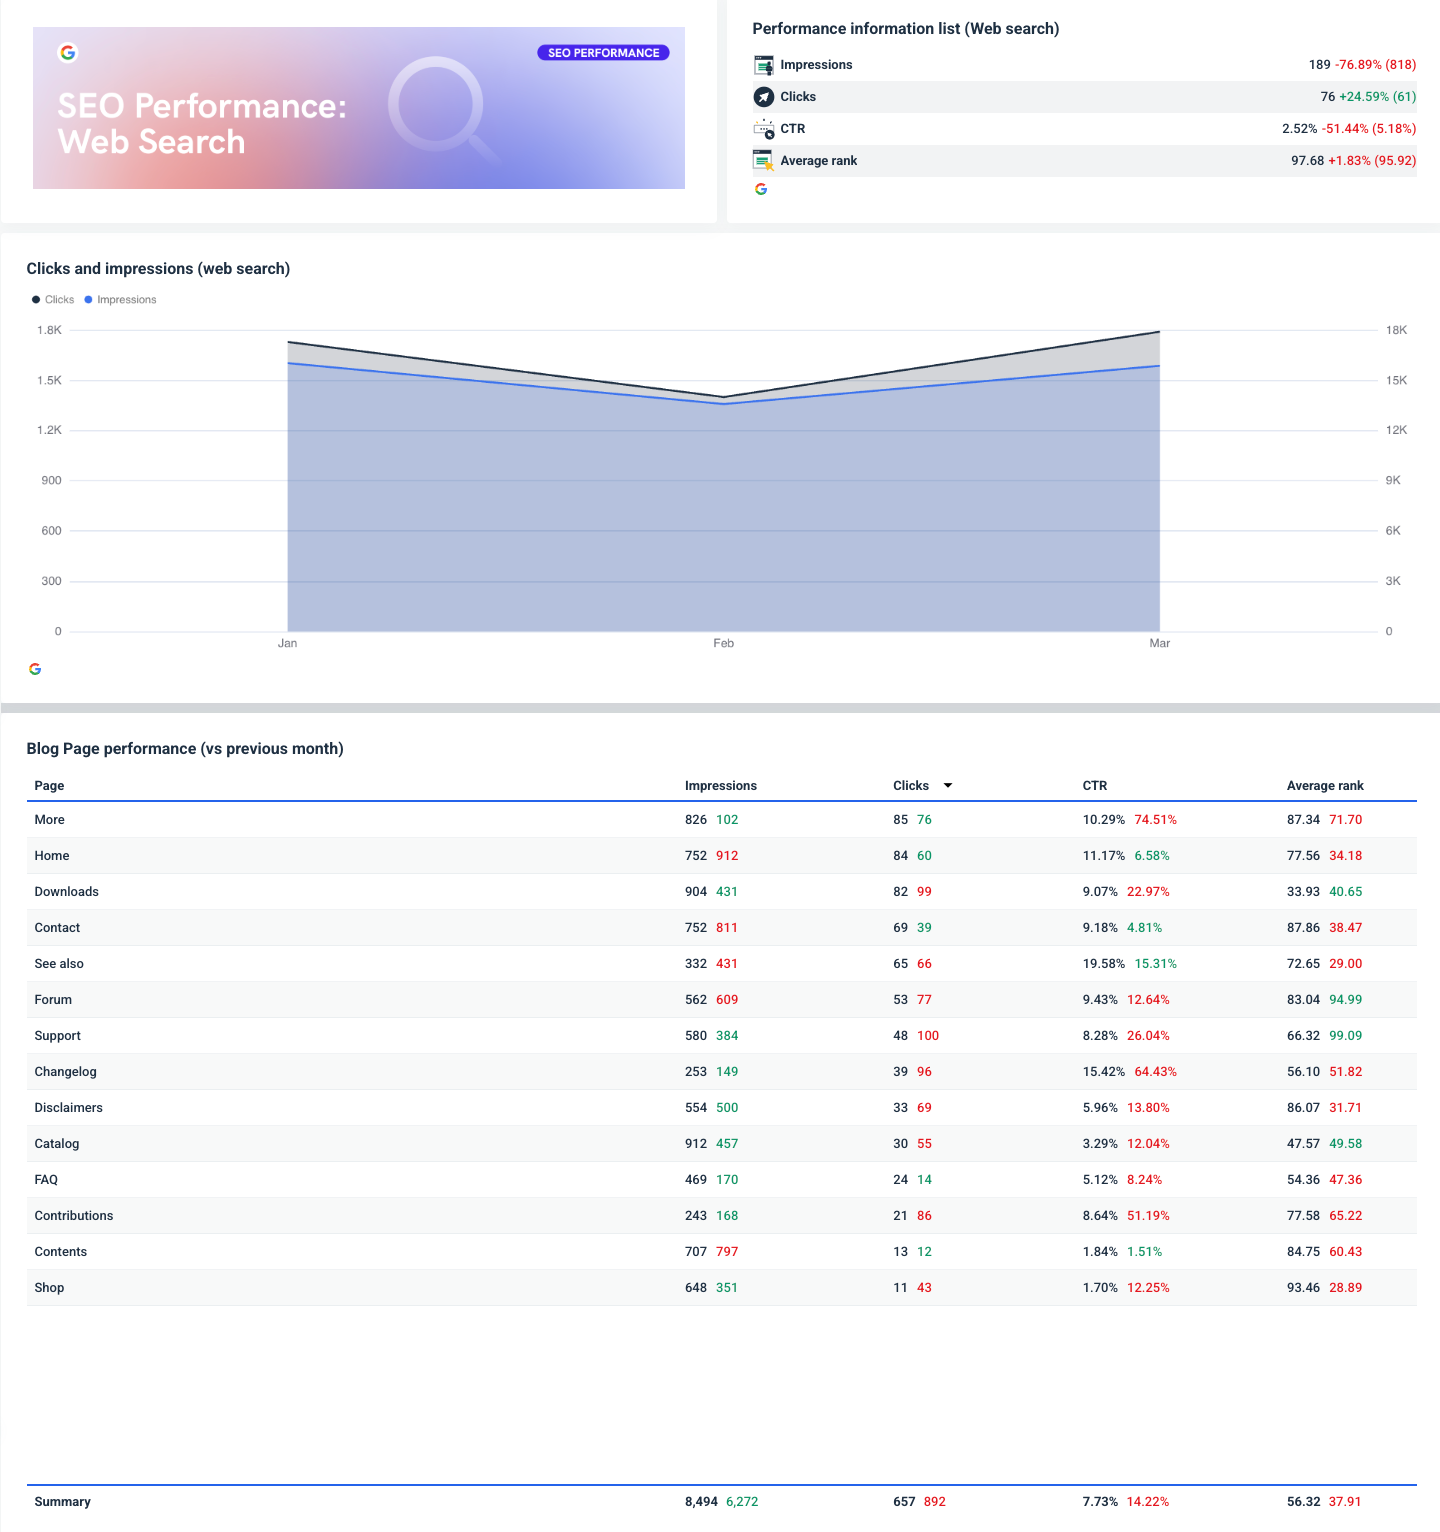
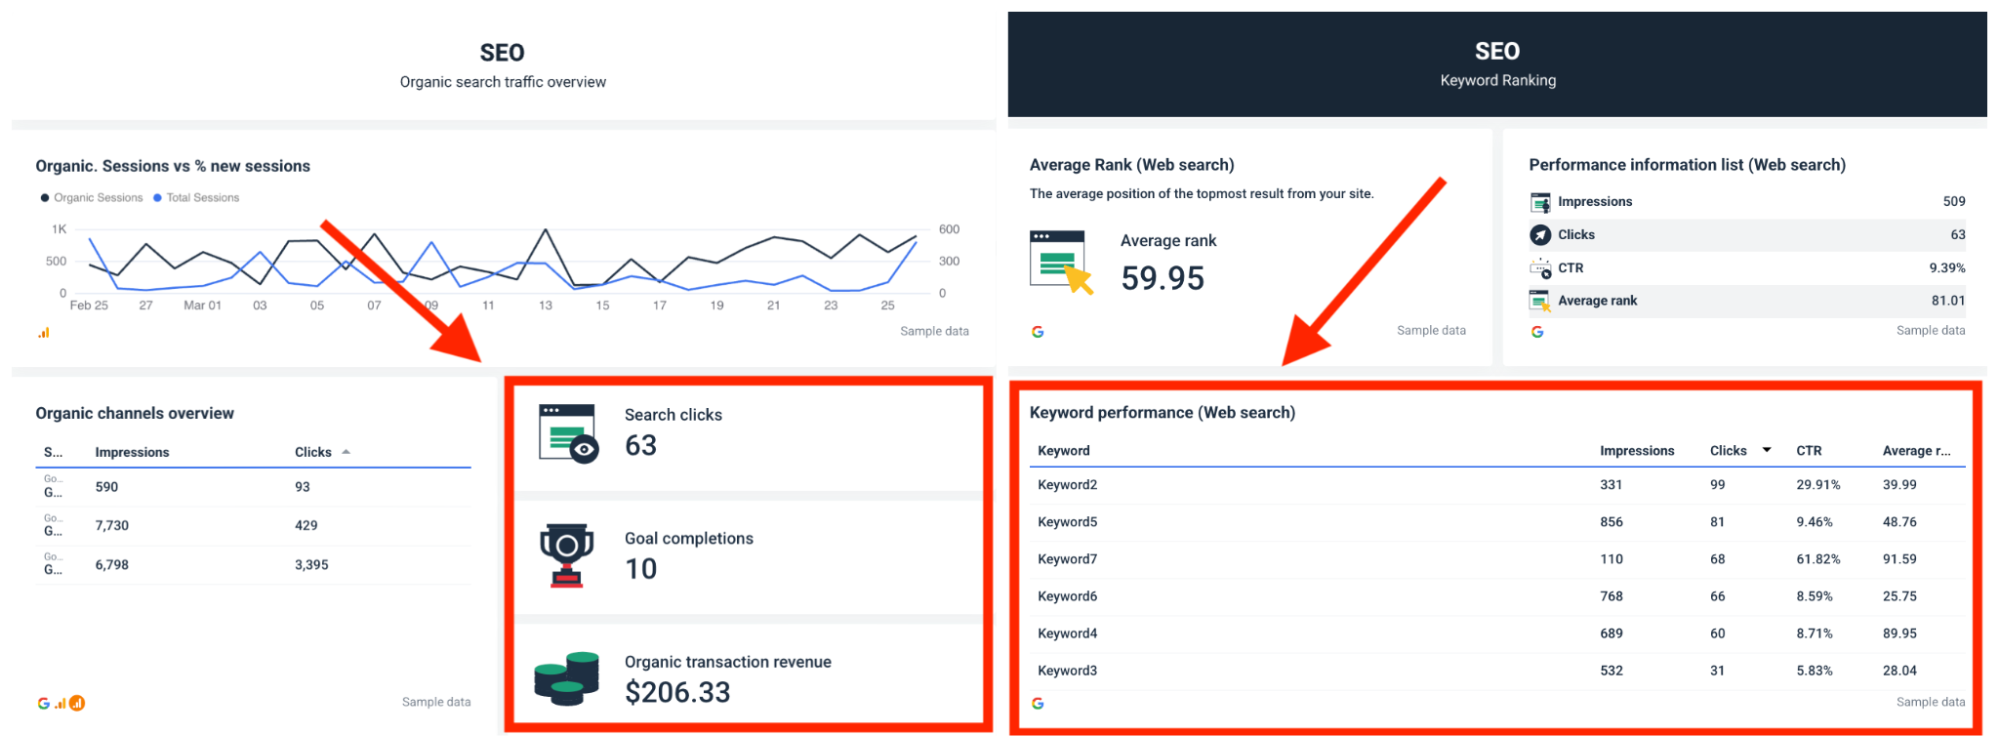
- SEO overview: Summarize overall performance clearly: total organic sessions, new users, and goal completions for quick insights into growth and effectiveness.
- Organic traffic analysis: Detail sessions over time, highlighting significant changes or trends. Identify top-performing organic landing pages to see which content drives the most traffic and conversions.
- Keyword performance: List top-ranking keywords along with their impressions, clicks, CTR (click-through rate), and average rank.
- Backlink analysis: Include a summary of total backlinks, number of referral domains, and domain authority.
- Conversions and revenue: Show how organic traffic translates into business outcomes like goal completions and transaction revenue. Directly connect SEO performance to revenue to demonstrate clear ROI.
- Actionable recommendations: Provide specific, prioritized recommendations based on data, such as optimizing underperforming keywords, improving content on high-traffic pages, or pursuing strategic backlink opportunities.
Best practices for building an SEO performance report
Ben Goodey was kind enough to share a whole lot of goodies for meaningful SEO reporting that actually gets read.
1. Align on goals first. The first real reporting stage is to establish common goals with those you’re reporting to. Ben recommends asking yourself three questions:
- What metrics actually matter?
- What metrics come before those metrics (aka leading metrics)?
- What else would be interesting for them to see?
2. Use a phased reporting approach. This is my favorite nugget from Ben because he says you need to recognize the difference between short-term and long-term SEO objectives. In the early stages, Ben advises highlighting milestones like:
"New content produced or new keyword rankings—to clearly demonstrate early momentum."
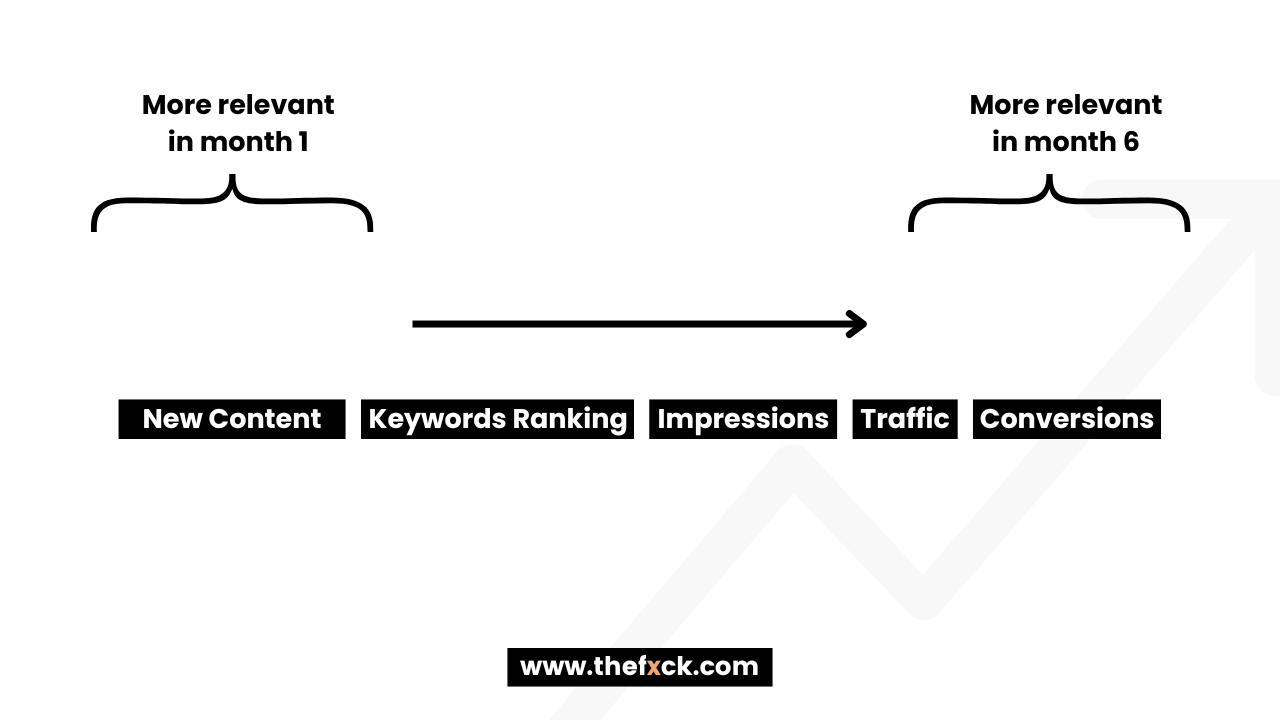 Image: How The F*ck
3. Always answer "so what?"
This is good practice for ALL reports, really, but since SEO is a long game, and clients can be quite reticent to invest in these marketing efforts, this piece of advice I think, is particularly fitting in this section.
For every data point, clearly articulate:
- Why is this relevant?
- What have we learned?
- Should anything change based on this?
- Is this good, bad, or average performance?
Clients value insights, not just numbers. Your reporting should drive strategic conversations, not just check a box.
3. Pay-per-click (PPC) report
A pay-per-click (PPC) report tracks your paid advertising performance across platforms like Google Ads, Facebook Ads, or LinkedIn Ads, showing how effectively your ads drive leads and revenue.
Best for: Understanding the return on your paid advertising investment, budget optimization, and making strategic decisions for PPC campaigns.
Key metrics to include:
- Impressions: Indicates how often your ads were shown.
- Clicks: Shows how many people clicked on your ads.
- Conversions: Tracks valuable actions resulting from ads, such as sales or sign-ups.
- Cost per click (CPC): Reveals how efficiently your budget generates clicks.
- Cost per acquisition (CPA): Measures how cost-effectively your ads generate conversions.
- Return on ad spend (ROAS): Directly links your ad spend to generated revenue.
How to structure it:
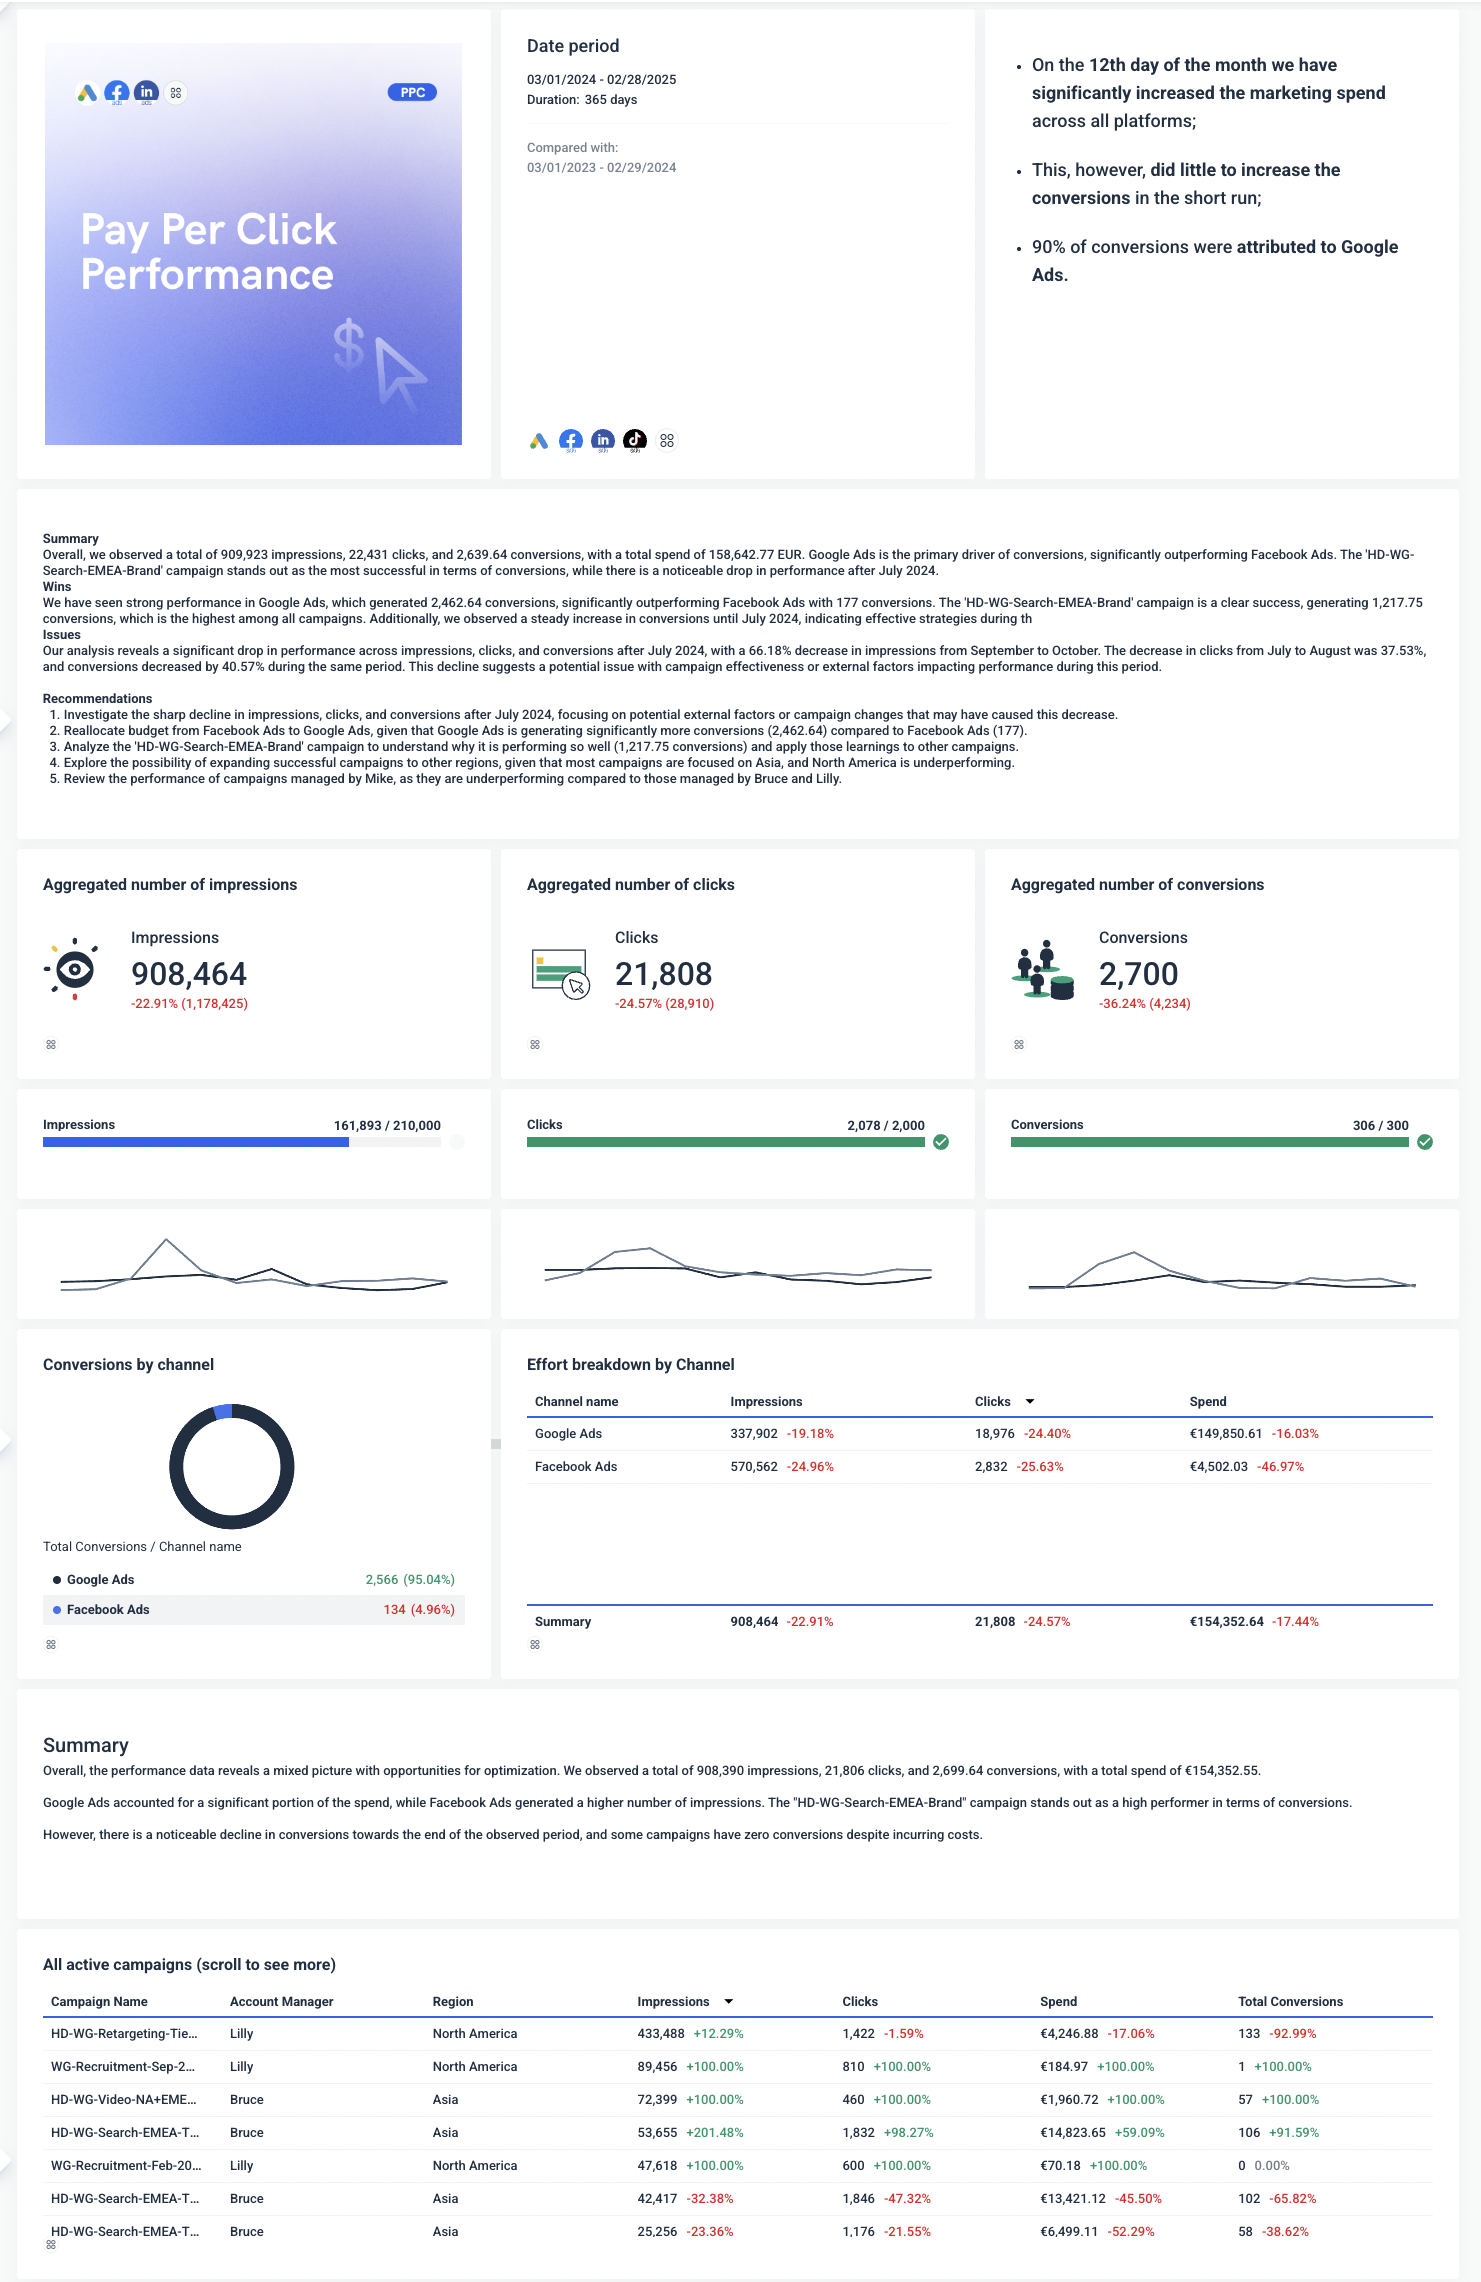
- Performance overview: Summarize total impressions, clicks, conversions, total spend, and key changes compared to the previous period. Quickly identify which platform (e.g., Google Ads or Facebook Ads) delivered the best performance.
- Channel breakdown: Clearly present performance by individual channels, such as Google Ads versus Facebook Ads. Highlight differences in spend, conversions, and effectiveness across these channels.
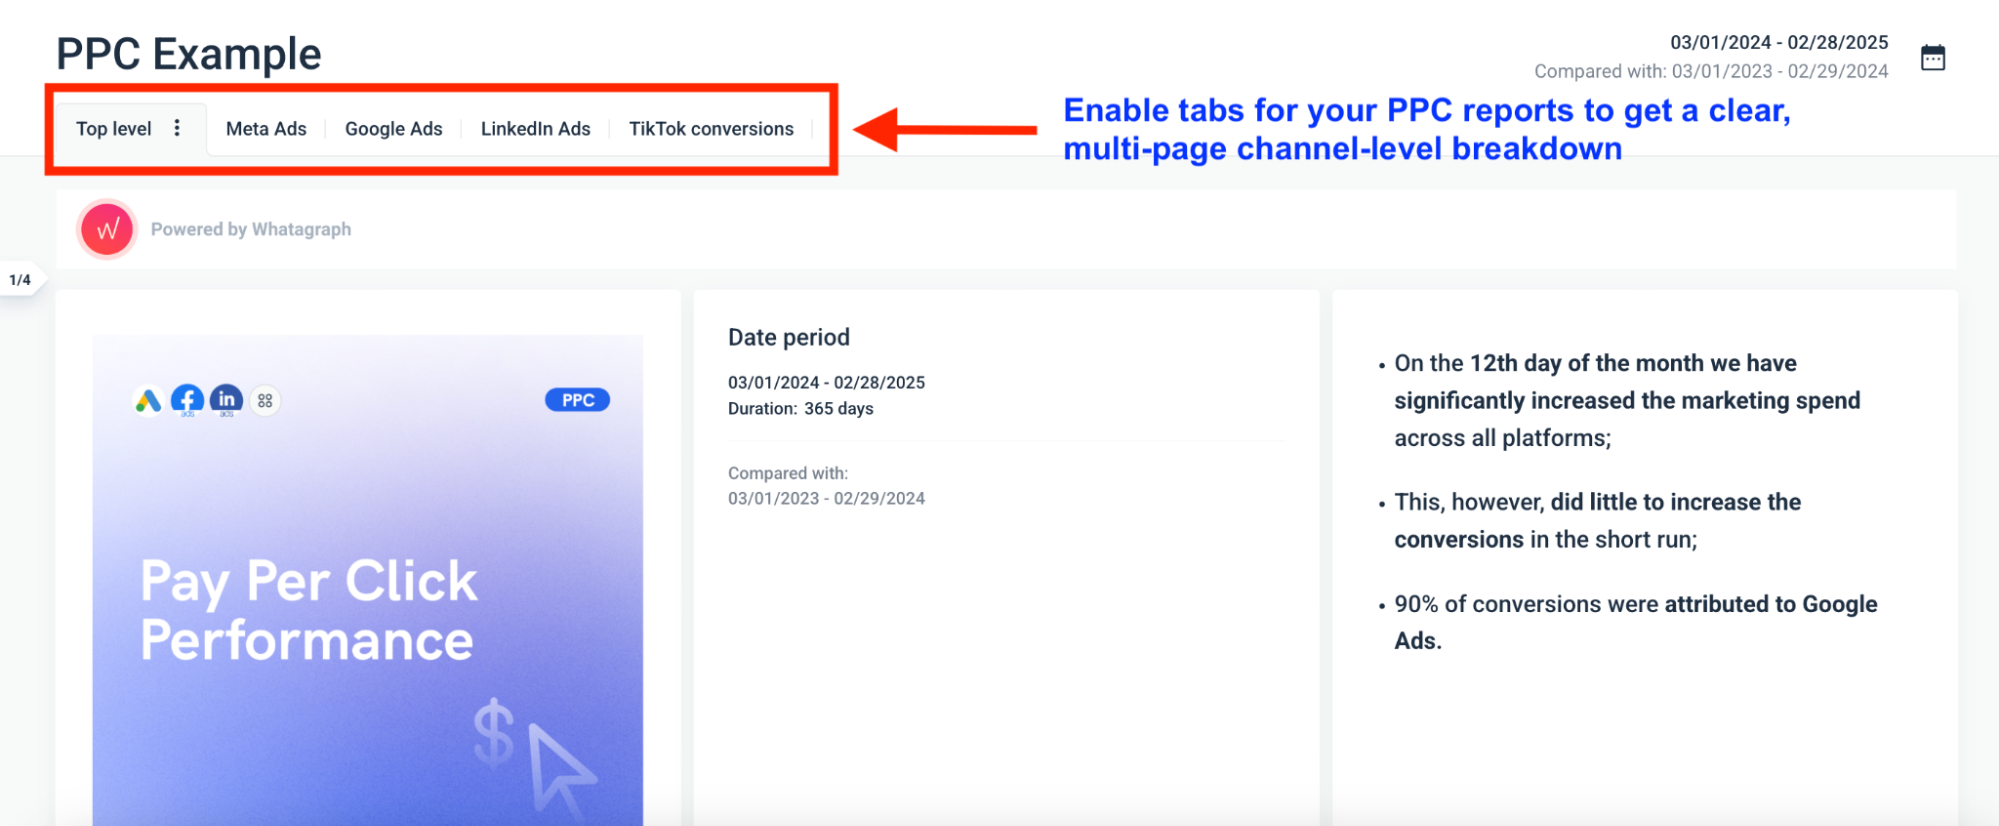
The great thing about Whatagraph is that I can use the tabs functionality to quickly make the report a “multi-page” experience instead of a single, never-ending scroll to the bottom.
- Campaign analysis: List active campaigns clearly, noting impressions, clicks, spend, and total conversions. Call out high performers to understand successful strategies.
- Audience insights: Identify top-performing segments based on demographics such as age, gender, or location. Example insight: “Females aged 25-34 had the highest conversion rate, suggesting more targeted ads for this segment.”
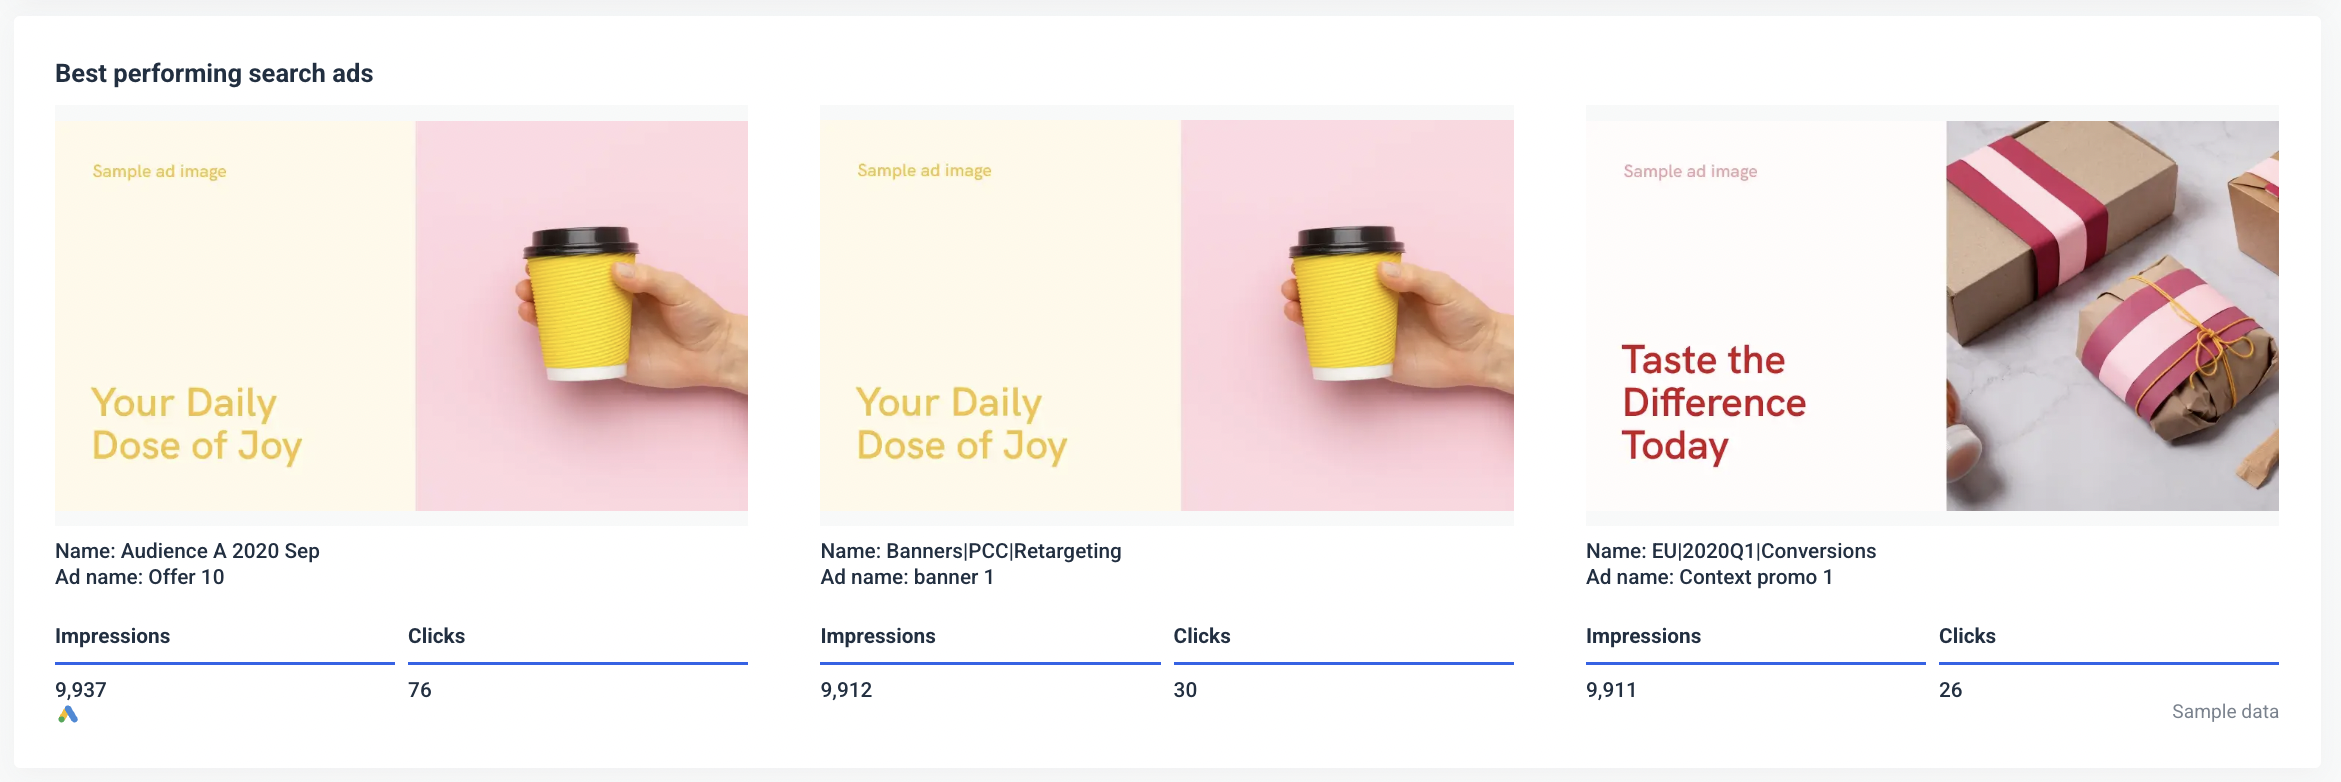
- Ad creative performance: Highlight your best-performing ads by clicks, impressions, and conversions. Clearly show examples like "Transformation-Static-2024-Jan-25" and analyze why these creatives are effective.
- Spend vs. clicks/conversions analysis: Visually demonstrate how your budget impacts clicks and conversions over time. Identify clear correlations, such as increased spend not always resulting in more conversions.
- Issues and opportunities: Clearly point out problems such as sharp declines in impressions or conversions, noting specific timeframes and affected campaigns.
- Actionable recommendations: Provide clear, specific next steps based on insights:
"Shift budget from lower-performing Facebook campaigns to high-performing Google Ads."
✨ Get inspired by our PPC Report Template here. ✨
Best practices for building a PPC report:
1. Define your success clearly. Before pulling numbers, clearly identify your PPC goals. Ask yourself one essential question:
"What does success look like for my account?"
For example, success might mean a CPA below $20, a ROAS of 4:1, or a certain number of monthly conversions.
2. Benchmark against industry standards. Don't stop at internal comparisons—check your results against industry benchmarks. Understanding how your metrics stack up against competitors provides valuable context.
3. Use PPC reporting tools to save time. PPC reporting, next to keyword research, eats up valuable hours each week. Use automated reporting platforms like Whatagraph, which streamline data gathering, clearly visualize insights, and free you up for strategy.
Messy data is a nightmare. Whatagraph neatly groups and blends your scattered PPC data into clear, easy-to-follow reports. You can:
- Quickly combine data sources for a complete view of performance.
- Create custom metrics or dimensions—like combining CPC data from multiple ad channels—making reports consistent and understandable.
- Seamlessly pull in custom data from Google Sheets or via Public API integrations. Never miss critical data points again.
4. Organic social media marketing report
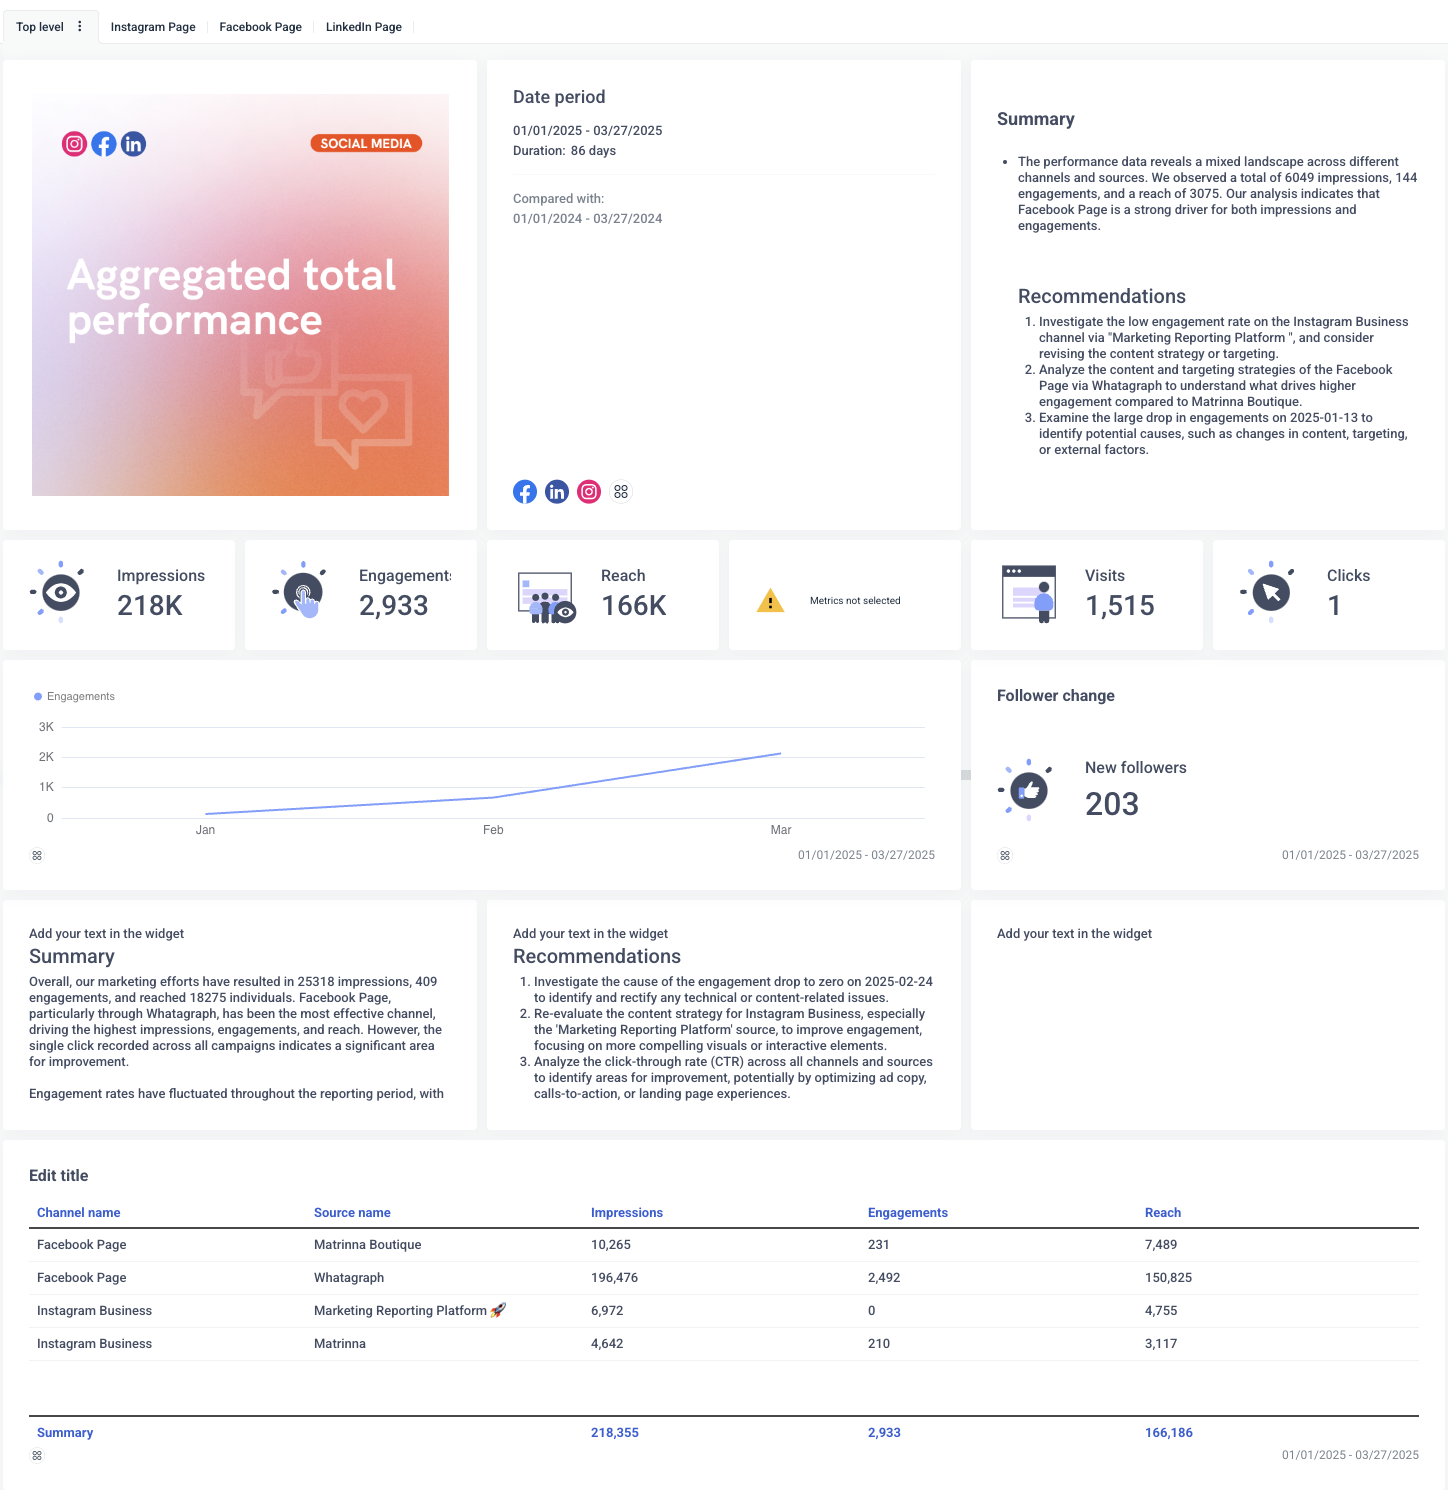
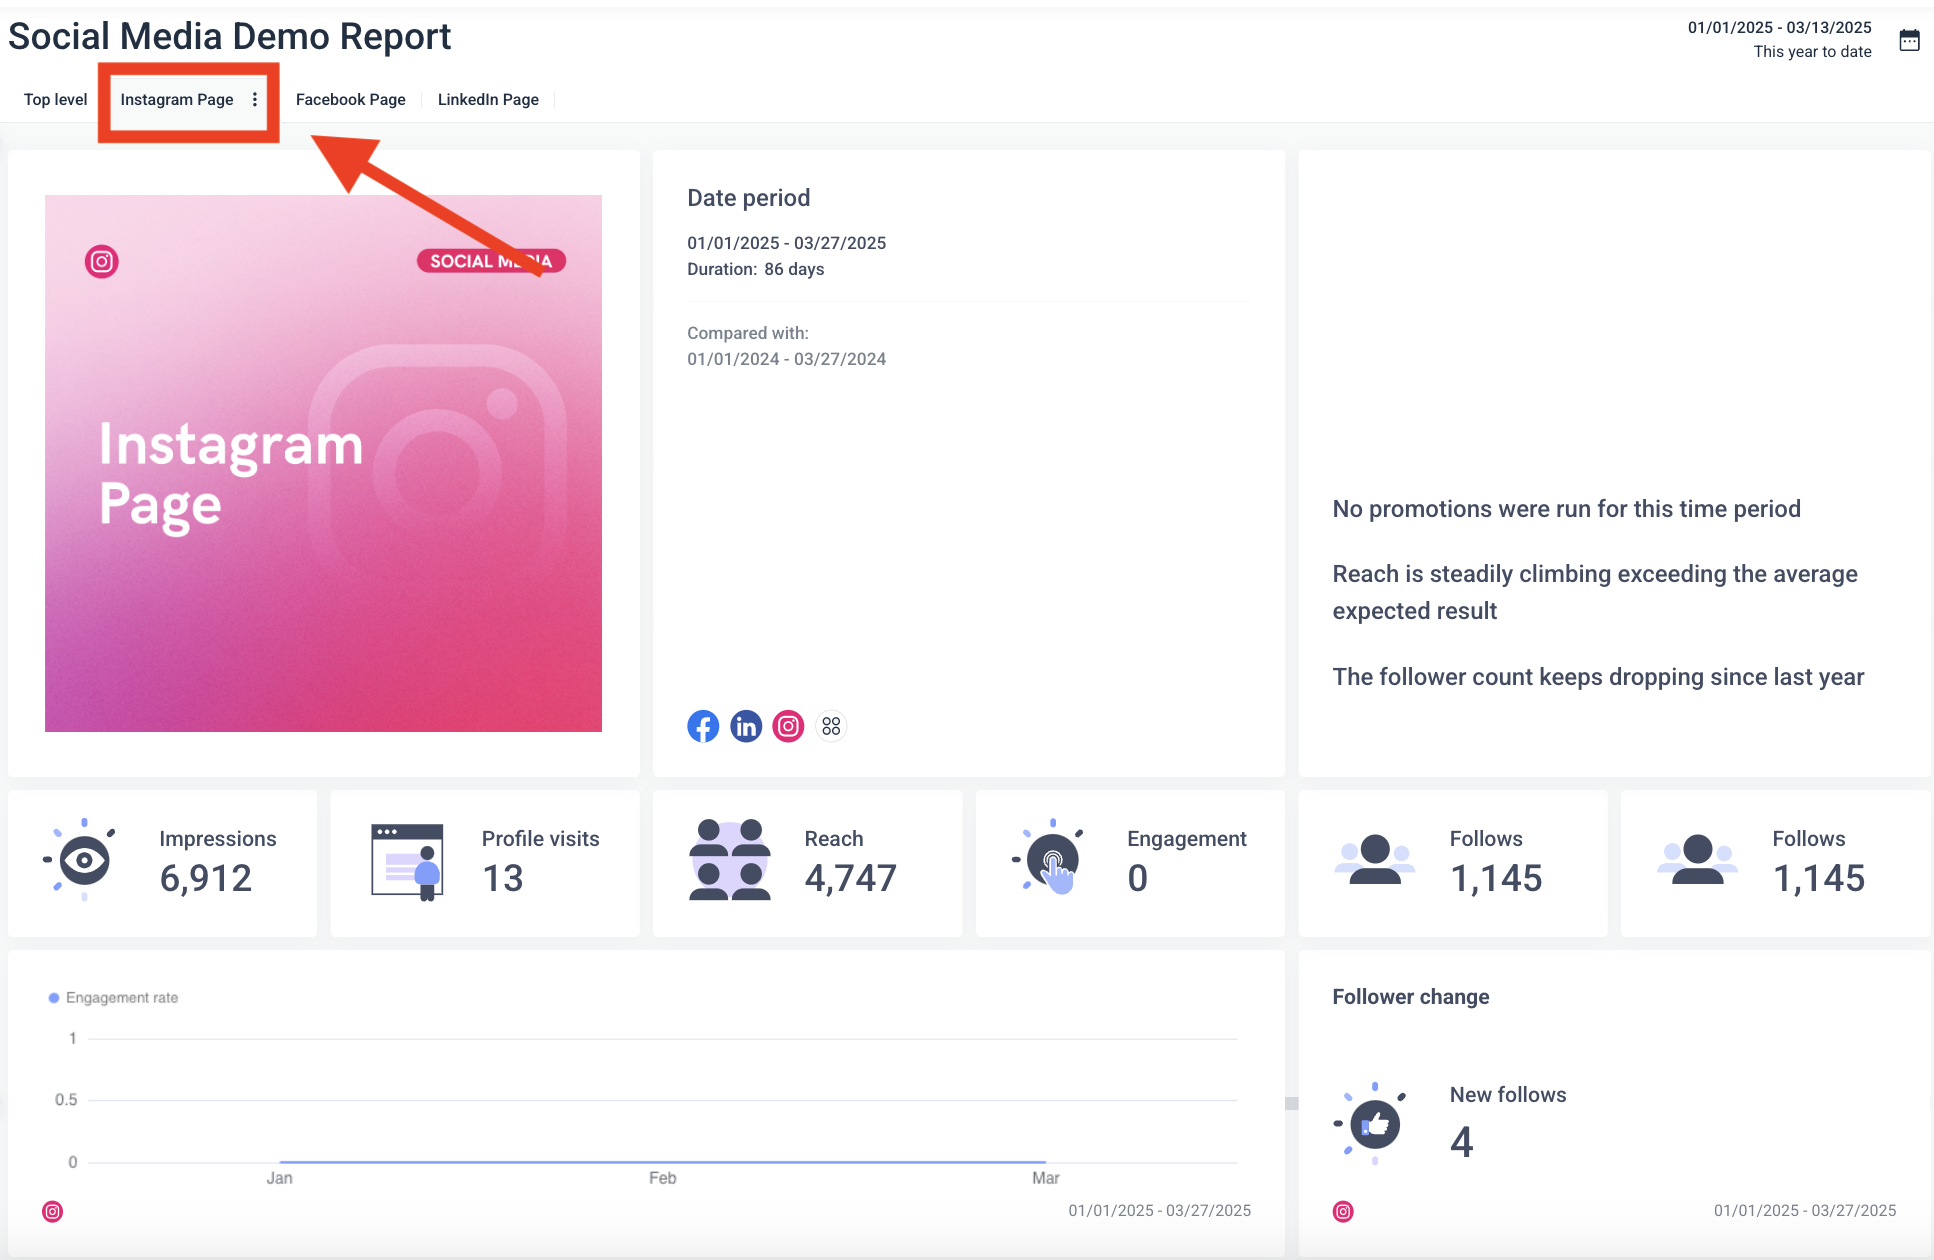
An organic social media analytics report helps track your performance across social media platforms like Facebook, Instagram, and LinkedIn—without paid promotion.
Best for: Monitoring your social media growth, identifying which platforms and content types resonate with your audience, and improving organic reach and engagement.
Key metrics to include:
- Impressions and reach: Understand the visibility and potential audience of your content.
- Engagement: Identify how strongly your content resonates with your audience (likes, comments, shares).
- Leads and conversions: Clearly measure how many visitors from social media become qualified leads or paying customers.
- Total revenue (attributed): Directly show how your social media content contributes financially to your client's business.
- Follower growth: Highlight community growth as a foundation for future conversions.
- Clicks and website visits: Track traffic driven directly from social channels to landing pages or product pages.
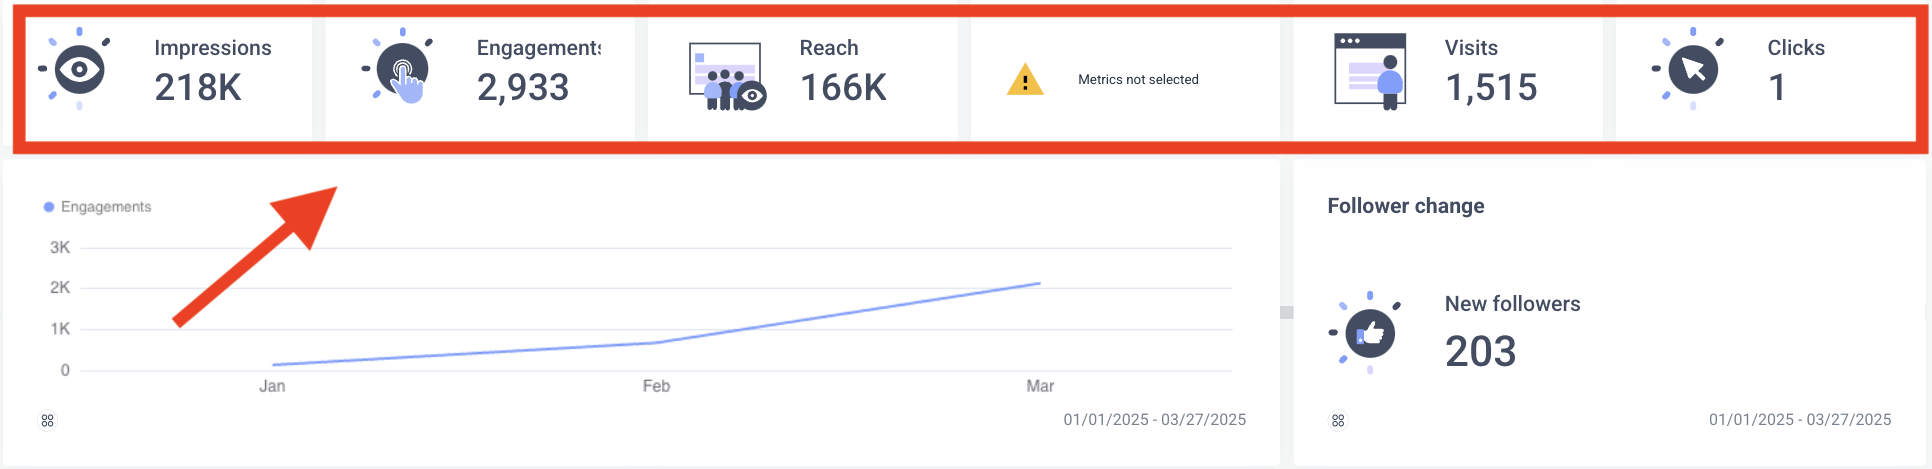 Note: See that yellow warning sign smack in the middle of the metrics section? Whatagraph has a feature that allows you to select whether or not to send automated reports to clients if there’s an issue in the report. Whew.
How to structure it:
- Overall performance summary: Start with total impressions, engagement, reach, and follower growth for quick insights. Clearly show total leads, conversions, and attributed revenue to highlight the financial impact upfront.
- Channel-specific breakdown: Detail performance metrics by each channel.
Include revenue-related data, e.g., "Instagram drove 150 conversions this month, accounting for $5,000 in revenue."
- Engagement and conversion trends: Use charts to visualize engagement trends alongside leads and conversions. Spot which posts or timeframes correlate to peaks in revenue-driving actions.
- Follower and audience insights: Clearly outline follower growth and demographic data. Highlight which audience segments convert at higher rates, providing context to future targeting.
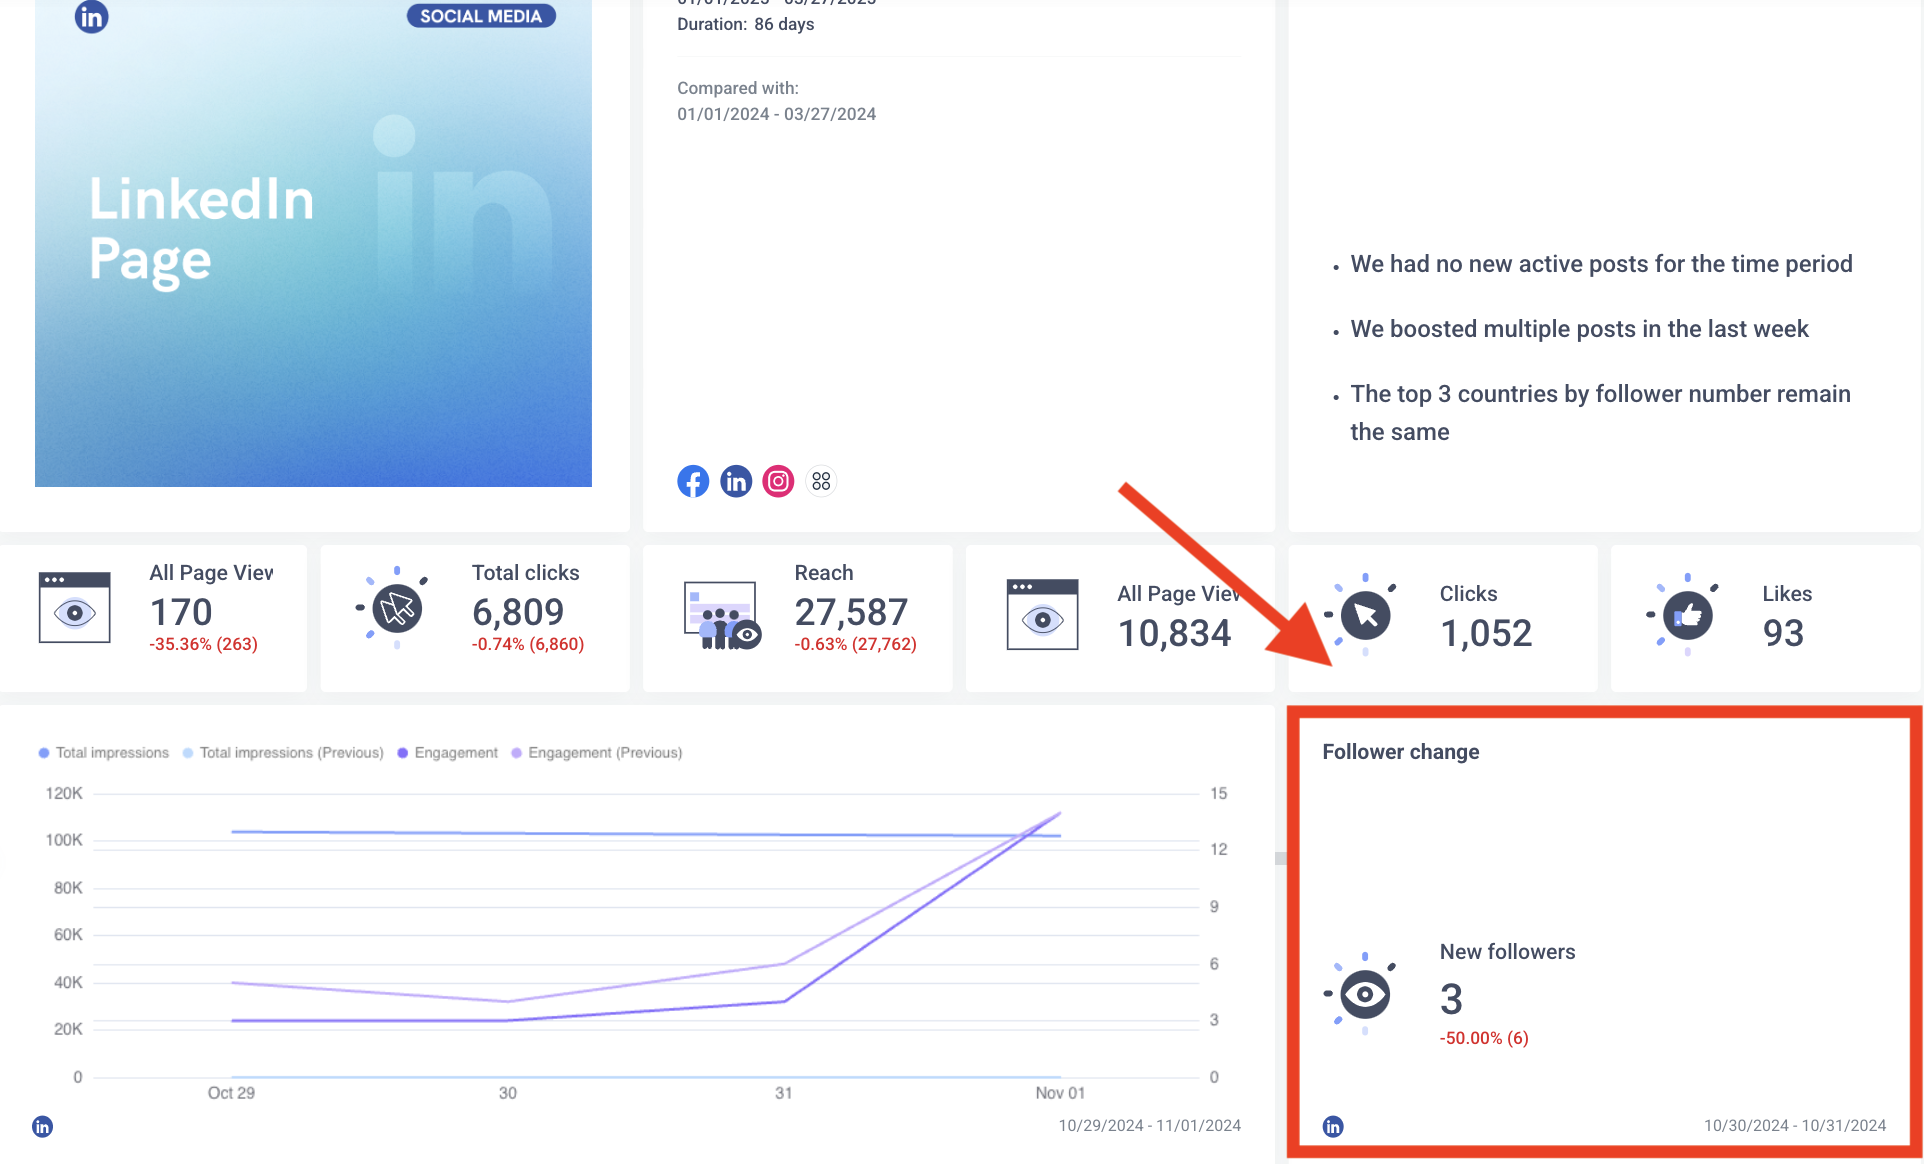
- Top-performing content: Identify and display your most impactful posts clearly. Highlight specific posts that generated measurable conversions or high engagement tied to revenue.
- Revenue insights and issues: Pinpoint any areas or channels where conversions fell short. Example: "Facebook engagement dropped by 20%, resulting in fewer leads compared to last month."
- Actionable recommendations: Provide clear next steps to boost conversions and revenue, such as: "Test stronger CTAs on LinkedIn to improve lead generation."
✨ Get inspired by our Social Media Report Template here. ✨
Best practices for building an organic social media marketing report
1. Start with the “essence” of your report. Stakeholders, especially senior leadership, will skim, nod at, and skip reports if you don’t clearly state why the report matters in the first place.
So, for social media reports, I ask myself two things:
- "If someone spent only 30 seconds on my report, what are the top three things they must know?”
- "What social media results matter most to leadership?"
For example: “Instagram followers grew by 30% this month, leading directly to 45 new leads and 10 booked demos.”
2. Use visuals to spotlight milestones. Again, this is true for all the report templates here, but come on, for a social media marketing report, it’s exactly what you’d expect. I’d hate to read someone “describe” a top-performing Instagram post instead of just actually seeing what it is.
The same principle applies to visualizing follower growth over a period of time, for example. Give me nice things to look at, not a data dump.
Visuals help readers quickly grasp your key social media wins or problems.
Imagine looking forward to making reports—one of my favorite things to do in Whatagraph is to play around with different widgets to visualize social media data:
3. Show social media metrics relevant to your audience. Different teams care about different things. Marketing teams usually care about post performance, follower growth, and engagement rates. Give them insights like, “Instagram Stories have twice the engagement rate compared to feed posts.”
Leadership teams usually focus on leads, sales, and overall return on investment. Highlight insights clearly: “LinkedIn organic posts directly generated 12 qualified leads this month.”
Real-life success story: Watch Drew Cove, Senior SEO Manager at DigitalParc, tell you how Whatagraph helps his company present the right information at the right time in a way stakeholders can best understand it:
5. Email marketing report
An email marketing report helps track and evaluate how effectively your email marketing campaigns are performing.
Best for: Measuring the impact of your email campaigns, optimizing content and messaging, and demonstrating the ROI of your email marketing efforts.
Key metrics to include:
- Open rate: Indicates the effectiveness of your subject lines and sender reputation.
- Click-through rate (CTR): Measures engagement with your email content.
- Conversion rate: Clearly shows how many email recipients complete desired actions (e.g., product purchases, webinar sign-ups).
- Subscriber growth and churn: Tracks your list health and audience interest over time.
- Revenue generated: Ties your email campaigns directly to business outcomes.
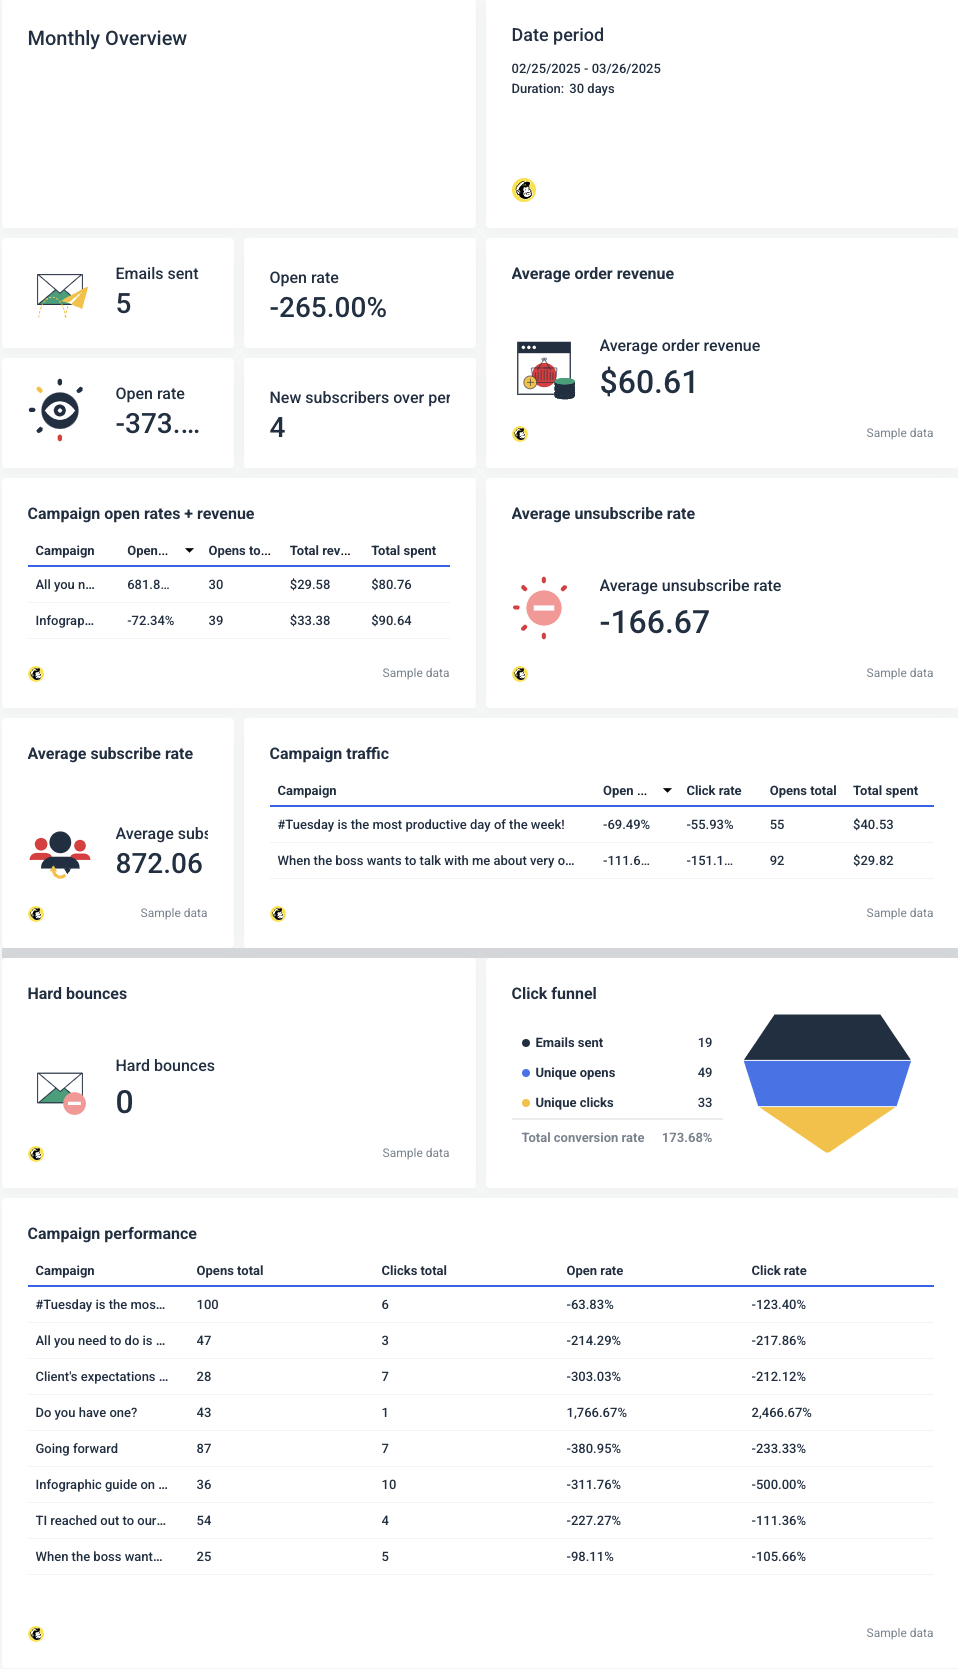
How to structure it:
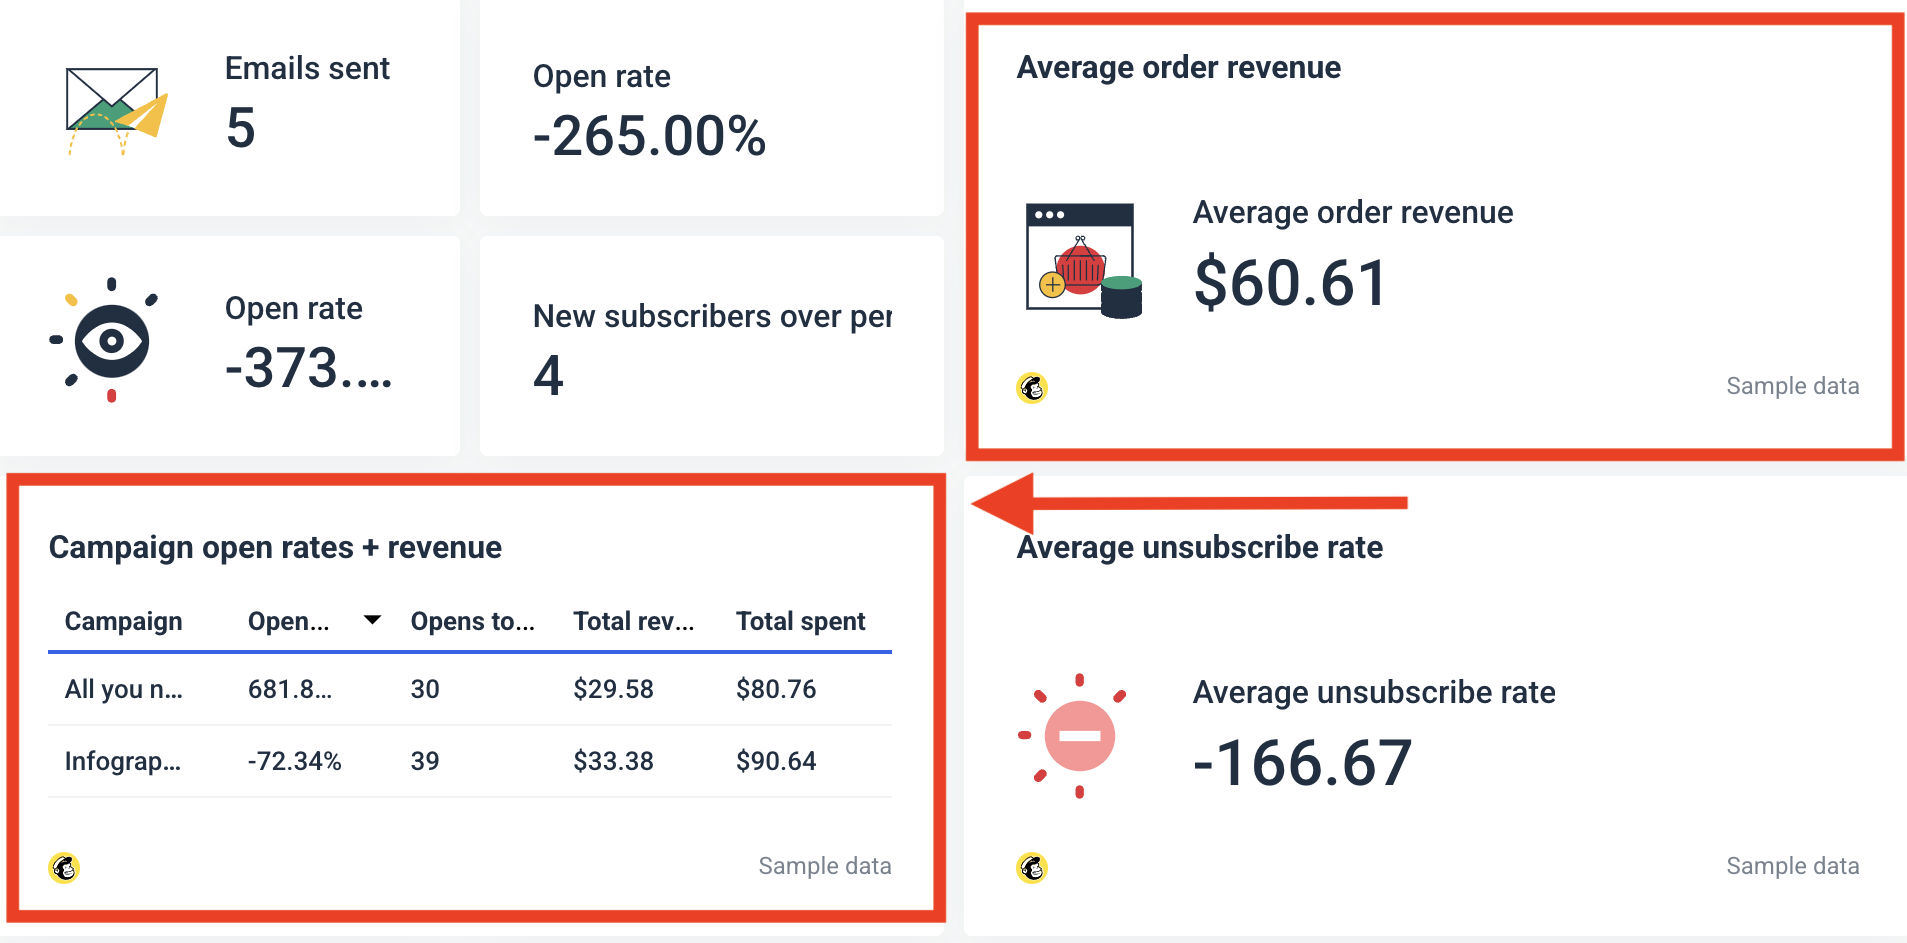
- Monthly overview: Summarize total emails sent, average open rates, revenue generated, and new subscribers. Quickly spot significant increases or decreases compared to the previous reporting period.
- Campaign performance breakdown: Provide detailed insights into individual email campaigns. Highlight top-performing campaigns, e.g., "Infographic email had the highest revenue per email sent ($90.64), despite lower overall open rates."
- Subscriber trends: Clearly show changes in subscriber growth, churn, and unsubscribe rates visually. Identify issues early, like sudden spikes in unsubscribe rates, and explain why they occurred.
- Email engagement funnel: Visually display the funnel clearly—emails sent → opens → clicks. Highlight areas needing improvement, e.g., "Good open rates but low clicks suggest stronger CTAs or content adjustments needed."
- Hard bounce monitoring: Report any deliverability issues or "hard bounces."
Explain the implications and suggest clear next steps, such as "review subscriber list health." - Revenue insights and recommendations: Present insights into emails that directly generated the most revenue. Provide actionable recommendations like:
"Create more infographic-style emails—they deliver higher revenue per send."
✨ Get inspired by our Email Marketing Report Template here. ✨
Best practices for building an email marketing report
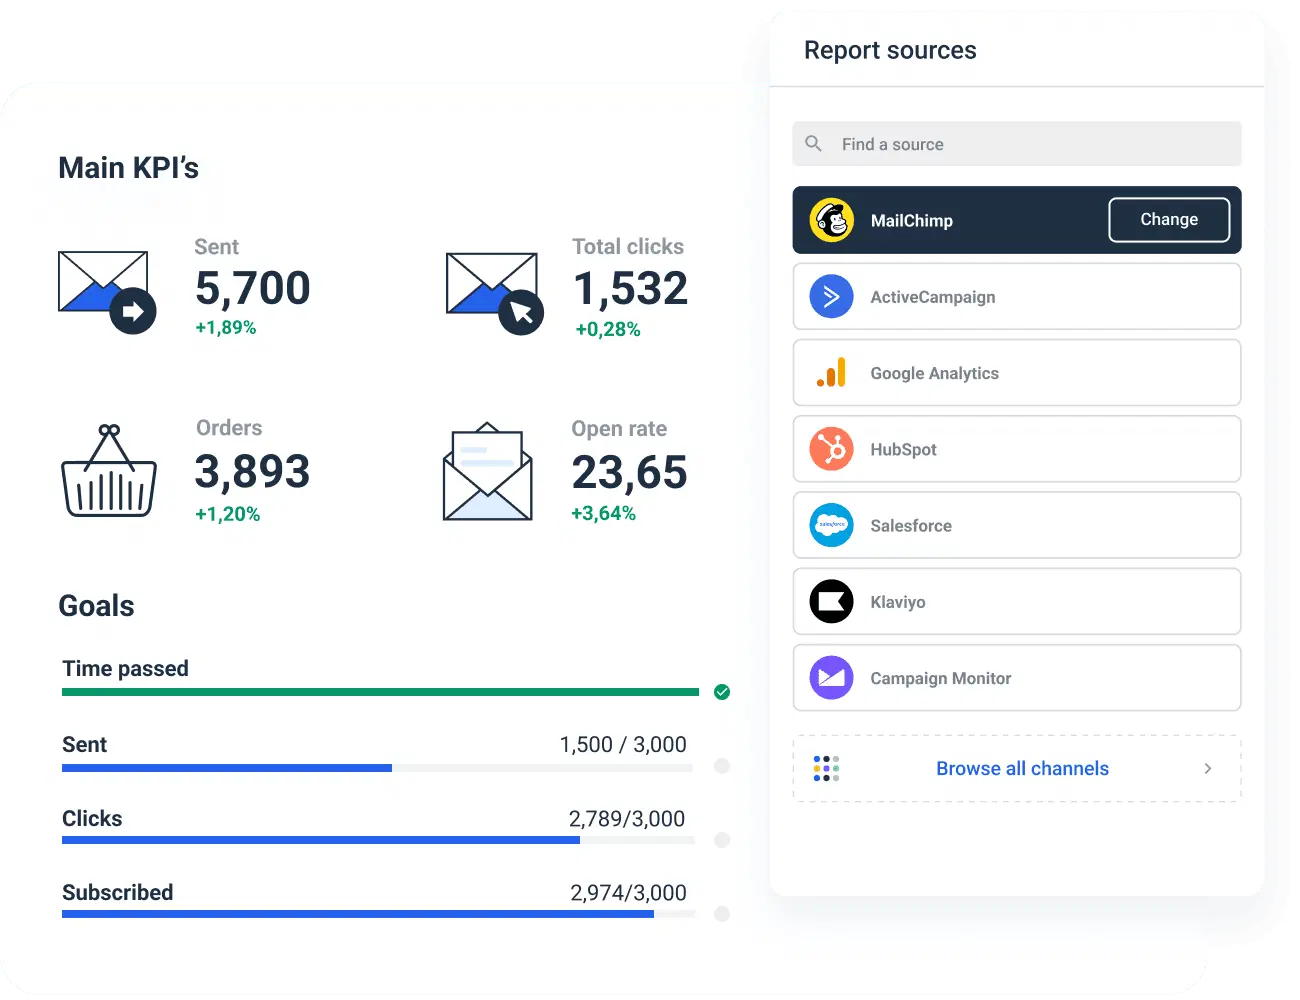
1. Use ready-to-go email integrations. I’ve built a sample report above using Mailchimp data, but Whatagraph effortlessly integrates with other popular email marketing platforms as well—ActiveCampaign, HubSpot, Klaviyo, Campaign Monitor, Salesforce, and Google Analytics.
Quickly highlight open rates, CTR, subscriber growth, and conversions, regardless of which email tool your client uses.
2. Customize email metrics for different clients. Every client has unique goals, audiences, and success metrics. Instead of generic reporting, customize your metrics directly in Whatagraph to match your client's business objectives.
Start watching at 03:45 to see how you can make your own custom metrics:
3. Highlight real subscriber stories. Instead of only numbers, show real stories or feedback from subscribers who converted.
For example: “Our email introducing the spring collection led Sarah from New York to spend $250—her first purchase this year!”
Keep your clients invested with real stories from real humans made by real humans.
6. Google Analytics (GA4) report
A Google Analytics 4 report shows you the digital body language of your visitors—exposing who clicks what, when they bounce, and why they convert (or don't). GA4 forces you to think in events, paths, and engagement, giving you deeper insights into your website traffic patterns for informed decisions.
Best for: Figuring out if your website is actually working, and making data-driven decisions to double down on or pivot your marketing strategy.
 Key metrics to include:
- Sessions and users: Who’s coming to your site and how often?
- Engagement rate and session duration: Are people actually staying and interacting?
- Top pages: What content is driving traffic and conversions?
- Traffic sources: Which channels send the most valuable traffic?
- Conversions: Which actions matter most—and are they happening?
 How to structure it:
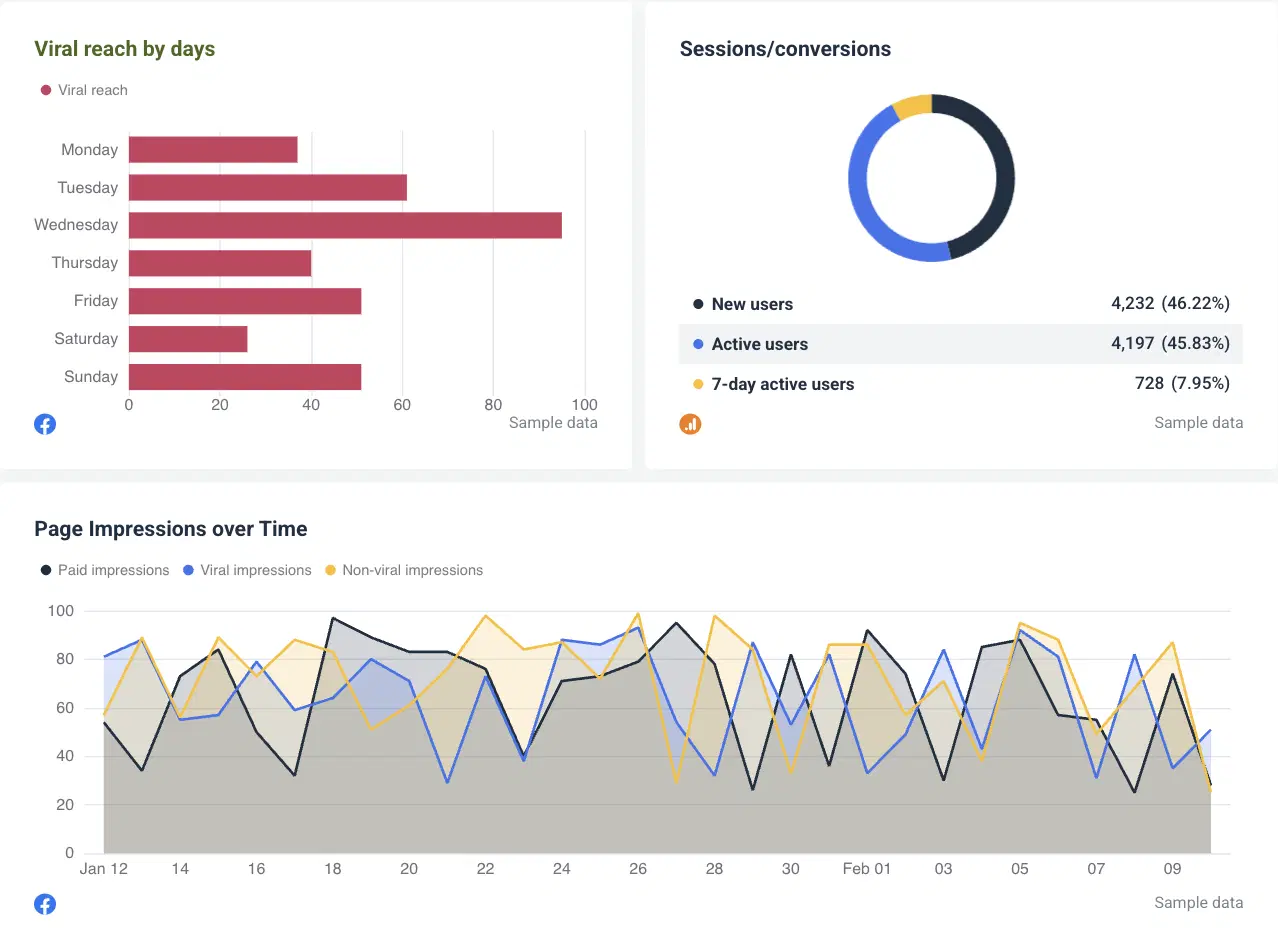
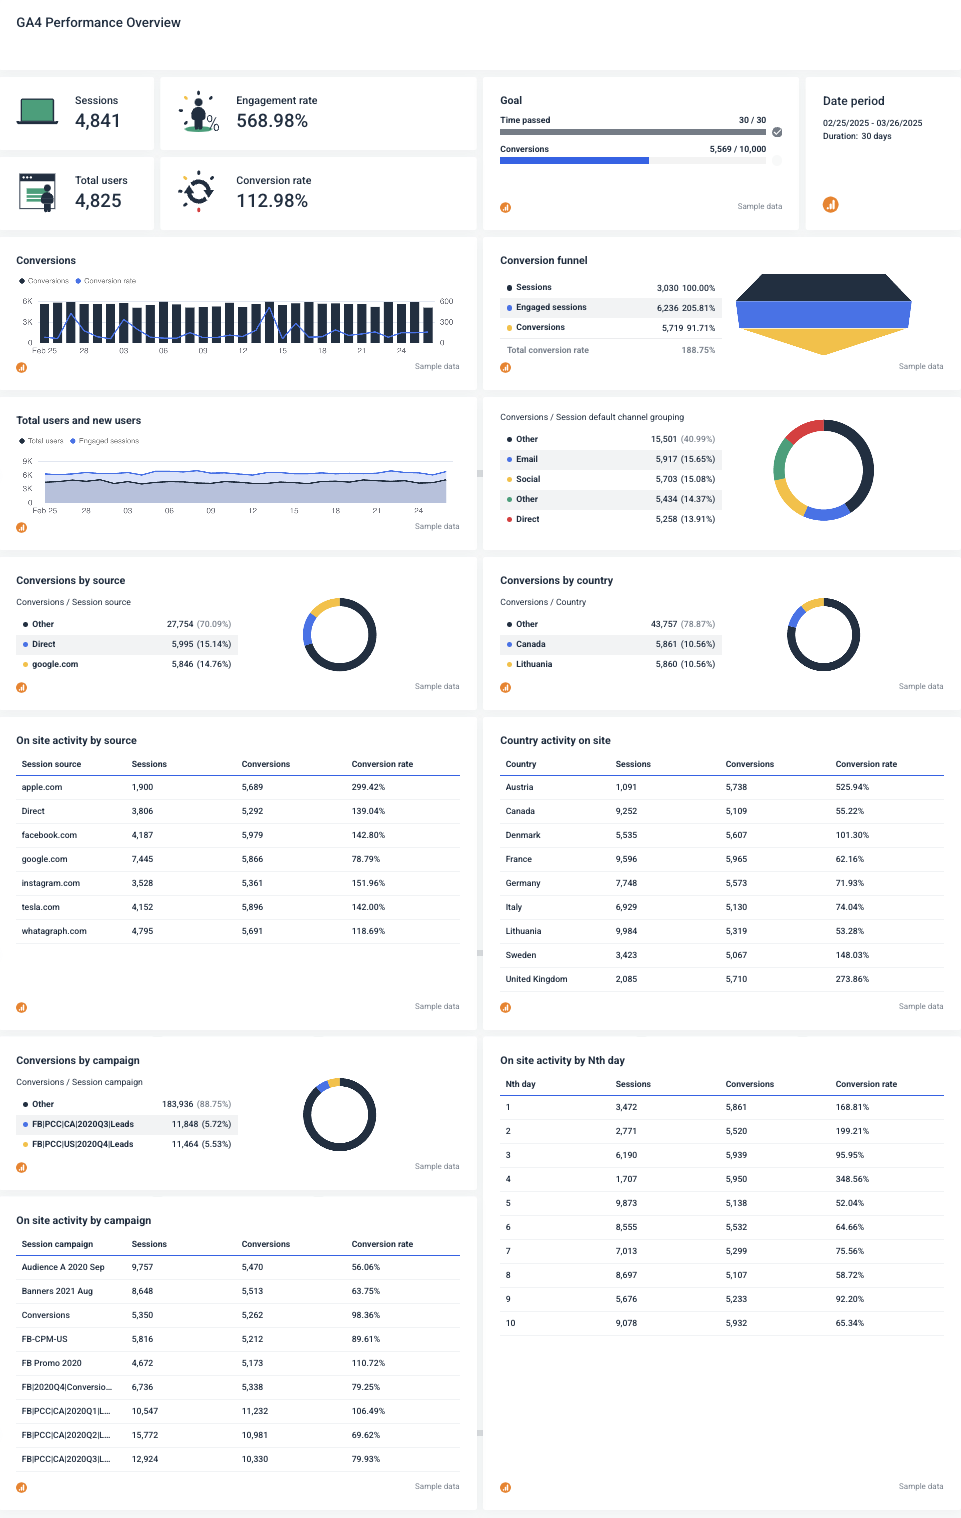
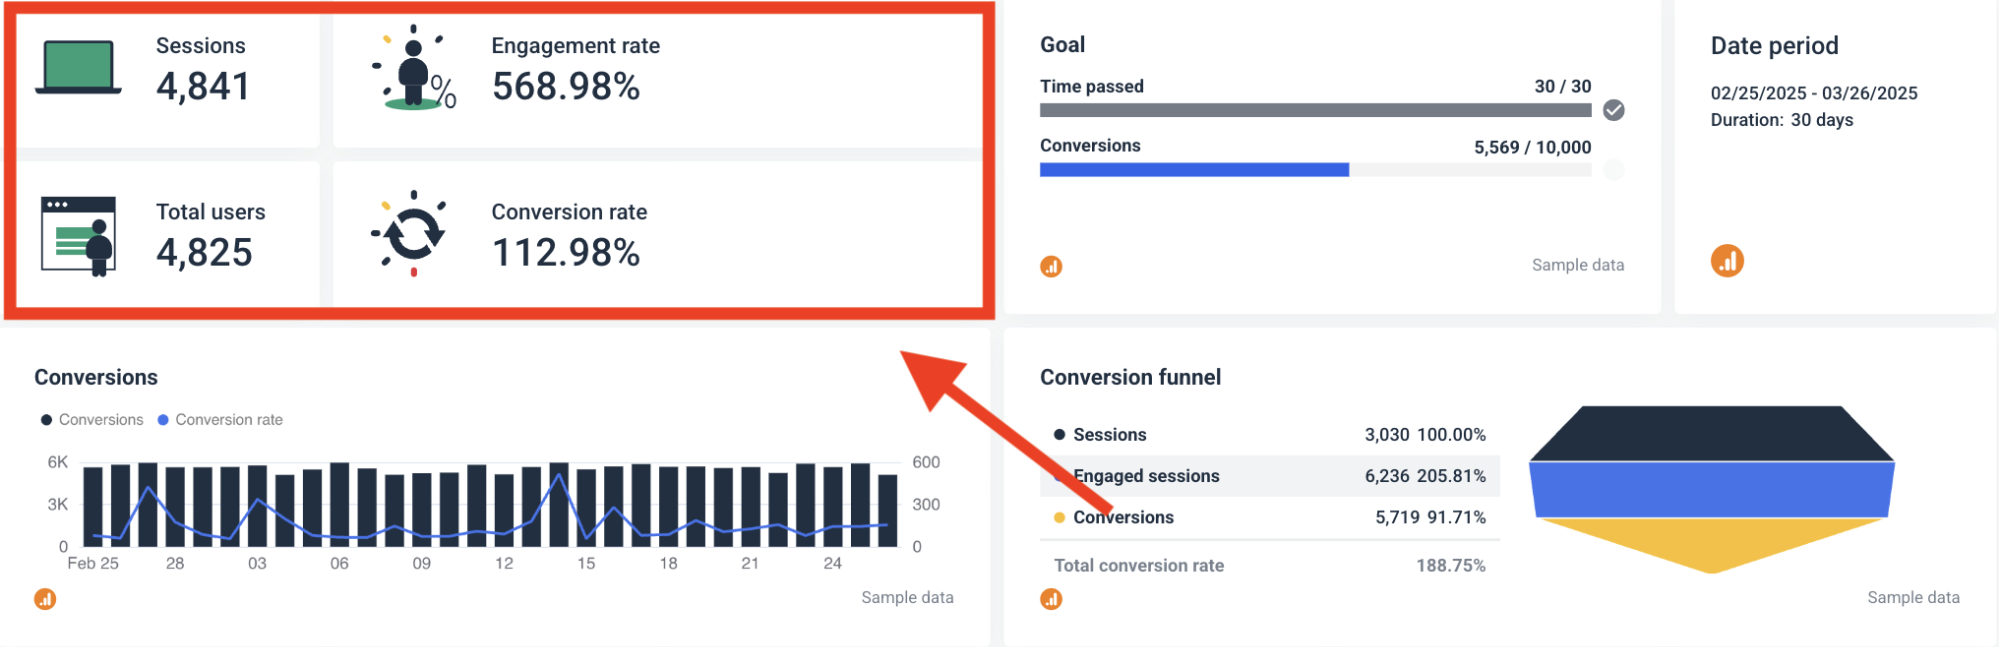
- Performance overview: This is your executive summary, showing overall health at a glance. Notice how the example marketing report puts these critical metrics front and center with clear visual indicators.
- Conversion funnel: Show your entire customer journey from initial sessions to engaged users to actual conversions. Include total conversion rate to reveal where potential customers are falling off. The funnel visualization makes bottlenecks immediately obvious.
- Channel performance: Break down which traffic sources (organic, direct, email, social) drive the most valuable conversions—not just traffic. The example uses color-coded donut charts to instantly communicate channel effectiveness by both volume and conversion rate.
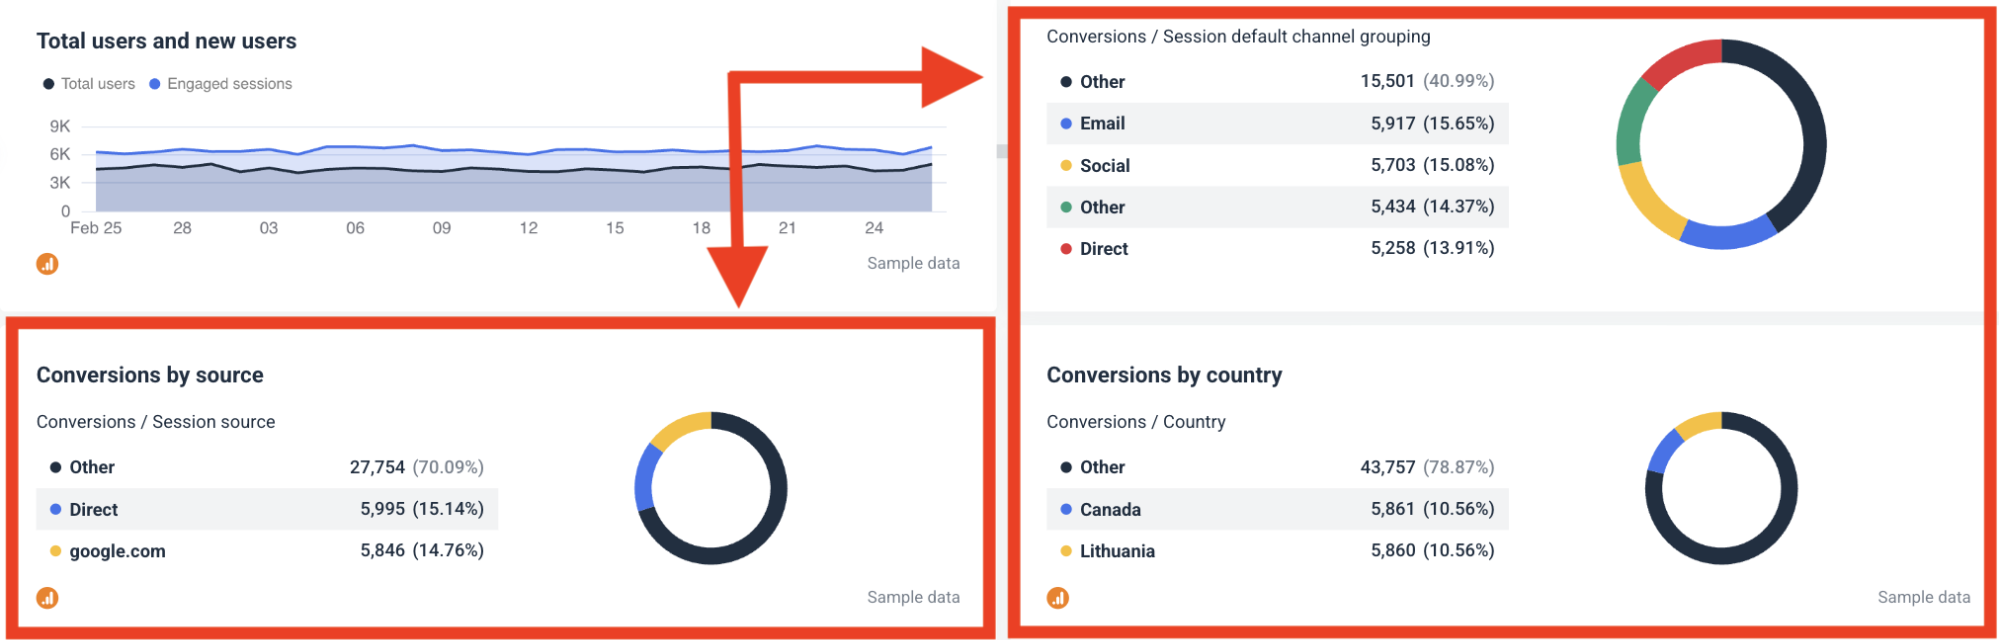
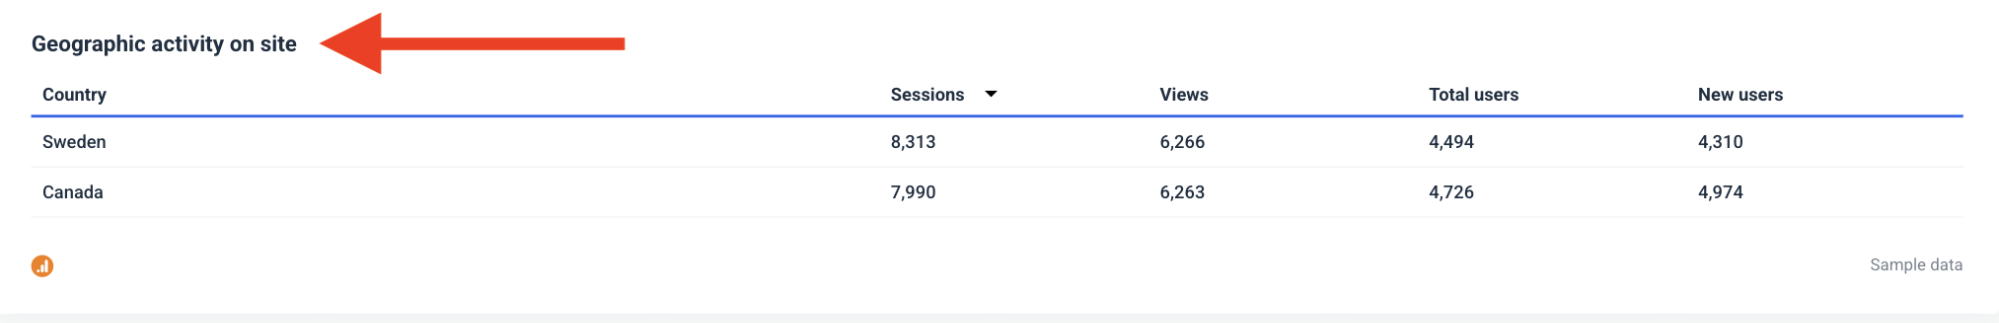
- Geographical insights: If you sell globally or regionally, include a breakdown of conversions by country or region.
- Campaign effectiveness: Display which campaigns drive meaningful conversions rather than vanity metrics.
- Trend visualization: Use line graphs to show how users and conversions change over time.
- Actionable recommendations: Close with 3-5 specific, data-driven recommendations—not vague platitudes. These should directly address opportunities revealed in your report.
✨ Get inspired by our GA4 Report Template here. ✨
Best practices for building a GA4 report
Google Analytics 4 dumps more data points than stars in the sky. I’ve found myself getting lost in the numbers (there are just so many…) rather than adding meaningful context to them. Stay ruthlessly focused on the metrics that drive decision-making.
Here’s how to do that:
1. Visualize the context, not just the data. When conversions plummet during a holiday weekend or spike after your competitor's embarrassing PR disaster, add annotations. Context transforms random fluctuations into learning opportunities.
2. Humanize metrics with real examples. Instead of saying "the average session duration is 2:47," show an actual user journey: "Here's how User #1274 spent 3 minutes before purchasing—first checking reviews, then viewing pricing, then adding to cart." Abstract numbers don't stick; stories do.
3. Compare against goals, not time periods. "We're up 12% from last month" means nothing without context. "We're 8% short of our quarterly conversion target," tells a story that demands action.
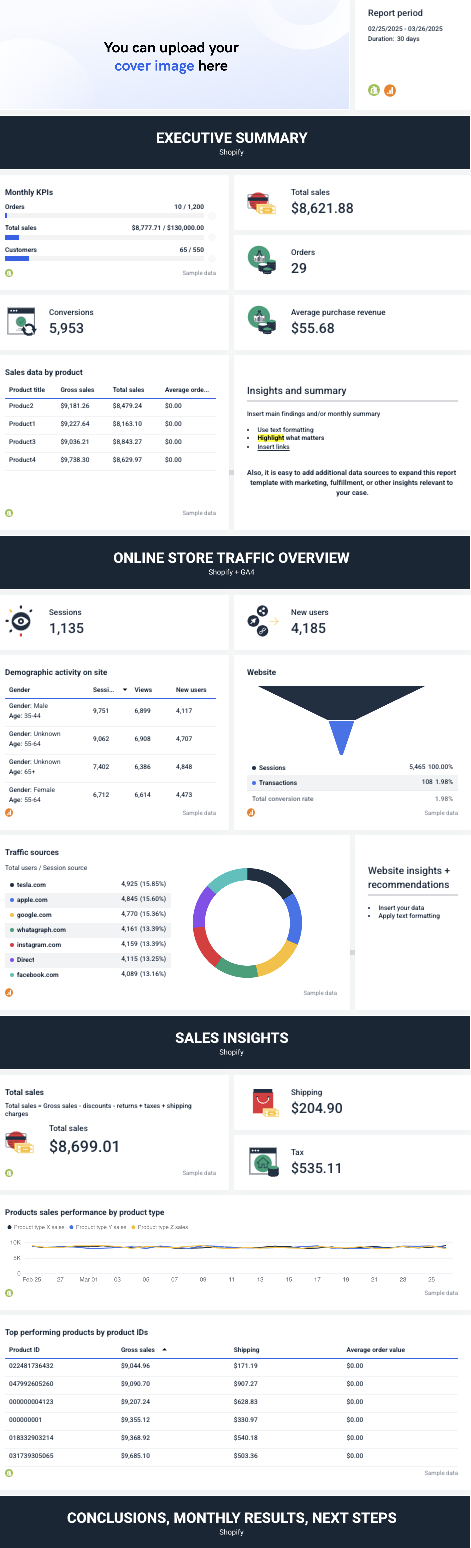
7. Shopify report
A Shopify report distills your ecommerce performance into metrics that move the needle.
Best for: Ecommerce businesses that need to understand which products, channels, and campaigns drive actual revenue—not just traffic.
Key metrics to include:
Your Shopify report should tell a clear story about your store's performance across three critical areas—sales, traffic, and customers.
- Conversion metrics: Total conversion rate, transactions per session, and checkout completion. The sample shows a 21.15% conversion rate—the single most important indicator of whether your store converts visitors to buyers.
- Traffic quality indicators: Sessions, new users, and traffic sources by percentage.
- Sales performance metrics: Total sales against target, gross sales, average order value (AOV), and revenue by product.
- Device and technical metrics: Session duration and conversion rate by device type.
 How to structure it:
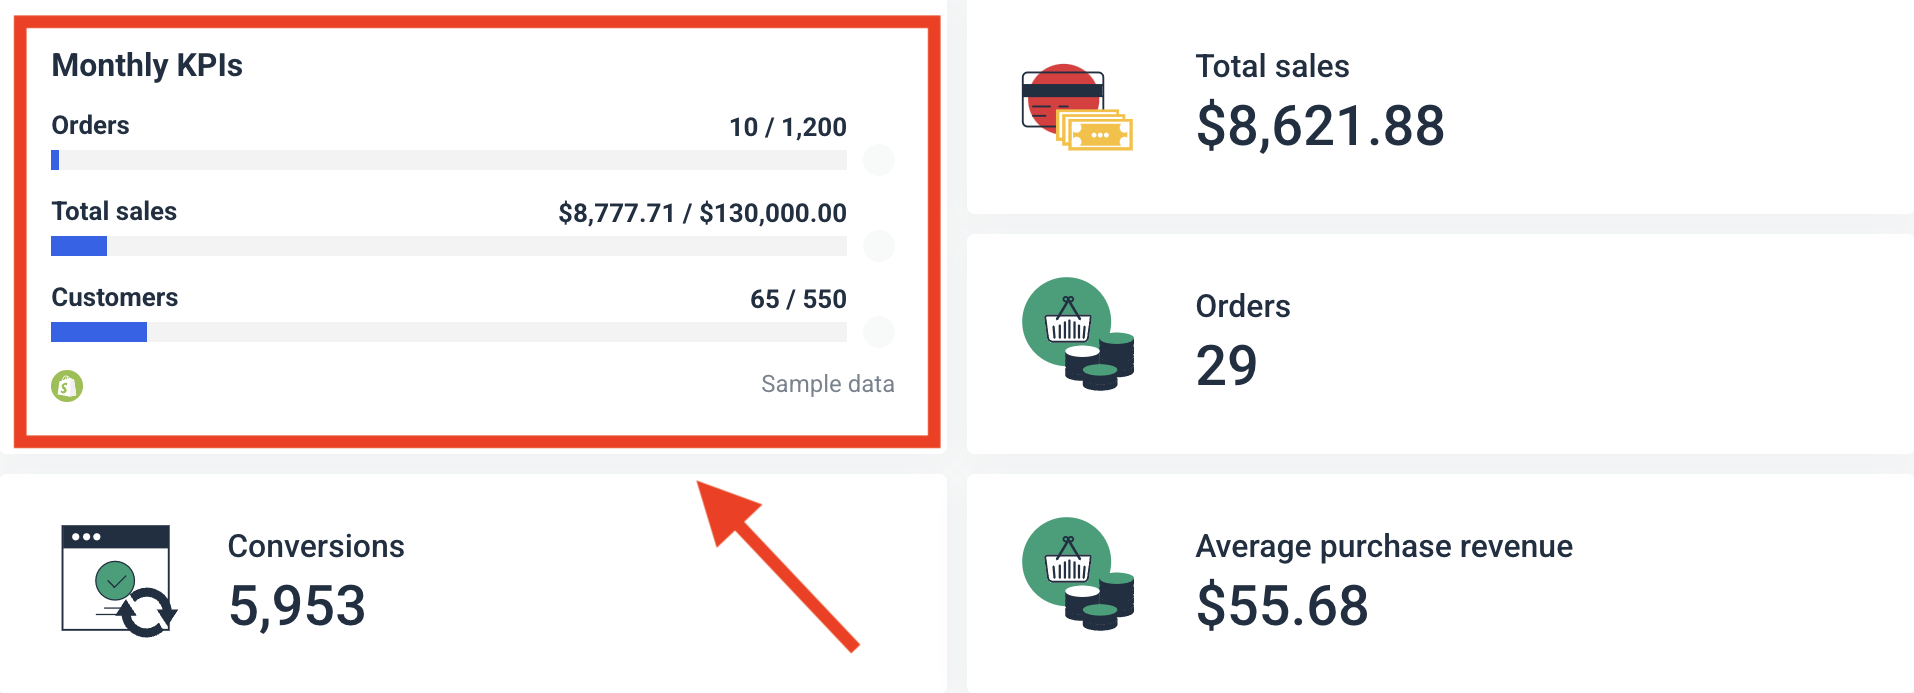
- Executive summary: Start with a snapshot of critical KPIs against targets—total sales, orders, and conversions.
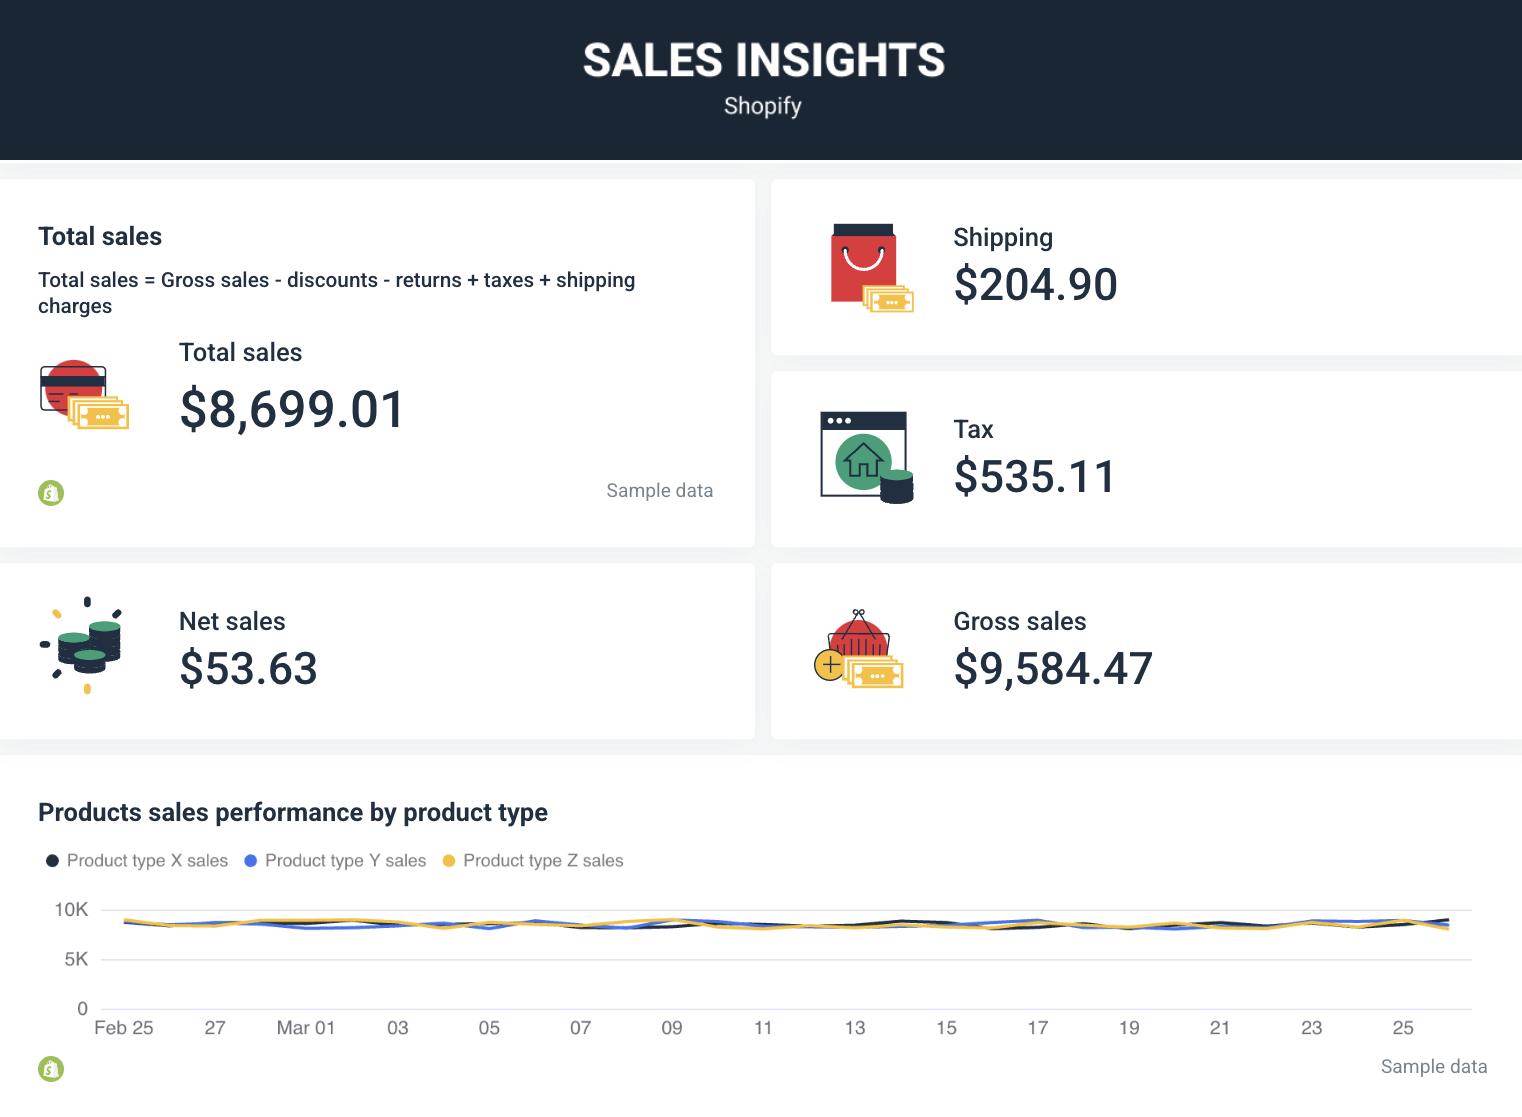
- Sales insights: Break down revenue by product, showing gross sales, shipping, and taxes separately.
- Online store traffic overview: Show sessions, new users, and website conversion funnels.
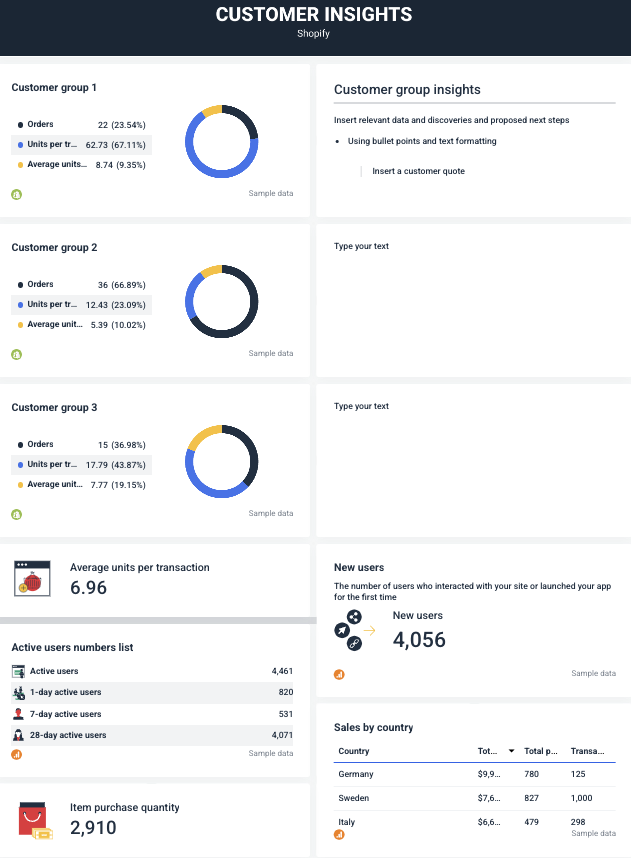
- Customer insights: Segment customers into meaningful groups based on purchase behavior. The sample report uses three customer segments with clear metrics for each: orders, units per transaction, and average units. (I’ve made a separate tab for this data because it’s easy to get overwhelmed by too much on one page.)
- Device and technical data: Show how users on different devices and browsers behave.
- Next steps: End with specific action recommendations based on the data.
Best practices for building a Shopify report
I tapped Michael Keenan, principal at Peak, for this section.
He has two sage pieces of advice.
1. “Make it pretty.” Use consistent colors that match your brand. Add white space. Make your fonts readable.
Design matters because decision-makers will judge your data by its cover before they ever consider its content. If it looks amateur, they'll assume the analysis is, too.
Whatagraph doesn’t trap you in a two-dimensional flatland. Play around with colors, customizable icons for widgets, pie-charts, donuts, funnels, and line graphs to make a report worth paying attention to:
2. “Automate report deliveries.” Manual reporting is the death of insight. By the time you've finished copying, pasting, and formatting, you're too exhausted to think critically about what the data means.
Set up automated reports that land in stakeholders' inboxes at the same time each week or month. Consistency breeds familiarity, and familiarity breeds action.
To this, Mike also adds:
Use Slack integrations to send the reports to clients you're in Slack channels with.
The goal is to be proactive, while shedding the skin of manual reporting for good.
We’ve already covered how Whatagraph lets you schedule, automate, and share live reports, but Ivan Vislavskiy, CEO and Co-Founder of Comrade Digital Marketing Agency, goes one step further to show us how you can slide into Slack with clever automations:
Make marketing reports that actually get read
At the end of the day, a great marketing report doesn’t just show data—it tells a story that drives decisions.
Whether you're reporting on SEO, PPC, email, or social, the same principles apply:
- Focus on outcomes that matter
- Make insights clear and actionable
- Visualize results in a way that’s easy to understand
- Automate the process so reporting doesn’t eat up your week
When your reports are easy to read, impossible to ignore, and clearly tied to growth—you build trust, reduce churn, and prove your value without saying a word.
If you’re ready to create reports your clients (and execs) actually look forward to? We’d love to show you how Whatagraph can help.
Published on Mar 29 2023
WRITTEN BY
Brinda GulatiBrinda Gulati is a fractional content marketer and freelance writer who specializes in data-driven storytelling and writing easy-to-understand, informative content for humans. She has two degrees in Creative Writing from the University of Warwick, and believes that above all, stories are a deeply human endeavor. She has two dogs, knows thrifting spots, and loves afternoon naps.