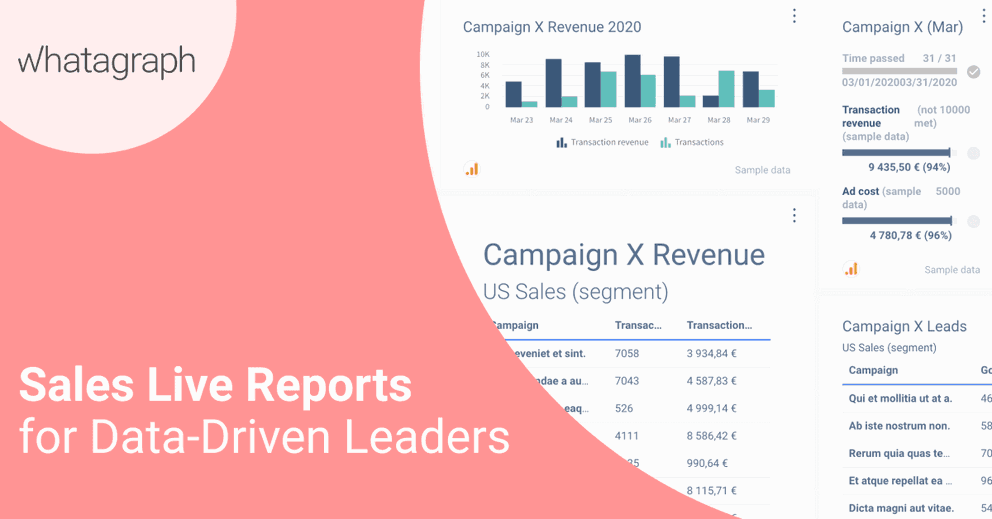
Sales Dashboard (Live Reports) to Achieve More Goals
When was the last time you made a quick decision that yielded a disappointing result? Did you recall using data to inform such decisions? There is a high probability that you used your intuition.

Apr 06 2020●4 min read


In marketing, it is said that analysis is the foundation of decisions while decision leads to the formation of new ideas, thus unveiling the opportunity for growth and development.
As contained in a 2018 report by the Global Data Management Benchmark, 52% of organizations were surveyed, and they all affirmed that data and analytics are key tools projected to become critical sources of opportunity in the coming years.
While more organizations continue to depend mainly on data for strategic decision making, their ability to purposely generate actionable insights will also remain a fundamental part of their successes.
Here comes the question. How do you visualize your sales data, make strategic decisions, and analyze your performance? That’s where the power of sales dashboards comes into play.
What is a Sales Dashboard?
Simply put, a sales dashboards refers to the visual representation of your sales data. These sets of information can also be categorized and filtered into different periods. And of course, many sales dashboards can be used to pull in a wide array of real-time data.
Here at Whatagraph, we have a solution for you to use our sales dashboard for your metrics.
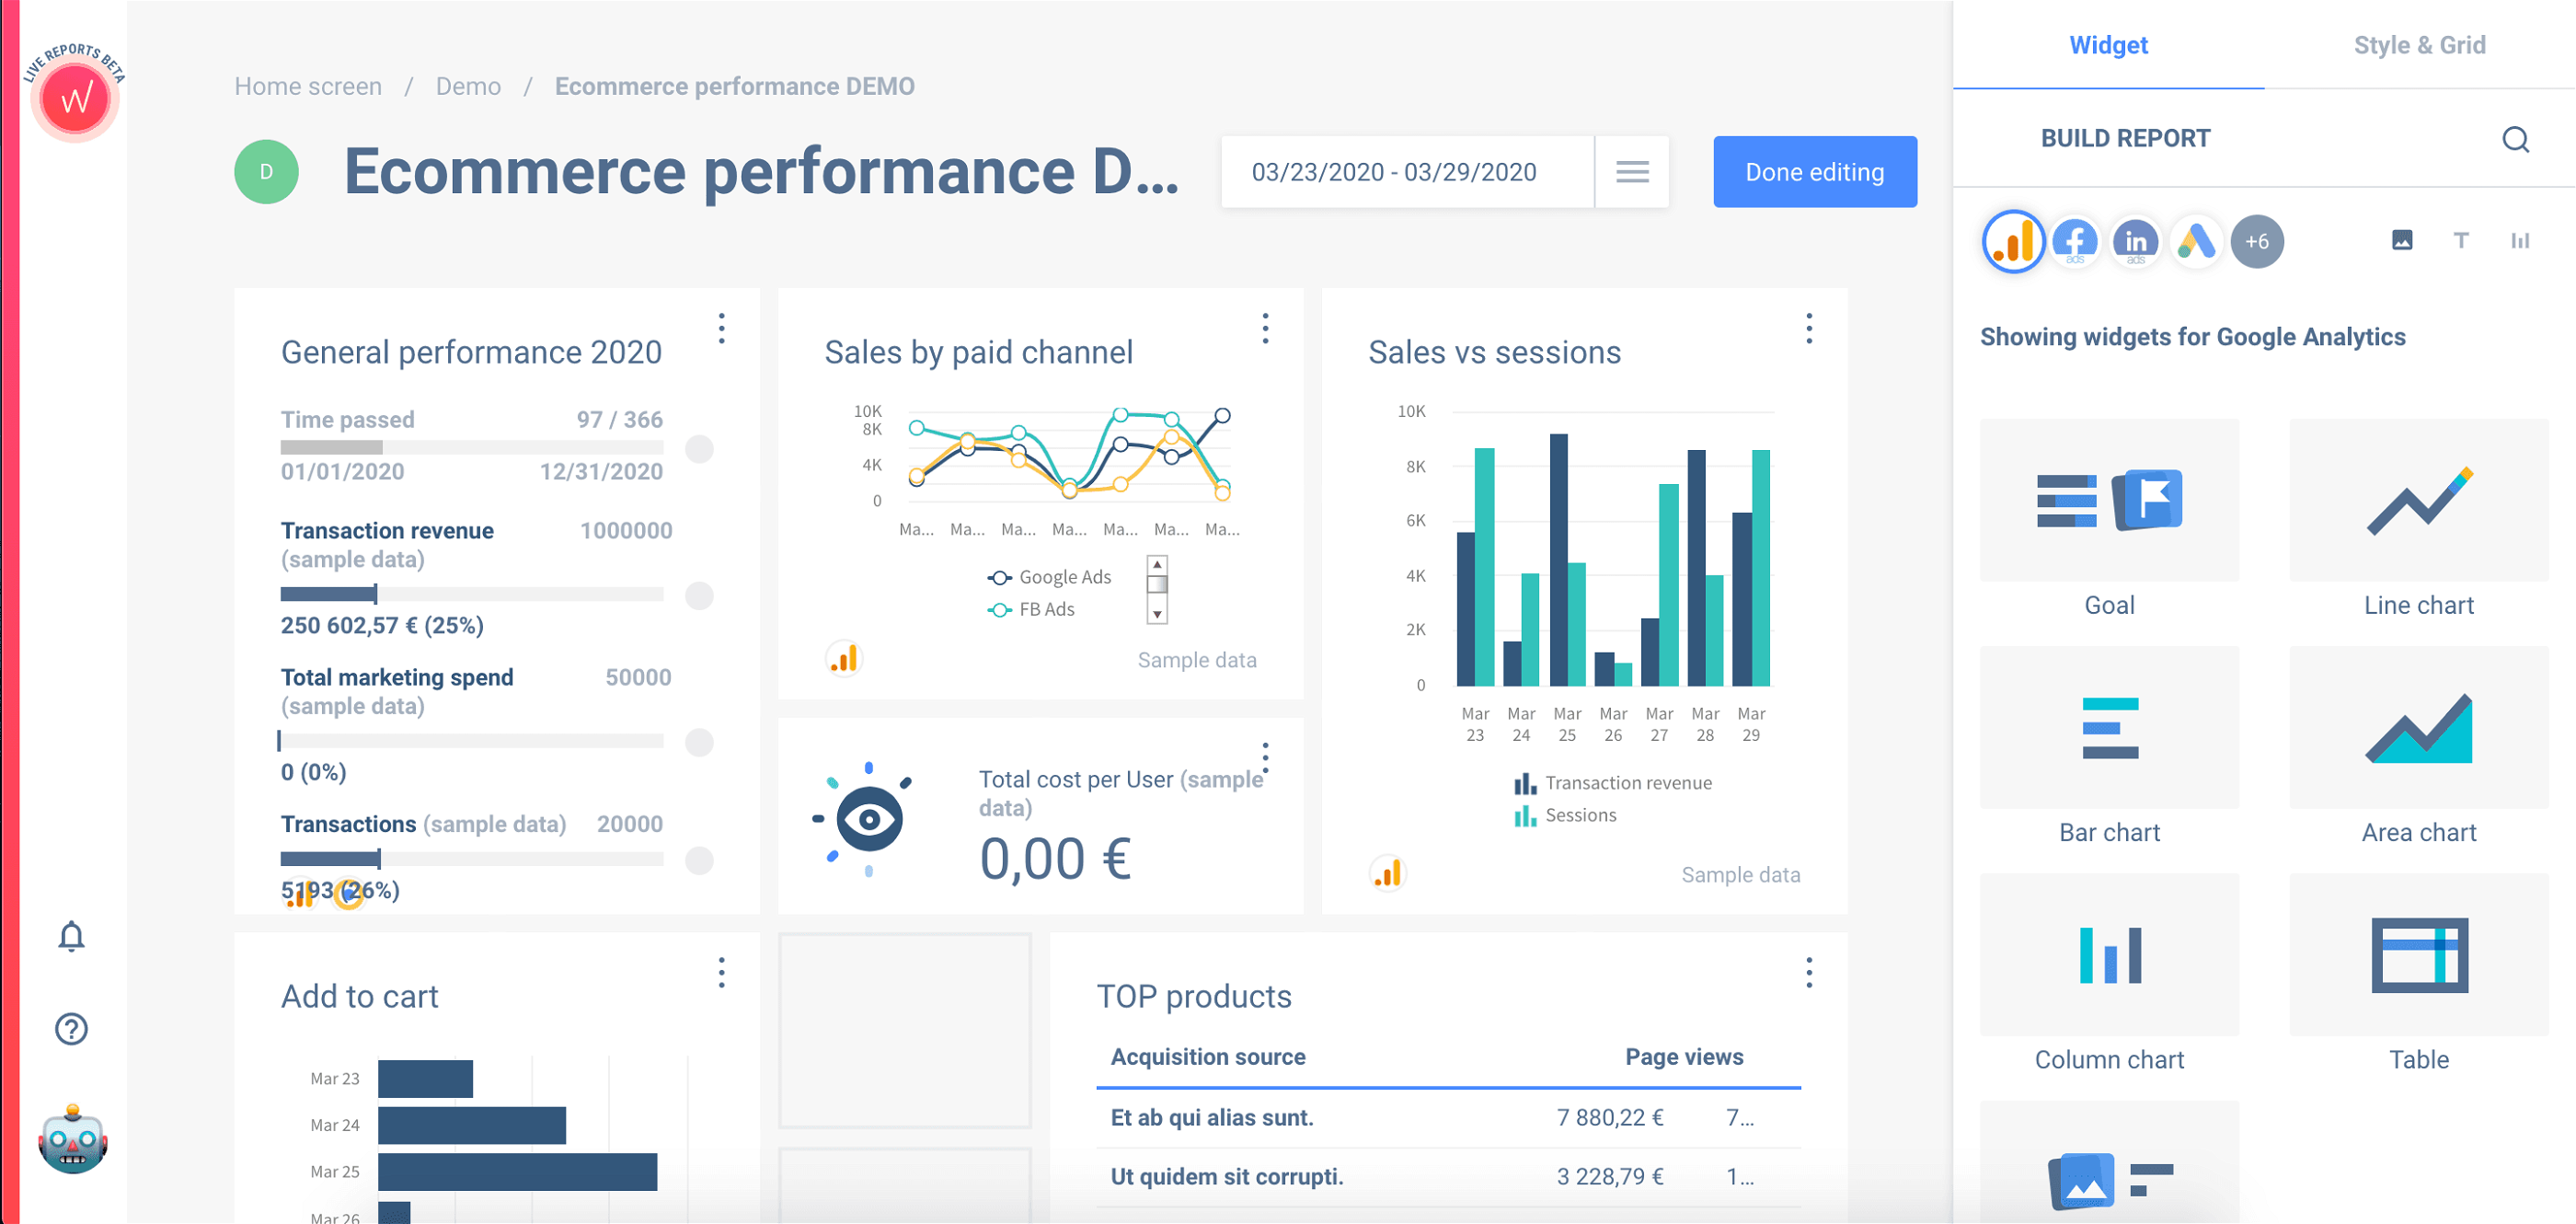
Typically, a sales report is a single space that presents sales data in a compact space. It includes the number of deals closed by each salesperson in a team, the quota attainment, the average deal size, sales funnel leakage, the total monthly sales for your organization, and many more. It basically features information that is crucial to your sales.
The sales dashboard/report is a tool that provides a comprehensive view of your key performance indicators while also revealing the method in which your sales team utilizes in monitoring and visualizing your business goals and revenue targets.
Many sales leaders make use of sales metrics to monitor your progress towards your business goals. Apart from that, it also helps them to make plans and precise decisions, award incentives, bonuses, adjust compensations and identify issues before they turn out to become more complex.
How Do You Create a Sales Dashboard?
What are the Sales Metrics to Track?
When it comes to creating a sales dashboard, the most challenging parts is to know where to begin. Do you have specific goals to attain? Are there specific targets you would like to meet?
A business dashboard is a useful tool to help you visualize your progress towards achieving these specific goals. But then, your first point of duty is to identify the specific sales metrics you’d like to track.
- What are your key performance indicators (KPIs)?
- Which metric do you always review whether in the company, among your sales team, or on one-on-one meetings?
- Do you consider some metrics essential than others?
- Do you find yourself amid multiple sales teams within your organization?
Either of the sales metrics you select from, it has to be classified in one or more of the following categories of metrics:
- Pipeline sales metrics
- Lead Generation sales metrics
- Primary conversion sales metrics
- Rep hiring and onboarding metrics
- Sales process, tool, and training adoption metrics
- Activity sales metrics
- Channel sales metrics
Map Out How the Dashboard Will Be Utilized
When it comes to a sales dashboard, there is no one-size-fits-all approach. So, you need to ascertain how the dashboard will be used and who will be in charge of using it.
Is it to help sales representatives track their progress towards their quota every month? Or probably it will be handled by the sales managers to oversee the activities of the top-performing sales representatives for the quarter?
Identifying how the dashboard will be utilized isn’t a complicated task.
- Who will handle the use of the dashboard? Is it your sales representatives, managers, executives, or VPs?
- How will it be used? Will they be carrying out a daily, weekly, or monthly dashboard review?
- What is the information they’ll like to see? Does it include the metrics, calculations, and visualizations?
One other essential factor you need to consider is where the dashboard will be viewed. For instance, if you have a unique sales team who will be working assiduously to ensure that everything runs smoothly.
Why not create a mobile-friendly version of the sales dashboard? This will ensure smoother visibility on computers, mobile phones, or tablets.
Choose a Specific Sales Dashboard Provider
If you’ve been conversant with the use of CRMs, you’ll observe that the software comes with a reporting feature. This reporting feature provides you with the opportunity to create dashboards for your team members.
If, otherwise, there is usually a standalone reporting tool from Whatagraph. This tool gives room for synchronization or smooth and hassle-free import of data in order to create live reports.
Pull the Required Data into the Dashboard
With CRM-integrated dashboards, there is a probability of easy and hassle-free synchronization of data between the CRM and your sales dashboard.
For instance, HubSpot CRM provides users with the opportunity to generate sales reports based on the database of their customers. In addition, users will be able to create a sales dashboard and report in order to smoothen the process of tracking sales performance, creating sales forecasts, identifying top-performing sales representatives, and many more.
In some scenarios, the process might be manual. Rather than CRM, if your team uses spreadsheets to manage and monitor both prospects and customers, there is a high chance that you’ll need to build your sales reports from scratch. Luckily, Whatagraph offers a perfect and more effective alternative to a dashboard as you would create live reports to monitor these activities.
The Bottom Line
The live reporting tool of Whatagraph is a powerful tool that reveals essential information in a small space as many dashboards do. And this information can serve as a guide to help you in your decision-making processes regardless of your rank or level in business.
Published on Apr 06 2020
WRITTEN BY
Indrė Jankutė-CarmaciuIndrė is a copywriter at Whatagraph with extensive experience in search engine optimization and public relations. She holds a degree in International Relations, while her professional background includes different marketing and advertising niches. She manages to merge marketing strategy and public speaking while educating readers on how to automate their businesses.