What is the difference between Reporting and Analytics?
There are two terms that we often hear in a corporate environment-"Reporting and Analytics." Both tend to be used interchangeably because they are in a way synonyms, but in reality, these are two distinct items or elements. The reason both reporting and analytics are closely linked is that they are tied to business intelligence and business performance.

May 28 2021 ● 7 min read

As a result, content strategists, marketing teams, sales teams, and web developers often provide reports on how their department or asset is performing. Here we will go over the types of reporting and analytics, in order to explain what each of them represents and how they are different. We will examine how each is valuable in its own right and provide some examples to help you distinguish these two terms from one another. Finally, we will mention how tools or software can be used for both reporting and data analysis.
What is Reporting?
When someone mentions reporting, it typically refers to the process of generating a report. and differs from creating dashboards. This report can be verbal or written or resemble a memo that details what happened in a certain instance. However, in the context of a marketing report or sales report, this is a process that involves compiling data, visualizing that data, and organizing it in a way that summarizes the performance of the team or efforts.
This means that reports provide an overview of the current situation, which also allows you to transform raw data you are aggregating into a format that's readable and easy to understand. Without continuous reports, there would be no relevant context for the data you are collecting. This way, you get to see if you are performing better or worse compared to a previous period.
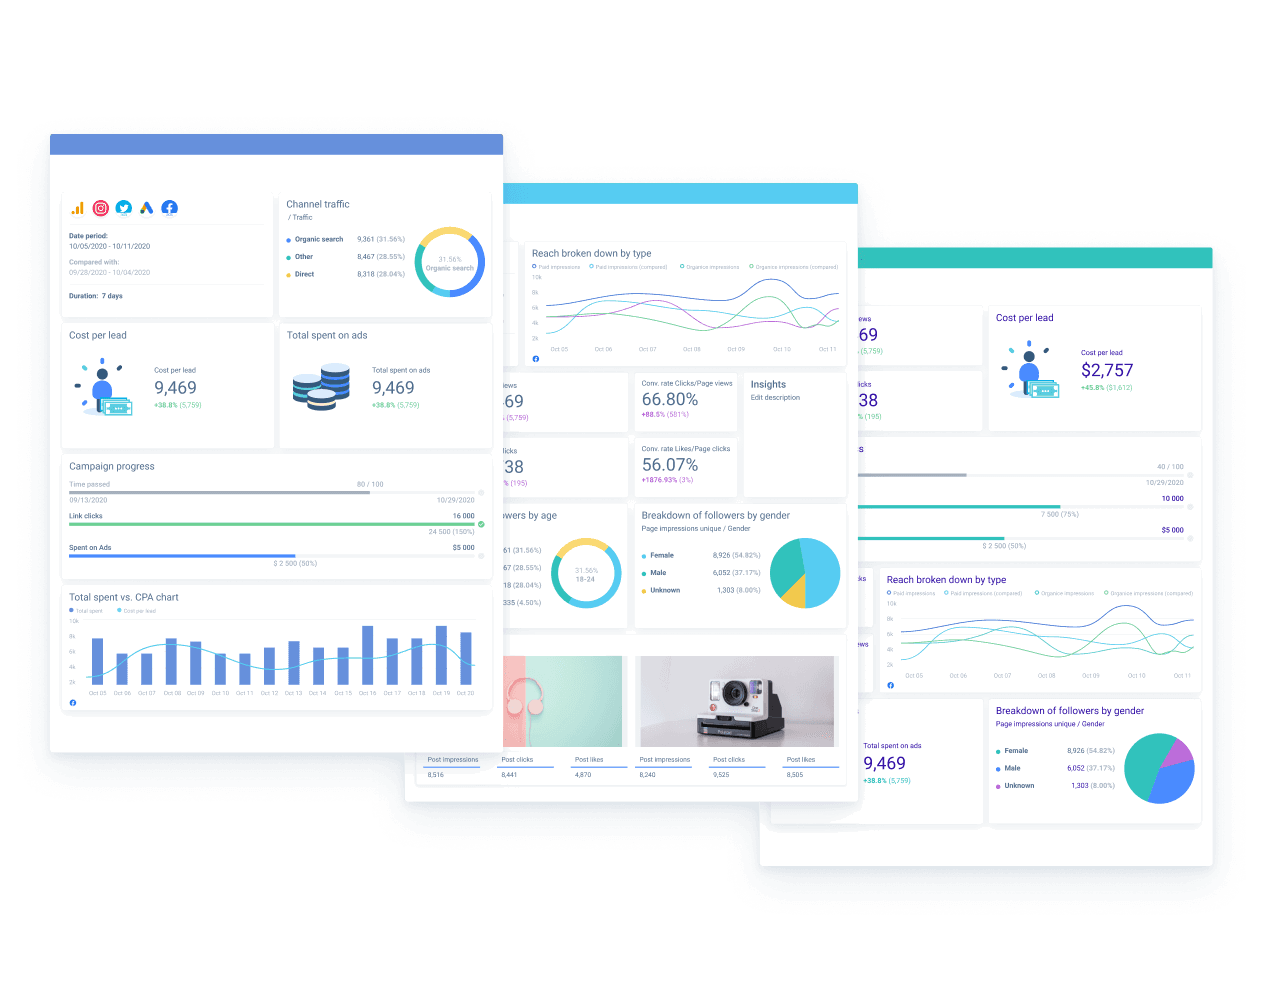
Today there are various tools that can help you generate the report and these tools also serve as data pipelines for aggregating information from multiple sources. This makes it a lot easier to visualize data, and all of the KPIs. By having strong visual elements as a central point of your report, you make it easier to read and understand. One of the tools is Whatagragh that is great for generating reports and gathering data from different platforms.
What is Data Analytics?
Analytics or data analytics is the process of using or applying data analysis. This means examining large volumes of complex data in order to gain a better understanding of it. In other words, much like reporting, it helps you understand data in a way that is more relevant for a certain context. However, there is a key difference between the two.
Reporting simply presents the situation, whereas analysis also interprets the numbers or data. In other words, the goal of the analysis is to provide you with relevant insights that can guide your future business decisions. To give you a concrete example, a report might suggest that 10% of the website visitors do not like your content, while data analysis and the analytical report try to identify the problems and provide an explanation why they don't like the content on your website. Answering these business questions also requires you to theorize and test your theories, which then involves even more data analysis.
Difference between Reporting and Analytics
Given the previous definitions and examples, it's easy to draw distinctions between these two terms, as far as corporate use is concerned. It's not really a question of whether you should use one or the other, it's simply that you cannot have one without the other, or much use of one without the other. Without reporting, you cannot perform accurate data analysis, whereas, without data analysis, you are not fully utilizing your reports.
This is why both of these are important components for a successful company and allow you to make better strategic decisions. Raw data is useless. You need to process it and give it meaning, but you also need to extract relevant information and actionable advice based on that meaning. You use reports to tell you where you stand and to create realistic goals. And you use data analysis to figure out how to achieve those goals.
Business Intelligence Tools for Monitoring Business Performance
We mentioned how collecting and transforming data is usually done via different tools for reporting. Manually collecting data and entering it into a specific software can be extremely time-consuming and tedious, which is why business intelligence tools are extremely useful.
The apps in question tend to have a wide spectrum of API connectivity, which allows them to interface with other data sources and funnel that data into centralized storage. The data is then transformed and visualized to form a neat report. The more detailed report, the better, obviously, but at the same time, you don't want to harm its readability. This is why there is a so-called drill-down feature or drill-down report.
A drill-down report basically allows you to gain a detailed understanding of every KPI that is present in the report, and give it more context. This drill-down approach is also necessary to gain a better understanding of the data and perform data analysis.
Whatagraph is a perfect example of everything mentioned here. It has integration features for social media, Google Analytics, Shopify, Google sheets, and Amazon, as well as many others. So if you are an online retailer, the Whatagraph covers all of the sales channels and marketing tools you are using. Moreover, you can automate report generation and customize how it looks, so board members and managers will be certainly pleased with the results.
One thing worth mentioning though is that big data analytics are difficult and require a lot of computing or processing power. As a result, some of the bigger corporations opt for developing in-house solutions for reporting and analytics software. This is because the data they work with is simply not covered by the software aimed at small and mid-size businesses, and they need to balance between the wants and needs of customers and stakeholders at the same time.
Reporting and Analytics Use Cases (Google Analytics)
Now let's go over an example of generating a report and also using that report to create or adjust your business strategy. For the purposes of this example, we will rely on Google Analytics, given how it gives you an in-depth overview of multiple metrics relevant to online presence and sales.
The insights you can gain by relying on GA are mostly related to customer behavior. So you can see how much time is spent on your website, where those leads are coming from, how well your ads are performing, whether they are attracting the right audience, and so on.
So let's say that your report tells you the number of daily users on your website has increased, but another report also tells you that there is no change in your daily or weekly revenue. In this case, you are clearly meeting one of your goals, which is to reach more potential customers, but failing at another goal to convert those visitors into paying customers. In order to do effective analysis in this case, you will need additional reports or metrics, like bounce rate, for example. If you notice that a large number of visitors leave the site immediately, you can begin to get a good idea of what is wrong.
In this instance, you would know where to look. Apparently, a large number of visitors don't find your offer relevant. So there are a couple of theories you can test.
- The website might be slow or not responsive in a particular region. It could be a server issue.
- Visitors already have better options in those regions, and the likelihood of converting them is low.
- The keywords you are using in your ads are misleading, so users are actually looking for something else when they click on your link.
- You don't offer services in those regions, yet the demand exists
- Your site is not localized for that audience, which may create trust issues
There can be other theories you can come up with, or you can simply view other metrics or reports that could disprove those theories. Whatever the case tracking these metrics clearly results in useful information that can dictate your next course of action.
Conclusion
To sum up, data analysis and reporting, and organizing data in general, are crucial elements for monitoring the efforts of your team members, making informed decisions, and improving your services. Predictive analytics offers both value and solutions that lead to customer success, better optimization of processes, and more productive employees.
More importantly, there is no difference between reporting and analytics in the sense that you should focus on one or the other. They work together to unify multiple data sources, provide relevant insights and help you reach qualified leads. Analytics explains the data you find in your reports and can help you avert revenue crises, and make more impactful decisions.
Published on May 28 2021

WRITTEN BY
Indrė Jankutė-CarmaciuIndrė is a copywriter at Whatagraph with extensive experience in search engine optimization and public relations. She holds a degree in International Relations, while her professional background includes different marketing and advertising niches. She manages to merge marketing strategy and public speaking while educating readers on how to automate their businesses.