How to Build a Client Dashboard: An Ultimate Guide for Agencies
Client dashboards are an integral part of the marketing reporting process thanks to their ability to provide clear, concise, and up-to-date insights into marketing performance. In this article, we will:
- Explain what makes a great agency client dashboard
- Share a few examples of best client dashboards
- Provide a step-by-step guide on building a dashboard that meets your clients’ needs
Whether you’re new to client dashboarding or looking to improve your existing process, this guide will give you the know-how needed to improve your reporting and deliver additional value to your clients.

Jul 11 2024●10 min read


What is a client dashboard?
A client dashboard is a modern dynamic data display used by marketing agencies to visualize data in an interactive way and automate the processes of informing clients on the latest developments in their marketing performance. On their end, clients can use these dashboards to make data-driven decisions.
The roles and benefits of using client dashboards for reporting
A client dashboard acts as a centralized platform for data visualization, performance tracking, and communication. In this sense, a client dashboard has multiple roles that static PDF reports can’t fill.
Real-time performance tracking
Client dashboards usually provide real-time access to key performance metrics and data. While the actual refresh time varies between different client dashboard software — often tied to pricing tiers — all of them allow marketers to monitor the effectiveness of their campaigns as they are unfolding. This kind of timely insight allows your team to make quick adjustments and optimizations.
Another linked benefit is that client dashboards display essential KPIs (key performance indicators) in a format that is easy to understand. This helps both marketers and clients keep track of progress towards goals and objectives.
However, keep in mind that not all dashboard solutions provide the options to change names of KPIs. When choosing your dashboard builder, make sure to check the level of customization that makes the displayed data digestible for non-technical users.
We use Whatagraph for all our client’s reports. The ability to title metrics differently is important to us, because we often report the same metrics to different clients and just need to call them differently, because many clients have internal terminology that is very different from one another.
Drew Cove - Senior SEO Manager @ DigitalParc
Improved trust and transparency
By presenting data in a transparent way, a client dashboard sets up clear communication between agencies and clients. With PDF reports, clients can always doubt if the agency is being completely honest or perhaps withholding unfavorable information — at least until they solve the problem.
With live dashboards, however, clients can exactly see the performance of their SEO, content, or paid advertising campaigns — how their marketing budget is used and what results are achieved.
This way, a client dashboard holds both the agency and the client accountable by clearly showing which strategies work and which don’t. As a result of transparency, both sides are motivated to establish a relationship based on trust and collaboration.
Data-driven decision making
Dashboards connect and visualize data from various sources, turning scattered data into actionable insights. Through different transformational features, marketers can easily (again, depending on the actual dashboarding platform) organize and visualize data so it feeds accurate decision-making, which in return leads to more effective strategies.
Coupled with a data warehouse, client dashboards can also present historical data and visualize it against current trends so your team can identify patterns and even predict future performance.
Saving time
By automating the process of data collection and reporting, client dashboards reduce the time and effort needed to compile reports manually, allowing marketing agency teams to focus on creative work and strategy optimization.
Market Solutions, a marketing agency from Sweden, managed to save 30% using Whatagraph to report to 150+ clients with a team of only 15 people.
In the past, the agency used PowerPoint presentations to report on their results. This way of reporting was far from practical. According to Karl-Viktor Jorkby, the Head of Digital Media Planning:
“It took us an average 5-10 hours to create a single report, which stood in the way of scaling and signing on new clients.”
Whatagraph solved Marketing Solutions’ problems with flying colors. Thanks to a large number of native integrations, the intuitive UI of the dashboard builder, and seamless dashboard sharing, Marketing Solutions was able to save from 3 to 7 hours on each report and successfully scale their operations.
“By automating our data collection and reporting, we have not only made our own operations more efficient, but above all improved our customers' access to information. They can now benefit in real time from deeper insights presented in a clear and user-friendly way. We can now together make faster and even better decisions!”
Andreas Sandgren - CEO @ Market Solutions
Greater client engagement and satisfaction
Many agency client dashboards have interactive elements that allow clients to explore the data on their own. When discussing the biggest pain points with agency experts, we often hear that client’s don’t care about the reports.
An interactive dashboard, on the other hand, allows clients to manipulate filters and date ranges themselves and feel more involved about their marketing campaigns. Still, keep in mind that a client can only feel engaged with the dashboard if it’s tailored to their specific needs and requirements. More about dashboard personalization in Best practices.
What does a client dashboard contain?
A client dashboard should be comprehensive. Ideally, your clients should be looking at one dashboard only and instantly see the progress of all your marketing campaigns. Next, the dashboard needs to be user-friendly so they can easily navigate through visualizations and feel confident exploring data. Finally, it should provide a complete explanation of the client's data in a language they can understand.
Let’s break down one client dashboard into the essential components.
Overview section
The overview section should provide the executive summary and KPI goals. It should act as a high-level brief of the overall performance, key highlights, and most important takeaways. Whatagraph dashboards, for example, allow you to include a text widget into this section so you can explain in plain language what is the current status.
This section should display KPIs such as conversion rates, ROI, and customer acquisition cost, so clients can immediately assess the health and effectiveness of their marketing efforts.
Traffic and audience metrics
Clients may grasp the big picture more easily if you present the audience and traffic metrics together.
As for the website traffic, you should display total visits, unique visitors, page views, and bounce rate. These are the essential metrics that cover website performance and identify trends in user behavior.
You should also have a widget that breaks down traffic by source, for example organic, paid, social, direct, or referral. It will help you inform the clients where visitors are coming from and which channels are most effective.
Audience demographics should include the age, gender, location, and interests of the audience, so you can better understand who is interacting with the client’s content so you can adjust marketing strategies accordingly.
Engagement metrics
In this part of the client dashboard, you should present social media engagement and the performance of your email campaign.
For social media engagement, give visual representations of likes, shares, comments, and followers across different social media platforms. As for the email campaign effectiveness, the best way to evaluate your success and identify areas for improvements is by analyzing open rates, click-through rates, bounce rates and unsubscribe rates.
Conversion metrics
This section is the core of your client dashboard, where you present how successfully your agency is generating leads and ultimately revenue for your clients.
Measure the effectiveness of lead generation efforts by tracking the number of leads, lead sources and lead quality.
Sales and revenue metrics will allow clients to track the financial performance of your marketing campaigns and overall profitability. They’ll be most interested in total sales, revenue generated, average order value, and customer lifetime value.
Make sure that clients understand at this point that conversion rate will vary for various stages of the funnel. On your part, you can use the dashboard to identify bottlenecks in the conversion process and optimize for better results.
Campaign performance
In this section you will present the most important metrics for individual campaigns, such as impressions, clicks, and conversions. By analyzing campaigns side by side, you can quickly identify which one has slowed down and needs your attention the most.
You should also include the ad performance widget. Through metrics such as click-through rate (CTR), cost per click (CPC), cost per acquisition (CPA), and return on ad spend (ROAS), both you and your clients should be able to see which PPC channel is most efficient.
SEO and content performance
Although most clients will be interested in the engagement and conversion metrics primarily, no client dashboard is complete without organic performance insights.
A table with ranking positions for target keywords and their changes over time will showcase the success of your SEO efforts and at the same time identify opportunities for improvement. To make your link-building strategy totally transparent as well, display the number and quality of backlinks, referring domains, and link growth over time.
To evaluate the effectiveness of content marketing, make sure to include page views, time on page, social shares, and conversion rates for blog posts and other content categories.
What dashboard elements to use?
Customizable widgets: If the client dashboard software is flexible enough to allow you to customize individual widgets, you can easily tailor your visualization to the specific client needs and preferences. In Whatagraph, you can directly manage data sources for each widget, apply different filters and calculations, as well as change the metrics and dimensions names, so they correspond to your client’s internal terminology.
Visualizations: Deciding which visual representations of data to use for which metrics can be challenging unless the dashboard tool helps you a bit. Whatagraph already comes with pre-made visualization for each data source so you can quickly drag-and-drop all data points to your dashboard, without having to figure out which graph or chart to use for which metric. You can also create your own visualizations from scratch by picking all components by hand and saving them as widget templates.
Comments and annotations: Whatagraph also makes it super easy to add any textual comments, explanations, or suggestions to any part of your dashboard. Just create a text widget and drag it wherever you want. All widgets are resizable and stick conveniently to the grid so you can easily find a way to fit the text box where needed. These text widgets are useful for explaining significant changes, trends, or anomalies in your data. You can also use them to suggest changes or new approaches to your strategy.
How to build client marketing dashboards?
Here are the 6 steps for building an effective client marketing reports dashboard:
- Identify client needs and goals
- Choose the right software
- Select key marketing KPIs
- Design the dashboard layout
- Connect data sources
- Test and refine the dashboard
Let’s explain each step in more detail.
But if you're more of a visual type, we have a video explaining how to build a client dashboard:
Step 1: Identify client needs and goals
By this point, you’ve met with your clients to learn more about their business and discussed their business objectives. Note down the specifics:
- What outcomes are they looking to achieve?
- Who will be using the dashboard?
- What decisions will it help them make?
Also, identify key challenges and pain points the client is facing in their marketing efforts.
- What are the main obstacles to achieving your marketing goals?
- Are there specific metrics or data points that are difficult to measure?
Next, work with the client to define what success looks like and which metrics will signal progress toward their goal.
However, if a client is not too marketing-savvy, you’ll have to do this part yourself. Still, you can always ask them:
- What are the critical KPIs for your business?
- How often do you need updates?
Step 2: Choose the right software
When choosing the right client dashboard software, you should consider several key factors. However, a few requirements are universal for any agency client dashboard:
- Ease-of-use: Can be used without technical expertise
- Flexibility: Adapts to a wider range of client requirements
- Great integration capabilities: Supports a wider range of client data sources
Let’s begin with integrations.
Evaluate integration capabilities
Make sure that the client dashboard software you choose can connect all necessary data sources. This means several web analytics tools headed by Google Analytics 4, SEO tools, social media platforms, paid advertising tools — social, display, and programmatic — e-commerce, email marketing platforms, and CRMs.
Whatagraph has an advantage over many other platforms because it has direct integrations with 50+ popular marketing data sources. In addition, it lets users connect any other data source via Google Sheets, BigQuery, or Custom API.
Once you connect your clients' sources to a dashboard, the data flows automatically and refreshes every 15 minutes or less.
Assess customization and flexibility
In contrast to in-house marketing teams, agencies serve a wide pool of clients, so the client dashboard software needs to be customizable to meet specific needs.
What exactly does this mean?
- Any dashboard template, whether pre-made or created by your team, should be easily adaptable to another client's use case.
- The dashboard should offer the full spectrum of white label and custom branding options, including being hosted on a custom domain and having changeable logos and brand colors.
- Whatagraph goes even further, allowing users to change the color scheme of chart and graph fields.
- As already mentioned, different clients may have different metric name conventions, so the dashboard should allow quick and scalable metric renaming across sources.
- Adding new or removing old sources should be fast and intuitive. Plug in - plug out.
Analyze reporting and visualization features
Today’s best client dashboard tools support visualizations like bar charts, line charts, funnels, etc. However, what separates truly useful dashboards from average ones is the visualizations' interactivity and customization options of individual visualizations.
You can customize every visualization widget in Whatagraph by applying custom filters, changing the visualization type, adding more sources to the visualization, blending the source data on the widget level, and changing the metrics' names so they are more understandable for specific clients.
Sharing Whatagraph dashboards is easy and straightforward. Just share the live link, and clients can access their dashboard from anywhere.
Consider scalability and performance
It’s also important to ensure that the software can grow with your agency. This not only means handling an increasing amount of data as your client base grows but also if the pricing plan towers can accommodate growth and still be feasible.
An advantage of picking Whatagraph to create your agency dashboard is that you can create an unlimited number of dashboards even with the basic pricing plans. In contrast, some alternatives condition you to move to a more expensive plan if you want more than 15, 30, … dashboards, for example.
How the dashboard performs with increased data sources and widgets is also an important factor.
Looker Studio, for example, is known to get slow even with 2 blended data sources, while in Whatagraph, you can have a dashboard with 10 blended sources and 100 widgets and still don’t see any drop in speed.
Finally, scalability also includes time-saving features. Whatagraph has multiple features built specifically so marketing agency users can save time while reporting to a number of clients.
This includes bulk dashboard edits, an ability to save anything you create down to a single widget or calculation as a template, and the Overview feature — a single dashboard with any metrics from any of your agency’s dashboards.
Check customer support
As your agency grows, there’s little time to lose on fixing bugs or learning how to do things the hard way. Don’t settle for anything less than live support, which can help you move the obstacle in minutes and ensure minimum downtime for your dashboard.
You’ll be happy to hear that apart from useful tutorials and video help sections, Whatagraph has a 20/5 live chat support standing by to answer any questions and help you create anything you need.
By covering all marketing agency client reporting needs, Whatagraph positions itself as a prime client dashboard solution. From direct integrations to stunning visualizations to intuitive UI and ease of use, it has everything you need to provide accurate performance tracking and stellar client experience.
Book a demo of Whatagraph and see how Whatagraph can improve your dashboarding workflows.
Step 3: Select key metrics and KPIs
This choice will largely depend on the type of dashboard and data sources it reports on. For more information, you can refer to the earlier section What does a client dashboard contain? However, no matter which KPIs you decide to include, make sure to agree on this with the client before you start building the dashboard.
Step 4: Design the layout
You can create the dashboard layout from scratch or use a pre-made client dashboard template. With Whatagraph, there’s no need to use wireframing tools or paper sketches. Simply start from a blank dashboard and drag and drop everything you need to the page. Move the visualizations around, resize them, or replace them as you go. The dashboard builder is intuitive, and you can always check the preview to see what your clients will see.
On the other hand, you can choose between 70 ready-made Whatagraph dashboard designs which are created with user experience in mind and according to best reporting practices to prioritize the most important data while avoiding clutter.
Step 5: Integrate data sources
How easy or challenging this step will be also depends on the dashboard tool you choose. If you’re going with third-party data connectors, you risk mismatched performance, speed issues and uneven level of technical support, depending on the specific connector vendor.
However, your job can be made easy if you use direct or native integrations, such as those built by the Whatagraph team. Adding a new data source to your dashboard takes a few clicks, while the integrations are fully managed without any need for maintenance on your side.
Step 6: Test and refine the dashboard
This step is more important for those agencies that build client dashboards using several tools that may or may not be fully compatible without developer workarounds. In that case, it makes sense to test the dashboard internally so you can identify any issues or areas for improvement.
However, if you choose an all-in-one platform like Whatagraph, there’s no need to test or troubleshoot. When data integration, organization, and visualization take place within one fully managed platform, every dashboard works seamlessly on both ends.
4 client dashboard examples
Here are the four client dashboard examples that can give you an idea of how to build your own. However, if your clients prefer month-on-month or quarterly reporting so they can see the incremental growth of their KPIs, you may consider building a client report instead. This article explains client reporting in more depth and provides several examples of client reports.
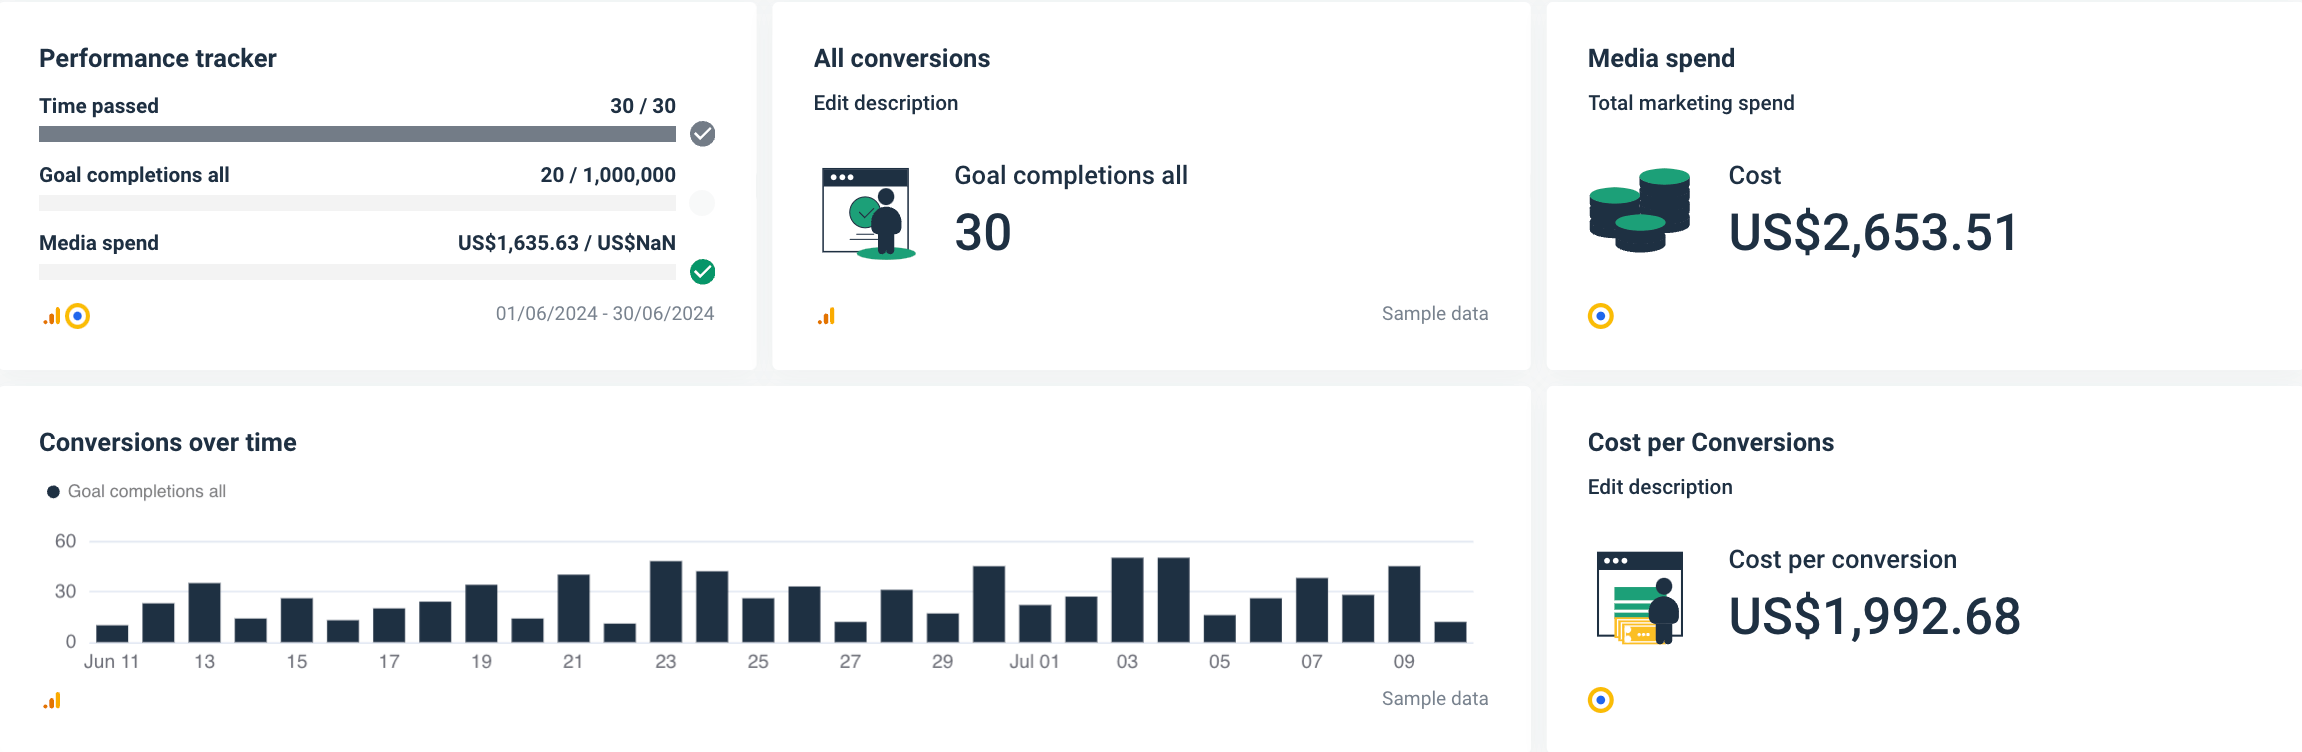
1. Cross-channel client dashboard
A cross-channel dashboard is the most effective way of reporting for most clients. For example, a cross-channel client dashboard can help you present the impact of different marketing initiatives and long-term projects, such as search engine optimization, social media, paid advertising, and content campaigns.
What insights can your clients get from a cross-channel dashboard?
- Overall website analytics
- A reminder of goals to pursue
- Completed goals
- Overall campaign performance
Where to get this data from?
- Google Analytics 4
- Social media
- Ads platforms
- SEO tools
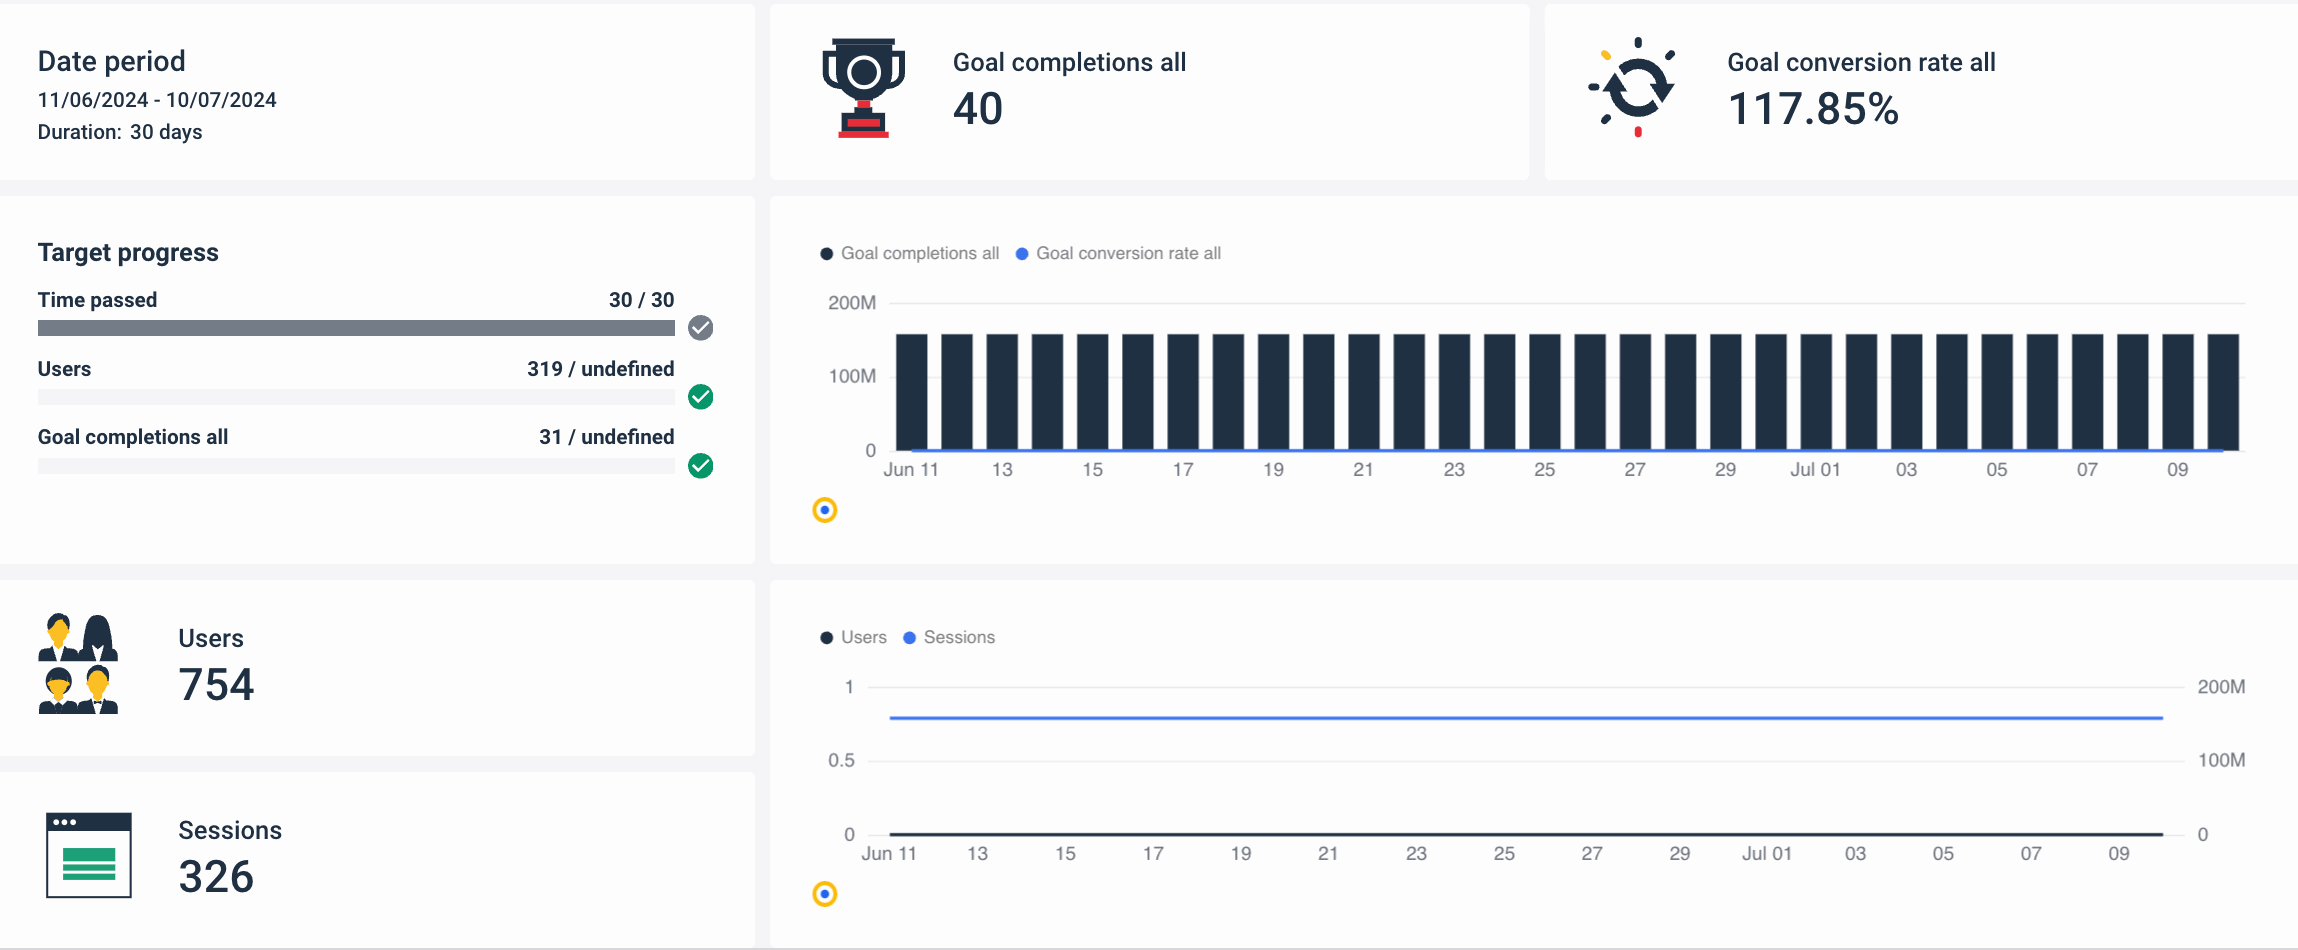
Whatagraph’s cross-channel dashboard has seven sections:
- Performance Overview: Progress bar chart with time passed, goal completions, as well as widgets for media spend, conversions, and cost per conversion.
- Acquisition Overview: Top channel conversions vs. users (direct, organic, paid, referral).
- Website Overview: A new users vs. user graphs, gauges for bounce rate, average session duration, and page performance.
- Audience Overview: Users per device, demographics, and interests as in-market segments.
- Google Ads Overview: Time passed, impressions, clicks, conversions, and cost.
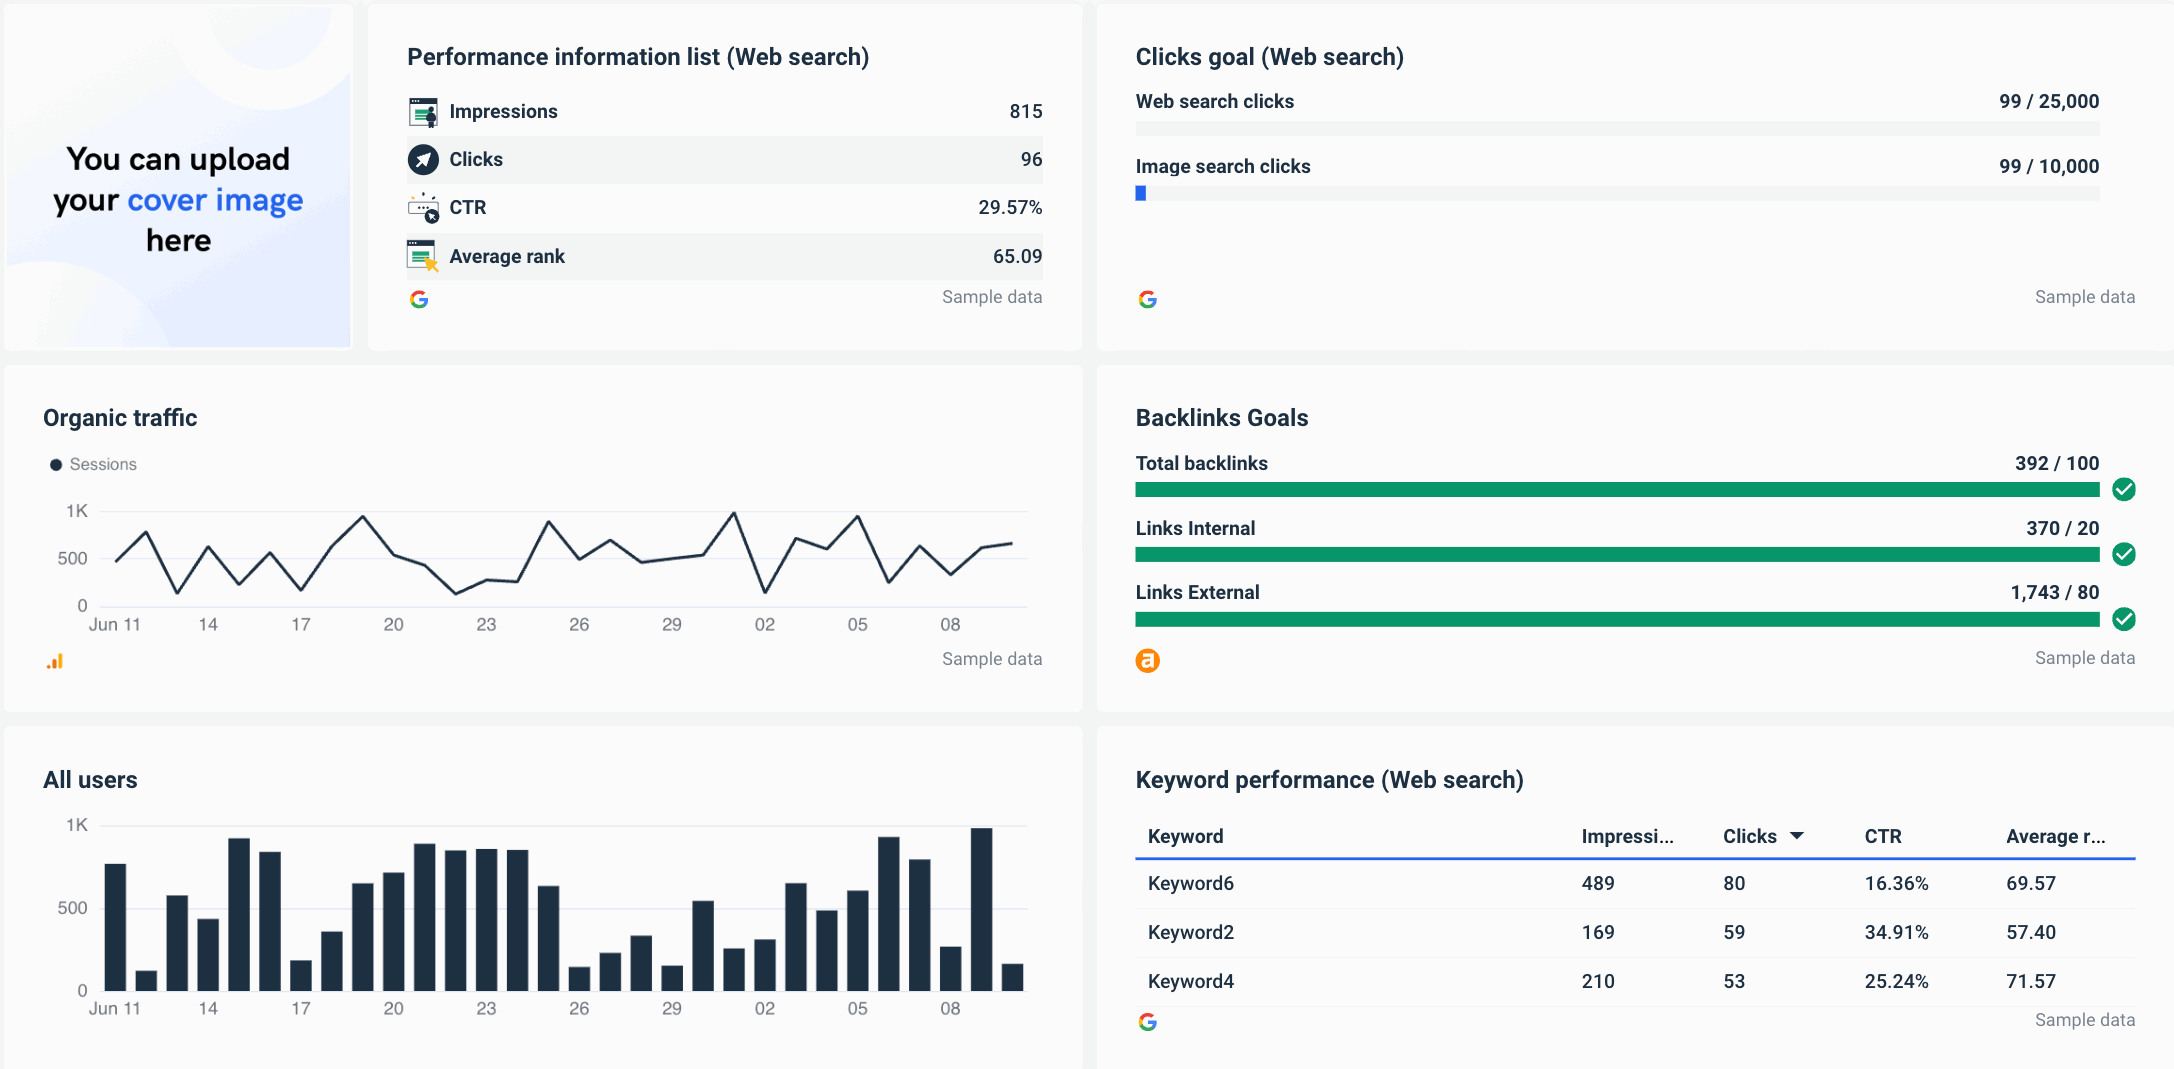
- Organic Traffic Overview: Time passed, users, new users, average rank, goal completions, and conversion rate.
- Facebook Ads Overview: Time passed, impressions, link clicks, pixel leads, conversions, cost per conversion, and total spend.
An additional benefit of using this cross-channel dashboard is that you can monitor and optimize the performance of individual clients’ channels without deep exploration of each channel individually.
Instead, you can quickly present your clients with the most important key performance indicators and give an accurate report on your progress.
2. PPC client dashboard
A PPC client dashboard allows you to organize your clients’ paid ads data by tracking and monitoring important KPIs such as:
- Clicks
- Cost
- Impressions
- Click-through rate (CTR)
- Conversion rates
- Cost-per conversion
In addition, it helps you optimize the clients’ paid media campaigns by:
- Removing keywords that aren’t performing
- Leaving out keywords that aren’t generating traffic
- Replacing keywords that haven’t got any impressions
- Stopping using seasonal keywords and those with a low-quality score
Where to get this data from?
- Facebook Ads
- Google Ads
- LinkedIn Ads
- Snapchat Ads
- etc.
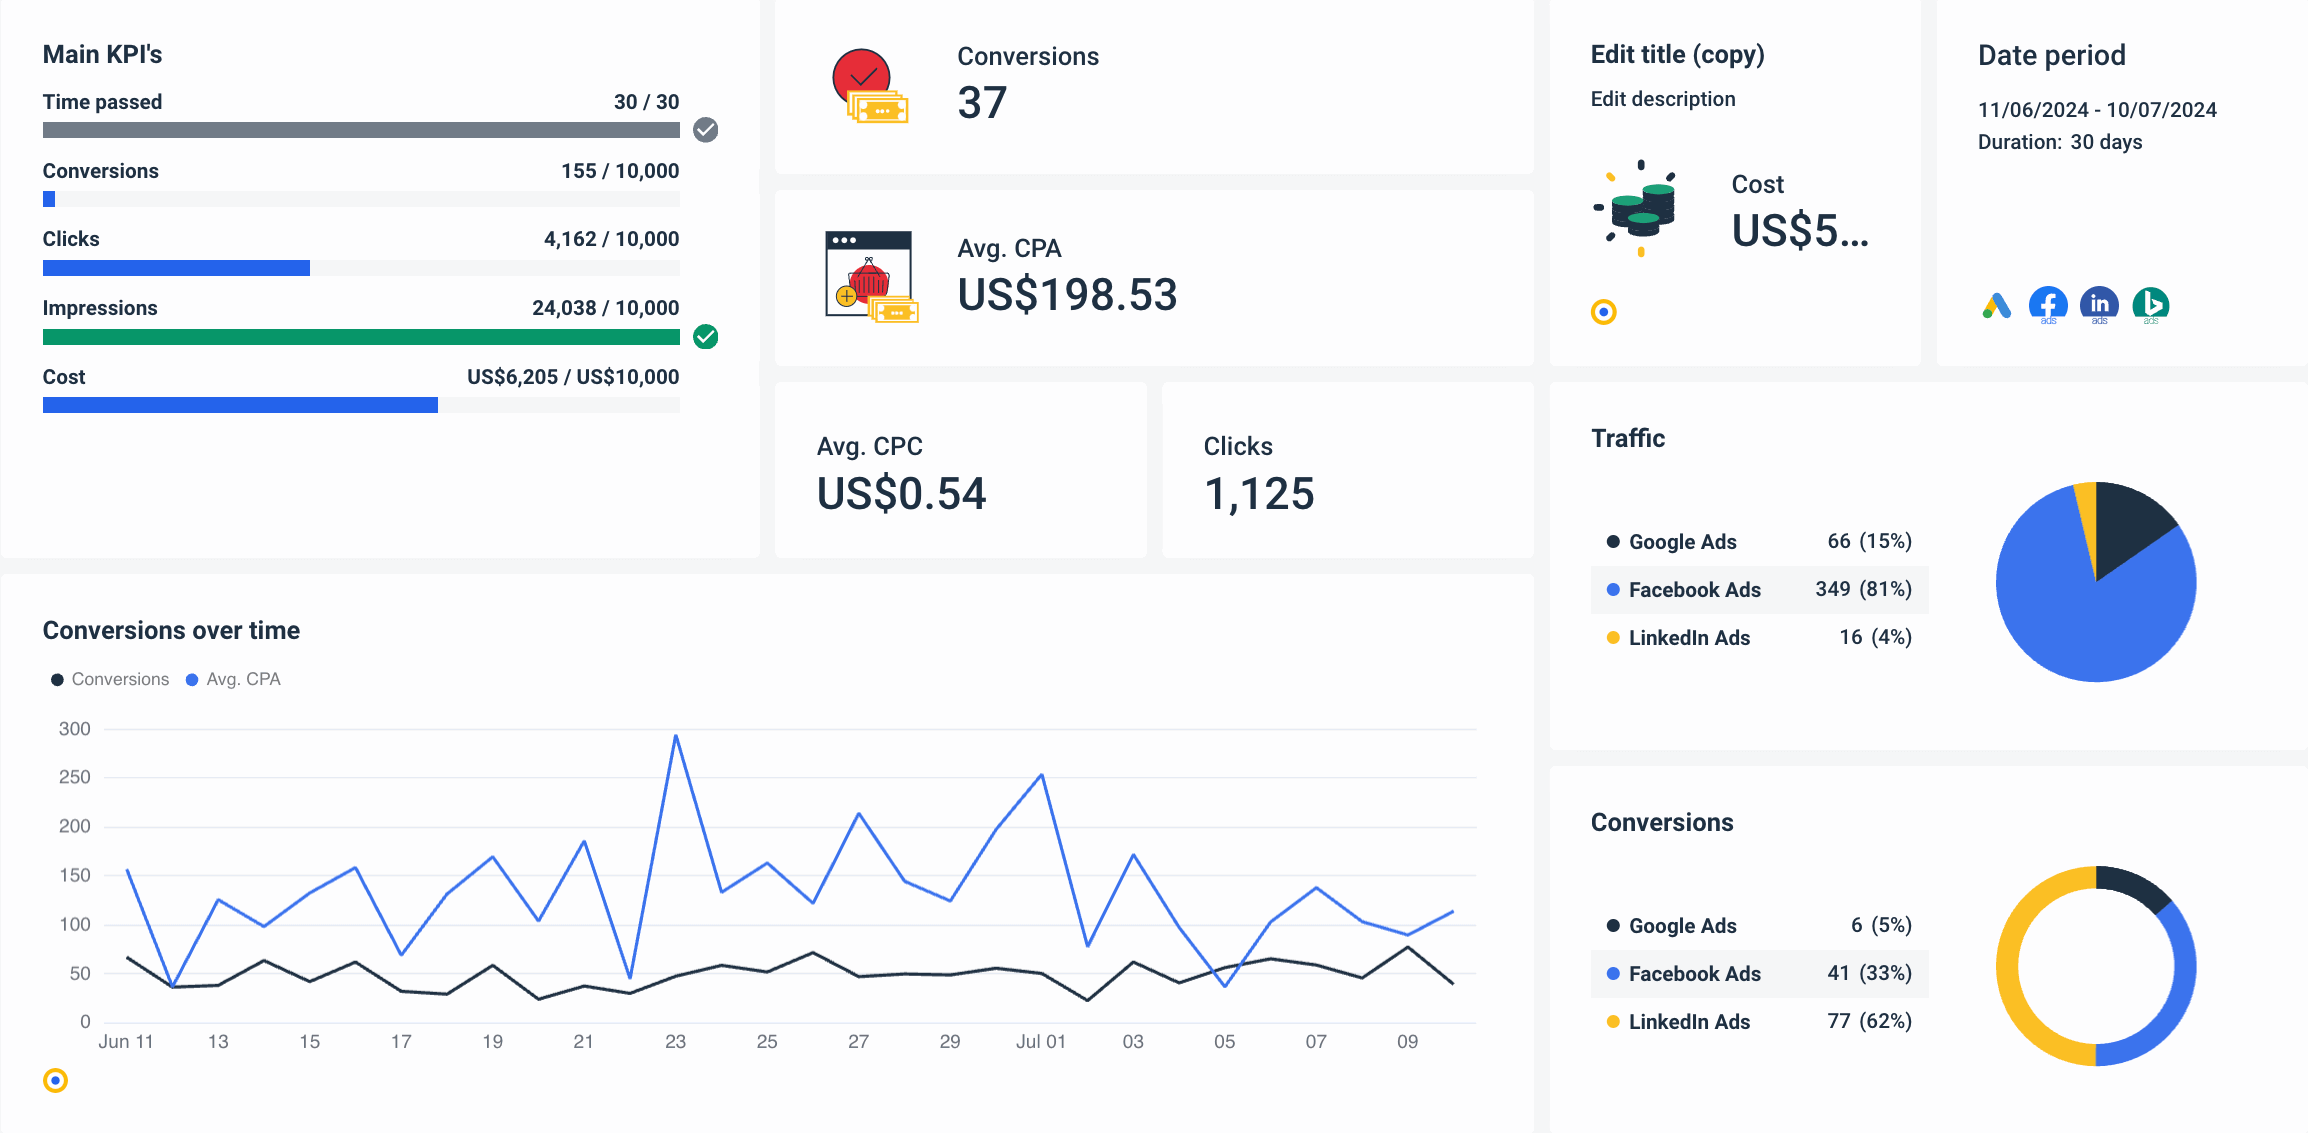
PPC is one of the favorite marketing strategies for many agencies, mainly because the ROI is so easy to track. However, tracking all the client data sources separately only to combine metrics in a third tool is too complicated.
Instead, you can use Whatagraph and collect key metrics from different ad platforms and consolidate the results into main KPIs
Find our more tips on how to build a PPC dashboard for your agency in our separate guide.
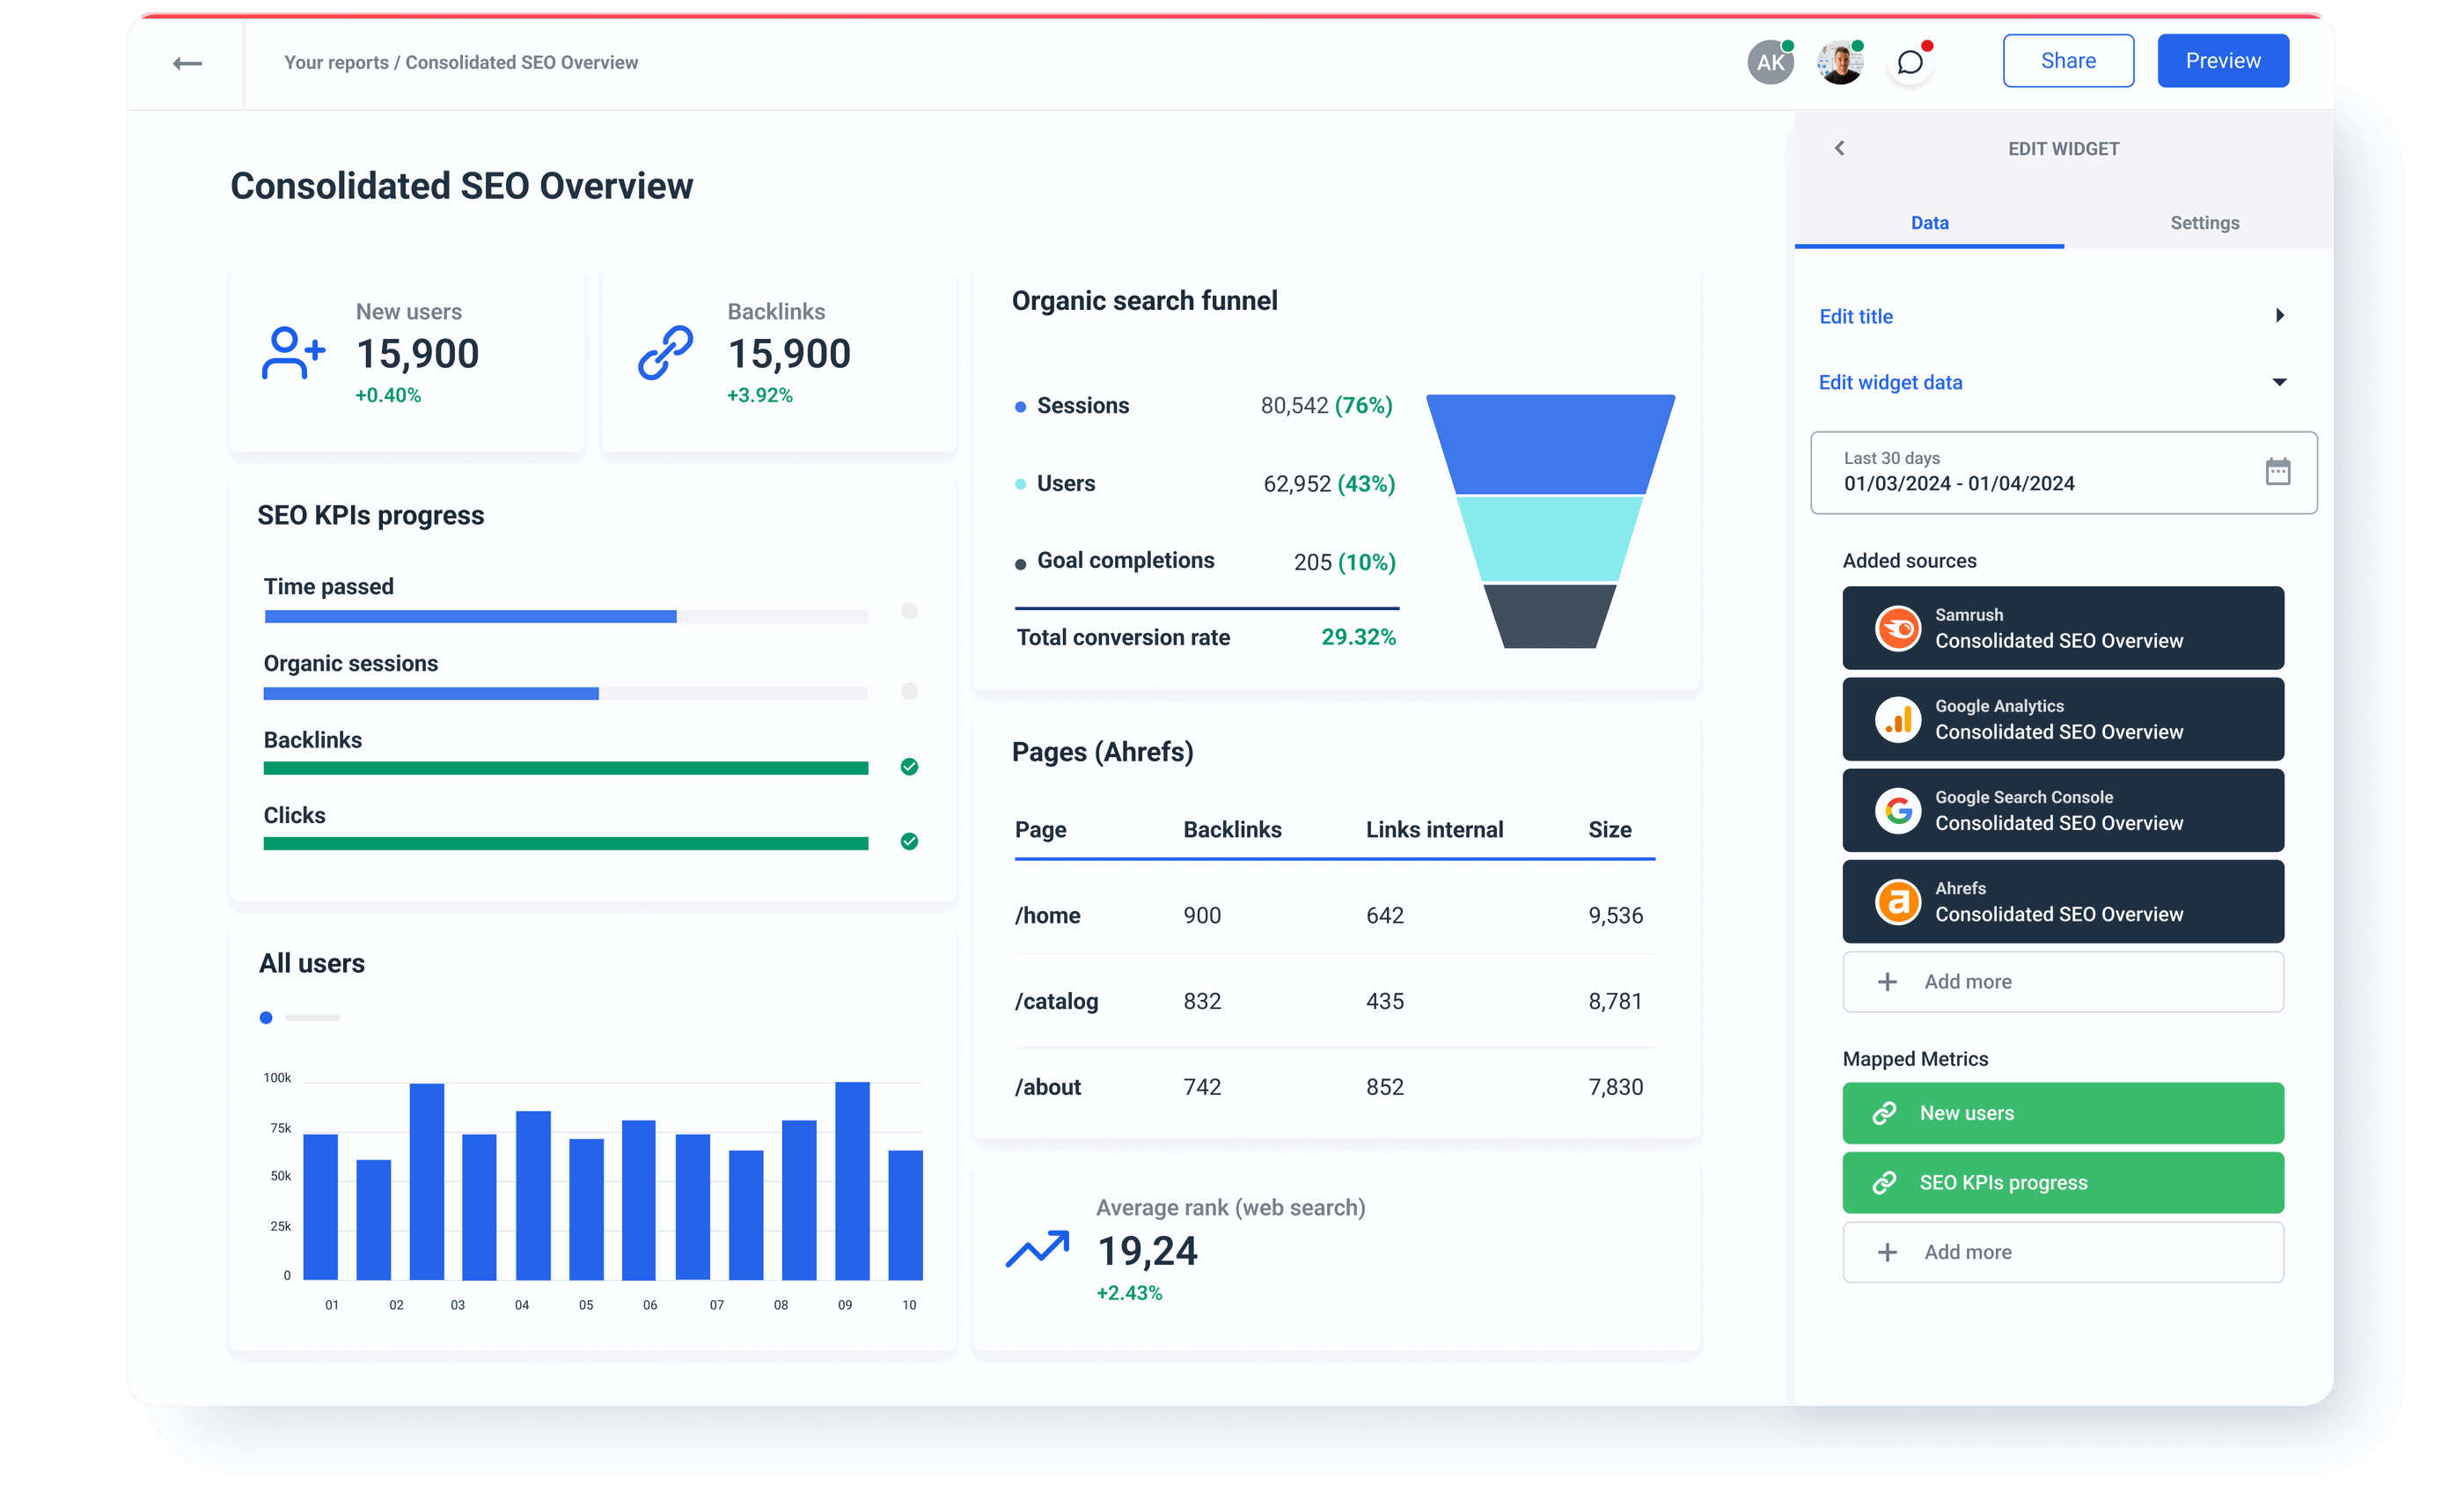
3. SEO client dashboard
An SEO client dashboard is where your clients can see how their website performs in terms of SEO metrics, such as organic traffic, backlinks, technical SEO, etc. While some clients will ask you to summarize all aspects of your SEO efforts in the general, cross-channel dashboard, others prefer a separate dashboard.
What insights can your clients get from an SEO dashboard?
- Changes in website traffic
- The difference between organic traffic and other sources
- The ratio of branded vs. non-branded traffic
- Keywords that are driving most visits
- Status of organic rankings
- Overall backlink profile
- Any technical SEO issues
Where to get this data from?
- Google Analytics for traffic-related data
- Google Search Console
- Ahrefs, Semrush, and other SEO tools
However, combining SEO metrics from different tools in spreadsheets can be challenging even for experts. Luckily, everyone in your agency can connect the client’s data sources to an SEO dashboard and start client reporting immediately.
Here’s a more comprehensive guide on how to build an SEO client dashboard.
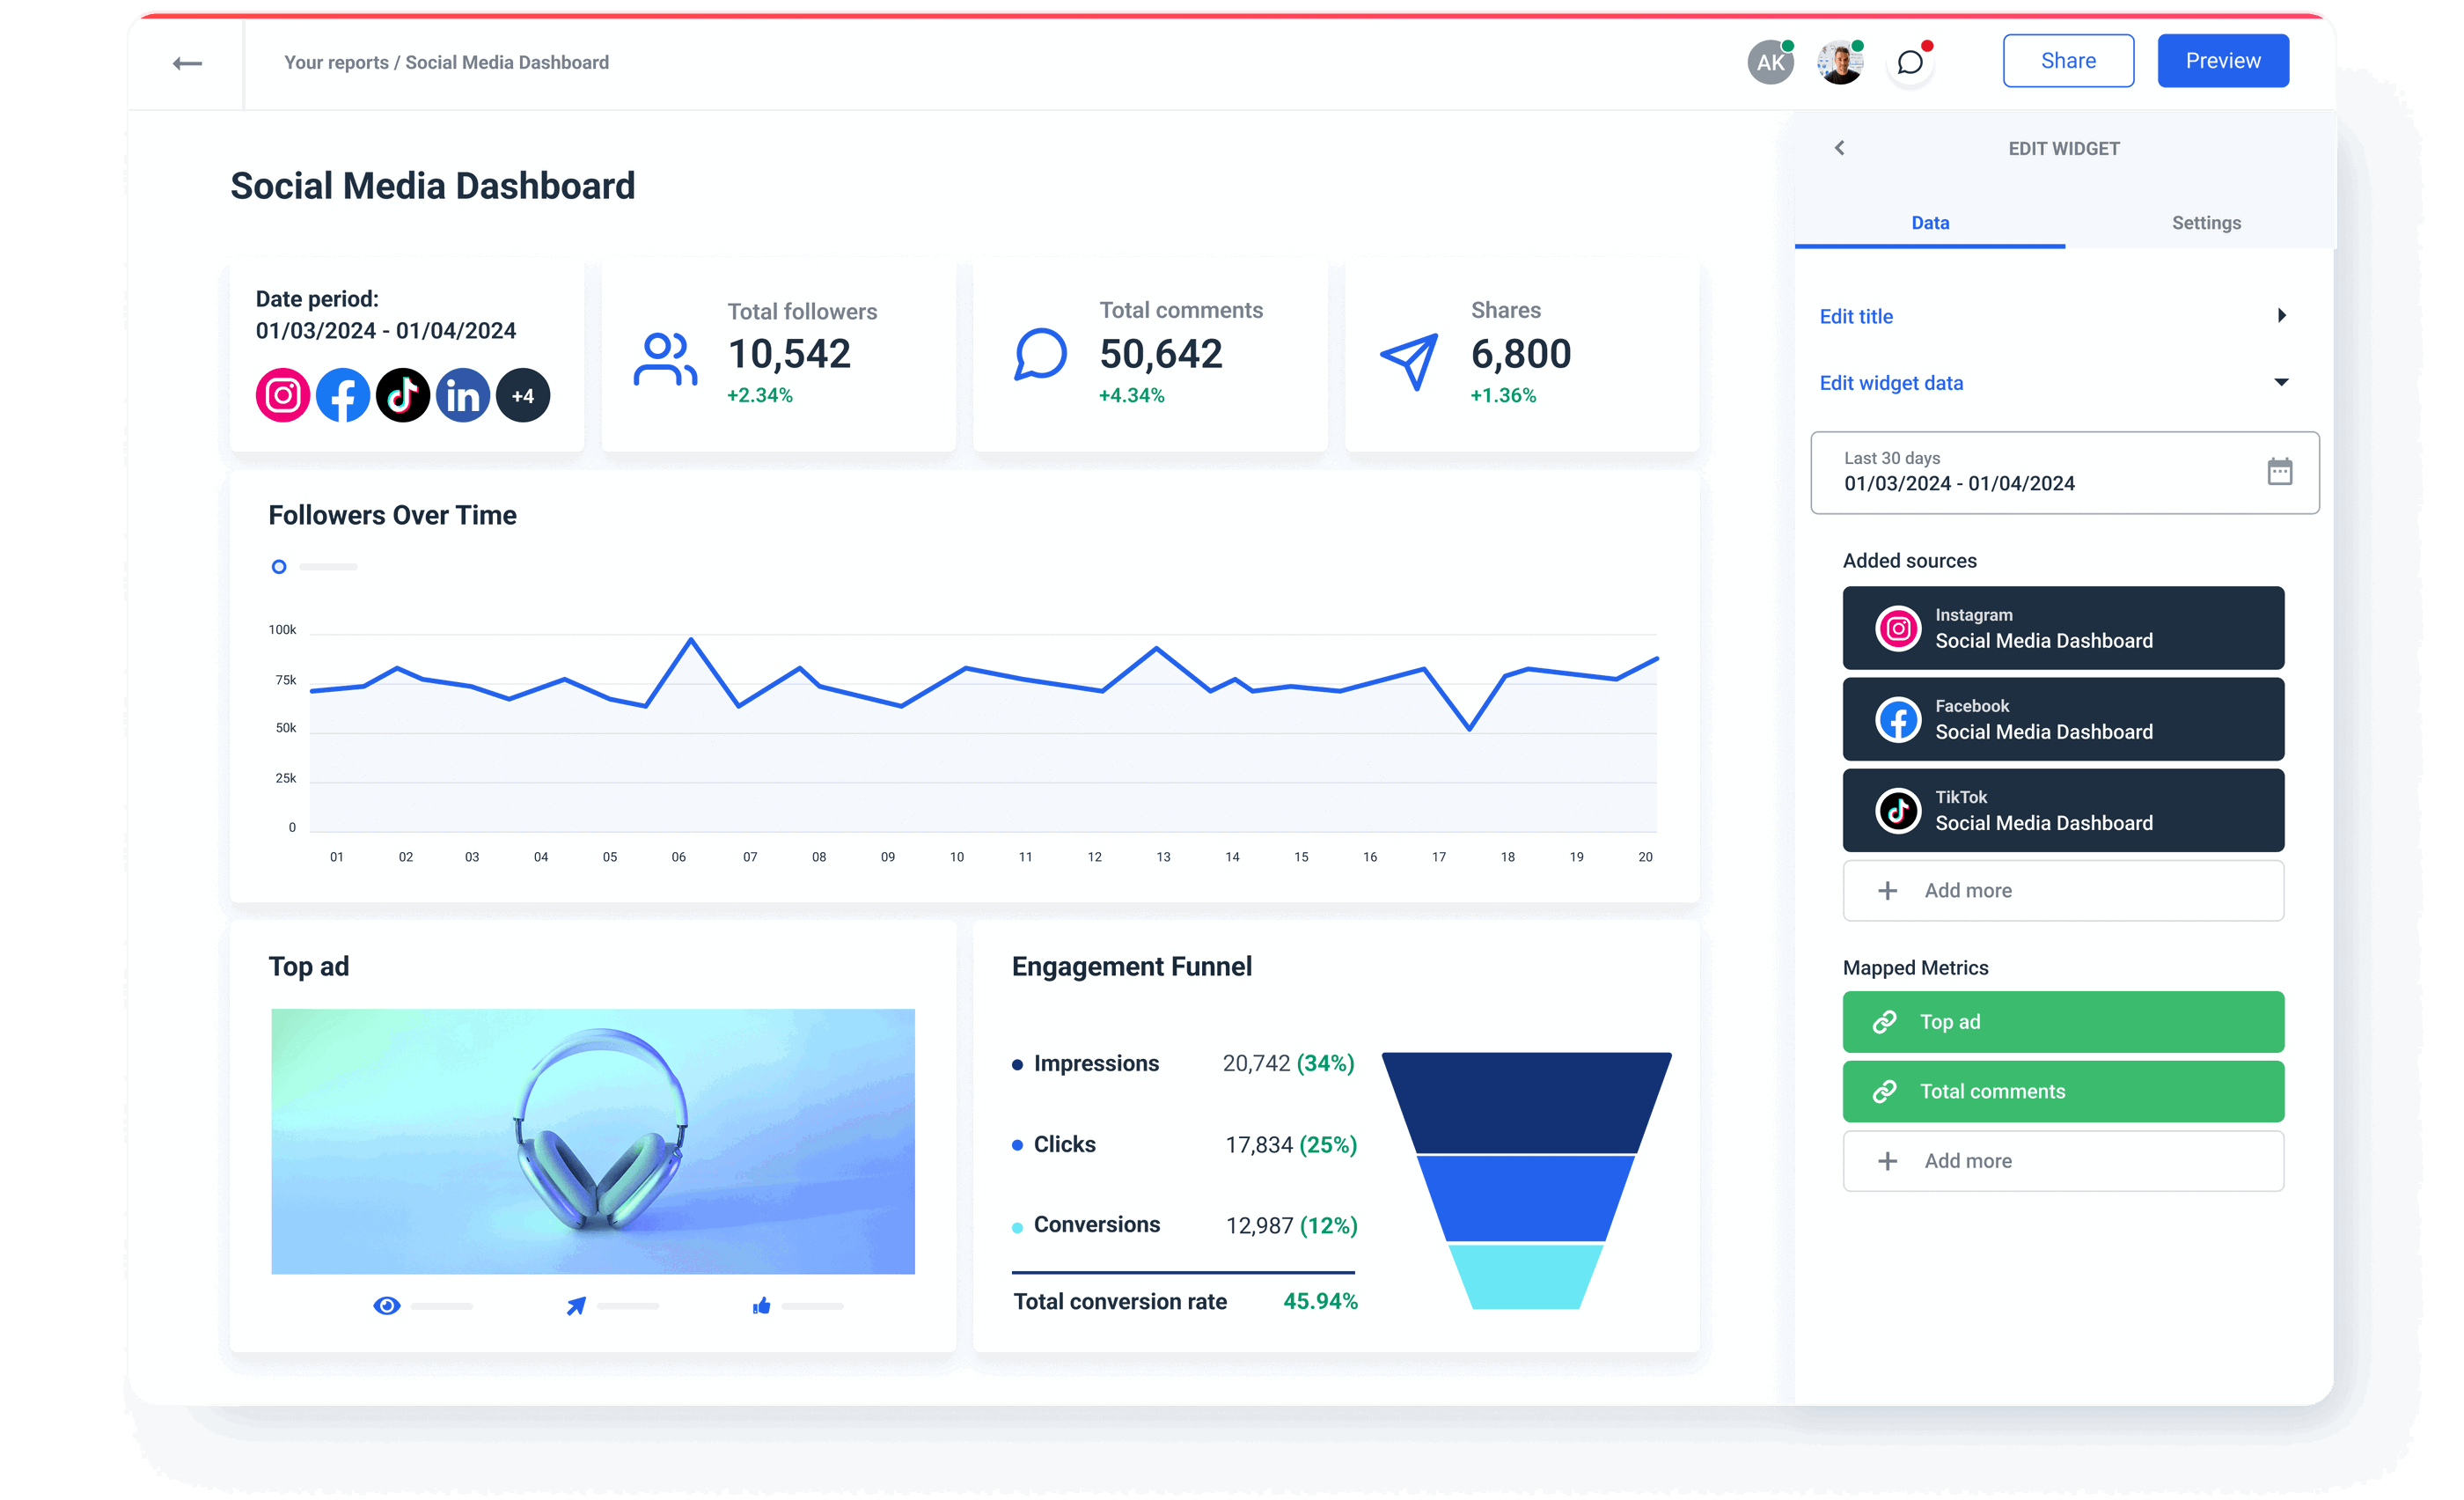
4. Social media performance client dashboard
A social media client dashboard is the best way to keep your clients up to date with:
- What is happening with their follower base?
- How active is their brand on social media?
- Which posts generate the most engagement (why)?
- How many conversions do they get from each social media channel?
Where to get this data from?
- Google Analytics for referral traffic
- Social media analytics
In a social media performance dashboard, it’s important to organize the data by channel, which is challenging without a dedicated data platform that can integrate data for joint insights and provide separate performance for each channel.
Whatagraph’s social media dashboard helps marketing agencies manage social media analytics and evaluate the campaign effectiveness for every client.
Conclusion
Building an engaging client dashboard is a good way to enhance transparency, enable data-driven decision-making, and build stronger relationships with your clients.
By following the steps outlined in this guide, you can create dashboards that not only meet but exceed your client's expectations.
Ready to transform your client dashboarding process? Start building your own insightful dashboards with Whatagraph.
Sign up for a free trial and experience firsthand how Whatagraph can help you visualize and share data with your clients
Published on Mar 18 2021
WRITTEN BY
Nikola GemesNikola is a content marketer at Whatagraph with extensive writing experience in SaaS and tech niches. With a background in content management apps and composable architectures, it's his job to educate readers about the latest developments in the world of marketing data, data warehousing, headless architectures, and federated content platforms.