How to Build a Complete PPC Dashboard for Agencies [+Template]
Your paid ads campaigns are getting traction. You’re managing a rolodex of clients across multiple platforms, as well as tracking the performance of the entire PPC budget.
Yet when it comes to reporting, you’re still stitching spreadsheets together and using basic Microsoft Excel visualization to showcase your results.
It’s time to spruce up your reporting game. Here’s how you can easily build engaging PPC dashboards with all the essential paid ads KPIs.

Mar 29 2023●5 min read


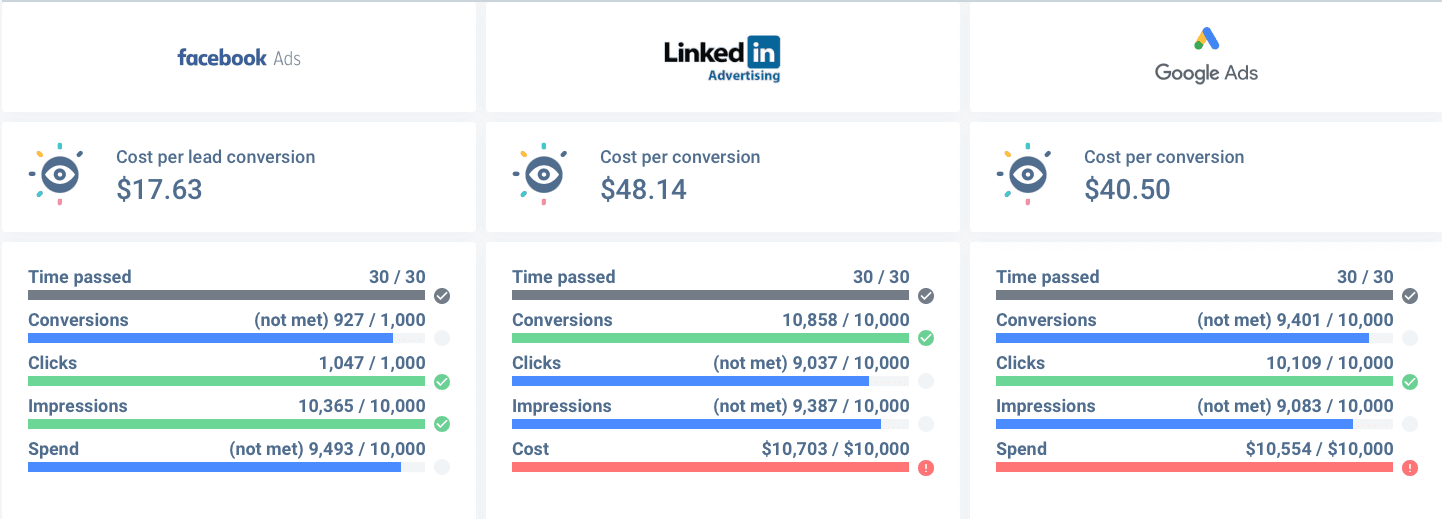
![How to Build a Complete PPC Dashboard for Agencies [+Template]](https://media.whatagraph.com/ppcdash_770fd7e36e.png?width=992)
What is a PPC dashboard?
A PPC dashboard is reporting software that helps marketers build customized dashboards to track media performance in real time, monitor key metrics, visualize paid searches, and automate client reporting.
By combining data from different paid channels into a single dashboard, you can identify strategies and tactics that stand behind the best results, as well as gain actionable insights that help you increase the return on investment.
7 reasons to use a PPC dashboard?
1. Understand both the “why” and the “how”
A PPC dashboard updates frequently, usually by a pre-set time period and every time you initiate an update manually. Whatagraph dashboards, for example, update the values every hour, by default.
This allows you to track your KPIs in more-less real-time and establish a direct connection between the actions you take in your paid media campaign and their impact on your key metrics.
For example, you can track the click-through rate of a new ad (please see the 9 key PPC metrics you should track below) and compare it with the performance of previous ads to see whether the new copy or creative performs better or worse.
2. Filter your data
It’s easy to get overwhelmed by the large amounts of data that tools like Google Ads or Facebook Ads collect. You get caught up in statistics, chasing numbers that might not be relevant, and end up wasting both time and effort.
A PPC dashboard can help you filter and prioritize data so that you or your clients only see what you need to see. If you don’t know which metrics to include, the best way to start is to get a PPC reporting template.
3. Grasp the big picture
A PPC dashboard allows you to view all of your key metrics side by side, as well as graphs and charts as your PPC campaign makes progress over time.
When you can compare these results to your previous paid marketing efforts, you can determine what you’re doing right and what needs improvement.
In other words, a PPC dashboard allows you to grasp a complete and inclusive picture of your campaign performance.
4. Easy access to data
Imagine a situation where you’re in a client meeting, and they ask you for the ROI for a particular month or the reach of a particular ad.
Instead of browsing through papers and documents like an unprepared Don Draper at the Lucky Strike meeting while trying to buy some time, you can summon the figure with a few clicks using your marketing dashboard.
Unlike spreadsheets, you can access digital dashboards on different devices and share them by simply sending the link.
5. Get real-time updates
How often your PPC dashboard gets updated depends on the reporting tool you’re using as well as your personal preference.
Whatagraph dashboards update every time you open the dashboard. If you want to see the most recent data, i.e., speed up the update, there’s a Refresh button that you can hit every 15 minutes.
6. Save time and money
In most dashboards, data is automatically collected, organized, and presented from connected sources.
When you can see the performance and impact of each element in your pay-per-click campaign in real time, it means you can stay in the loop and react more promptly to any changes.
If you notice that a campaign or ad set is not performing as expected, you can pause it and divert your funds to the more efficient ones, saving money in the process.
7. Report and communicate
Reporting on your PPC campaign result has never been easier. Need to present your monthly results at a meeting? Just fire up your dashboard and present the latest metrics.
Dashboards also allow you to download and share reports in a format of choice so that you can email them to your clients, co-workers, or shareholders.
Depending on who is going to read your dashboard, you can choose to share only the single-value KPIs or opt for more detailed and granular data points.
9 key PPC metrics you should track
Whichever cross-channel marketing tactics you choose to analyze and visualize data, these are the most important PPC metrics you cannot leave out.
- Impressions — The total number of times users have seen your ads, either in search results or the display network. This is an important metric to measure success, especially if you’re looking to increase brand awareness.
- Clicks — The number of clicks is important, especially when you’re launching a new ad campaign. Ideally, you should be able to determine if the campaign is a success or failure early on.
- Cost per click (CPC) — Although you’d probably need to let a campaign run for a certain number of clicks before you can evaluate its performance, the CPC can also indicate whether a campaign needs to be paused or optimized. Still, keep in mind that a high CPC might always be an issue, especially if the lead quality is high as well.
- Click-through rate (CTR) — While impressions tell you how many views you’re getting at the top of the funnel, CTR tells you how well your ads are converting people from the awareness stage to consideration.
- Reach and frequency — It’s easy for inexperienced marketers to confuse impressions and reach. While impressions track every ad view, reach focuses on the number of actual people who have viewed the ad, no matter how many times.
- Frequency — On the other hand, is the number of times an average user has seen an ad and is calculated by dividing impressions by reach. High frequency means the same person sees the ad over and over without converting, and it is an indicator that it’s probably time to change the ad copy, creative, or targeting.
- Conversions — You can track conversions on both the account level and the ad set or even individual ad level. If you use a reporting tool, you can easily break down conversions by account, campaign, and the top keywords behind those conversions.
- Conversion rate — This KPI tells you how effective your ads are at driving the wanted action. You can also break down the conversion rate to the ad set level to test the quality of targeting and to the individual ad level to gauge the quality of ad copy and creative.
- Return on ad spend (ROAS) — A metric that stands for the amount of revenue generated from each dollar invested into paid ads. It allows you to compare the profitability of each ad campaign.
4 steps to build a PPC dashboard with Whatagraph [free template]
Here’s our step-by-step guide to creating an ultimate PPC dashboard.
Step 1: Pick a dashboard tool
While there will always be stakeholders who prefer raw data, most people will be interested in something more engaging than just a dataset of numbers. This is where visuals can make your dashboard more meaningful and actionable.
Google Sheets and Google Analytics dashboards are pretty basic. This is why you should use dedicated reporting tools like Whatagraph to stand out from the crowd.
With Whatagraph, you don’t have to worry about manual data entry. Just connect your paid media sources, and data populates and updates automatically every time you open your dashboard.
Apart from popular ad platforms like Google Ads, Bing Ads, Facebook Ads, and LinkedIn Ads, with Whatagraph, you can integrate data and visualize KPIs from a variety of social media, SEO, and eCommerce apps using interactive custom dashboards.
Step 2: Choose a PPC template
Whatagraph’s PPC dashboard template is designed to provide an ultimate reporting experience to marketing agencies that need to aggregate their clients’ PPC campaign results and automate them as a single dashboard.
Using our template, you can effortlessly integrate all your paid channels’ results into one PPC dashboard. Just connect the accounts to Whatagraph and start reporting.
Sure, you can start from a blank page and create a PPC dashboard from scratch. But do you really have time to waste?
Let our template handle the designs and technicalities while you find more ways to boost conversion or optimize your AdWords campaign.
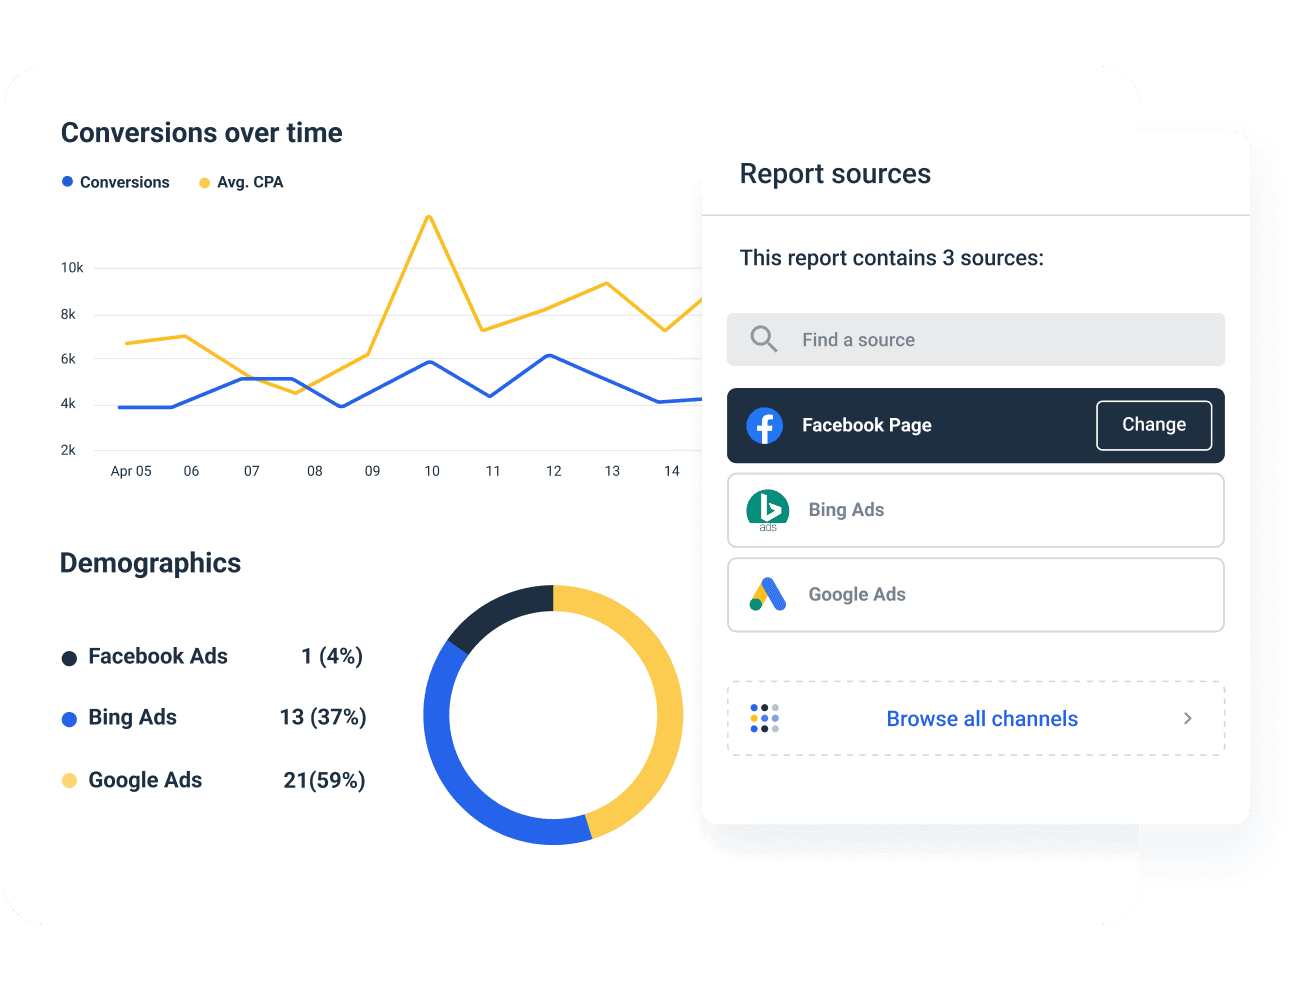
Step 3: Add your sources
Now we’ll show you how to add paid media accounts as a data source.
- Open Whatagraph and click Create new in the top-right corner.
- Choose to Create from template.
- Scroll down to find the Dashboard template: Consolidated PPC overview, and click on it.
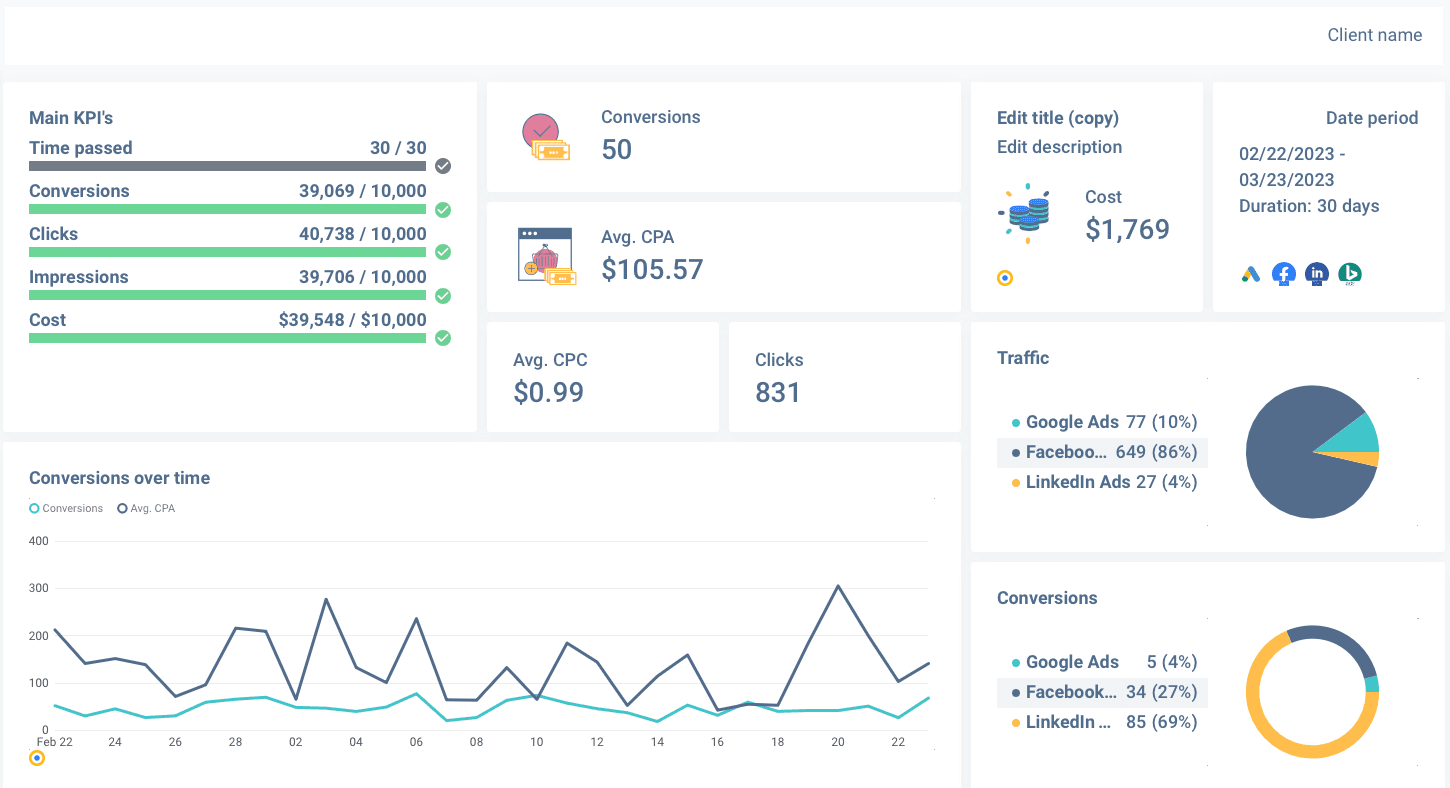
- Now you have a PPC dashboard with basic metrics from Google Ads, Facebook Ads, LinkedIn Ads, and Microsoft Ads.
- To add a paid media source, click Actions > Manage Data Sources, and then Browse More Sources.
- Select paid media of choice and pick one of the available accounts.
Our PPC dashboard template includes four paid ads channels by default. However, you are free to remove some and add others, such as TikTok Ads.
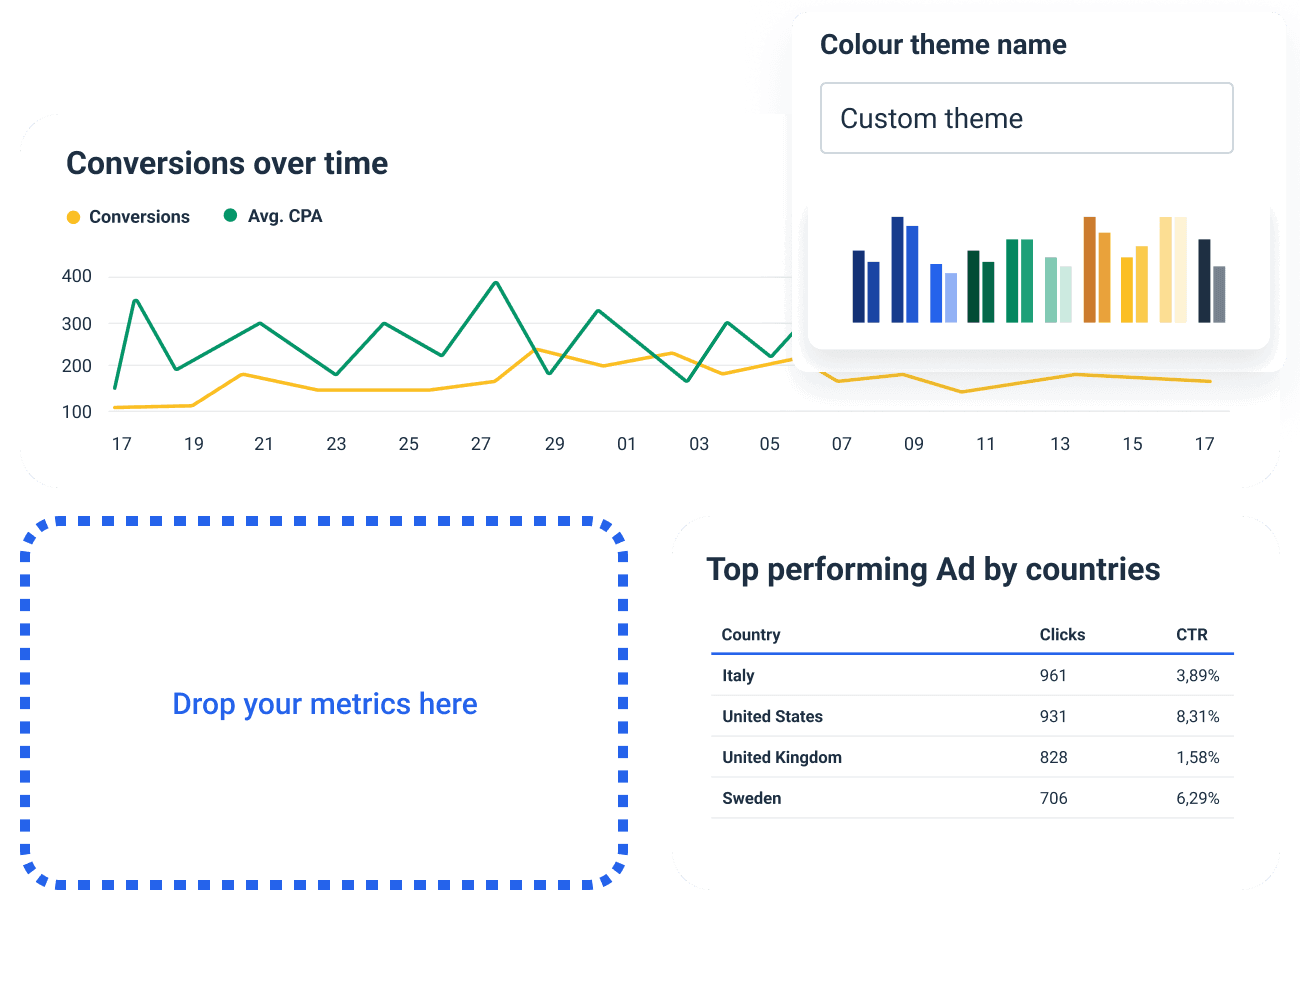
Step 4: Customize the dashboard
Once you have created a basic PPC dashboard, you can edit it by introducing additional widgets for dimensions and metrics.
Customize your PPC dashboard by adding graphs, charts, images, text boxes, calendars, and more.
Type in the name of your dashboard, upload your or your client’s logo or change the color scheme of the design elements to make the dashboard look more in line with your or your client’s branding guides.
If you want to go one step further and impress your clients even more, apart from changing all aspects of dashboard appearance, you can also white-label the dashboard for a more professional look.
The easiest way to report on PPC efforts
When you consider the wealth of data and insights offered by each advertising platform, having a dedicated PPC dashboard can help you stay on top of your client’s data and their expectations.
Whatagraph helps you create in-depth PPC dashboards in just minutes. Connect your accounts once, and your data refreshes automatically every hour.
This way, you’re always getting fresh metrics from your ads platforms.
Check out our PPC dashboard template and get yourself an eagle-eye perspective on your paid media campaigns.
Published on Mar 29 2023
WRITTEN BY
Nikola GemesNikola is a content marketer at Whatagraph with extensive writing experience in SaaS and tech niches. With a background in content management apps and composable architectures, it's his job to educate readers about the latest developments in the world of marketing data, data warehousing, headless architectures, and federated content platforms.