Digital Dashboard – What Is It and How Does It Work
If you’re looking to boost the growth of your business, learning how to monitor and track your data is the best way to go. Meanwhile, failing to use the data to your advantage can result in becoming obsolete.

Sep 17 2019●5 min read


Digital Dashboard – What is it and how does it work
This dashboard is a software that tracks and visualizes data from various sources: databases, web services, and locally hosted files. This way, it allows you to monitor your overall business performance.
To explain further, a digital marketing dashboard displays actionable insights, historical trends, and real-time information. It also tracks metrics, KPIs, and other fundamental data points important for a department, business, or a specific project.
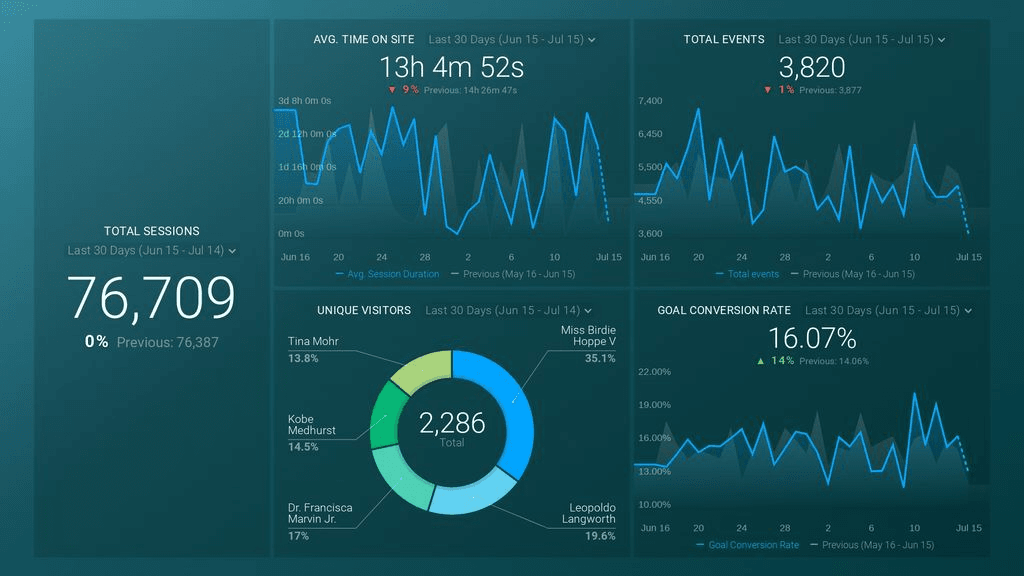
Finally, a digital dashboard gets you the vital information by presenting visually, making it easy to understand complex numbers.
How does digital dashboard software work?
Now that you’ve learned what a digital dashboard is, let’s move on to understanding how such a dashboard works.
Everyone involved in business wants to know how the company is performing. Is there a large customer number waiting for a delayed reply from support? What’s the churn rate today? Digital dashboard software allows you to answer these and many other questions right away by providing compelling data visualizations.
Before you start building your digital dashboard, you should determine the exact business questions you are trying to answer. Say you’re interested in how your Google Ads campaigns project is performing.
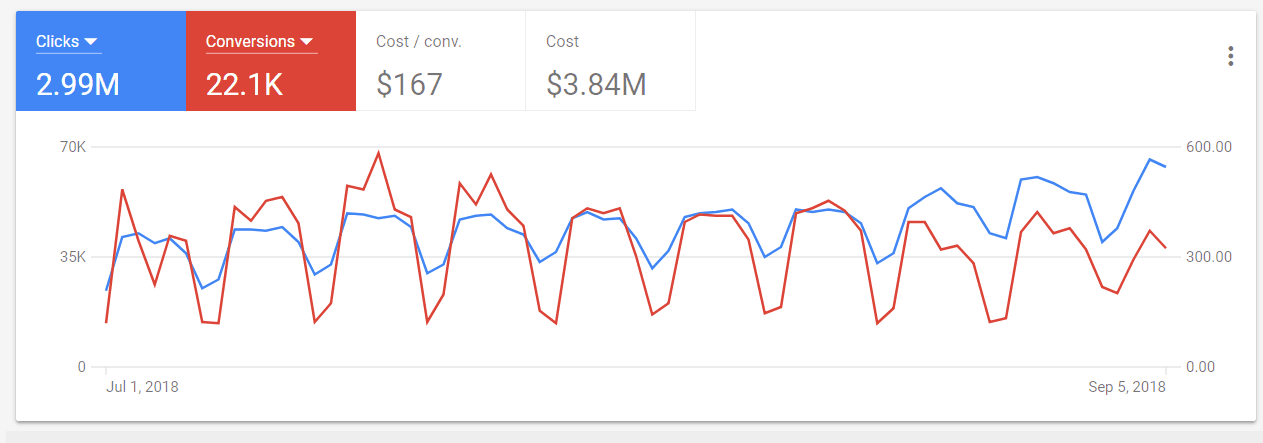
To get an answer, you must find the answers to other questions, too. Is your campaign driving lead conversions? Are you spending too much money on Google Adwords? After narrowing down the questions you need answers to, you should locate where the relevant information is stored.
For example, data about the performance of your Google Adwords is stored in your Adwords account. Connect to your account, then move on to the next step, which is a data display. You can upload excel or CSV files for your data to appear in your dashboard – for your convenience, a digital dashboard isn’t limited to just pre-built integrations.
The form of visualization depends on the data set. For example, you may use a gauge metric to determine whether you’re spending too much on Google Adwords. You’ll see different spending ranges, from acceptable or optimal spending to in need of re-evaluation.
Finally, you can share the digital dashboard with your team or clients. For example, a dashboard that presents your Adwords performance can be useful for the entire marketing team. This way, each member can monitor digital marketing KPIs in the dashboard and answer questions they raised in the beginning.
Benefits of using digital dashboards
Here are a few reasons why you should get a digital dashboard for your business:
Data-Driven Decisions
The accessible visual nature of this dashboard helps you make data-driven decisions. This way, you save time, energy, and drive your business forward. Finally, it lets you analyze and drill down into insights and important metrics with ease.
Easy Interaction
You don’t need comprehensive training to use a digital dashboard. Typically, these dashboards are highly intuitive and make it easy and quick for you to access critical information.
Mobility
You can access relevant data anywhere and anytime: dashboard providers offer platforms for both desktop and mobile devices.
Business Intelligence
Being able to access real-time, past, and predictive analytics and KPIs aimed at evolution, growth, and professional development boost your organization’s business intelligence. A dashboard like this will help you stay ahead of the competition.
Although there are many advantages of using digital dashboards, that doesn’t mean you no longer need a data specialist. On the contrary, it’s the data specialist who properly utilizes the data to make final decisions according to set goals.
Who uses digital dashboards?
Usually, it’s the people looking to access real-time, prevent data overload, and gain control of their performance or processes. Different departments within the company use digital dashboards for multiple purposes. For example, organizations use them to simplify data analysis and distribution.
Meanwhile, sales teams use them to exploit various opportunities. At the same time, marketing uses them to monitor and measure their campaigns and performance metrics. Finally, the executive teams and SaaS businesses use them to monitor multiple metrics: churn rates, recurring revenue, net burn rate, and customer retention.
Types of digital dashboards
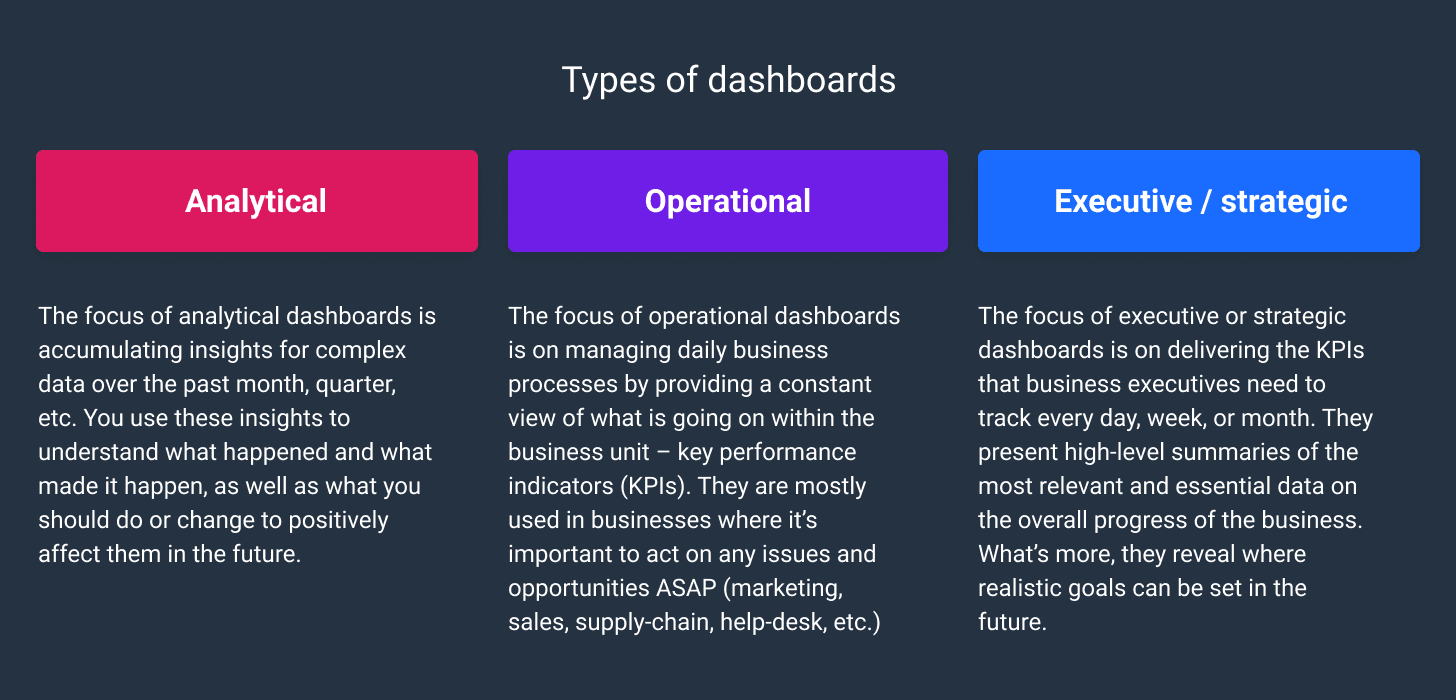
There are three types of digital dashboards: analytical, operational, and executive or strategic dashboards. Below you’ll find the details that will help you choose the right dashboard for your business.
 |
Analytical Dashboards
Analytical dashboards are used to collect insights from complex data over the past month, quarter, etc. You use these insights to evaluate past events and the reasons that led to them. You’ll also see the actions you should take to make positive changes in the future.
Operational Dashboards
Operational dashboards are dedicated to helping you manage daily business processes. These dashboards provide a constant view of your performance. In other words, you see all your key performance indicators (KPIs) in one place.
Typically, the key performance indicator system is used by marketing, sales, supply-chain management, or customer support departments, where you may need to make urgent changes.
Executive/Strategic Dashboards
These dashboards are used to deliver the KPIs that business executives need to track daily, weekly, or monthly. They provide high-level summaries of the most relevant data on the overall progress of the business. With the help of this dashboard, you can see the time you can set real goals at.
Conclusion
Using dashboard reporting software boosts your organization’s business intelligence. Plus, it gives access to data insights to each employee, improving the performance, efficiency, internal communications, and operational processes.
Therefore, a digital dashboard is the top data visualization tool designed to help you level up your data management game.
Published on Sep 17 2019
WRITTEN BY
Indrė Jankutė-CarmaciuIndrė is a copywriter at Whatagraph with extensive experience in search engine optimization and public relations. She holds a degree in International Relations, while her professional background includes different marketing and advertising niches. She manages to merge marketing strategy and public speaking while educating readers on how to automate their businesses.