Google Analytics Pricing Guide
Google Analytics is a powerful web analytics tool designed to improve business decision-making by allowing you to understand your audience's reactions and gauge the effectiveness of your marketing efforts. But how much does Google Analytics cost? Is it free all the way? Let’s explain.

Feb 20 2020●2 min read


What is Google Analytics?
Google Analytics (GA) is a platform owned by Google that tracks, records, and breaks down the key metrics of your website and apps to create reports that provide insights into your business. You can determine your website traffic, visitors’ location, interests, behavior, age, and how they interact with your online presentation through Google Analytics.
Google Analytics has become an indispensable tool in every marketer’s stack thanks to the abundance of features that help understand how people interact with a website. Google Analytics can tell you much about the visitors’ demographics, geographical location, and even the TV shows they watch.
However, since its launch in 2007, Google Analytics has seen multiple updates, which made it bigger and more powerful than ever. The most recent version, Google Analytics 4 (GA4), provides even deeper insights into your website data.
Google Analytics pricing model explained
Google Analytics is free if you use the free version. There is also the paid plan called Google Analytics 360. The free version is ideal for small businesses and freelancers, but if you want advanced analytics features, you need to subscribe to GA360 and pay a monthly fee.
The Google Analytics premium plan, called Google Analytics 360, costs $12,500 per month or $150,000 per year. Apart from the features available in the free version, the premium plan comes with advanced analytics functions like attribution modeling and data integration.
The good news is that the free version offers a variety of features that can be enough for any small and medium-sized business to run their marketing campaigns successfully. Large enterprises that need extra reporting options and capabilities can take the premium version and justify its high price.
As there is a significant difference in prices, it is evident that GA360 has some additional features, but that doesn’t mean your business needs them.
So, before signing up, it’s important that you understand your business needs and very well analyze the cost, capabilities, and differences in both versions.
But first, let’s talk a bit about…
Other costs associated with Google Analytics
Google products are usually free, with a few exceptions like GA360. But there are a few situations where you may have to pay elsewhere when using products with Google Analytics.
GTM Server-side:
Google Tag Manager (GTM) is free to use alongside your GA property. Recently, a new way of data collection emerged, called GTM Server-side. To set up GTM Server-side, you need to set up Google Cloud Platform and a tagging server. Google recommends setting up at least three servers, costing around $50 a month.
Google BigQuery:
Google BigQuery used to be available only to GA360 users. But luckily, GA4 changed that, and now BigQuery has become available for free users, too. However, BigQuery pricing is rather complicated for itself. You pay for queries based on scanned data, storage, streaming, updating queries, and more. But most small businesses will probably end up paying nothing, as there’s 10GB of storage and 1TB of queries per month for free. What do you get with the Google Analytics Free version?
The free version is very suitable for small and medium-sized businesses and offers a variety of data tracking and reporting features that can very well help the business to grow.
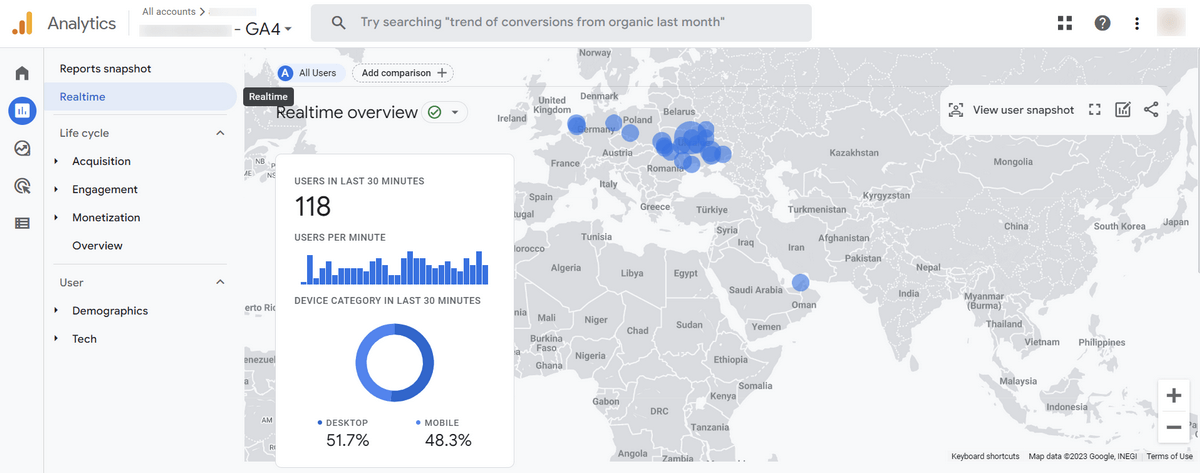
Real-time reporting
Basically, you can monitor activity on your site as it happens. You can find out what visitors are doing on your site and discover things like:
- The number of websites users visited during the last 30 minutes
- Users or new users by their audience
- Users by page title or screen name
- The content they engage with
- Sources of your traffic (medium, campaign, etc.)
- A list of conversions completed by a user
- A list of events triggered by a user
Such discoveries help you identify any issues you may have with your site. Are people navigating your property smoothly? Are promotions driving traffic the way you planned it? Is the tracking code implemented correctly?
Instead of spending hours answering questions like these, GA can give you answers in minutes.
Events
It’s not enough to say that GA4 has changed things a bit. One of the most significant changes in the latest update is that user interactions are now measured through events.
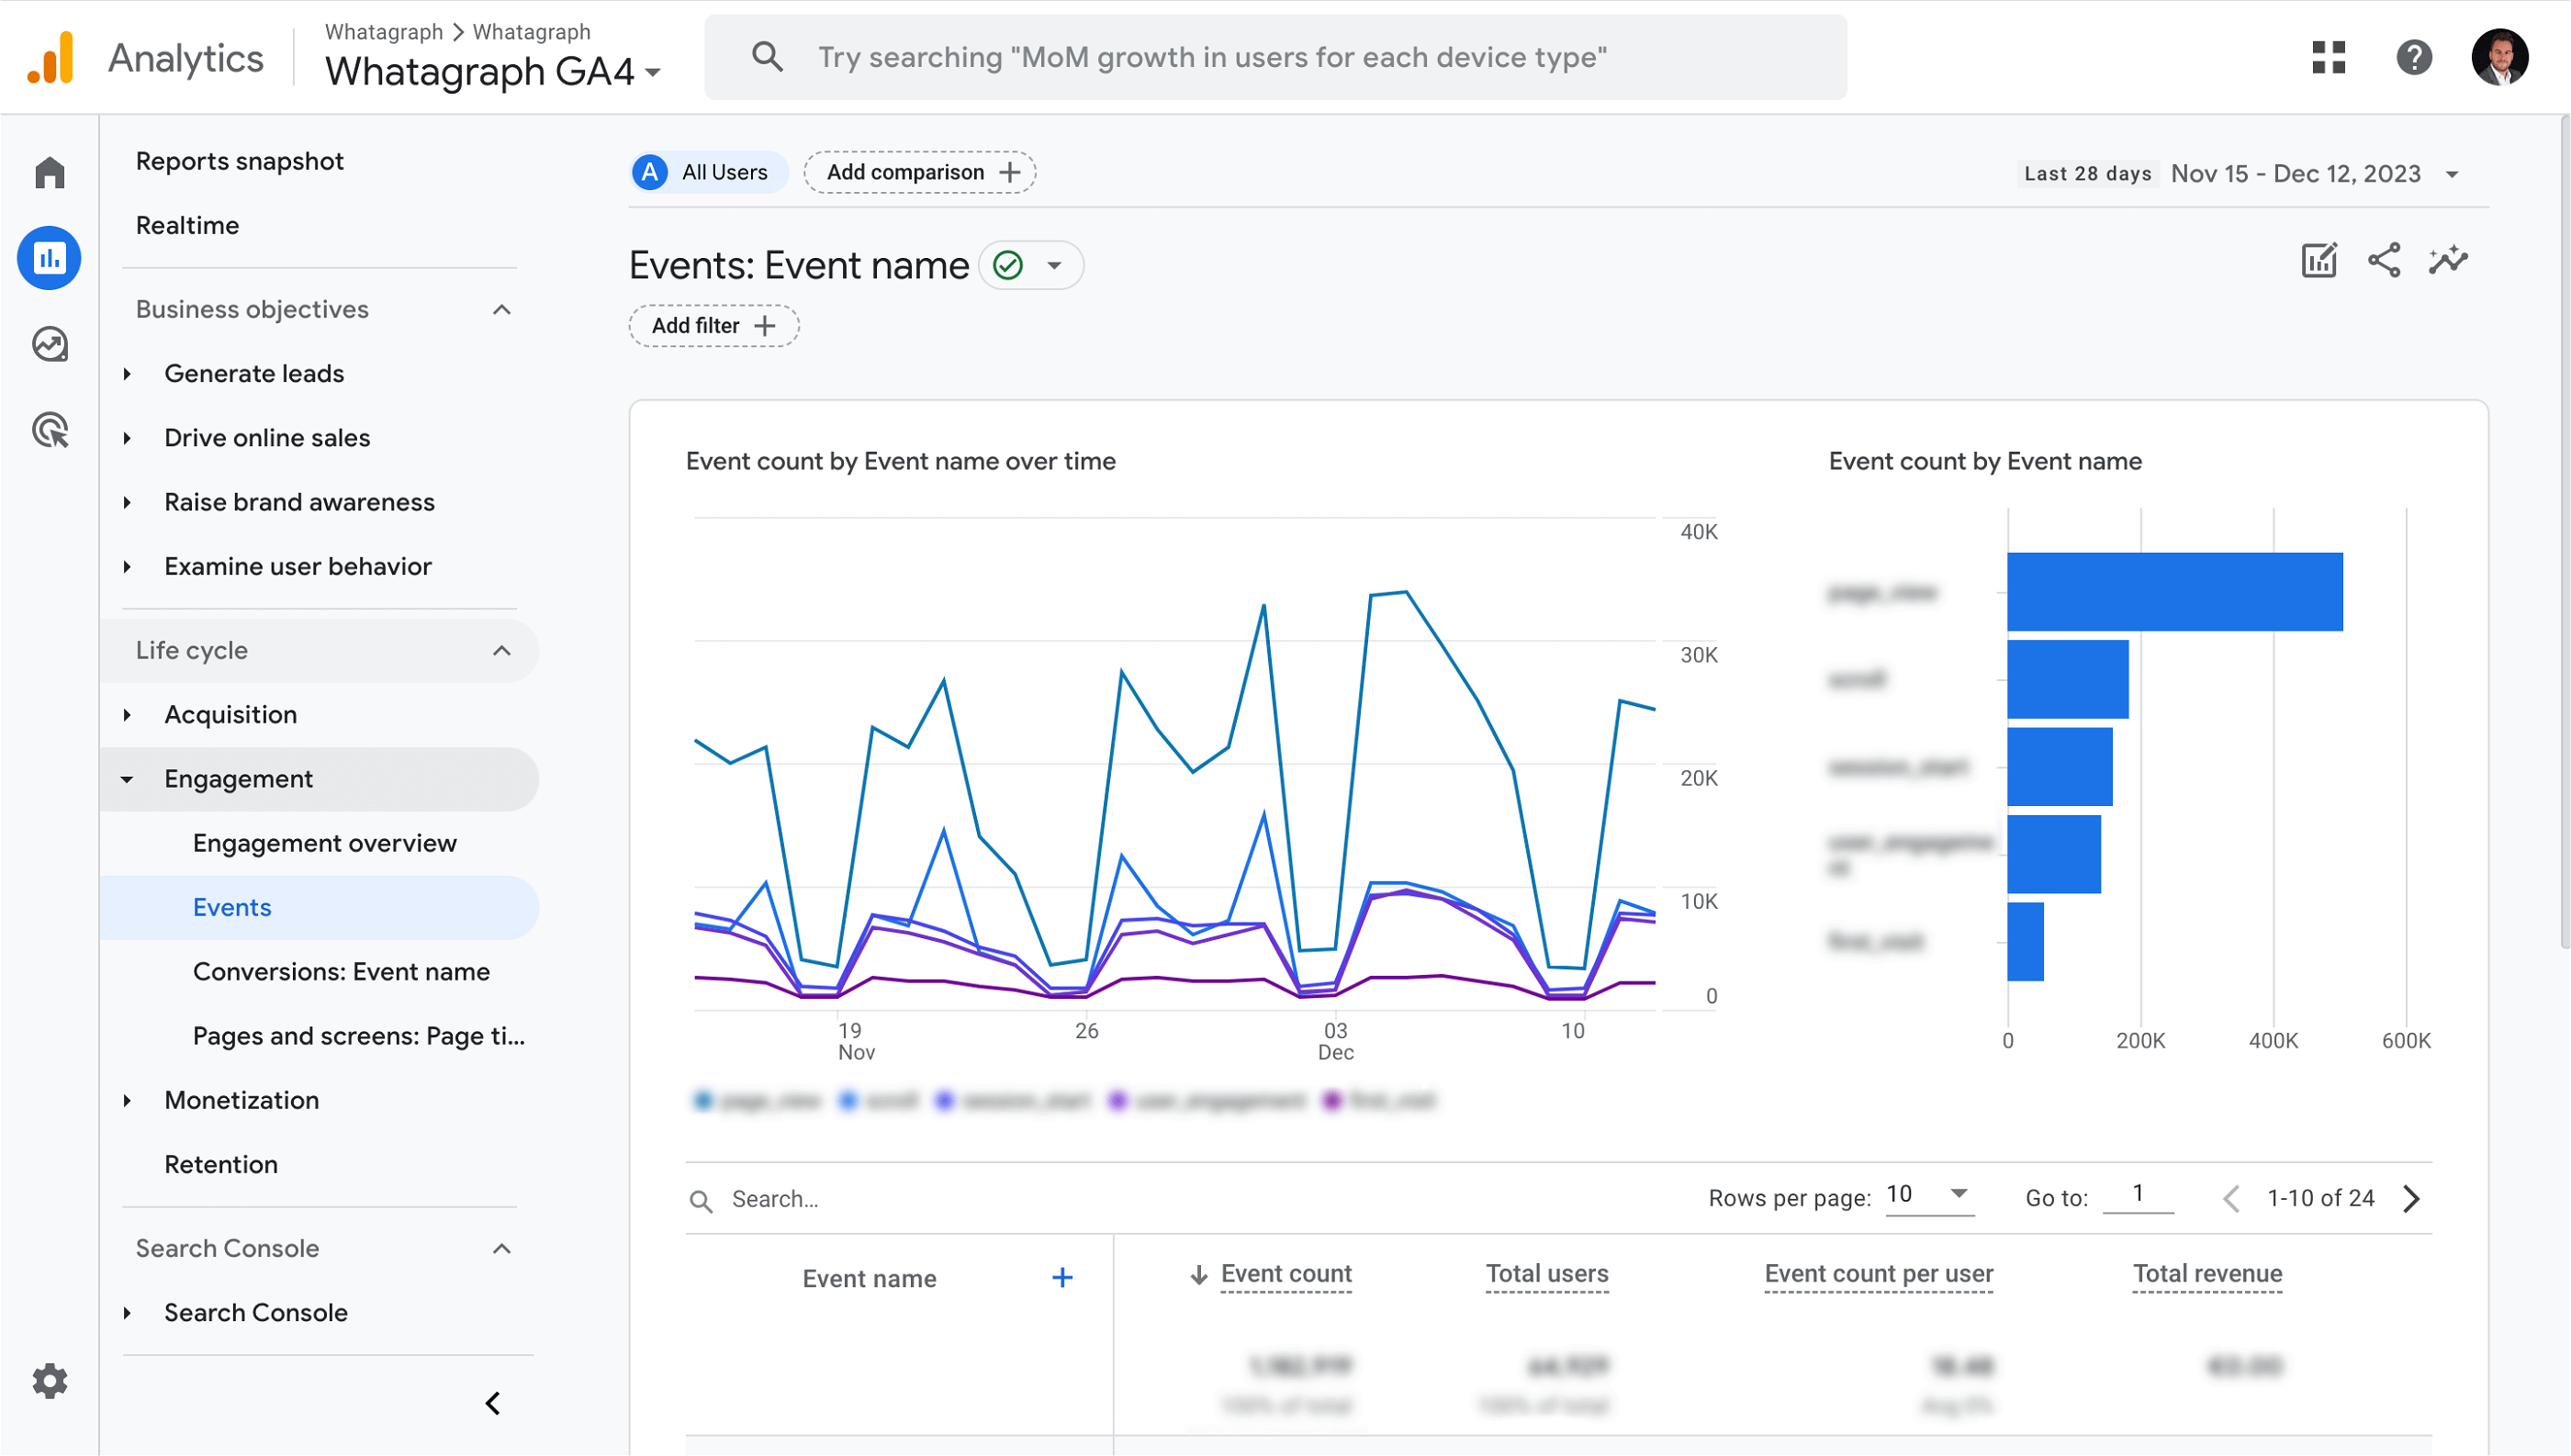
So, what is precisely an event?
There are some preset events within GA4; for example, page_view and session_start are events, but any interaction can be an event, and it’s totally up to you.
Just ask yourself what interactions you want to measure:
- Viewing a specific page?
- Signing up for your mailing list?
- Adding an item to a basket?
- Completing a purchase?
Improved measurement
This free feature can give you even more detailed information on your visitors and their actions. This allows you to measure interactions with the content on your website through actions like:
- Scroll tracking — to see how much webpage a user has viewed
- The amount of time a user spends watching an embedded video
- The number of outbound clicks to other websites
- The number of files downloaded from your website
- The queries entered into your website search bar
Custom reporting
You already use Google Analytics reporting to visualize and understand your data. But sometimes, you need a specific piece of information. This is where report customization comes into play. Let’s see how you can customize your reports using GA4’s report builder.
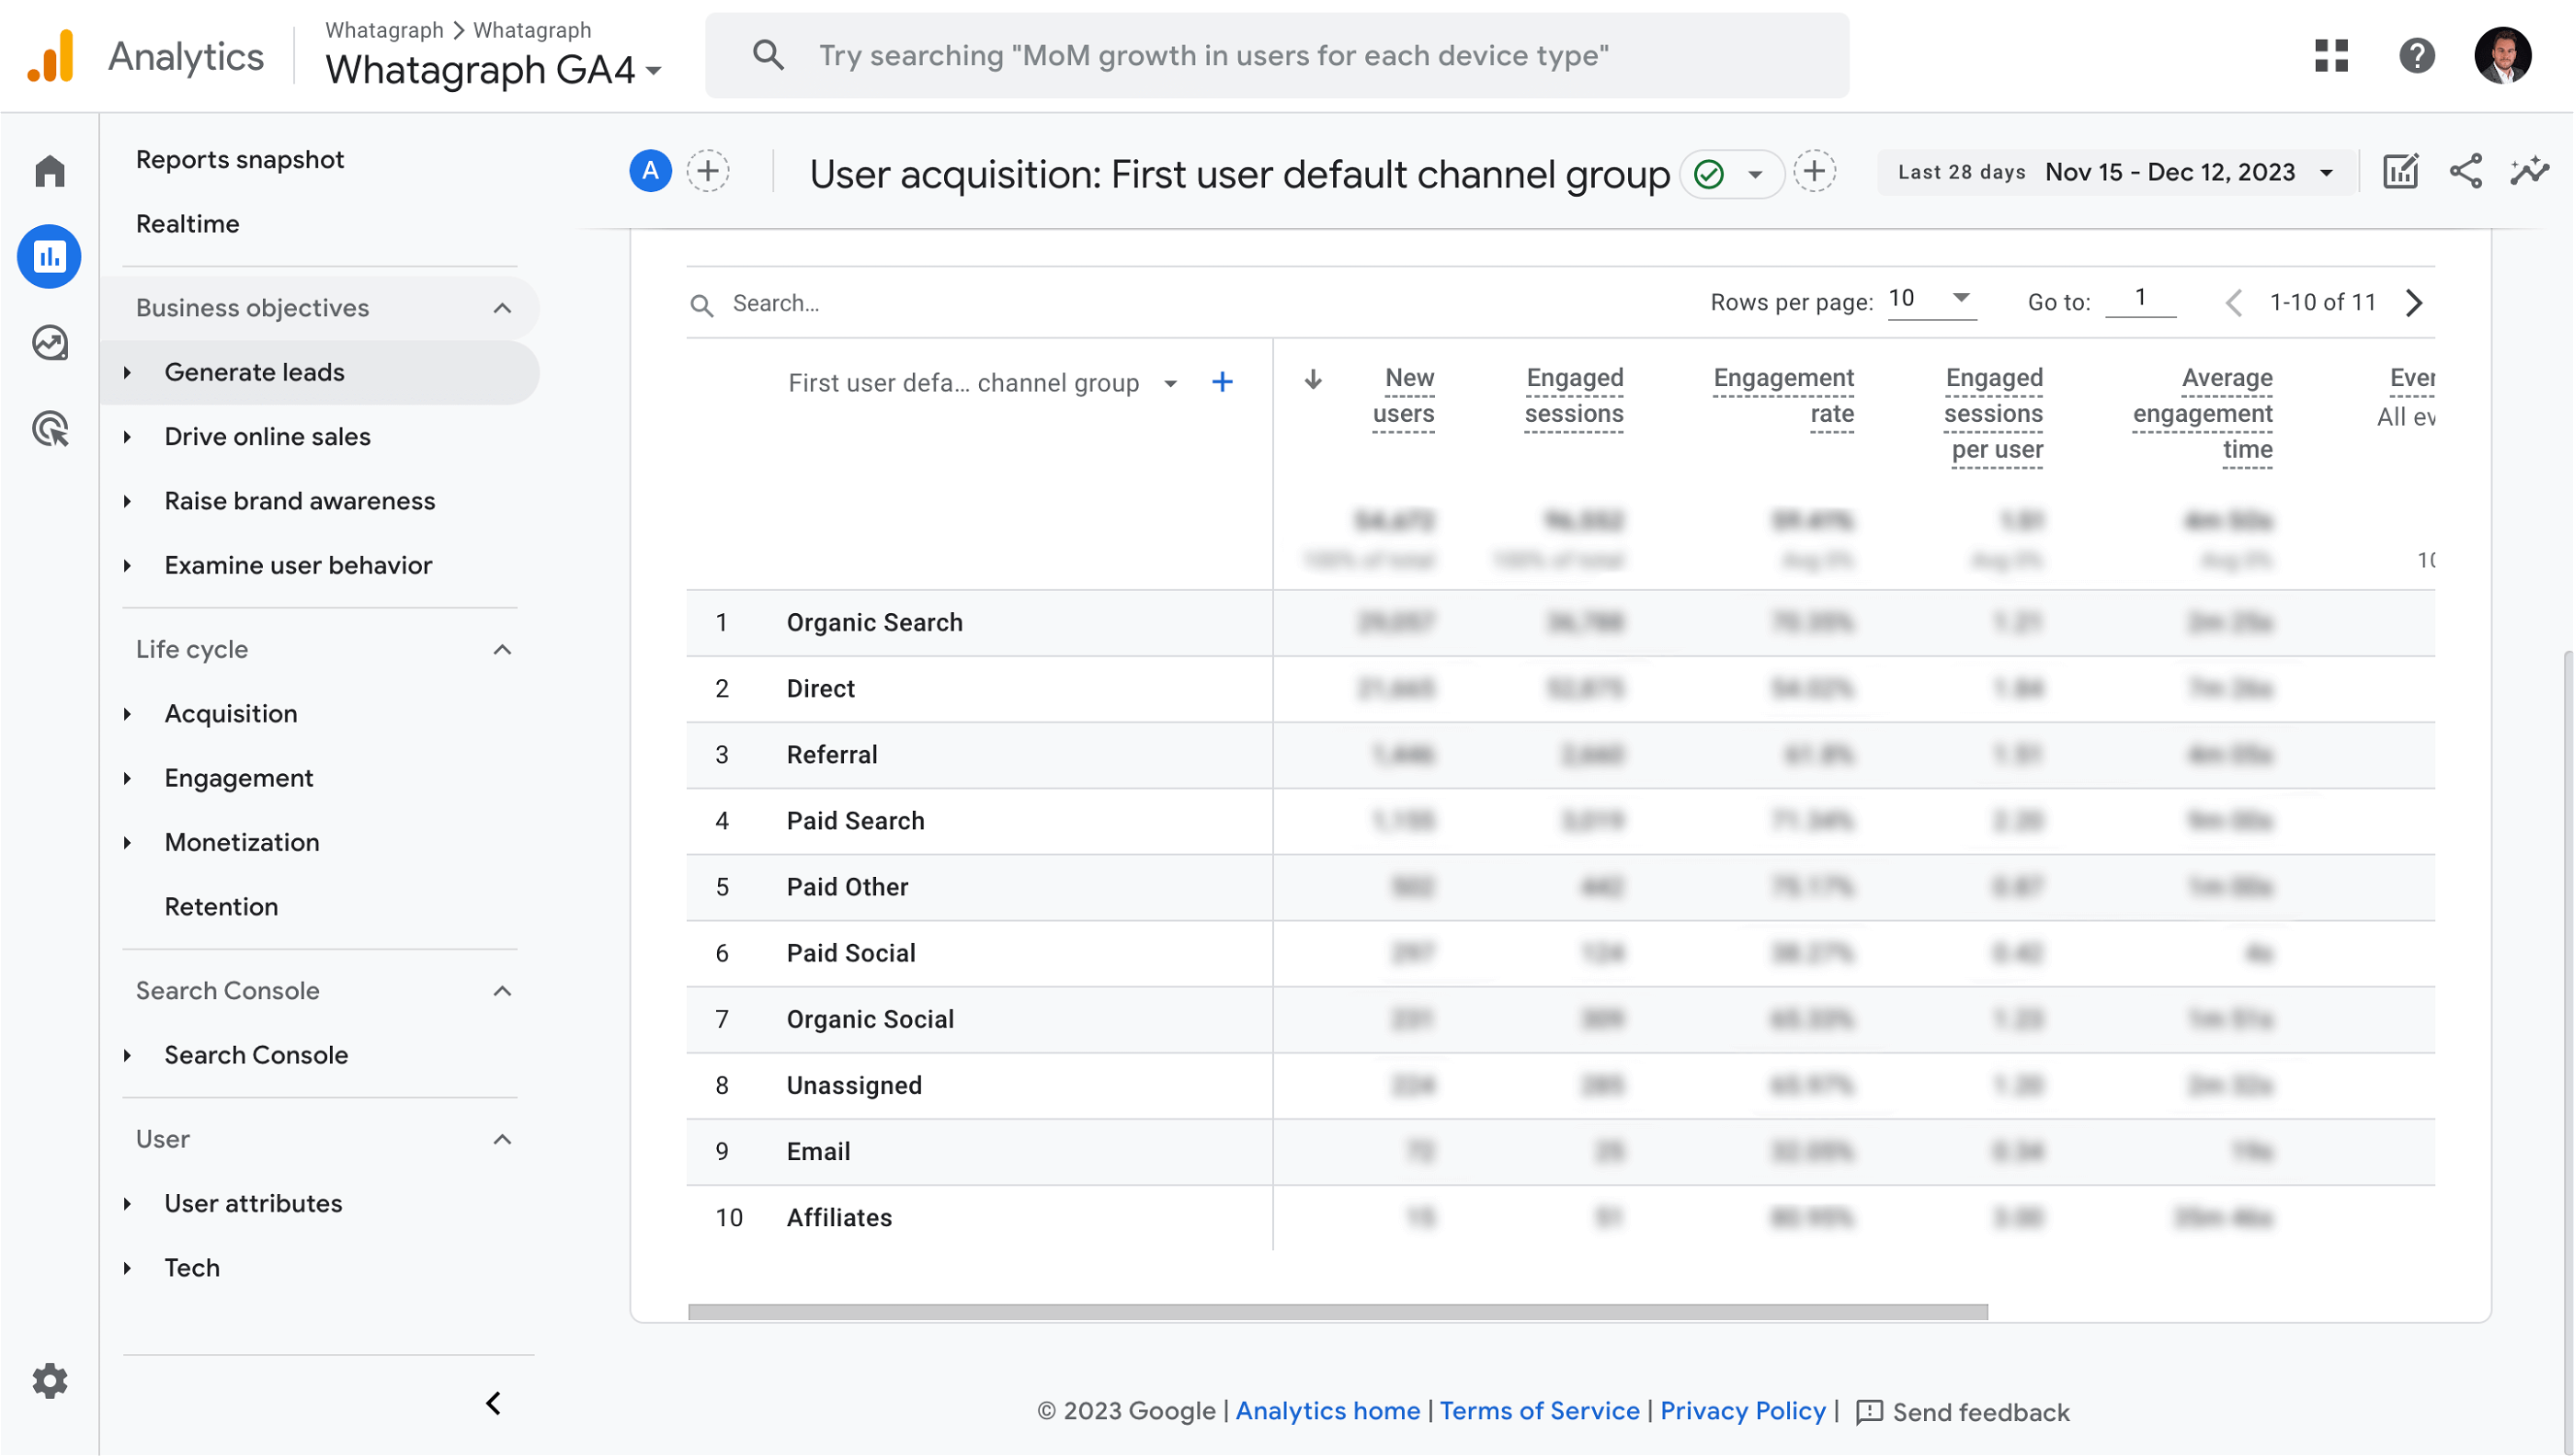
Optimize report data:
You can select dimensions and metrics to be displayed within your report. Here are some examples you can choose from:
- Source
- User
- Google Ads group name
- Campaign Creative ID
As for the metrics, you can pick new users, engaged sessions, engagement rate, conversion rate, bounce rate, and more.
Report filter:
You can also filter data to reach individual subsets. For example, you may want to filter our data that applies specifically to mobile users. However, you can temporarily switch the filters off to see the report in broader detail.
Integrations:
Free Google Analytics 4 integrates with standard Google products such as Google Ads, Adsense, Ad Exchange, and Search Console.
Charts:
Every report comes with two visualizations. You can turn either visualization off or both of them if needed. There are many visual types to choose from, including
- Bar charts
- Data tables
- Donut charts
- Geo charts
- Line charts
- Venn diagrams
Report templates:
If you link your reports with Google Templates, they receive updates from Google. This means you can add new dimensions that are released. You can unlink a report but not relink it afterward.
Mobile device tracking
According to research, nearly 60% of internet users are mobile. This means your website needs to be mobile-friendly if you want to offer a seamless user experience. However, even if you did everything you could, there might be some optimization opportunities you missed.
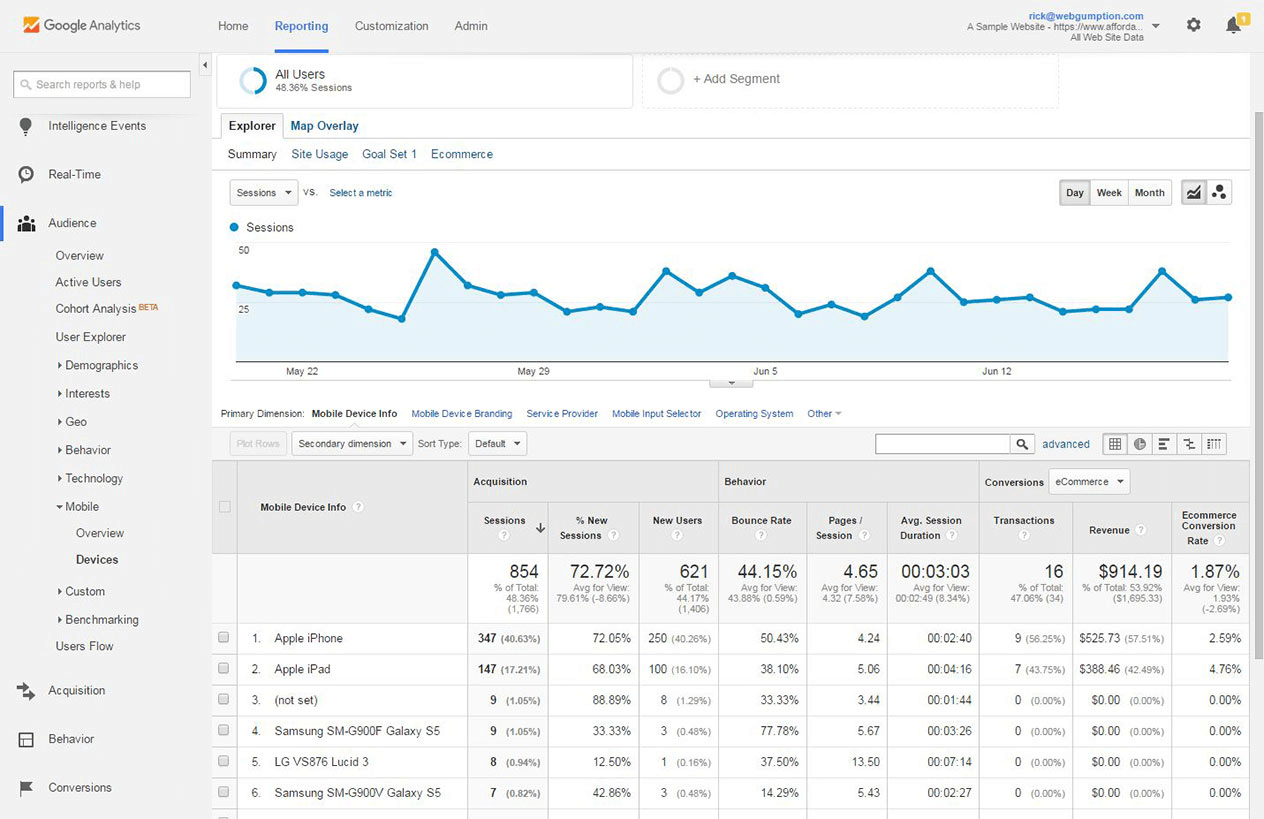
Google Analytics lets you know what mobile devices visitors use, what kinds of content they are viewing, and whether there are any pages they are avoiding.
You can use this information to improve your website and keep your users coming for more.
Tracking across devices:
User journeys are getting more complicated. These days, people often own more than one device and are likely to switch between them. Users may begin a journey on their phone and switch to their laptop later.
Tracking mobile apps:
Getting data from mobile apps was tricky in the past. There wasn’t an option to view website and app data in the same GA property. You needed multiple GA properties to get accurate data. However, in GA4, this is centralized, and you can easily visualize mobile app data.
Audience segmentation
If you feel as if you’re looking for a needle in a haystack, you might be looking at a sample that is too large. Google Analytics offers audience segmentation, which helps you break data down into smaller groups.
For example, if you want to learn about users from Europe, you can use segmentation to filter data and get the information you need.
The GA segment builder allows you to create three types of segments: user segments, event segments, and session segments.
Google Analytics 4 is free, but it has some limitations compared to the premium version:
- Data volume capacity of hitting up to 10 million hits per month
- Max 50,000 data rows
- 5 slots custom variable
- Limitations in custom dimensions and metrics
- 24+ hours data freshness capacity
- There is no integration for Search Ads 360, Display & Video 360, and Campaign Manager 360.
More info about differences in data limits between the free and paid GA versions is to follow in the next section table.
However, for small companies, low data volume capacity may never be an issue, but hitting the maximum capacity is very easy for large companies with massive amounts of data. So, the standard version is a good choice for many small and mid-sized companies.
What do you get with Google Analytics 360?
It goes without saying that many business owners stick with the free version of Google Analytics 4. It provides massive amounts of data and covers many different areas of data analytics. So, what are the perks of upgrading to a paid version of GA?
Fewer data limits
In the free version of GA, there’s a limit on the amount of data you can collect. GA360 increases the limit massively.
Let’s look at the comparison:
| Free GA4 Properties | Paid GA360 Properties | |
| Event parameters | 25 per event, 50 event-scoped custom dimensions per property, 50 event-scoped custom metrics per property | 100 per event, 125 event-scoped custom dimensions per property, 125 event-scoped custom metrics per property |
| User-scoped custom dimensions | 25 per property | 100 per property |
| Conversions | 30 | 50 |
| Audiences | 100 | 400 |
| Explorations | 200 created per user property, 500 shared per property | 200 created per user per property, 1000 shared per property |
| Explore sampling limits | 10M events per query | 1B events per query |
| Unsampled explorations | Not available | Unsampled results up to 50B events per day per property |
| API quotas | 25,000 tokens a day | 250,000 tokens a day |
| Data retention | Up to 14 months. Options: 2, 14 months, Large and XL properties are limited to 2 months | Up to 50 months. Options: 2, 14, 26, 38, and 50 months, XL properties: 2 months |
| BigQuery Export | Daily export: 1M events. Streaming export: unlimited | Daily export: Billions of events. Streaming export: unlimited |
| Google Analytics Price | Free | $150,000 per year |
Custom funnels
Sometimes you want website visitors to complete actions in a specific order. For example, you have a mailing list, but getting a user to sign up is easier said than done. Here’s what needs to happen:
- User lands on your site
- They read a piece of content they like
- They sign up to be notified about future content
- They share contact details
- Submit a form
But how to make sure the visitors are acting in a way you want them to? Thanks to custom funnels in GA360, you can monitor user behavior against your predefined goals. Are they missing a step? What can you change to avoid the problem?
You can easily define the funnel steps and link them with cross-session behavior.
Google Analytics 4 brought many funnels that were previously only accessible to Universal Analytics 360 users.
Still, there are only a few available on GA360.
Segment overlap
Segments are helpful in GA, but when you want to go deeper, GA360 lets you better understand the relationships between different segments.
You can compare three segments simultaneously and use the information from overlap to create new segments. Hover over specific segments in the overlap tool and see specific numbers related to them.
Higher quality data:
With the premium version, your data capacity extends from 10 million hits to 500 million hits per month. You also get a 98% data freshness guarantee and 99.9% data accuracy. In simple words, you get better data accuracy and high volumes.
Better custom data collection: The paid version of Google Analytics has more options to customize your data collection. With Google Analytics 360, you get 200 custom dimensions and metrics instead of 20 with the free version. It allows you to customize your data collection to get more specific data.
Advanced analytics + support:
The premium version offers data-driven capabilities, attribution modeling, and integration with double click manager and data running through Google BigQuery. As a marketer, you can get valuable information for your business to understand and target your audience properly.
Along with more advanced features, you also receive specialized customer support and a dedicated account manager to help you implement the service and train your staff to get the most out of the Google Analytics premium version.
Manage all your marketing data with Whatagraph
Having your website and user behavior data in one tab is invaluable for making the right decisions. But things can get chaotic when you have socials, paid ads, and an email marketing platform to monitor besides your website.
Whatagraph is a marketing data platform to connect, organize, visualize, and share all your data.
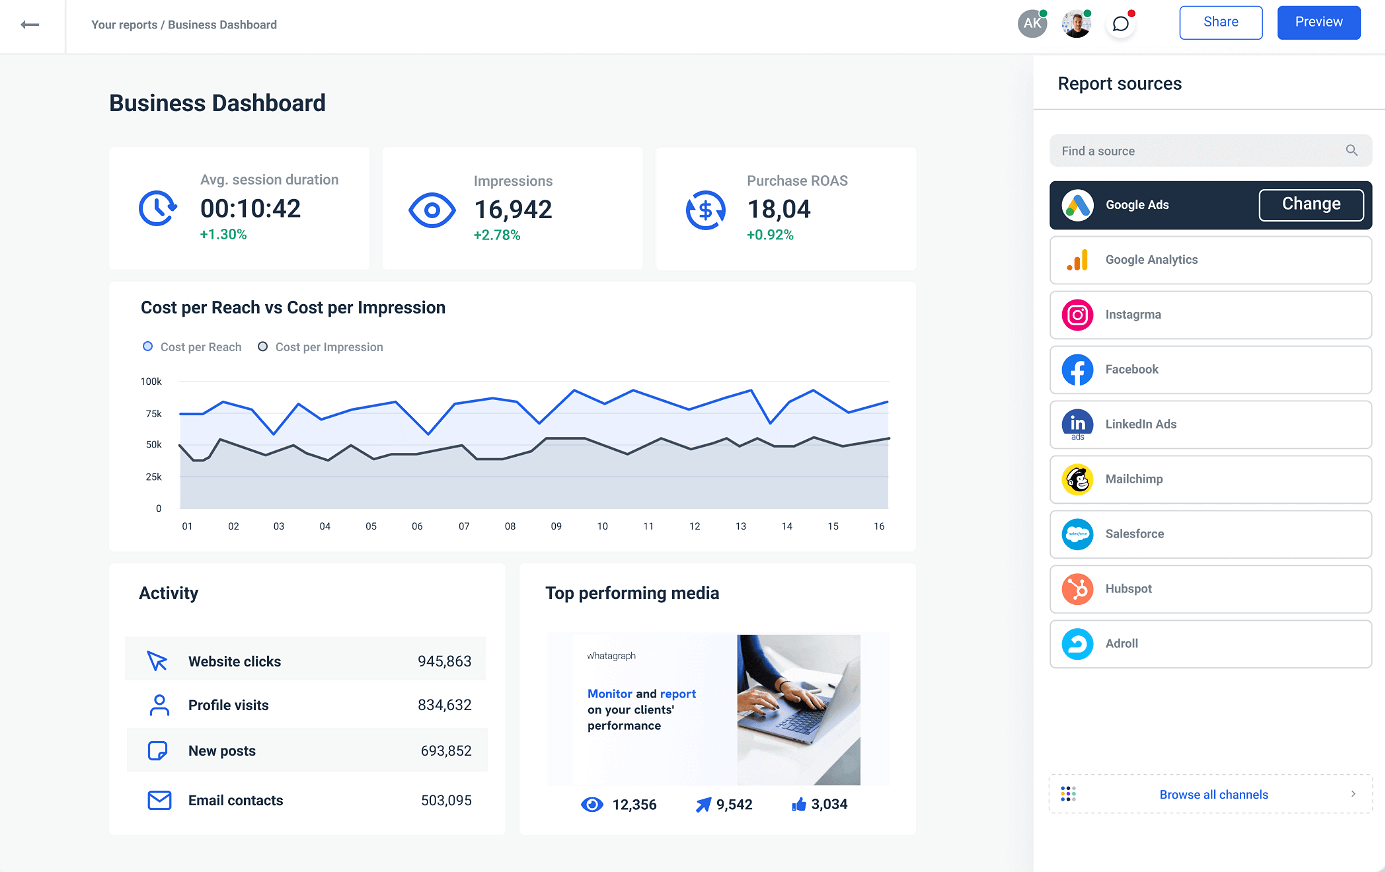
Instead of sending your stakeholders a confusing smorgasbord of reports from multiple tools, you can use one platform to visualize any data point from tools like Google Analytics 4, social media like Facebook and LinkedIn, SEO tools like Ahrefs and Google Search Console, email tools like Klaviyo and Mailchimp, e-commerce solutions like BigCommerce and Shopify, as well as HubSpot and Salesforce.
Apart from 45+ native integrations to popular digital marketing tools, you can connect any data source via a custom API, Google Sheets, or Google BigQuery.
Whether you pick a Whatagraph template or build one yourself, every report or dashboard is fully customizable. You can have data from multiple sources in one view or use the convenient tabs feature to organize your presentation.
Blend, unify, or group your scattered data before visualizing it using our no-code Organize feature. Save any transformation as a template for future use. Share your reports as automated emails or live links.
What does Whatahgraph help you achieve?
- Replace multiple complex tools with one easy-to-use platform
- Have all your cross-channel data connected in one hub
- Create stunning visuals in a few clicks
- Save dozens of hours working with data
- Manage data in an easy, no-code way
- Transfer your data to BigQuery without any code
Start a free trial of Whatagraph and cross valuable insights from your GA4 account with other marketing data sources for a 360-degree view of your marketing strategy.
So which one will it be?
Finally, how much does Google Analytics cost? It can be nothing or a lot, but which version is right for you?
The free version of GA probably has everything you need. But GA360 does everything GA4 does and more. Features like segment overlap help you go the extra mile with your data. With data becoming more important for businesses, there’s no question that GA360 will put you ahead of the competition.
Yet, it all boils down to resources. If you need advanced analytics features, fewer data limitations, and can afford to invest in the enterprise-level version without straining your budget, go for GA360.
If not, there’s comfort in realizing that GA4 is now more powerful than ever, as it includes many features previously available only on the paid property.
Published on Feb 20 2020
WRITTEN BY
Indrė Jankutė-CarmaciuIndrė is a copywriter at Whatagraph with extensive experience in search engine optimization and public relations. She holds a degree in International Relations, while her professional background includes different marketing and advertising niches. She manages to merge marketing strategy and public speaking while educating readers on how to automate their businesses.