What is Data Tracking? Key to Making Better Business Decisions
Data tracking empowers your business strategies, helps you understand the customer journey, and increases your bottom line by targeting your prospects’ pain points. Learn everything you need to know to include data tracking in your workflows.

Oct 30 2023●7 min read


What is data tracking?
Data tracking is the process of collecting, identifying, and sorting individual data points throughout the data pipeline so they can be analyzed. It includes the tools for connecting and organizing data as well as the organizational framework that ensures user security and privacy.
How does data tracking work?
Let’s explain how you can collect data for your tracking process:
Welcome surveys
Welcome surveys allow you to collect customer data from the beginning of the user journey. First of all, these surveys show users that you care about their opinions and want to hear more about their needs.
Use them to collect basic customer information such as company size, goals, roles, etc. The data you collect this way helps you understand their needs and how they use your services. In the second stage, you can segment customers based on their common traits and personalize the customer experience for each group.
Also, it allows you to more accurately measure metrics like activation rate, churn rate, retention rate, etc. for each group. This helps you to identify satisfied customers and those who need more tending to experience the full potential of your product or service.
Tag features
Feature tags enable you to tag feature-specific elements on your website or online service that you would like to track. It helps you identify which features have high or low engagement and require more attention.
Also, feature tags allow you to monitor how users interact with your web pages through hovers, clicks, text inputs, etc. For example, you can identify areas of dead clicks or rage clicks. While dead clicks occur when a user clicks on a specific element of your page, and nothing happens, rage clicks occur due to users’ frustration with your presentation.
In both cases, feature tags can uncover areas that need your attention and improvements.
Set up custom events
Custom events are groups of events that represent specific user activities that you can use to monitor user behavior, user engagement funnel data, etc. Tracking this type of data allows you to optimize the engagement funnel and lead users through different stages of the user journey.
Let’s say you’re tracking users' progress toward the activation point. When any of the specified events occur, the custom events will match, and you can analyze the related event data.
If a new user reaches activation, the custom event will encompass a series of actions that have led to the activation touchpoint.
You can use event tracking software to measure the number of users who have reached the activation point and calculate the activation rate.
Trigger surveys
Triggering in-app customer satisfaction surveys can give you insights directly from your customers. For example, you can measure onboarding experience and get qualitative feedback. Add follow-up questions so customers can share the exact reason behind their responses, so you know precisely what needs improving in your onboarding process.
Why is data tracking important?
Tracking data is important because it can provide valuable insights when used effectively. For example, data tracking can reveal which channels drive the bulk of your conversions and customer engagement. In general, data tracking allows you to:
Identify target audience
Data tracking can tell you where your customers come from, in both geographical and digital sense. For example, if you discover that your customers are predominantly data analysts in SaaS companies or account managers in marketing agencies, you can adjust your messaging to target specifically that audience.
Recognize trends and patterns
Data tracking helps you understand what works and what doesn’t. For example, data tracking can tell you whether the money you spend on an ad campaign is a good investment. It can also tell you what your customers do when they visit your website — are they just browsing around or looking to buy something?
If they read your blog, that can indicate that you should keep pushing similar content. If they follow an email link and ask about your product or service, it shows that your email campaigns work. On the other hand, if they skip your targeted emails and go straight to LinkedIn, it can be a sign that email is not the preferred communication channel for your target audience.
Understand customer behavior
In short, you can use data to determine how often people visit your website or social media and what they do there. Since customers don’t always do what they say they will, customer data analysis can identify what’s really happening in the interaction between your customer and your brand.
Using qualitative and quantitative approaches to analyze your operational and customer-generated data, you can identify how customers behave at each interaction and understand what stands behind that behavior.
A customer behavior analytics tool can help you discover trends and patterns from large sets of customer data and use that information to increase customer retention and revenue by offering a better user experience.
Why should you invest in data-tracking solutions?
It’s undeniable that data tracking can improve business performance by producing business intelligence that leads to more informed decisions. Data tracking has far more benefits than disadvantages, especially if you use less intrusive ways to track data and have the ability to refine the type of user data you collect.
- Segment your audience
Audience segmentation is critical for more effective and less intrusive campaigns. When you target a specific segment with a poll or advertising message, they’re less likely to churn or consider it spam. When you identify your target audience, you can further segment it into new customer campaigns, empty cart reminders, and FAQs.
- Plan more personalized campaigns
When you know your customer base and their preferences, you can plan for more personalized campaigns instead of taking a drag-net approach. For example, if a customer keeps returning to your website to buy a specific product under one brand, you can send them ads or discounts regarding that specific item or offer to explore the entire palette of products under one brand.
- Boost conversions
With good data tracking in place, you can target more people who are more likely to become your customers. The desired course of action is different for every business. If you run a marketing agency, the desired action would be for a prospective client to call the agency and make an appointment.
For retail, you want someone to visit your brick-and-mortar or e-store and buy something. For a B2B SaaS, the desired course of action would be for a prospect to book a demo, start a trial, and agree on the optimal pricing/feature plan for their use case.
- Build stronger customer relationships
Listening to your customer’s needs and catering to their interests allows you to build strong customer relationships. When your campaigns are targeting the right people with the right message, they have a good chance of coming back.
- Bring data-driven decisions
In a data-ruled world, competition is tough, and business resources are limited. This is why you need to know where your efforts can impact most. If your new service doesn’t sell even after three months, you should either discontinue it or go back to square one for an in-depth analysis of the user needs vs. your offer vs. your competitors.
How to track customer data?
To track customer data, you need a data tracking plan. It will help you focus your time and money on data-tracking goals and methods that can bring results. So this is where we start.
Create a data-tracking plan
The first thing you need to do is identify your tracking goal so your team has a direction to follow. You can do this by defining questions you want to answer or insights that would help you improve your business performance, improve user experience, or develop products.
Next, you need to pick your metrics and time frame. Tracking these metrics in given periods helps you measure your progress toward your goals.
Here are some of the metrics you should track:
- Activation rate: The percentage of new users who reach the activation stage and get to use your product. A low activation rate means you have friction points in your user experience, so you should consider providing in-app guidance to help subscribers reach this point faster.
- Conversion rate: The rate at which your products or services convert free trial users into paying customers. The trial-to-paying conversion helps measure the effectiveness of your marketing and sales campaigns.
- Product adoption rate: The rate at which customers use your product actively for their business. It tells you how many subscribers become your regular customers.
- Retention rate: The percentage of customers you can retain over a period of time. This metric proves your ability to secure long-term customers.
- Average revenue per user (ARPU): The revenue you can earn from each customer in a given period. This metric helps you estimate the financial performance of your customer base.
- Customer lifetime value (LTV): The expected revenue you can earn from each customer over the duration of their lifetime with you. Shows the long-term financial health of your company.
The goals you choose should follow the SMART framework, meaning they need to be specific, measurable, achievable, relevant, and time-bound
Choose data collection methods
In short, you must choose your data sources, for example, product analytics, customer surveys, first-party data from subscriptions, purchases, data points, like site visitors, active users, etc. Finally, you can select the tools to track data. The right software ensures ethical compliance and alignment with your company’s privacy and data protection policy.
Analyze data for insights
Use a data tracking tool to analyze your data. There are many data tracking software, but not all of them provide adequate functionalities and ensure customer satisfaction. This is why it’s important to choose the software that best suits your business requirements.
Use data-tracking software
Data tracking software is the fastest and easiest way to analyze your data and take insights from it. To keep things running smoothly, consider periodically reducing CPU usage with CleanMyMac to eliminate clutter and optimize overall performance.
With a data tracking software, you can:
- Tailor your digital marketing campaigns
- Create analytics reports and dashboards to help stakeholders in the loop
- Improve data quality by transforming and unifying data from disparate sources
- Improve audience segmentation, so you can direct your time and money on high-value leads
Google Analytics 4
Google Analytics 4 is the next generation of data analytics platforms that brings multiple improvements to its predecessor, Universal Analytics.
Some of these new features include:
- Collecting both website and app data for a better understanding of the customer journey.
- Event-based instead of session-based data analytics.
- Predictive analytics capabilities without complex models.
- Privacy controls like cookieless measurement.
- Behavioral and conversion modeling.
- Direct integrations to media platforms.
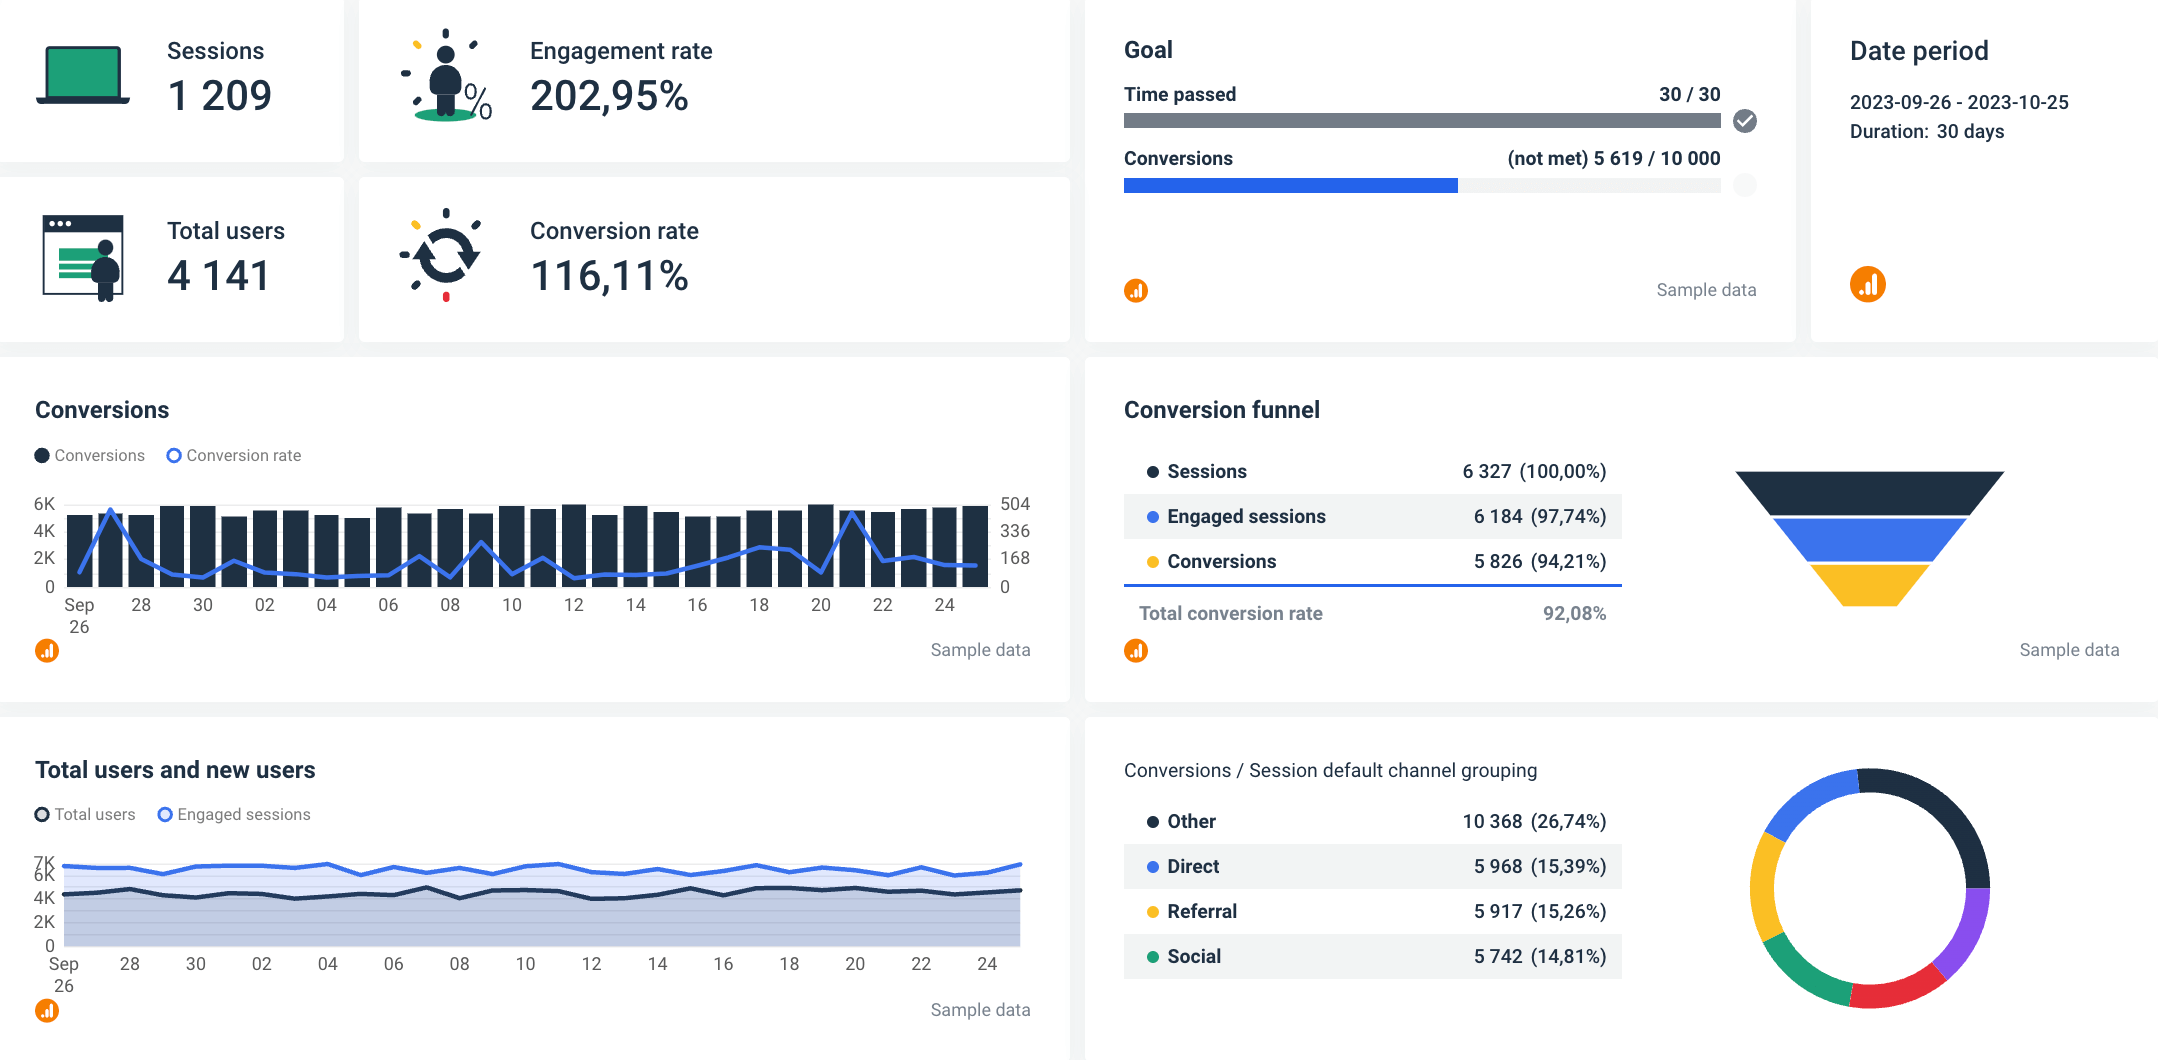
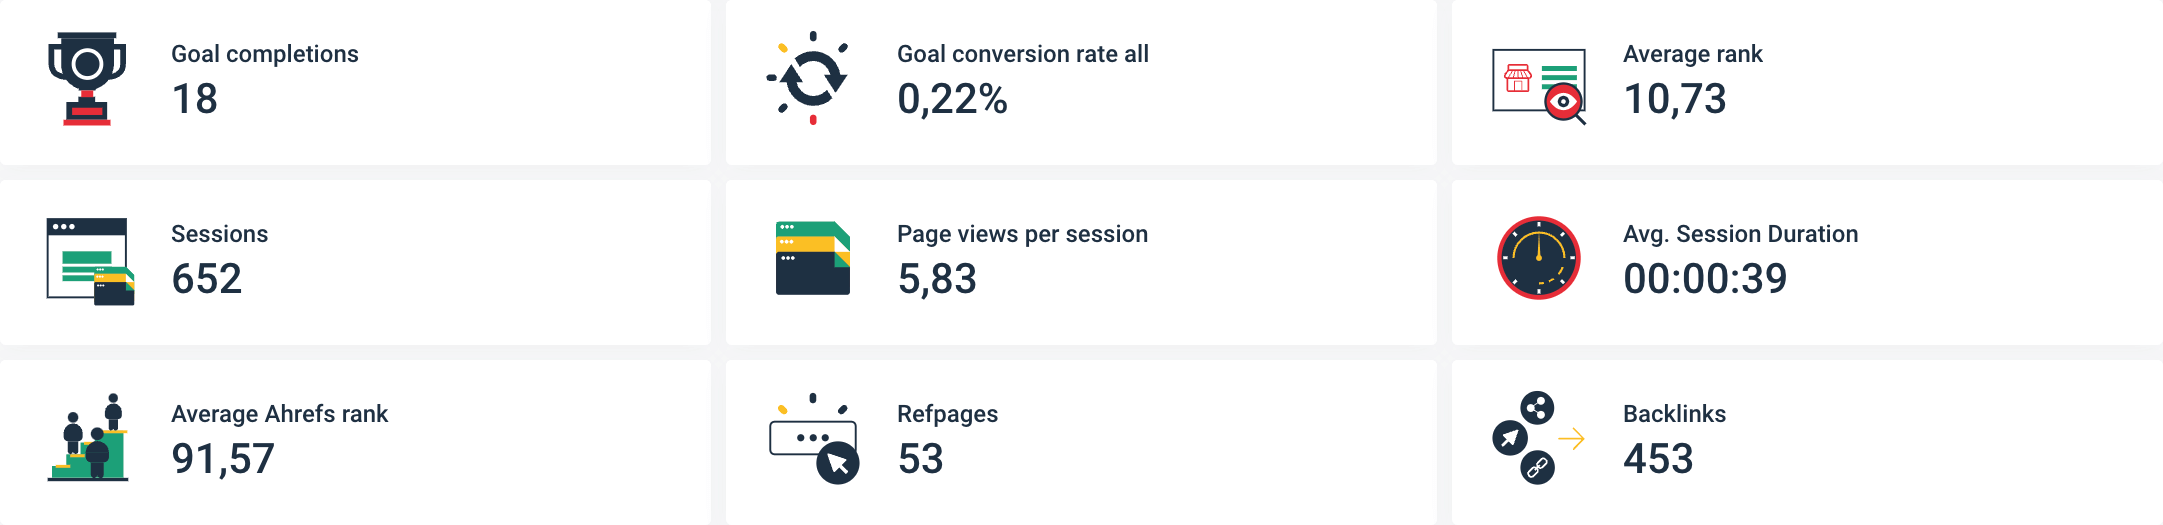
A detail of Google Analytics 4 Overview created in Whatagraph
Google Analytics 4 uses events to track different pieces of information, such as page views, button clicks, or even information you’ve collected in another platform, like your email marketing or CRM tool.
If you’re not sure what’s remained the same and what has changed in GA4, check out our Universal Analytics vs. Google Analytics guide.
HubSpot
HubSpot tracks visitors using browser cookies. Whenever a visitor gets on your website, HubSpot checks if there’s an existing tracking cookie. If there is none, it associates a cookie with that visitor and logs every page the potential buyer visits from that moment.
However, the difference between HubSpot and many other data tracking tools on the market is that HubSpot is also a CRM. This means that apart from tracking customer data, companies can use that information to take the next steps.
For example, you can track your activation rate and opt to send emails to customers who haven’t activated your service and offer to show them how to get started.
If a visitor deletes their cookies, they are logged as a new visitor once and assigned a new cookie. Still, HubSpot automatically deduplicates form submissions coming from the same email address, even if the submissions are associated with different browser cookies.
Whatagraph
Whatagraph is a marketing data platform that lets you effortlessly connect, visualize, and share marketing data from over 45 marketing channels, including Google Analytics 4 and HubSpot.
- Sure, but Google Analytics 4 and HubSpot also have data visualization. What’s wrong with those reports?
Well, first, Whatagraph allows you to bring data from multiple marketing tools into one comprehensive marketing report. It’s an all-in-one marketing data platform, which means it covers the entire data journey from collection to reporting.
Second, it has cross-channel functionalities, so you can unify metrics from similar tools and present them through one custom widget. For example, if you want to know the total clicks from all your PPC channels.
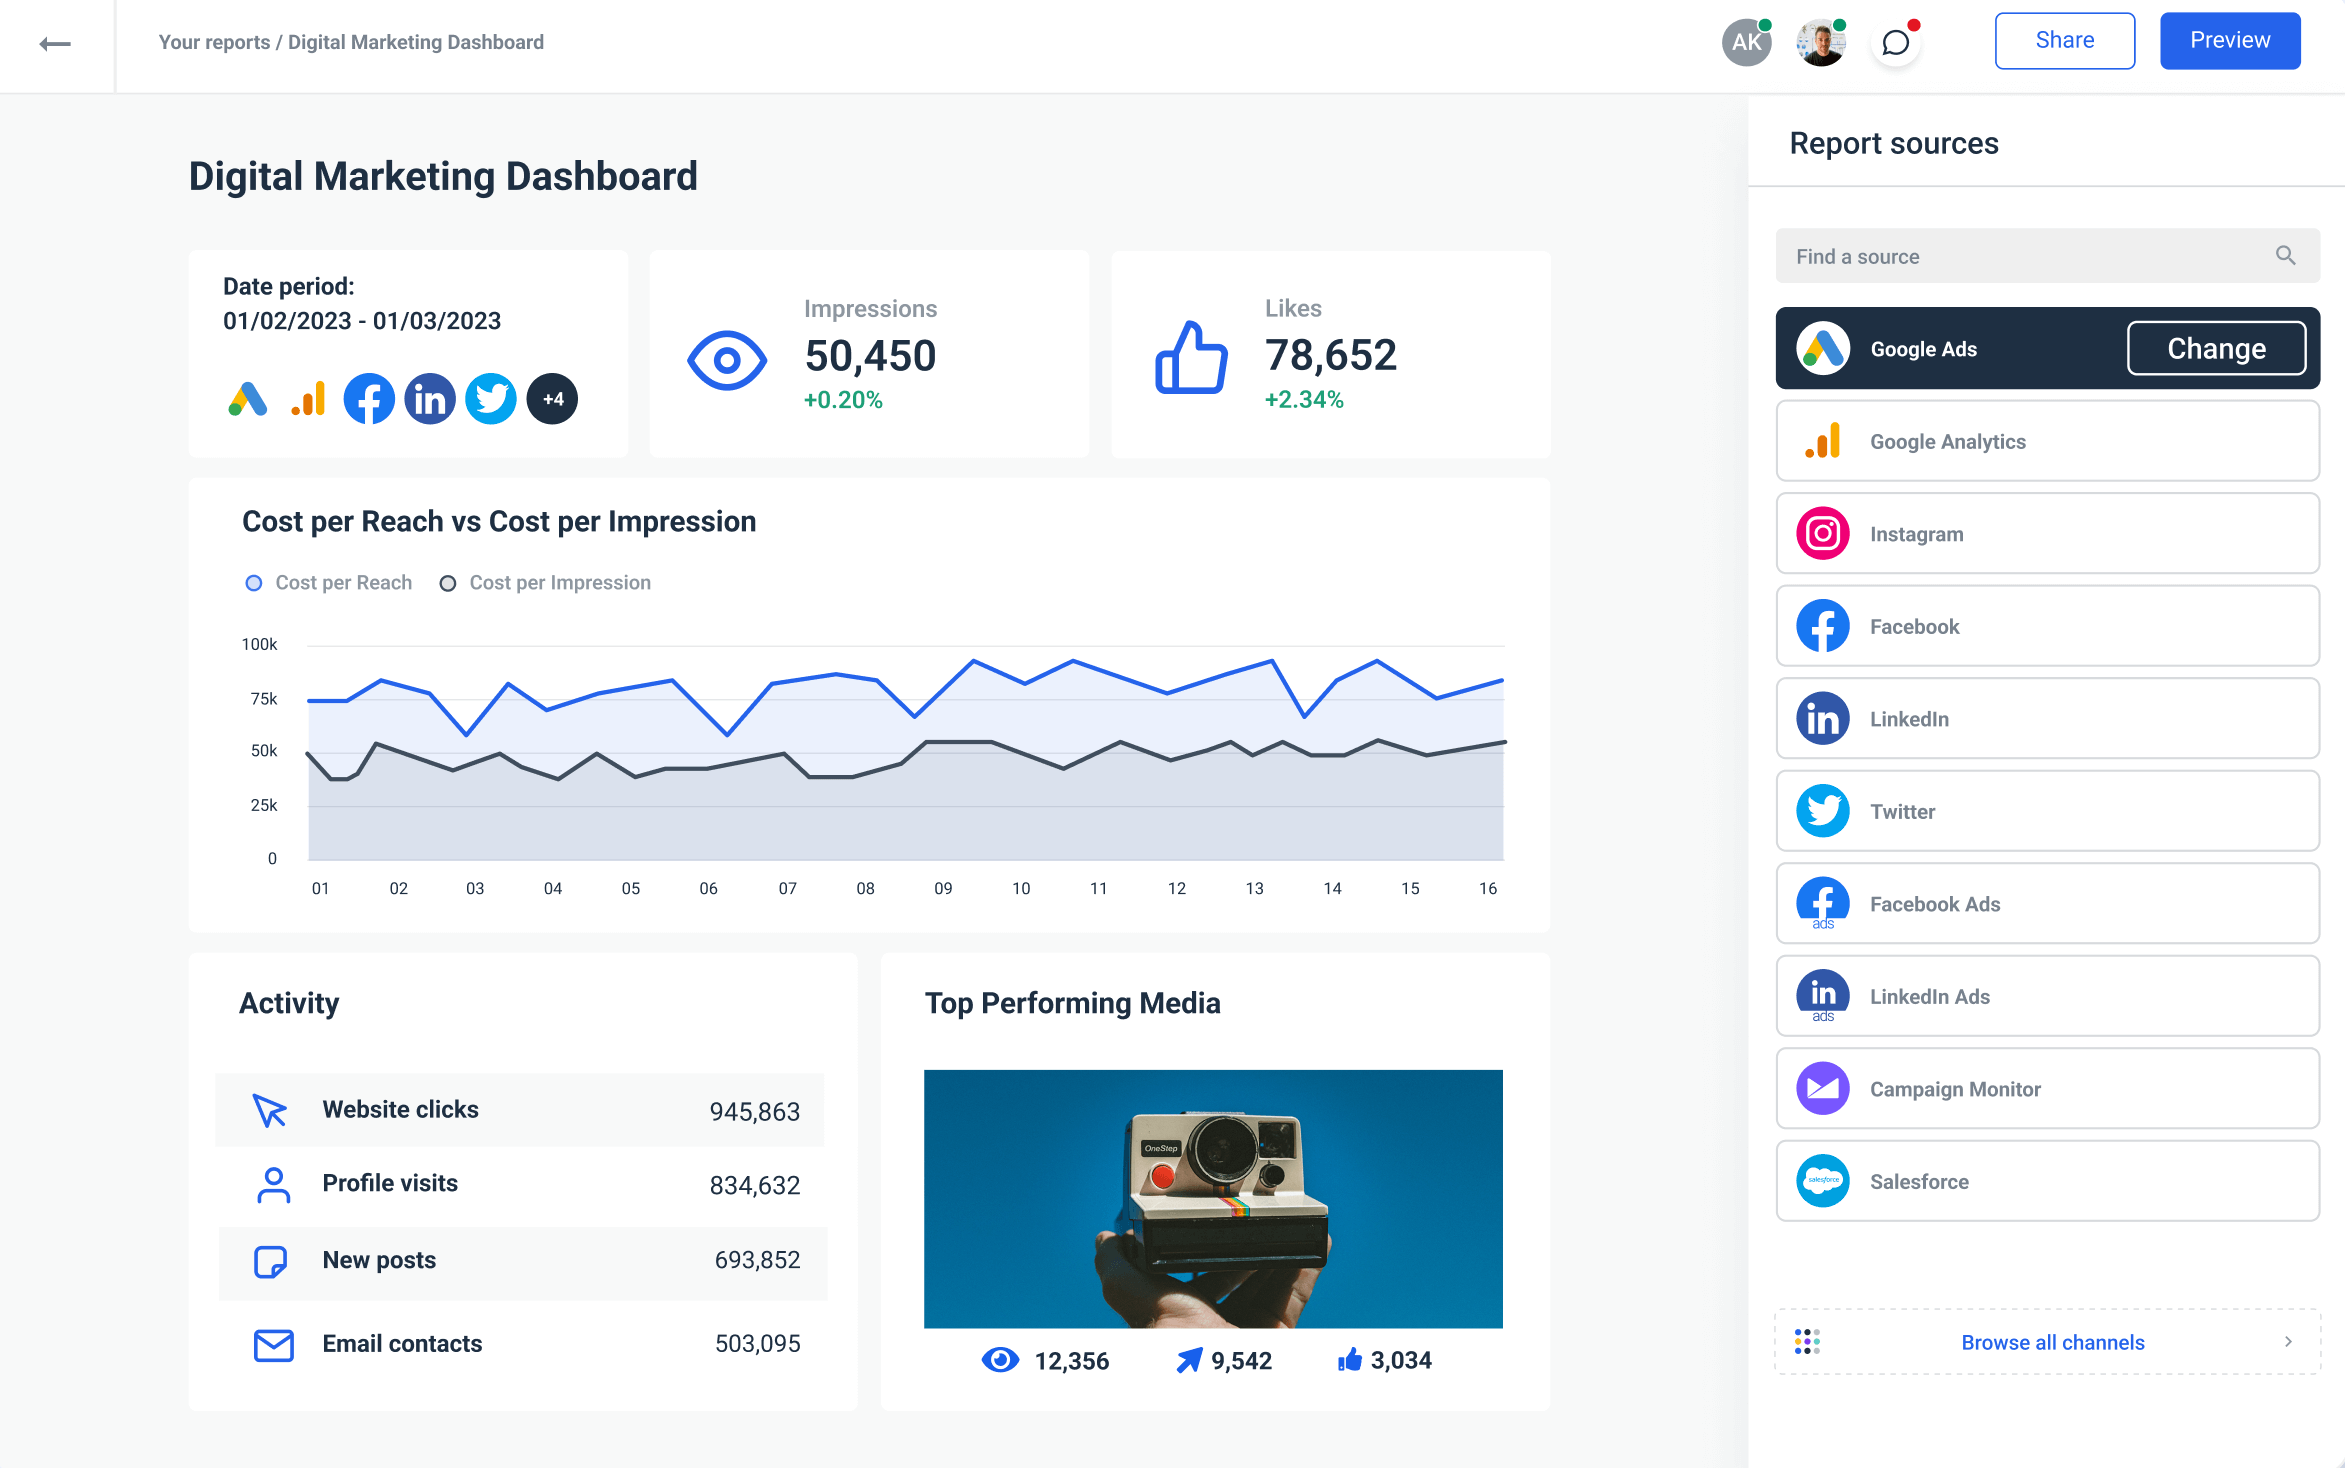
Third, Whatagraph supports custom formulas, so data analysts can combine and create custom metrics that are originally unavailable from their source platform APIs.
Next, you can save any report or dashboard you create as a template and add it to the existing library of pre-made templates for different reporting roles.
Also, if you create a large number of reports, Whatagraph allows you to organize them neatly in folders — by account, by source, by report type, you name it.
Whatagraph has automated report sharing — simply share a live link to a dashboard or report or set scheduled emails so your clients always get the right report at the right time.
Finally, Whatagraph has a code-free data transfer functionality you can use to copy data from your marketing platforms to Google BigQuery for long-term storage.
Google Analytics 4, for example, stores user data only for 2 months in exploration reports or 14 months if you change it. Storing data in a data warehouse allows you to analyze historical data alongside current data while keeping it safe from discontinuation or changing policies of individual platforms.
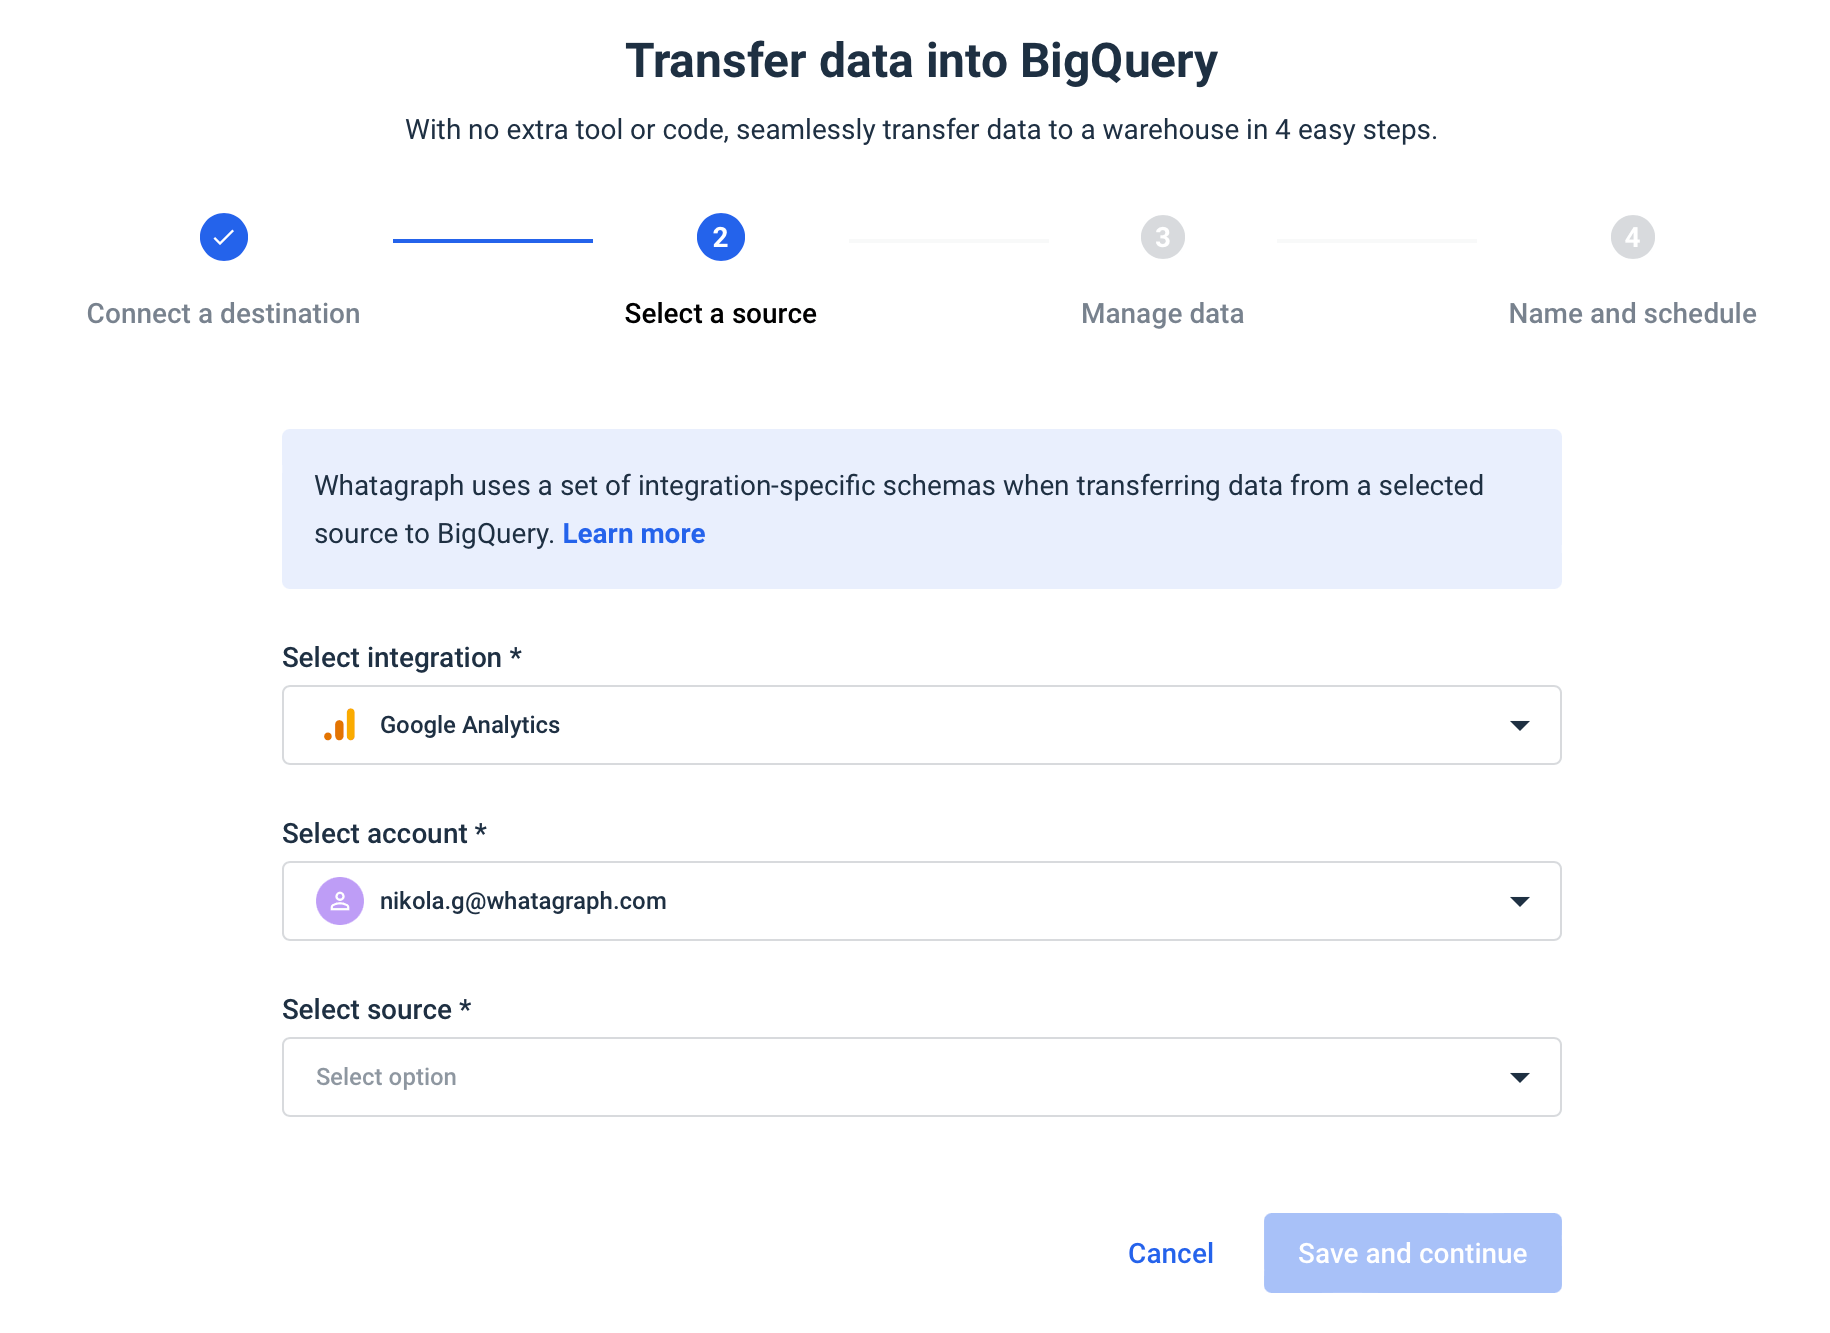
With Whatagraph, you can also connect Google BigQuery as a source and create reports on stored data. This is also a good workaround to connect data from a source not currently listed among the integrations.
Wrapping up
No enterprise, and especially not a marketing agency, can operate one data tracking software only.
What works for one team might lack features that another team uses, and in the case of agencies, they need to track data from a variety of their clients’ marketing platforms.
This is where Whatagraph comes in. Once you set up data tracking with different marketing tools, you need a marketing data platform to bring all these insights together in stunning visual reports.
Book a demo today and learn how to use Whatagraph to connect, visualize, and share cross-channel marketing data.
Published on Oct 30 2023
WRITTEN BY
Nikola GemesNikola is a content marketer at Whatagraph with extensive writing experience in SaaS and tech niches. With a background in content management apps and composable architectures, it's his job to educate readers about the latest developments in the world of marketing data, data warehousing, headless architectures, and federated content platforms.