7 Best Improvado Competitors and Alternatives in 2026
Improvado is a powerful marketing data aggregation, but many find it complex, expensive, and difficult to use.
To help you find the best Improvado competitor, I did three things:
- Spoke with our customers who previously used Improvado
- Dug through online reviews and community forums to find the best alternatives
- Tested each tool ourselves
Full disclosure—one of the tools on this list is ours. But that’s because we genuinely believe Whatagraph solves the biggest pains marketers face with Improvado.
We’re not here to bash our competitors, though. We’ve researched each tool thoroughly (and even tried them ourselves) so you can get a clear picture of what they’re great at—and whether they’re the right fit for you.
By the end of this article, we hope you’ll find an Improvado alternative that fits your workflow, your team, and your clients—whether it’s us or not.

Jan 13 2026●12 min read


Based on ex-Improvado users we’ve talked to and online reviews, here are the key issues with the platform:
❌ Requires a separate visualization tool: Improvado doesn’t have built-in dashboards ready for client reporting. You need to use an external data visualization tool like Looker Studio which adds friction and costs.
❌ Technical lift and complexity: Users report that Improvado is not beginner-friendly. You’d need a developer or data specialist to set up data models, manage Looker dashboards, and maintain workflows. This makes it challenging for marketers who don’t have technical background or in-house engineers.
❌ Limited customization: While Improvado offers some customization, users find that it’s not enough for building tailored dashboards across multiple clients or campaigns, especially when using Looker Studio without advanced Looker expertise.
❌ Opaque and expensive pricing: Users share that Improvado’s pricing isn’t transparent, requiring sales calls to get quotes. Many agencies and small businesses find it expensive for what it offers, especially when adding the extra cost of Looker Studio.
❌ Slow, clunky onboarding: Users report a long setup process before Improvado becomes manageable. Even after setup, maintaining data pipelines and troubleshooting issues often delays getting actionable insights.
And users also note that support during onboarding and troubleshooting can be slow or lack clear communication, making it difficult to resolve technical issues quickly.
—
If you’re experiencing one (or all) of these issues, we’ve got your back.
In this article, we’ll take you through 7 best Improvado alternatives which are a mix of all-in-one marketing analytics tools and data aggregators.
7 Best Improvado Competitors and Alternatives in 2026
In a nutshell, here are the 7 best Improvado competitors and alternatives we’ll review in this article:
- Whatagraph
- Funnel.io
- Supermetrics
- Fivetran
- Klipfolio
- AgencyAnalytics
- Tableau
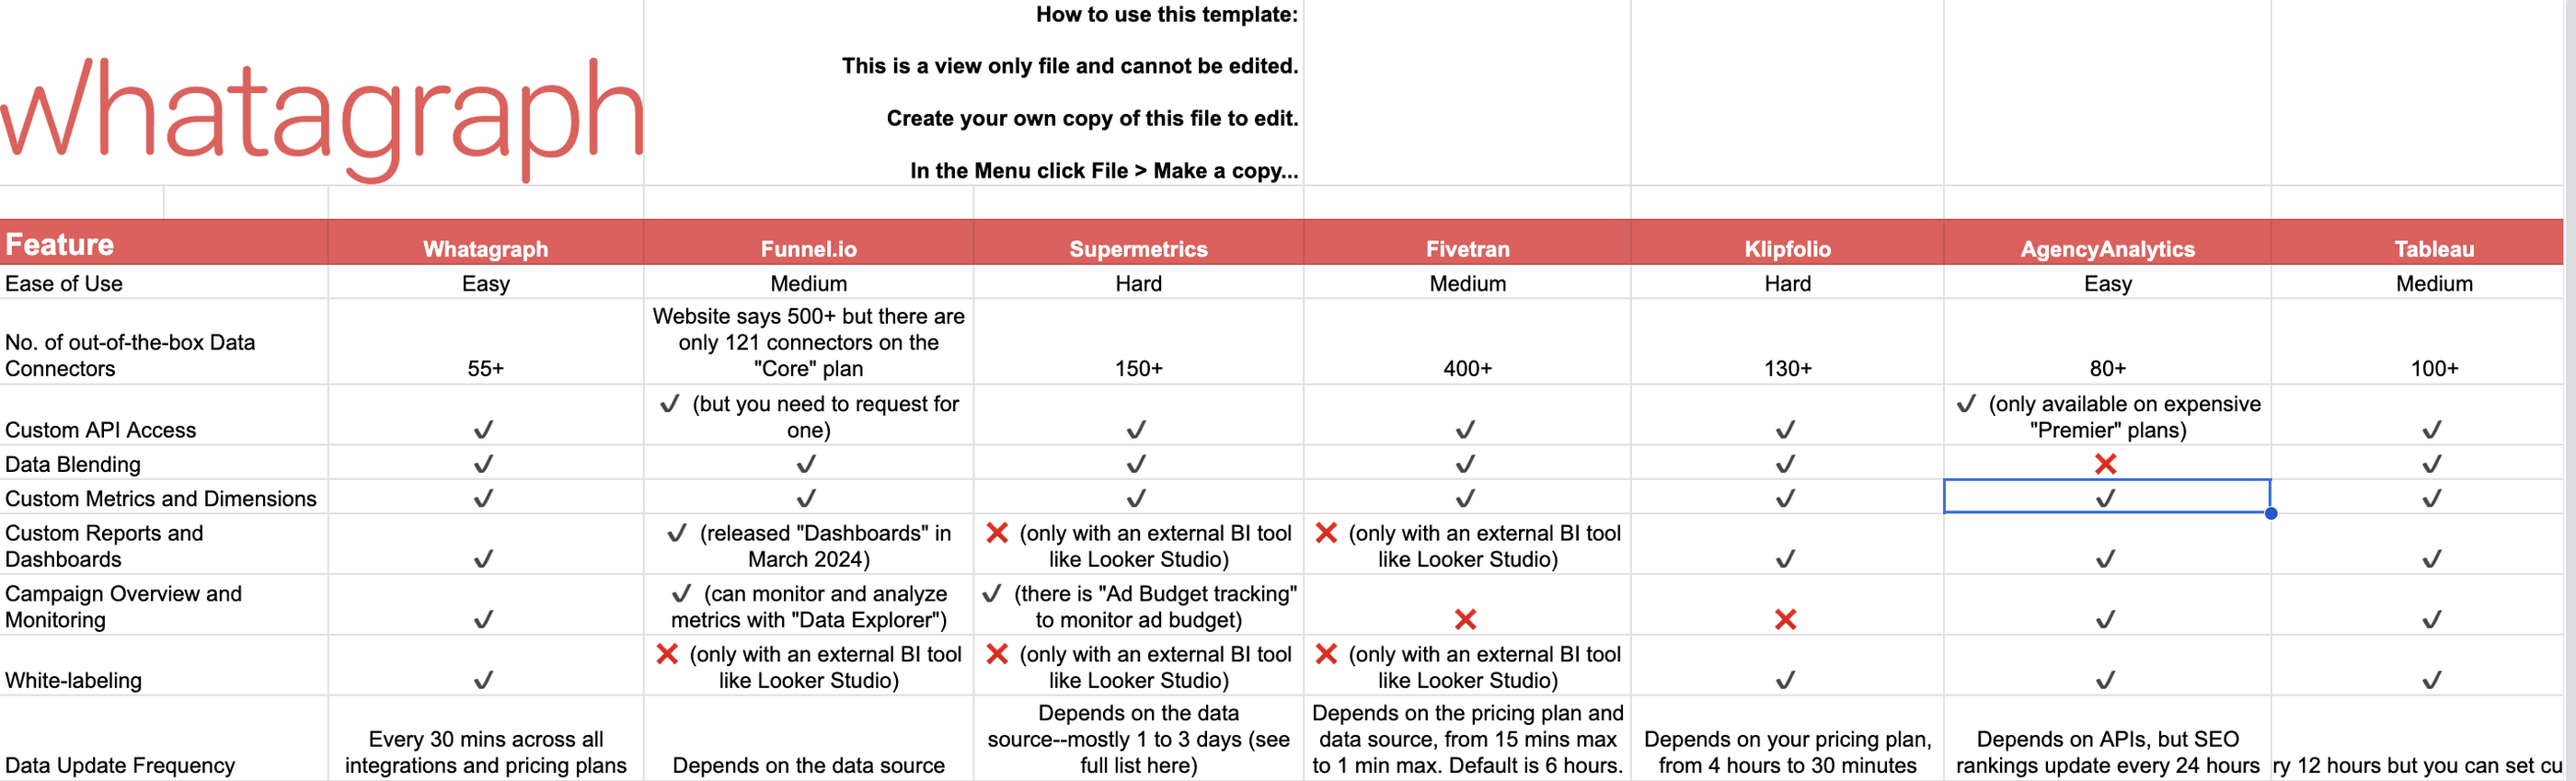
Want a complete feature comparison of these tools? Find it in this free Google Sheets and copy it for your own use. Here’s a little sneak peek:
1. Whatagraph
Most suitable for: Medium to large marketing agencies and teams with 10+ employees
Whatagraph is an all-in-one marketing intelligence platform that makes it refreshingly easy to connect, organize, visualize, and act on your marketing data in one place.
In a nutshell, here’s what you can do on Whatagraph:
- Bring data from 55+ marketing platforms automatically via native, stable connectors.
- Easily organize your data—create custom blends, metrics, and dimensions using no-code workflows or AI.
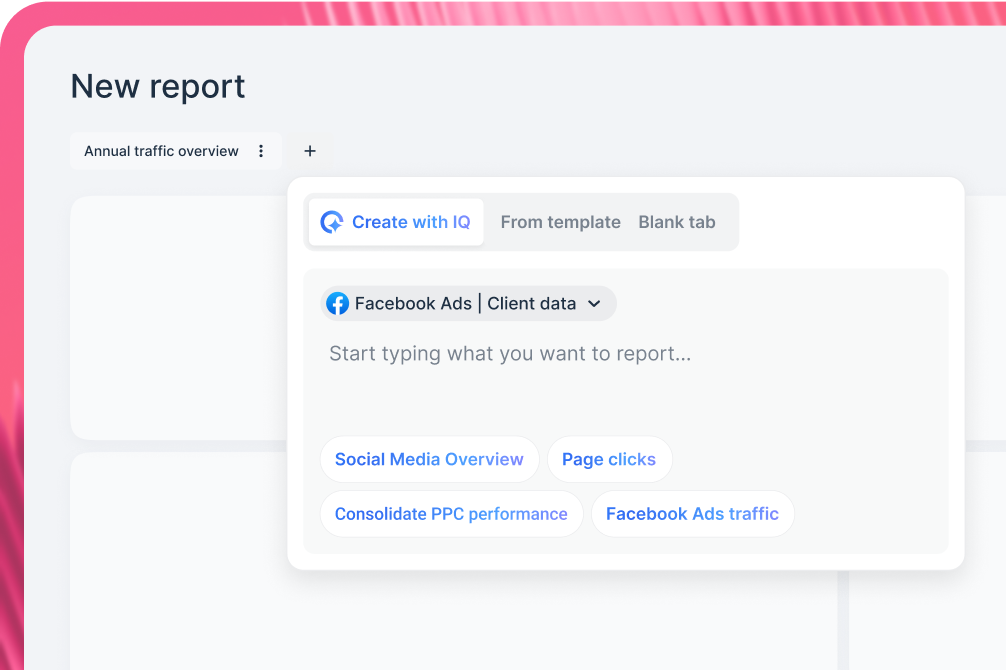
- Ask AI to create reports by just telling it what you want it to build. Or use drag-and-drop widgets or ready-made templates to build one from scratch.
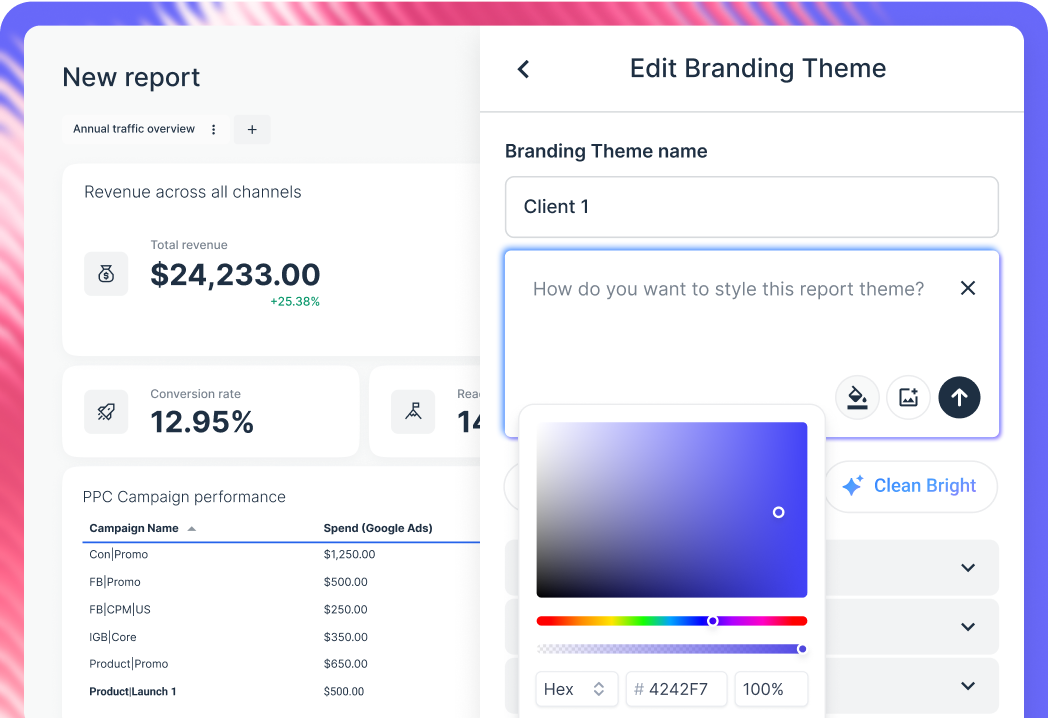
- Customize reports in seconds by just uploading a screenshot of your (or your client’s) brandbook or putting in a prompt. Host and share reports on your own domain.
- Analyze your data with granular filters and tags. Spot trends, compare performance, and get actionable insights from your data in seconds.
- Share reports as live links, PDFs, Excel spreadsheets, or automated emails. You can also transfer your data to BigQuery data warehouse or Looker Studio.
 But how does Whatagraph compare against Improvado exactly? Let’s get down to business.
Improvado vs. Whatagraph: Head-to-head Comparison
Here are four key ways Whatagraph solves the pain points of Improvado:
1. All-in-one platform, no separate tools needed
One of the biggest frustrations we hear from Improvado users is that you need to pair it with Looker Studio (or another BI tool) just to build and share dashboards.
An ex-Improvado user summed it up perfectly on a call:
Our main concern with Improvado is you need to create your dashboards from Looker, but we don’t have any knowledge or specialty in that. It’s quite complicated for us. And whenever we need help, we don’t have a data person to support us, and changes don’t always stick in Looker.
Improvado does handle data aggregation well, you’re left managing two separate tools, two support teams, and two invoices—plus all the headaches of learning Looker Studio just to build reports.
What makes Whatagraph the best Improvado alternative is that it’s not just a data aggregator—it’s an all-in-one marketing intelligence platform.
With Whatagraph, you can connect your data, clean it, create and share reports, extract insights, and make fast decisions—all without ever leaving the platform.
This means you DO NOT need to:
❌ Learn how to use so many different tools – like Improvado and Looker Studio
❌ Pay for separate tools and connectors
❌ Deal with different invoices and Customer Support teams
You pay for one tool, you use one tool, and you get everything under one roof. (Imagine how much time, brainspace, and money you can save.)
In fact, we’ve got just the right kind of story for you.
Kim Strickland, Digital Marketing Specialist at Peak Seven agency, was using a data aggregator + Looker Studio to create reports, which was a massive headache for her.
She told us in this case study:
The first report I created on Looker Studio took me 40 hours—and it was slow and always breaking. The entire setup was just time consuming, frustrating, and a constant guessing game.
But this changed when she switched to an all-in-one platform like Whatagraph.
She saved a whopping 63 hours per month on reporting which translated into $9K+ savings for clients—and democratized insights for clients and teams.
With Looker Studio, everything was muddled, but Whatagraph has opened up transparency and communication. Our relationships with clients have been amazing, and we’ve even been able to retain them longer.
2. Zero learning curve, extremely easy to use
Another recurring theme in Improvado reviews is how difficult it is for the average marketer to use.
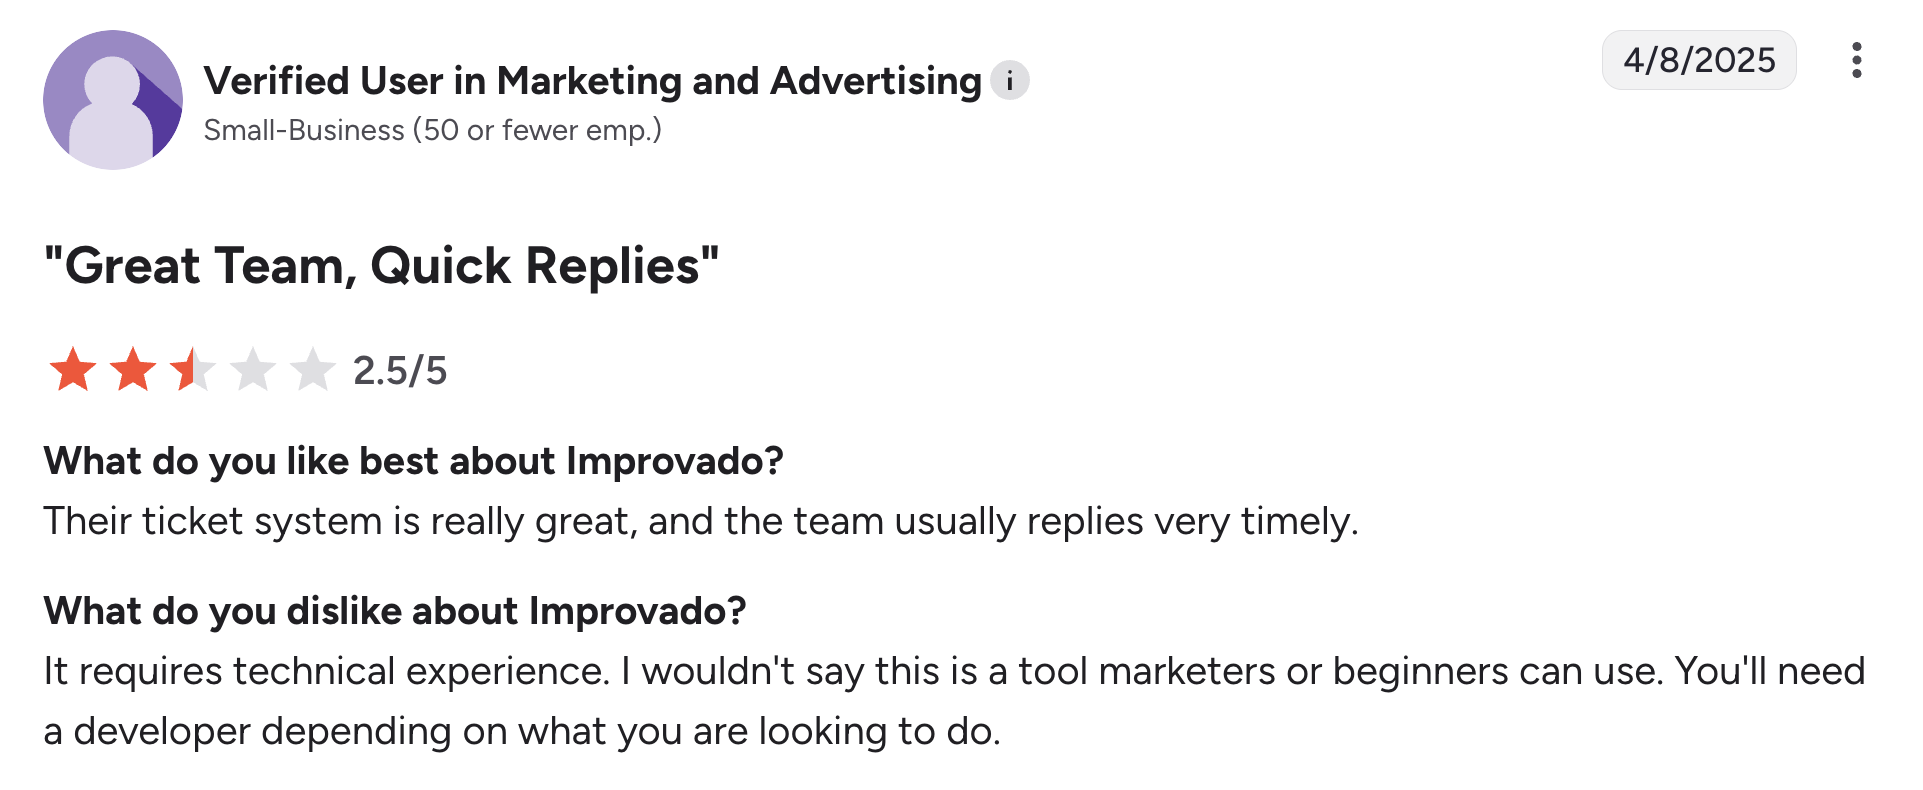
One user put it plainly: “I wouldn’t say this is a tool marketers or beginners can use. You’ll need a developer depending on what you are looking to do.”
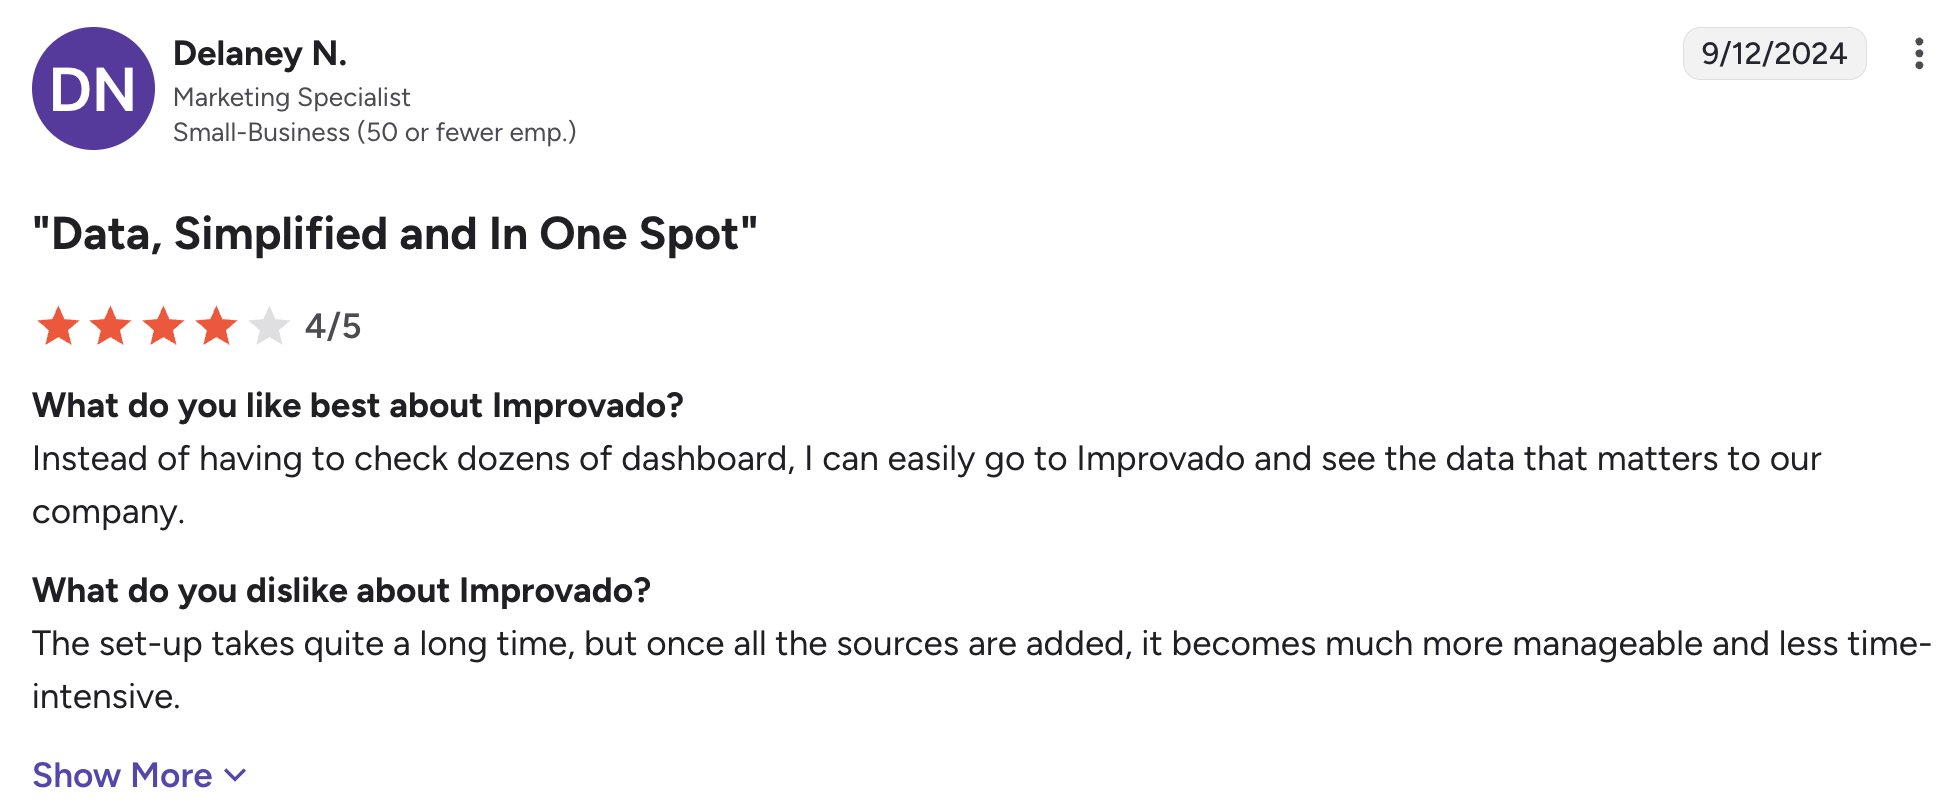
Another user shared that while they liked having their data in one place, the setup took a long time and was time-intensive before it became manageable.
In short, Improvado often feels like it’s built for data engineers—not marketers. If you don’t have technical expertise, you’ll end up spending extra time (or budget) to get your reports up and running.
And don’t forget: you still need to use an external data visualization tool like Looker Studio, which is another tool you need to learn how to use.
In contrast, with Whatagraph marketers can stay marketers—not become data scientists. You don’t need to learn complex workflows, run SQL queries, or build Looker dashboards to turn your data into reports.
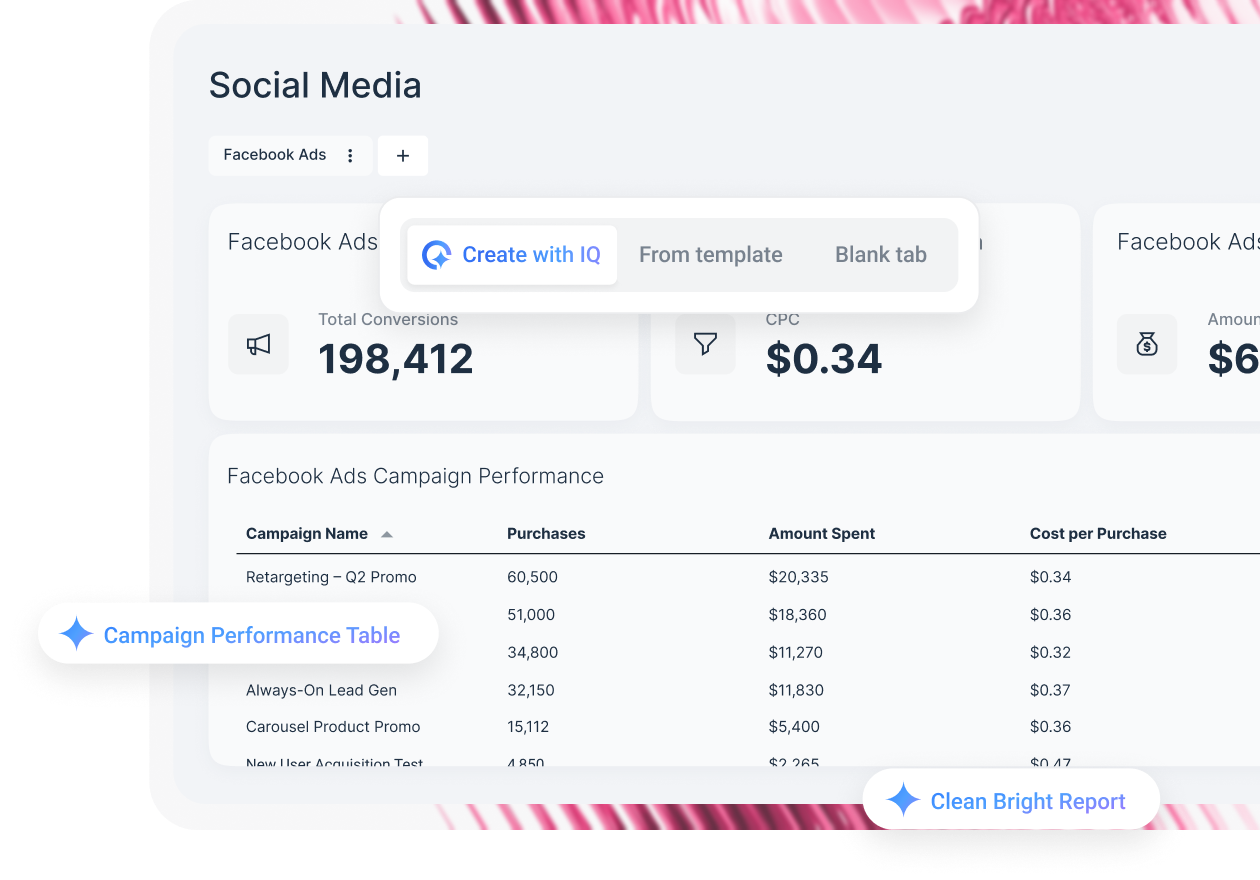
With our newly released Whatagraph IQ, you don’t even need to build reports manually anymore. Just tell the platform what you need, and it does the heavy lifting for you:
✅ IQ Report: Create entire reports from a single prompt—complete with layouts, widgets, and the metrics you need, without digging through settings.
✅ IQ Theme: Upload a brand guide screenshot or type a prompt, and Whatagraph will detect fonts and colors and apply them to your report in seconds—keeping everything on-brand without manual work.
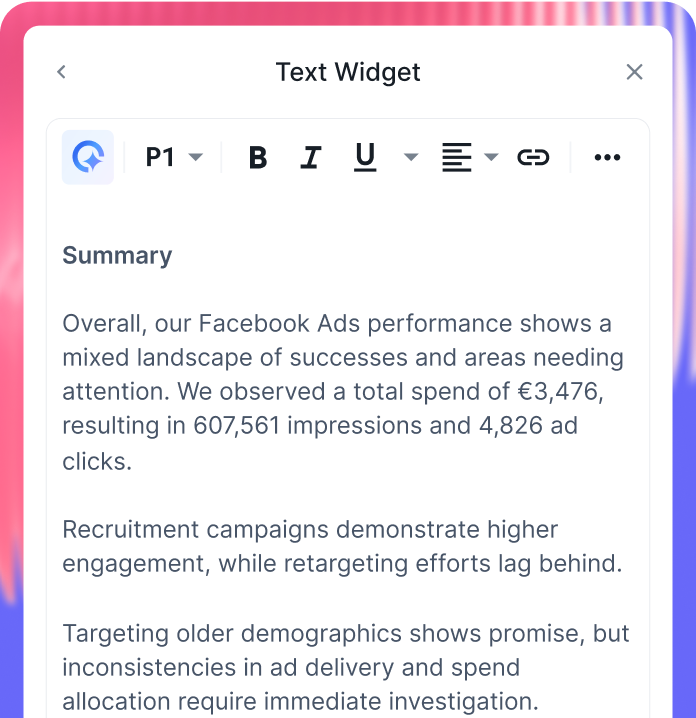
✅ IQ Summaries: Let AI generate clear, client-friendly insights and performance summaries in 18 languages, saving you hours writing updates for clients.
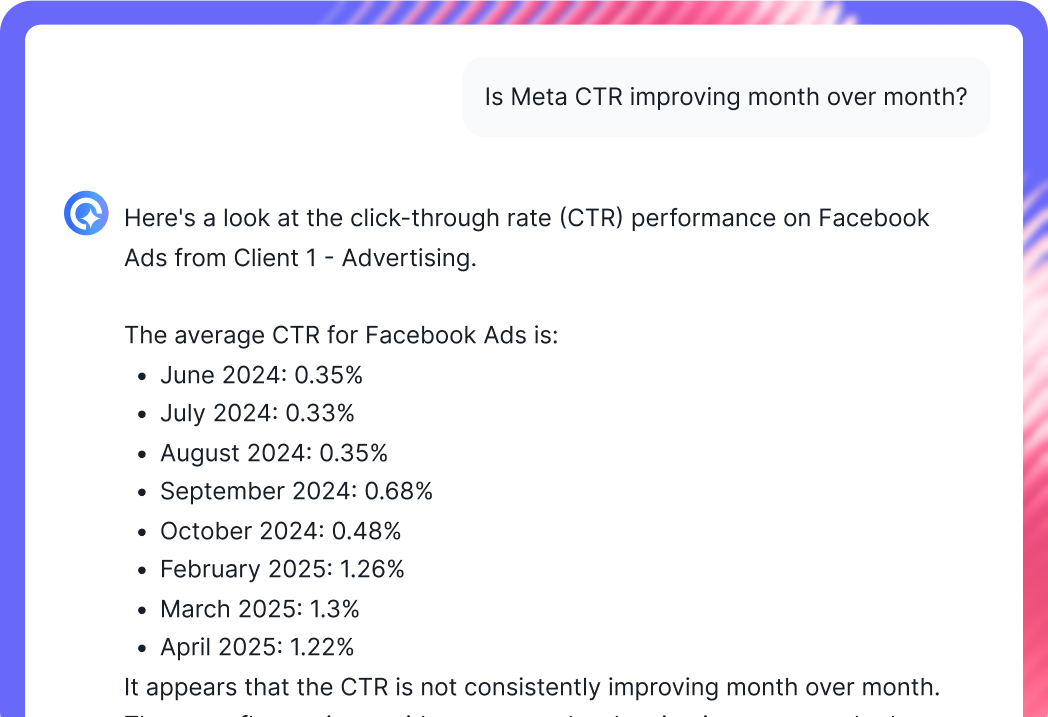
✅ IQ Chat: Need a quick campaign breakdown or performance analysis? Ask directly in your report and get instant, accurate insights from your connected data—no hallucination, no security breaches.
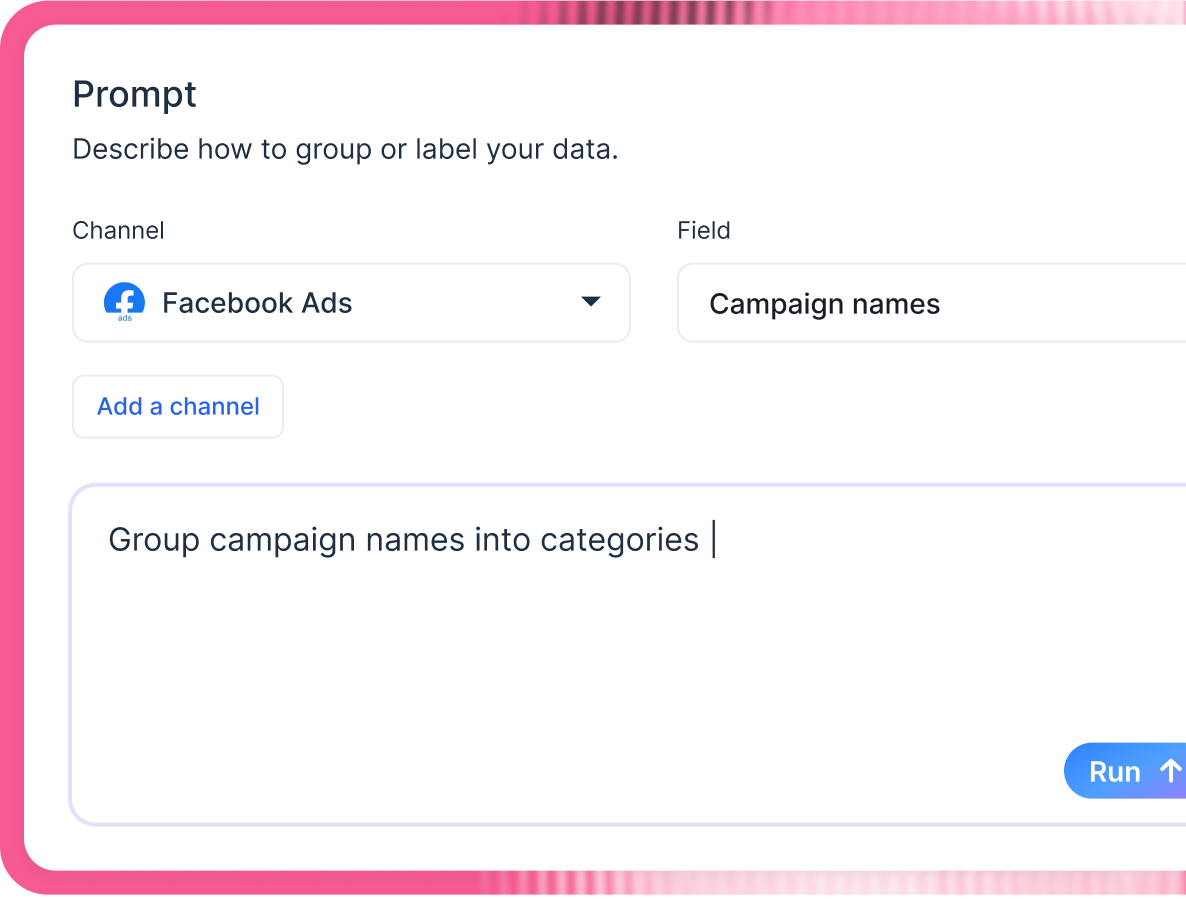
✅ IQ Dimensions: Describe how you want your data organized—like grouping campaign names by category or sorting product reviews by language—and let AI create clean, consistent custom dimensions for you, automatically.
Compare all this to Improvado, and you can clearly see how Whatagraph is going to save you massive time, brainspace, and money.
3. Amazing Customer Support + Customer Success that doesn’t lack
Another recurring frustration agencies share about Improvado is inconsistent customer support and customer success experiences.
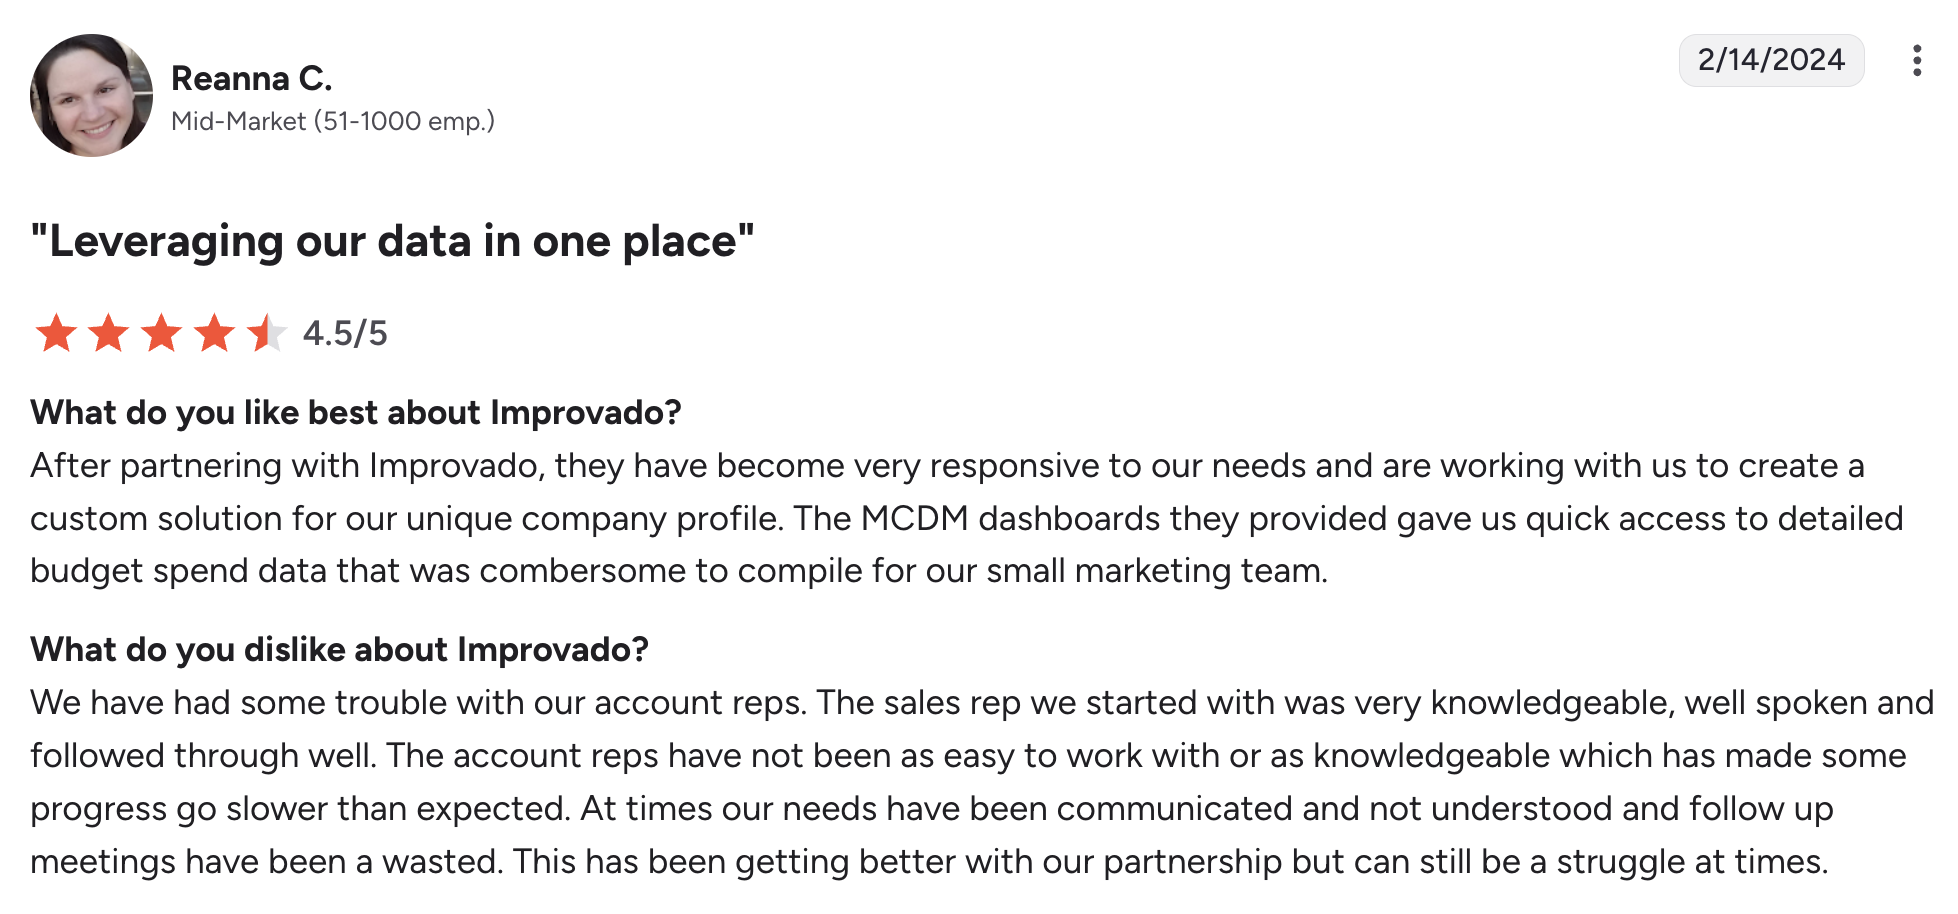
As one user put it in a review that they’ve had “some trouble with their account reps” and that they “have not been as easy to work with or as knowledgeable”.
With Whatagraph, however, we are dedicated to your success and we show that consistently.
Once you sign on with us, you’ll get:
✅ Fast, friendly, human support via live chat, with real people who understand marketing reporting and replies within 4 minutes and resolves most issues within 4 hours.
✅ Dedicated Customer Success Managers for onboarding, training, and proactive check-ins to help you get value—not just tickets closed.
✅ Hands-on help with your reports, integrations, and data workflows, so you’re never left to figure it out alone.
✅ An extensive, easy-to-navigate Help Center if you prefer self-serve learning.
We’ve heard it time and again from agencies that switched from Improvado and other tools: the difference in support quality alone is worth the move to Whatagraph.
Take Kim Strickland from Peak Seven, for example. She told us:
I've joked about this often—with Whatagraph, we're not paying for a reporting system. We're paying for customer support. There's a level of dedication from the Whatagraph team that you don't often experience anywhere else.
Whenever Kim ran into roadblocks, she simply reached out to our live chat support and had issues resolved within an hour. For bigger issues, the team kept her updated until they were fully resolved.
This was a stark contrast to Looker Studio, which doesn’t even come with customer support, and to other complex reporting setups that leave agencies on their own.
Beyond fast support, we actively listen to our customers to implement new features and improve existing ones.
This is exactly what Stef Oosterik, Quality Manager at Dtch. Digitals loves about us. He told us in this case study:
I’d say 80 to 90% of the necessary features we’ve requested have been implemented. Clients are satisfied with the reports and dashboards and they tell us this is the way forward for us.
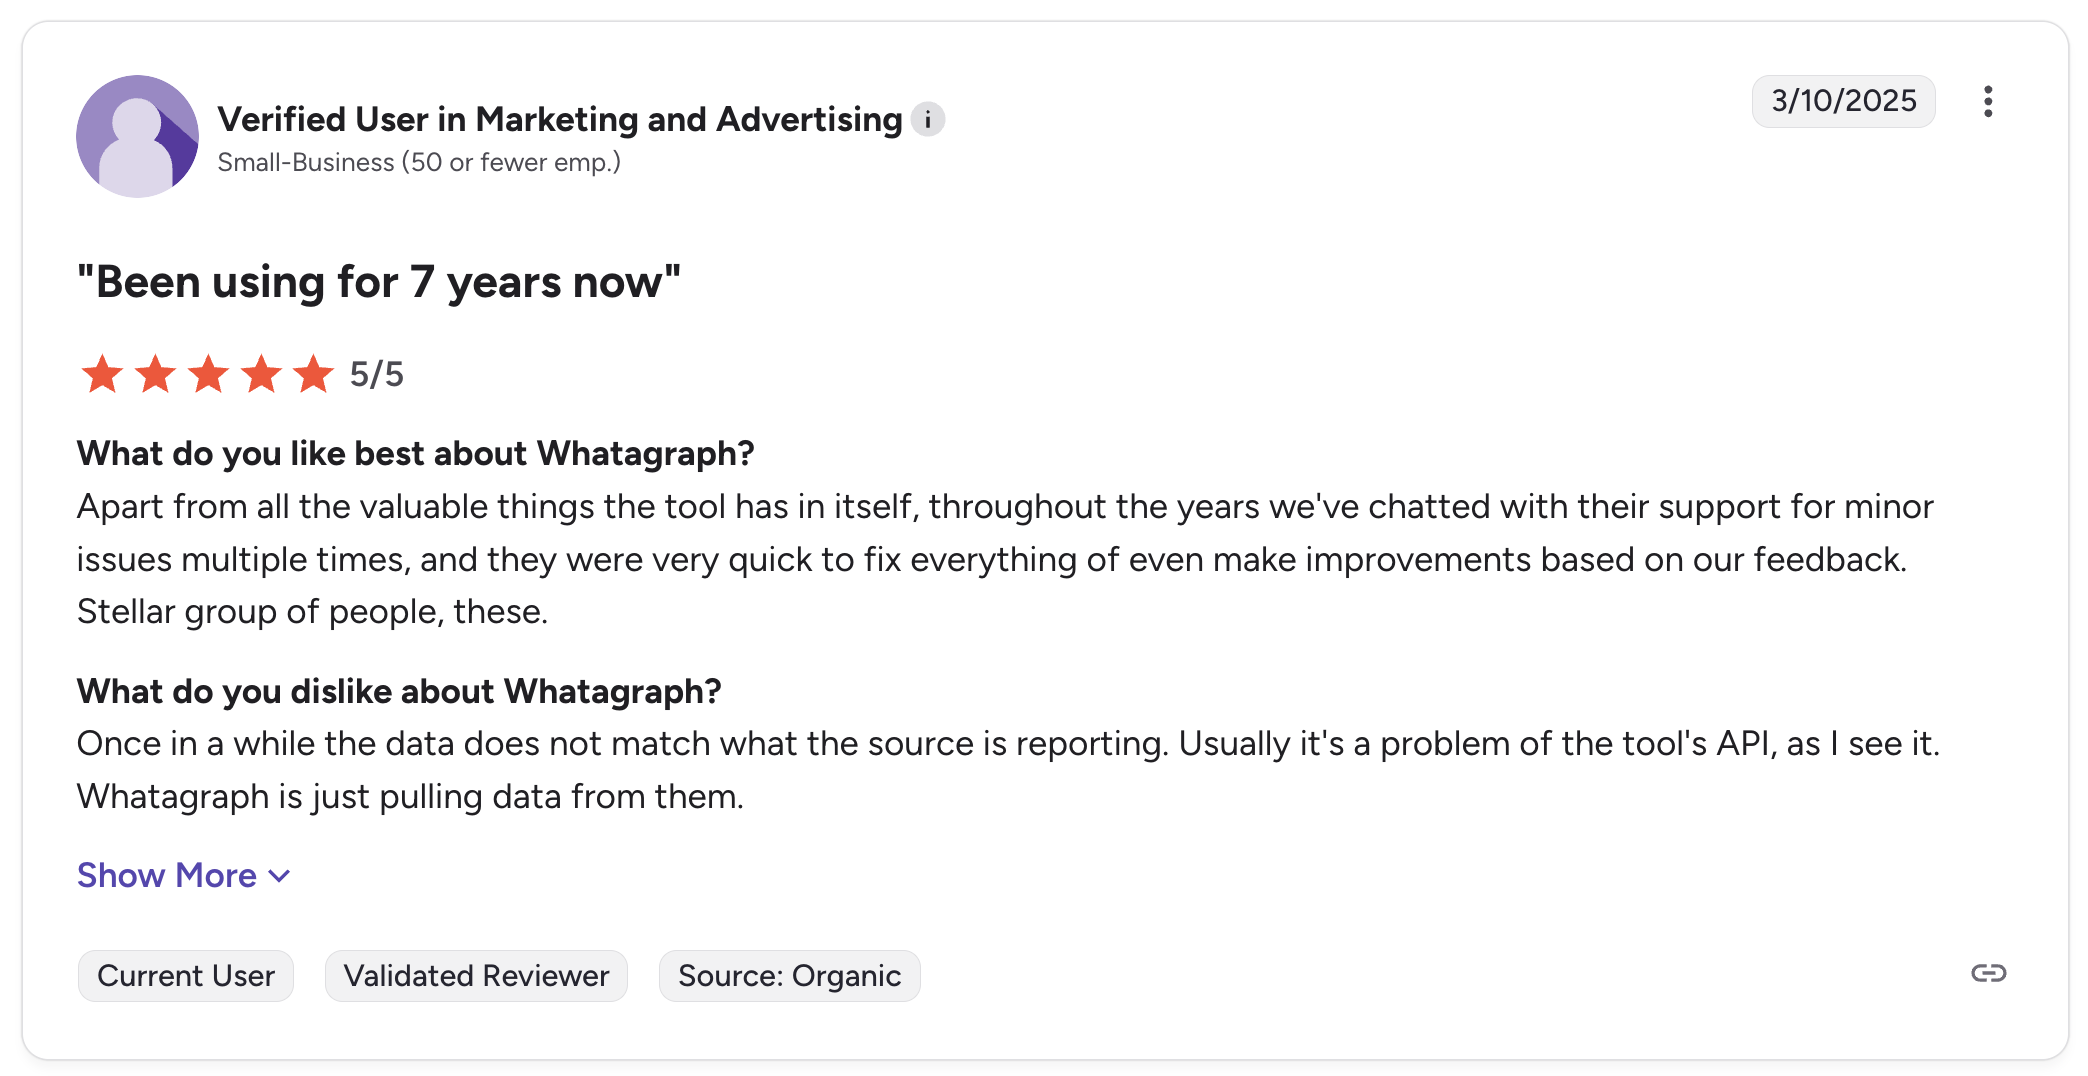
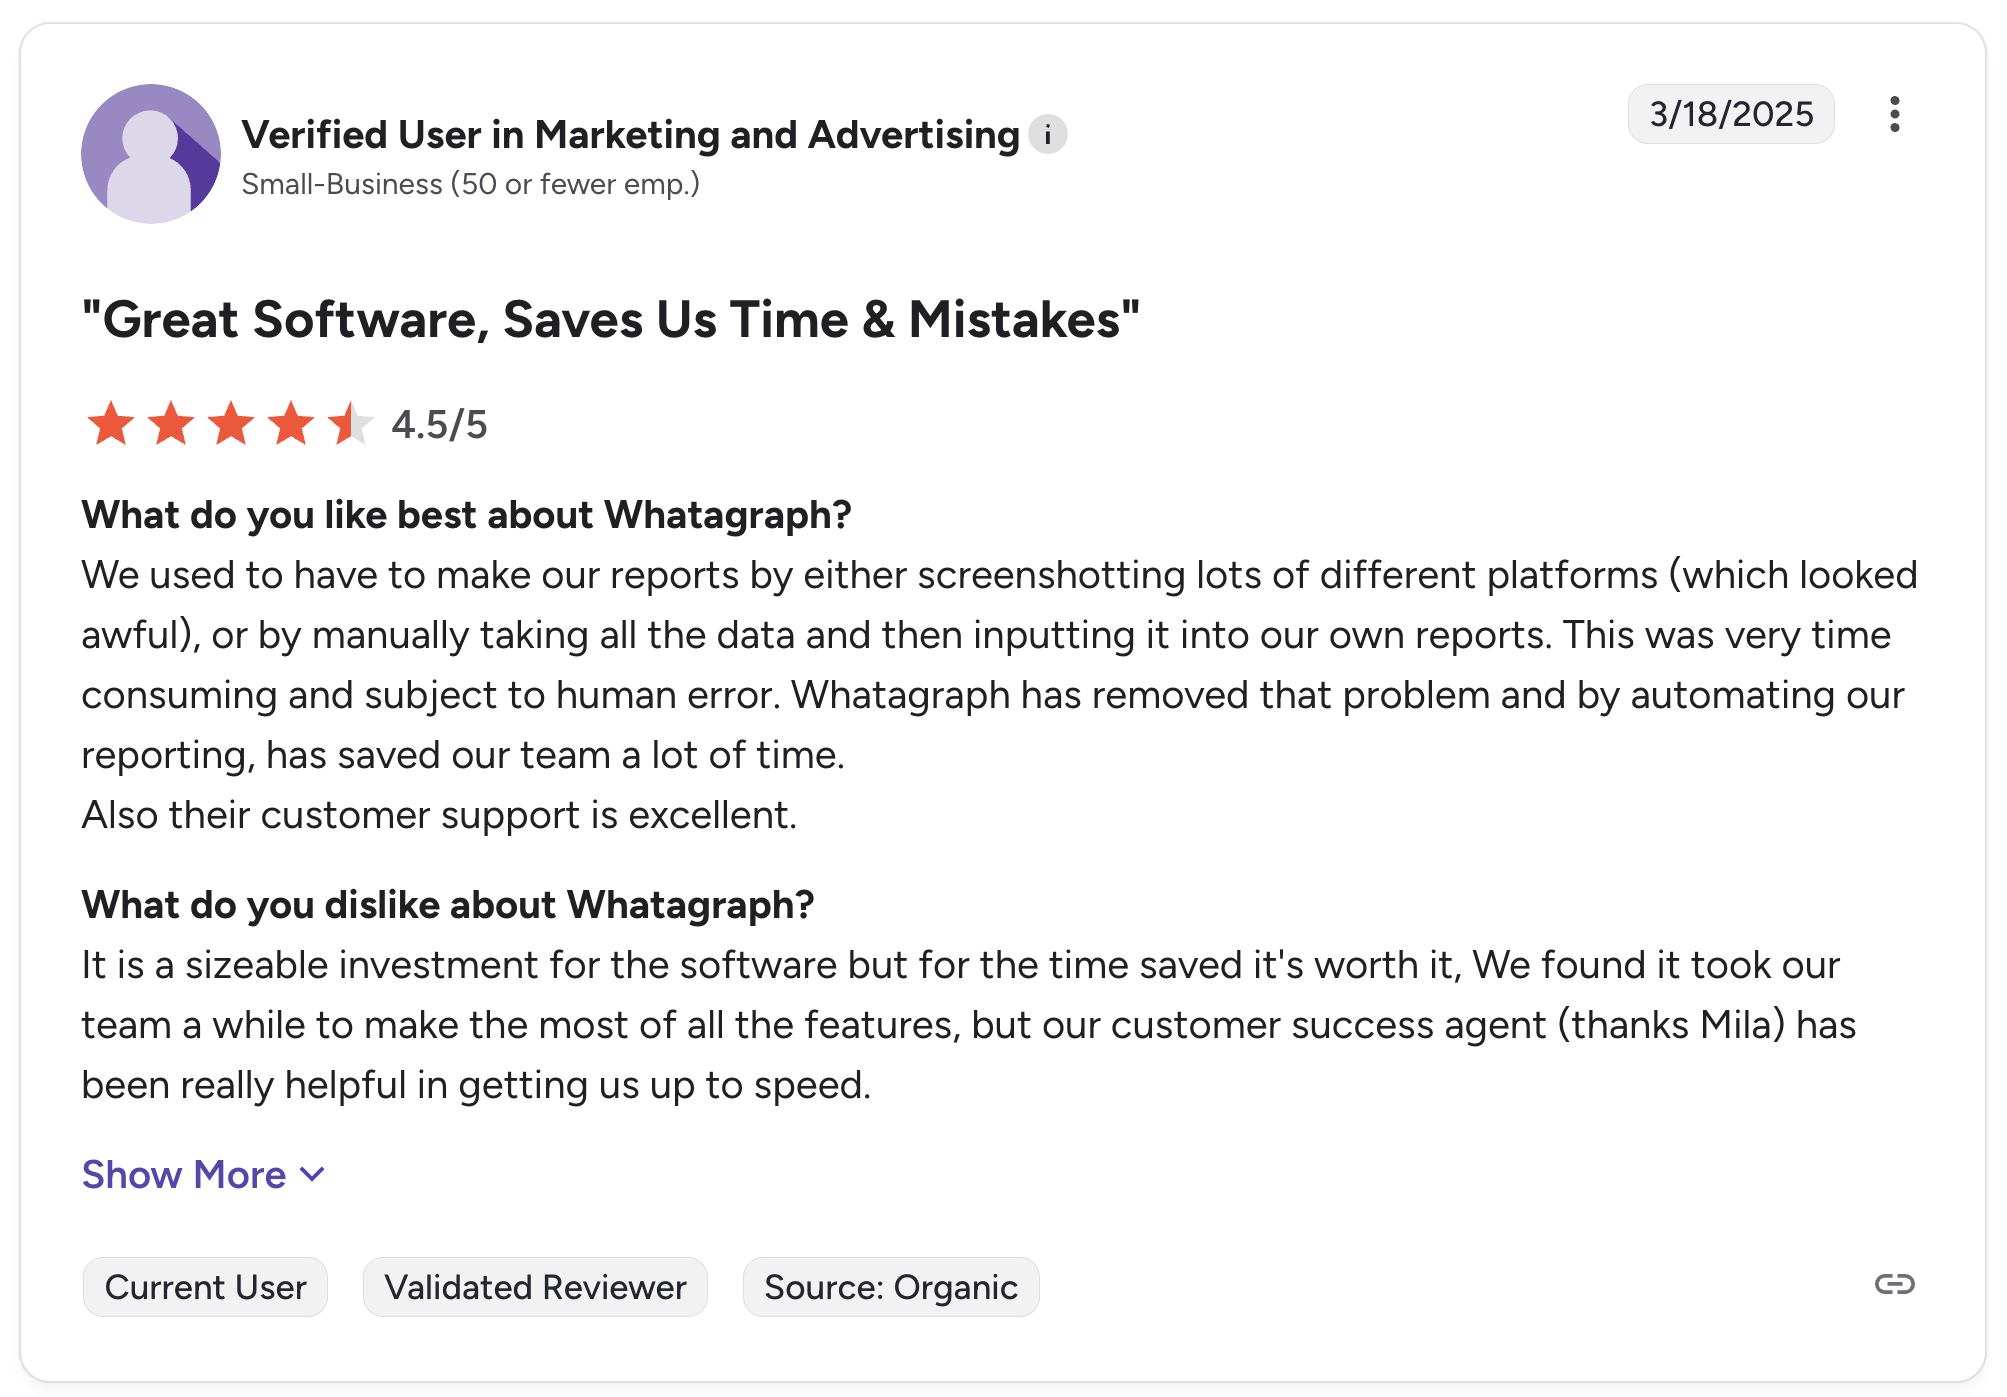
And if you think these case studies are biased (they’re not), you’d be happy to know that we constantly get high praises for our customer support in online reviews. Here’s one for example:
4. Straightforward pricing, no hidden fees
Improvado’s pricing often catches teams off guard. It’s not just that it’s expensive, especially for smaller businesses and startups—it’s also that the structure can feel unclear, with unexpected costs as you add connectors or need more advanced features.
One reviewer put it simply:
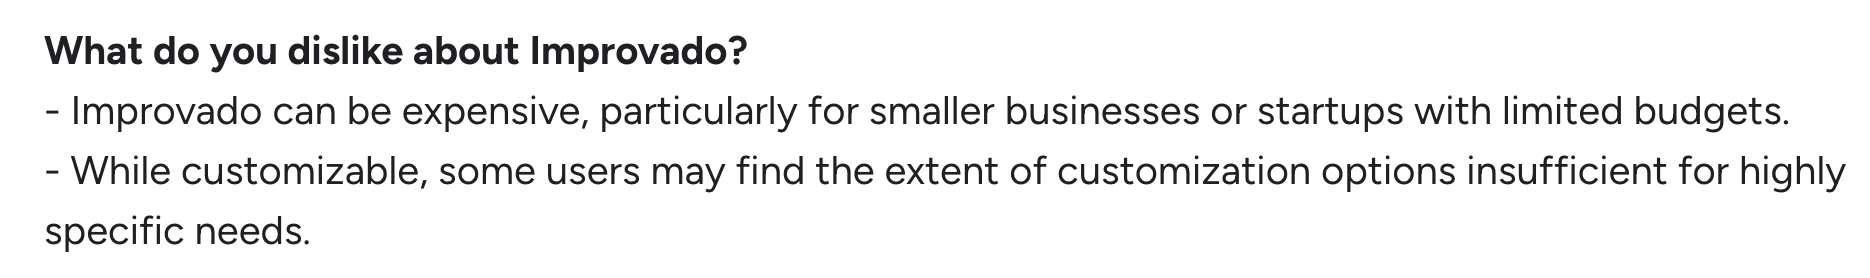
And even with the higher price point, the customization options sometimes don’t go far enough for agencies with specific reporting needs, making it hard to justify the investment.
Whatagraph's pricing scales with your needs. Check out our pricing page for the most up-to-date information.
At Whatagraph, we believe you should always know exactly what you’re paying for—and get full value for it. We’re not going to claim we’re “cheap.” But we guarantee you’ll never find yourself in a situation where you need to drop hundreds more to unlock “premium” features or pay extra just to get a proper onboarding session.
Plus, and it’s a HUGE plus, you won’t have to pay for any more tools like Looker Studio. You get everything—both data connectors and reports—in one place.
In fact, as one G2 reviewer put it, Whatagraph is a “sizable investment” but for the time saved, we’re “worth it".
Convinced Whatagraph is the best alternative to Improvado? Talk with our team today.
Key Features
- 55+ native integrations
- Custom integrations through Custom API, Google Sheets, or BigQuery
- AI report and widget generator
- Custom metrics, dimensions, and data blends—AI custom dimensions generator
- AI chatbot and performance summary writer
- Library of pre-made dashboard and report templates
- Goal pacing and alerts
- Custom branding and white-label features
- Automated report sharing via email, links to live dashboards, and exports to Excel, PDF, and CSV
- No-code data transfer to BigQuery and Looker Studio
Whatagraph Reviews from Real Users:
“The dashboards are clean, easy to build, and perfect for client reporting. It pulls in data from Google Ads, Meta, LinkedIn, and even TikTok without any hassle. I love how I can set up automated reports that look great and are client-ready. No more fiddling with spreadsheets or wasting time building slides.” (Source)
“Apart from all the valuable things the tool has in itself, throughout the years we've chatted with their support for minor issues multiple times, and they were very quick to fix everything of even make improvements based on our feedback. Stellar group of people, these.” (Source)
“Whatagraph is an extremely user-friendly reporting tool that helps us communicate the key aspects of our clients' digital marketing in practically real-time.” (Source)
Pros and Cons
Pros:
- All-in-one marketing intelligence platform with stable connectors
- 0 manual work required with Whatagraph IQ
- Extremely easy to use by anyone
- High customization for both your data and reports
- Fast campaign insights and summaries
Cons:
- 57 integrations might not be enough for you
- Only 2 data destinations (as of July 2025)
2. Funnel.io
Most suitable for: Marketers and agencies who want a data pipeline with built-in, ready-to-use dashboards for quick performance visualization
Before we move into more all-in-one marketing reporting tools, let’s look at data aggregators similar to Improvado—and Funnel.io is one of them.
Funnel.io is a marketing data integration and ETL platform that helps you collect, clean, and organize data from 500+ advertising, analytics, and CRM sources.
If your goal is to automate pulling data from everywhere into a single hub and send it to your BI tools like Looker Studio, Tableau, or Power BI, Funnel does this reliably and at scale.
Unlike Improvado, Funnel comes with native visualization dashboards—although they’re still a bit limited.
Funnel themselves say they “aren’t some kind of Tableau or Looker Studio killer” but that it does the job for marketers who need to visualize data quickly and prove their performance to stakeholders. But we dare say they’re not as branded or professional-looking enough to be appropriate for client reporting.
However, Funnel’s interface is intuitive for initial setup, and its “Data Explorer” tool makes it easy to run quick, ad hoc analysis on your cleaned data before pushing it to your dashboards.
If you already have a BI workflow and simply need a strong, flexible data pipeline (with a basic visualization dashboard), Funnel is a solid fit.
Key Features
- 500+ connectors for advertising, analytics, CRM, and eCommerce platforms
- Customizable data mapping and harmonization across channels
- Flexible file import for unsupported platforms
- Works seamlessly with Looker Studio, Tableau, Power BI, and Google Sheets
- Data Explorer for ad hoc exploration and quick checks
- ISO 27001, SOC 2 Type II, GDPR & CCPA compliance
- HTTPS encryption, multi-factor authentication, and SSO support
- Basic native dashboards for internal reporting
Funnel Reviews from Real Users
“The best thing I've found while using it is you can almost do EVERYTHING you would like to, and it is quite easy to figure out. And if you can't do something, the amazing staff will help you so quickly and if it's possible they know it.” (Source)
“Funnel is only as good as the other services you have in your data stack. You will want to layer in a good data warehouse and visualization tool to transform the data being collected into something actionable.” (Source)
“Although the tool is powerful and useful, the incremental price increase makes it a bit harder to sell to our executives, and we need to continuously pause data sources if we no longer use them to save previous flexpoints.” (Source)
Pros and Cons
Pros:
- Extensive connector library for broad data coverage
- Automates manual data pulls, saving time across accounts
- Clean, analysis-ready data for downstream reporting
- Plays well with existing BI stacks, allowing teams to keep preferred workflows
- Customizable dimensions and metrics to align naming across channels
Cons:
- No built-in advanced dashboarding or client-ready reporting
- Usage-based “flexpoint” pricing can add up quickly
- Advanced transformation and cleanup may require technical expertise
- Native dashboards are basic and not designed for client delivery
Funnel.io Pricing
Funnel.io uses a flexpoint-based pricing model. Flexpoints are credits consumed based on the number of data connectors, destinations, and data volume you use.
Pricing varies significantly based on usage and requirements:
| Plan | Connectors | Destinations | Flexpoints (Monthly) | Typical Price Range | Notes |
| Free | 4 | 1 | 400 (free) | $0 | Limited features and connectors |
| Starter | 121 | 3 | 500 | ~$1.2/flexpoint/month | For small teams, limited connectors |
| Business | 579+ | Multiple | 500+ | $399–$1,100+/month | More integrations, custom connectors |
| Enterprise | 590+ | Custom | Custom | $1,500–$2,500+/month | Advanced features, custom pricing |
Please note though that these prices are just estimates, since Funnel itself doesn’t share their pricing publicly.
You can get a more detailed pricing breakdown in this Funnel.io review guide we recently wrote.
3. Supermetrics
Most suitable for: Agencies and data-driven teams that want to automate marketing data pulls and feed it into their existing dashboards and spreadsheets
Supermetrics is a data pipeline tool designed to pull marketing data from 130+ platforms and send it directly into Google Sheets, Looker Studio, Excel, or a data warehouse for reporting and analysis.
It’s especially popular among small agencies and SMBs because it’s easy to set up for basic data aggregation tasks.
While you still need to use a separate visualization tool (like Improvado), Supermetrics is easier to use and more “plug-and-play”. You can easily set up scheduled refreshes, automate recurring reports, and customize which metrics and dimensions you want to pull for each client or campaign.
It’s also cheaper—especially if you only need one source platform (e.g. Google Analytics) and one destination like Looker Studio. You also won’t be locked into heavy enterprise-level contracts just to get started.
However, do be warned that prices can balloon to hundreds of dollars a month if you need more source platforms and destinations.
Get a full breakdown in this Supermetrics review guide.
Key Features
- 130+ Supermetrics connectors across marketing, advertising, analytics, and eCommerce platforms
- Direct data pipelines into Google Sheets, Looker Studio, Excel, BigQuery, and Snowflake
- Customizable data pulls with granular metric and dimension selection
- Scheduled refreshes and automated recurring reports
- Supports custom metrics and dimensions
- Data warehousing and storage options for historical data
- Team and user management with permissions
- GDPR and CCPA compliant, HTTPS encryption
Supermetrics Reviews from Real Users
“Supermetrics have a ton of connectors to platforms like Facebook, TikTok, Google and more. They make it super simple to load data to Google Sheets and BigQuery.” (Source)
“The costs for additional output tools is crazy high.” (Source)
“Adobe Analytics connector could be a bit easier to deal with. The server Outh does not work as expected when set up so I had to use the 2-week token (which is a pain to keep reauthorizing). Occasionally data sync issues with the Hubspot connector.” (Source)
Pros and Cons
Pros:
- Easy to set up for automated data pulls
- Broad connector library across major marketing platforms
- Works seamlessly with Google Sheets, Looker Studio, and Excel
- Lets you build highly custom reports with granular data control
- Flexible, modular pricing (despite cost complaints)
- Saves marketing agencies and SMBs significant manual reporting time
Cons:
- Pricing can add up as you add connectors and data destinations
- Occasional reliability issues with connectors and data pulls
- Requires external visualization tools for dashboards
- Advanced configurations can get complex
- Mixed reviews on support responsiveness
Supermetrics Pricing
Supermetrics pricing is modular and varies based on the destination (e.g., Google Sheets, Looker Studio, BigQuery) and the number of data sources you need.
While exact pricing depends on your configuration, as of 2025, plans typically start around $69–$199 per month per data destination, with additional costs for extra connectors, higher data volumes, and advanced features like data warehousing.
The good thing is Supermetrics offers a 14-day free trial so you can test it out before committing.
4. Fivetran
Most suitable for: Data teams and companies with a data warehouse who want automated, reliable pipelines for all their data—not just marketing.
Fivetran is an ELT/ETL data platform built to move data from hundreds of sources into your data warehouse without constant maintenance.
It’s known for its “set-and-forget” automation, handling schema changes and syncing data in the background so your team can focus on analysis, not pipeline firefighting.
If you already have Snowflake, BigQuery, or Redshift in your stack, Fivetran slots right in as the ingestion engine, pulling data from SaaS, databases, and cloud storage, and delivering it in a clean, analysis-ready state.
Compared to Improvado, which focuses on marketing data and requires more manual management (and often developer help) for advanced ETL, Fivetran is a reliable, scalable option for organizations looking to centralize all business data.
It shines in automation, connector breadth (with 700+ integrations), and minimizing engineering overhead.
However, it’s worth noting Fivetran doesn’t offer built-in dashboards or reporting—you’ll need a BI tool like Looker or Tableau for visualization.
If you want a tool that quietly moves data from point A to point B, scales as your business grows, and reduces the need for custom pipeline builds, Fivetran is worth a look.
Key Features
- 700+ connectors across SaaS, databases, cloud storage, and more
- Fully automated schema management and pipeline monitoring
- Flexible sync frequencies (default 6h, as fast as 1m on Enterprise plans)
- SOC 1 & 2, ISO 27001, PCI DSS, HIPAA, GDPR, and CCPA compliant
- Integration with dbt and other transformation tools
- REST API and SDKs for building custom connectors
- Reliable “set-and-forget” syncing with alerts for failures
Fivetran Reviews from Real Users
“Fivetran excels at doing one thing incredibly well: reliably syncing data from multiple SaaS tools into a central data warehouse like BigQuery. The setup is remarkably fast—most connectors are essentially plug-and-play, with minimal configuration.” (Source)
“The pricing model can become expensive at scale, especially when dealing with large volumes of data or many connectors.” (Source)
“Fivetran consulting takes care of the integration and maintenance which removes the hassle of onsite maintenance. They have a good customer support team that can answer questions in a timely manner.” (Source)
Pros and Cons
Pros:
- Extremely broad connector library for diverse business data
- Plug-and-play setup with intuitive UI for initial configuration
- Automated schema drift management reduces manual work
- Scales easily with your data needs
- Excellent documentation and onboarding support
Cons:
- No built-in dashboards—requires a BI tool for reporting
- Advanced transformations require dbt or SQL (technical know-how needed)
- Usage-based pricing can get expensive at scale
- Occasional sync delays and connector-specific hiccups
- Support can be slow on lower-tier plans
Fivetran Pricing
Fivetran uses a usage-based pricing model based on Monthly Active Rows (MAR)—charging for the unique rows synced each month.
In 2025, they shifted to per-connector pricing, which can increase costs if you use many similar-sized connectors.
- Starter pricing: Plans often start around $12,000/year minimum with annual contracts.
- Pricing scales with volume, number of connectors, and sync frequency.
- Faster syncs (as quick as 1-minute intervals) and advanced support require Enterprise plans.
- Good news: if you’re a Y Combinator startup, you can get $50K in free usage credits.
The short version: Fivetran’s pricing can add up quickly, so you’ll want to calculate your needs carefully before scaling.
Get a full breakdown of the pricing in this Fivetran review guide.
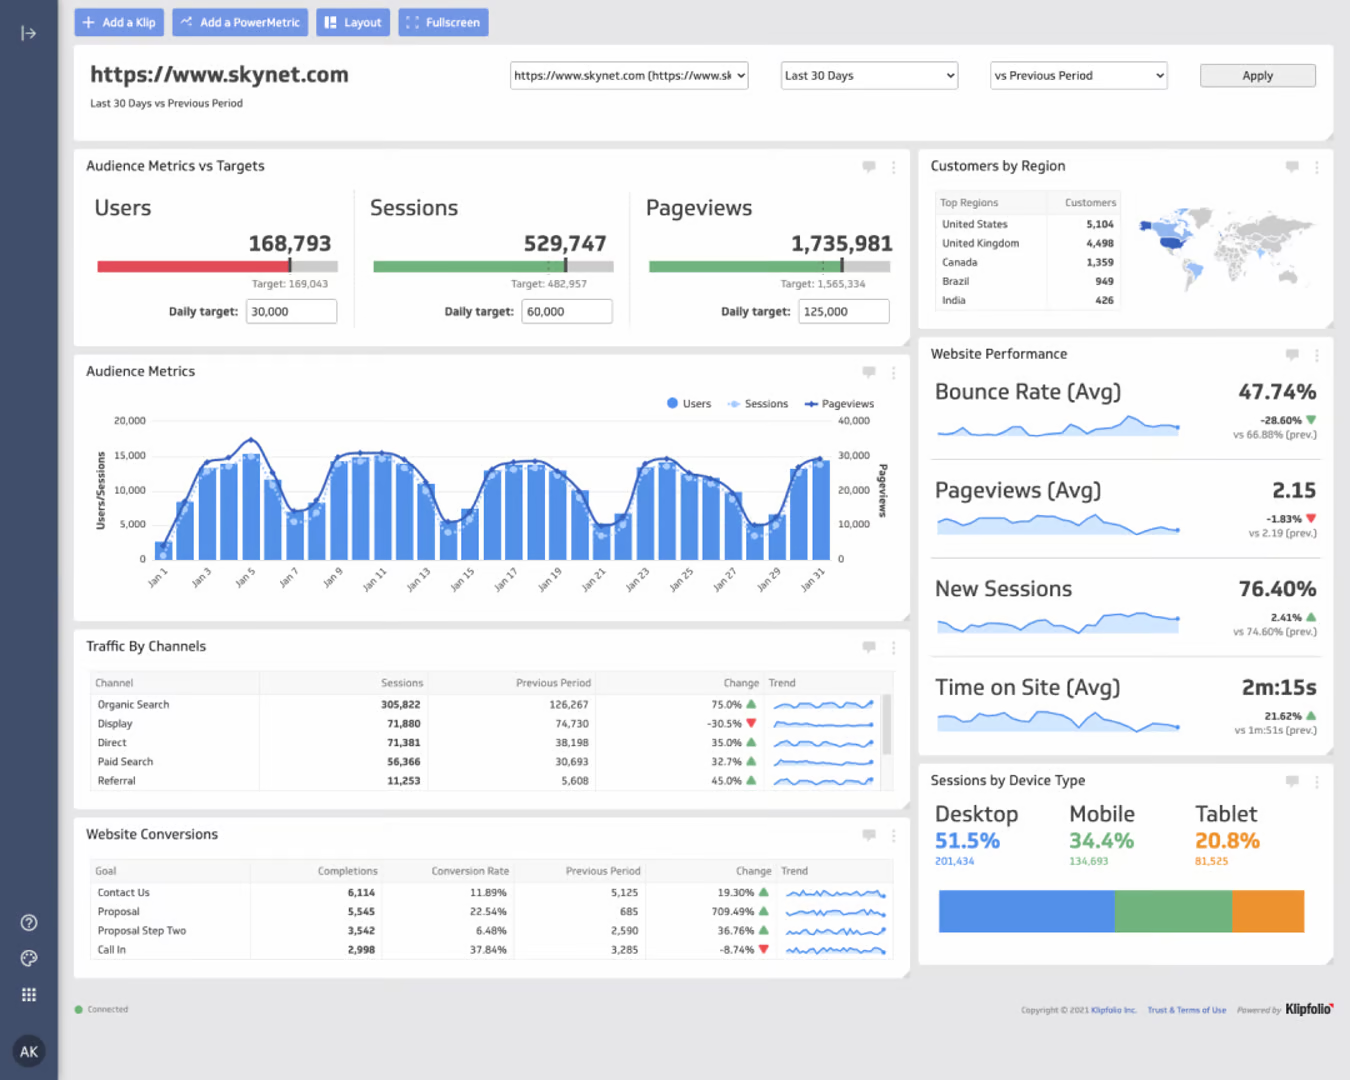
5. Klipfolio
Most suitable for: Mid-sized businesses and agencies that need flexible dashboards without paying enterprise prices
 We’ve covered different types of data aggregators that are competitors to Improvado, but now let’s look at some more all-in-one reporting and data analytics tools—starting with Klipfolio.
Klipfolio is a cloud-based business intelligence platform designed for building custom dashboards and tracking KPIs in real-time. It supports 140+ integrations (we counted them one by one), letting you pull data from a wide range of sources.
Where Klipfolio shines is flexibility—you can customize your dashboards with detailed “Klips” (widgets) and build advanced metrics. But be prepared: Klipfolio is technical, and you’ll need to know your way around SQL or even hire a developer to get the most out of it.
However, unlike Improvado, which focuses heavily on marketing data aggregation and requires you to use Looker Studio (plus a developer) for visualization, Klipfolio lets you build and share dashboards directly in-platform.
 If you’re tired of managing Improvado + Looker and just want a single tool to handle dashboarding with a high level of customization, Klipfolio can be a solid pick.
But…it still comes with its own challenges: the setup is time-consuming, dashboards can be slow with large datasets, and advanced reporting requires technical expertise.
It’s a good fit if you’re comfortable investing time to build complex dashboards and don’t need to automate large-scale client reporting.
Key Features
- 140+ integrations with SaaS, cloud, and database sources
- Customizable dashboards using “Klips” (widgets)
- Drag-and-drop dashboard editor (after Klips are created)
- Data blending and custom metrics (manual setup required)
- Pre-built templates (17 available) for faster setup
- Report sharing via email, links, PDFs, and public dashboards
- Scheduled email snapshots for automated reporting
- TLS 1.2 encryption and GDPR compliance
- Role-based access controls and SSO (on higher plans)
Klipfolio Reviews from Real Users
“It's very intuitive and the UI is clean. The integrations capabilities are nice.” (Source)
“Their customer service is terrible. I felt very scammed because in the beginning they were telling me a different price than what I was being shown in their own portal.” (Source)
“Works really well with a small set of data but it hangs several times when we did analysis on a larger set of data.” (Source)
Pros and Cons
Pros:
- Highly customizable dashboards with granular control
- Supports many data sources
- Flexible sharing options for marketing teams and clients
- Drag-and-drop dashboard editor
- Lets you track KPIs across departments
Cons:
- Steep learning curve, requiring technical skills
- Time-consuming setup, especially when building multiple dashboards
- Can be slow with complex data sets
- Limited pre-built templates and no batch editing
- Lacks AI features for automated insights
- Email-only support unless on high-tier plans
Klipfolio Pricing
Klipfolio offers two types of pricing plans—one for businesses and one for agencies.
Here’s how the pricing looks like for businesses (all monthly billing):
- Base: $140/month (3 dashboards, 4 hour data refresh rate, unlimited users)
- Grow: $220/month (10 dashboards, 1 hour data refresh rate, scheduled reports, published links)
- Team: $350/month (20 dashboards, 15 min data refresh rate, SSO)
- Team+: $690/month (40 dashboards, up-to-the-minute data refresh rate, custom onboarding, priority support)
And here’s how it looks like for agencies (all monthly billing):
- Starter: $180/month (5 dashboards, 5 clients, 4 hour data refresh rate)
- Lite: $270/month (15 dashboards, 15 clients, 1 hour data refresh rate, published links, scheduled reports)
- Pro: $420/month (30 dashboards, 30 clients, 30 min data refresh rate, custom domain, priority support, SSO)
- Premier: $1025/month (80 dashboards, 80 clients, 30 min data refresh rate, custom onboarding, custom theme)
6. AgencyAnalytics
Most suitable for: Boutique marketing agencies that want an easy (but basic), all-in-one reporting tool.
AgencyAnalytics is a reporting platform built for marketing agencies that need to automate and professionalize client reporting.
It pulls data from 80+ marketing sources—including SEO, PPC, and social channels—and lets you build clear, branded dashboards your clients will actually understand.
If you’re looking for deep data transformation or advanced ETL, AgencyAnalytics isn’t the tool for that. It’s not trying to be Improvado.
Instead, it’s designed to help you quickly turn marketing data into polished, client-ready dashboards without messing around with complex setups or having to stitch together multiple tools.
Compared to Improvado, AgencyAnalytics is simpler, faster to deploy, and made for agencies focused on clear client communication.
It won’t give you advanced blending, custom dimensions, or deep data modeling, but it will save your team hours every week by automating routine reporting, giving you more time to focus on strategy and client relationships.
Key Features
- 80+ native marketing integrations (SEO, PPC, social, email)
- White-label client dashboards and PDF reports
- Automated scheduling for recurring reports
- Drag-and-drop report and dashboard builder
- Built-in SEO tools (rank tracking, site audits)
- Client portal with customizable permissions
- Email notifications and performance alerts
- MFA and granular user permissions
AgencyAnalytics Reviews from Real Users
“Agency Analytics is one of the best reporting dashboard tools I have used yet. The dashboard is easy to setup and very customizable”. (Source)
“While the platform covers a vast array of integrations, it does fall short in a few key areas. Notably, there is no direct integration for Squarespace, which limits reporting capabilities for clients on that platform. Additionally, data coverage from Shopify and Google Analytics 4 can feel incomplete—some metrics are either missing or not as robust as users might expect, which can hinder deeper analysis for eCommerce and web performance.” (Source)
“If there’s one area we think could be improved, it would be the visual presentation of certain data – for example, showcasing top-performing ads or social media posts in a more visual and engaging way inside the reports. We’d also love to have more flexibility in customizing graphs or visual elements to better reflect a client’s brand style.” (Source)
Pros and Cons
Pros:
- Extremely easy to use with minimal learning curve
- Speeds up client reporting workflows significantly
- Clear, professional, white-label reports for clients
- Built-in SEO tools for agencies focused on search
- Transparent, affordable pricing for small to mid-sized agencies
- Fast, responsive customer support
Cons:
- Limited advanced customization and data transformation
- Integrations can occasionally break, requiring manual checks
- Report layouts can feel rigid for agencies needing high flexibility
- No deep data blending or advanced analysis
- Pricing can scale up quickly as you add more clients
AgencyAnalytics Pricing
AgencyAnalytics’ pricing is tier-based and depends on the number of clients you manage:
- Freelancer: $59/month for 5 clients, $10 per additional client
- Agency: $179/month for 10 clients, $15 per additional client
- Agency Pro: $349/month for 15 clients, $20 per additional client
The good thing is they offer a 14-day free trial, so you can test it out before committing.
7. Tableau
Most suitable for: Teams and enterprises that want best-in-class, interactive dashboards and deep analytics across all business data (not just marketing)
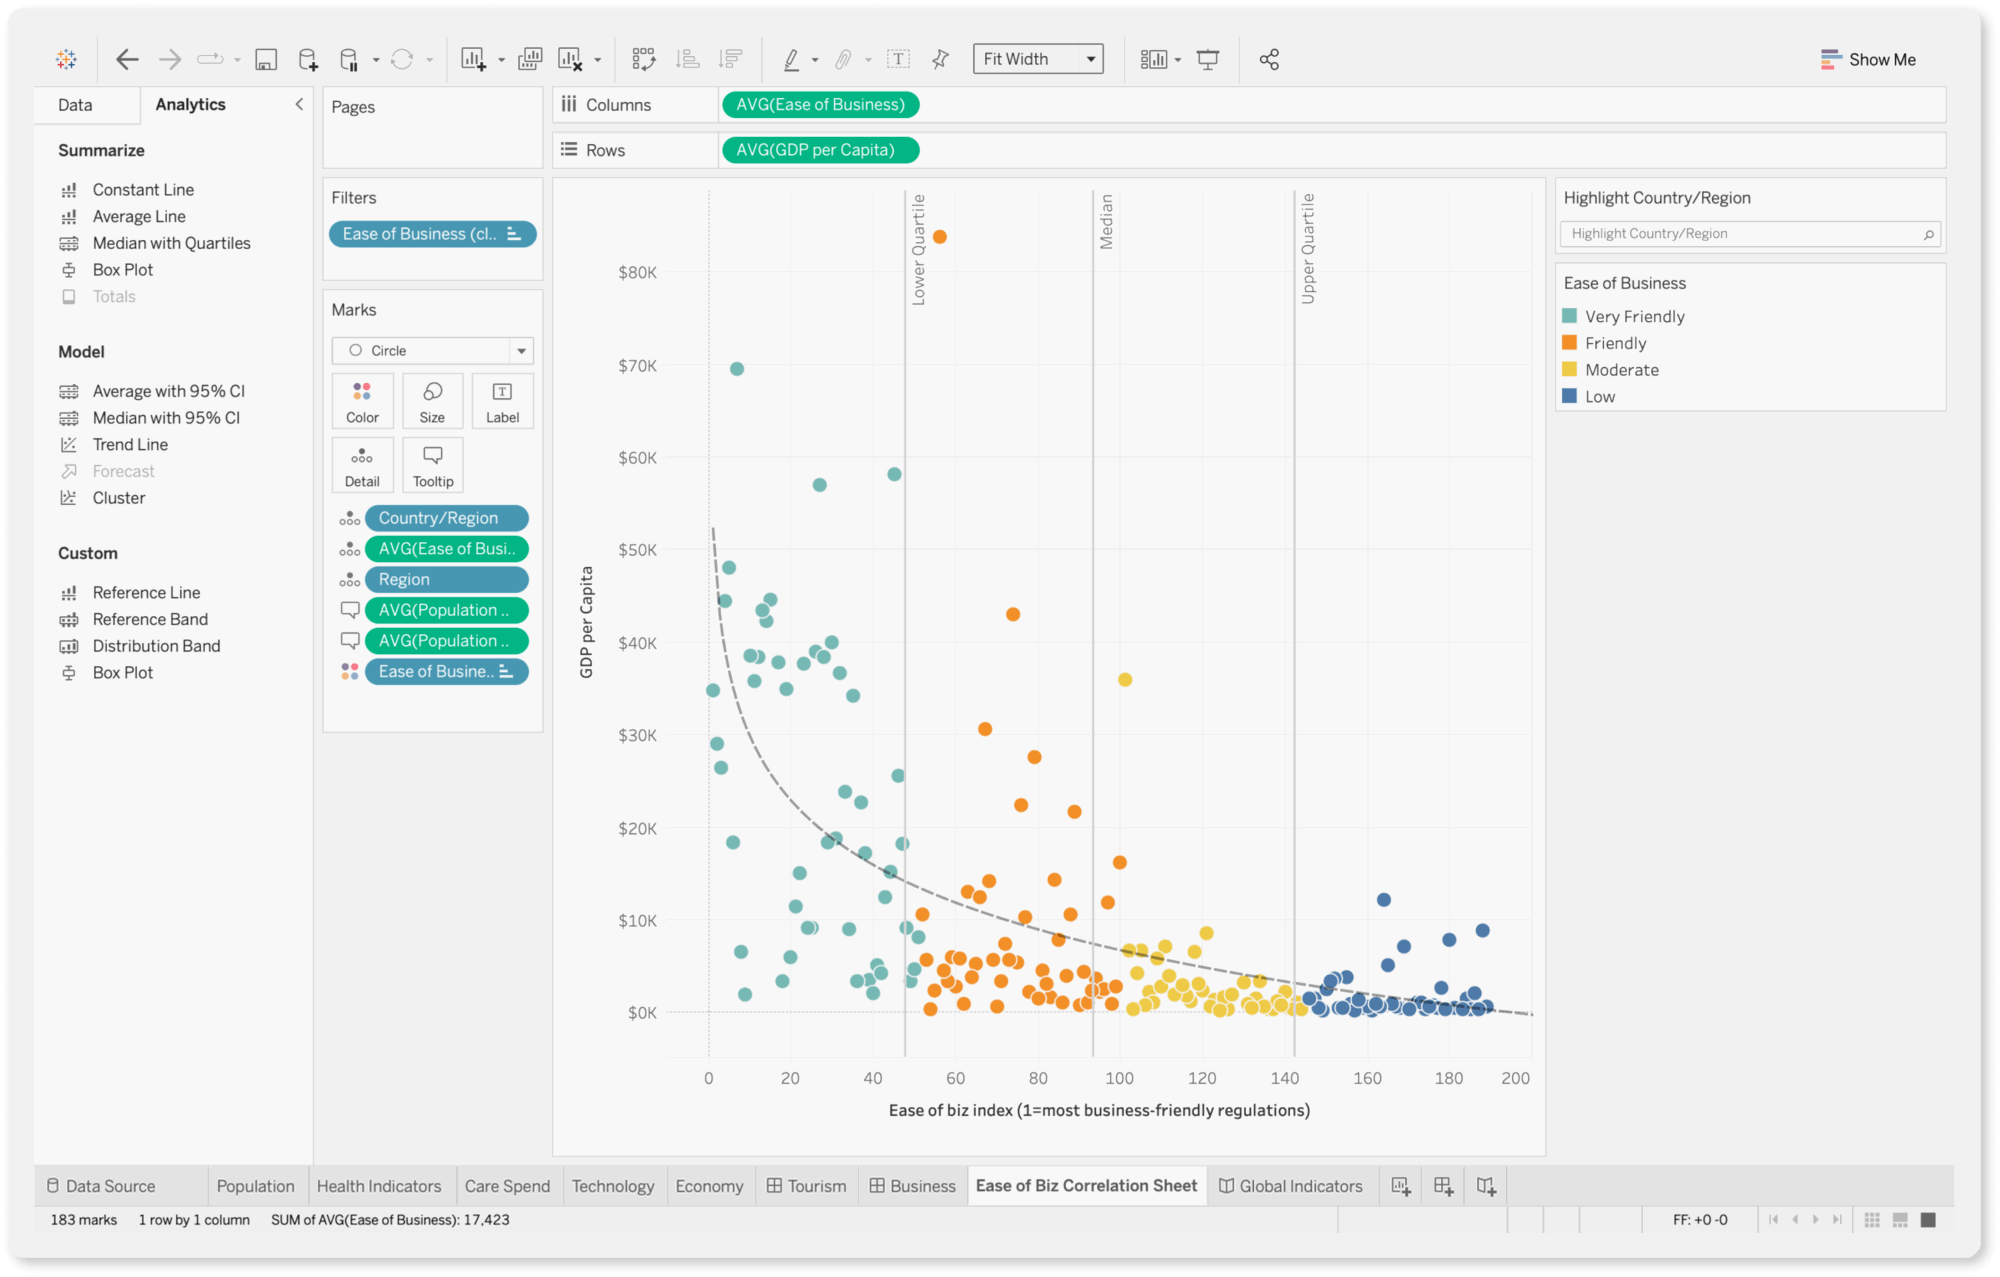
Tableau is one of the most recognized names in data visualization for a reason. It lets you build beautiful, interactive dashboards that make even the most complex datasets easy to understand, explore, and share.
Unlike Improvado, which focuses on marketing data collection and ETL, Tableau is all about analysis and visualization across any business data—finance, sales, HR, operations, and more.
It connects to a wide range of data sources, from spreadsheets and cloud platforms to large databases, letting you centralize and visualize diverse data in one place.
Teams love Tableau for enabling self-service analytics, reducing bottlenecks, and letting non-technical stakeholders explore data on their own.
That said, Tableau isn’t a plug-and-play reporting tool like Whatagraph or AgencyAnalytics. While building simple dashboards is straightforward, mastering Tableau’s advanced capabilities takes time, and you’ll still need to prep your data externally or use tools like dbt for complex transformations. And yes, it’s not cheap—especially if you need a lot of user licenses.
But if your organization wants powerful, interactive dashboards and a flexible analytics environment that can scale with your business, Tableau is worth a look.
Key Features
- Best-in-class interactive dashboards and charts
- Drag-and-drop dashboard builder for ease of use
- Connects to spreadsheets, databases, cloud platforms, and APIs
- Data blending, calculated fields, and basic in-platform prep
- Collaboration and sharing across teams and departments
- Mobile-optimized dashboards for reporting on the go
- Permissions and user management for governance
- Strong community, tutorials, and forums for learning
- Enterprise-grade scalability and performance
Tableau Reviews from Real Users
“Tableau makes it very very easy to turn the raw data into clear visuals. The dragdrop user interface saves you a lot of time and the multiple kinds of chart types helps present insights in the best way possible.” (Source)
“Ease of use to build comprehensive dashboards as per the requirements. Another major aspect is the ability to integrate with different data sources that makes the entire process quite seamless for us.” (Source)
“Tableau can be overwhelming for beginners — building advanced dashboards requires time and practice. Performance sometimes slows down with large datasets or complex calculations. The licensing cost can be high for small teams or individual users, and version compatibility between Tableau Desktop and Server sometimes causes minor headaches.” (Source)
Pros and Cons
Pros:
- Market-leading visualizations and dashboard flexibility
- Works with virtually any data source
- Supports deep exploration and self-service analytics
- Active community and extensive learning resources
- Proven scalability for large organizations
Cons:
- Can get expensive, especially with many user licenses
- Advanced features require time and practice to master
- Dashboards can slow down with large or complex datasets
- Limited built-in ETL; external prep often required
- Mixed experiences with customer support responsiveness
Tableau Pricing
Tableau uses a tiered, per-user, per-month pricing model, billed annually:
- Enterprise Creator: $115/user/month
- Enterprise Explorer: $70/user/month
- Enterprise Viewer: $35/user/month
Pricing can scale quickly depending on your team size and feature needs, so it’s best suited for organizations ready to invest in enterprise-grade BI.
The good thing is you can try Tableau for free with a 14-day trial to see if it fits your workflow.
Recap: Which Improvado alternative is right for you?
Here’s a quick breakdown to help you choose the best tool for your needs:
✅ If you want an all-in-one platform with zero learning curve and powerful AI features—choose Whatagraph.
✅ If you want an enterprise-grade tool for all your business data, not just marketing data—choose Tableau.
✅ If you want a lightweight tool for basic reporting needs—choose AgencyAnalytics.
✅ If you need a flexible data pipeline to feed your existing dashboards—choose Supermetrics or Funnel.io.
✅ If you want a “set-and-forget” ELT pipeline for all your data, ready for your BI tools—choose Fivetran.
No matter your agency’s size or goals, there’s an Improvado alternative that can help you optimize your reporting workflows, save time, and deliver better insights to clients or stakeholders.
Published on Jul 10 2025
WRITTEN BY
YamonYamon is a Senior Content Marketing Manager at Whatagraph. With an eye for detail and a knack for always considering context, audience, and business goals to guide the narrative, she's on a mission to create genuinely helpful content for marketers. When she’s not working, she’s hiking, meditating, or practicing yoga.