5 Free Website Analytics Report Templates + Expert Insights
If you’re searching for a website analytics report template, you’re probably trying to answer a simple question: Is our website delivering results?
But getting the answer to that simple question takes hours, and a lot of your brainpower.
You're left scouring GA4's complex dashboards, copying and pasting data into spreadsheets, or stitching together different screenshots - just to understand what's going on with your website.

Jan 07 2026●7 min read


That’s exactly why we put this guide together.
We’ll share 5 ready-to-use website analytics report templates, plus practical advice from 7 digital marketers on which metrics matter, how to structure your reports, and how real digital marketers turn raw website data into a clear performance narrative:
- Carradean Farley, Co-Founder @ Periscope Media
- Ameet Khabra, CEO @ Hop Skip Media
- Sebastian Ellis, CEO @ Ellis Digital
- Ben Duffy, Client Development Manager @ Quirky Digital
- Joshua Wood, CEO @ CJ Digital
- Ryan Andreson, President @ Markiserv
- Peter Lewis, SEO Executive @ PIXUS
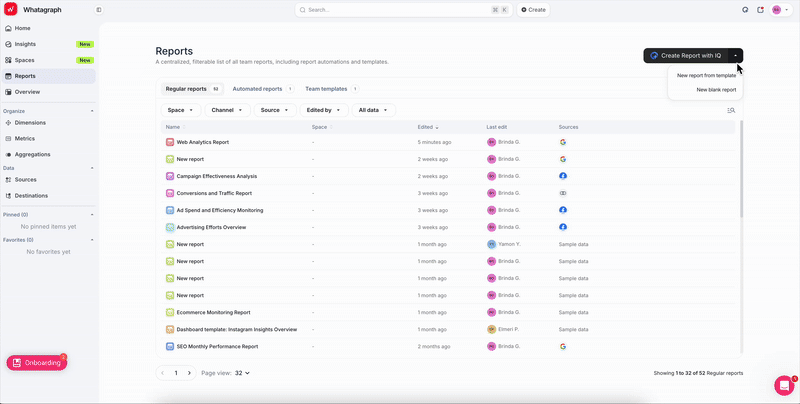
5 Web Analytics Report Templates & Examples
If you're looking for quick fix to create a report in seconds, just get started with one of these free web analytics report templates below.
All you need to do is:
- Create an account on Whatagraph (for free)
- Use one of these templates below
- Connect your accounts
And that's it - you'll get a full-fleshed, white-labeled report in seconds, with all the metrics that matter.
1. SEO Report
Channels connected: Google Analytics 4, Google Search Console
The SEO report template is probably the most comprehensive web analytics report template on the list. This is what SEO specialists and marketers create when they want to look at the overall website's performance on search engines. This report shows:
- Impressions
- Clicks
- CTR
- Average rankings
- Page performance by specific URLs
- Top ranking keywords
- Backlinks profile
- Summary and recommendations
How to use this SEO report template
2. AI Report Template
Sources connected: Google Analytics 4
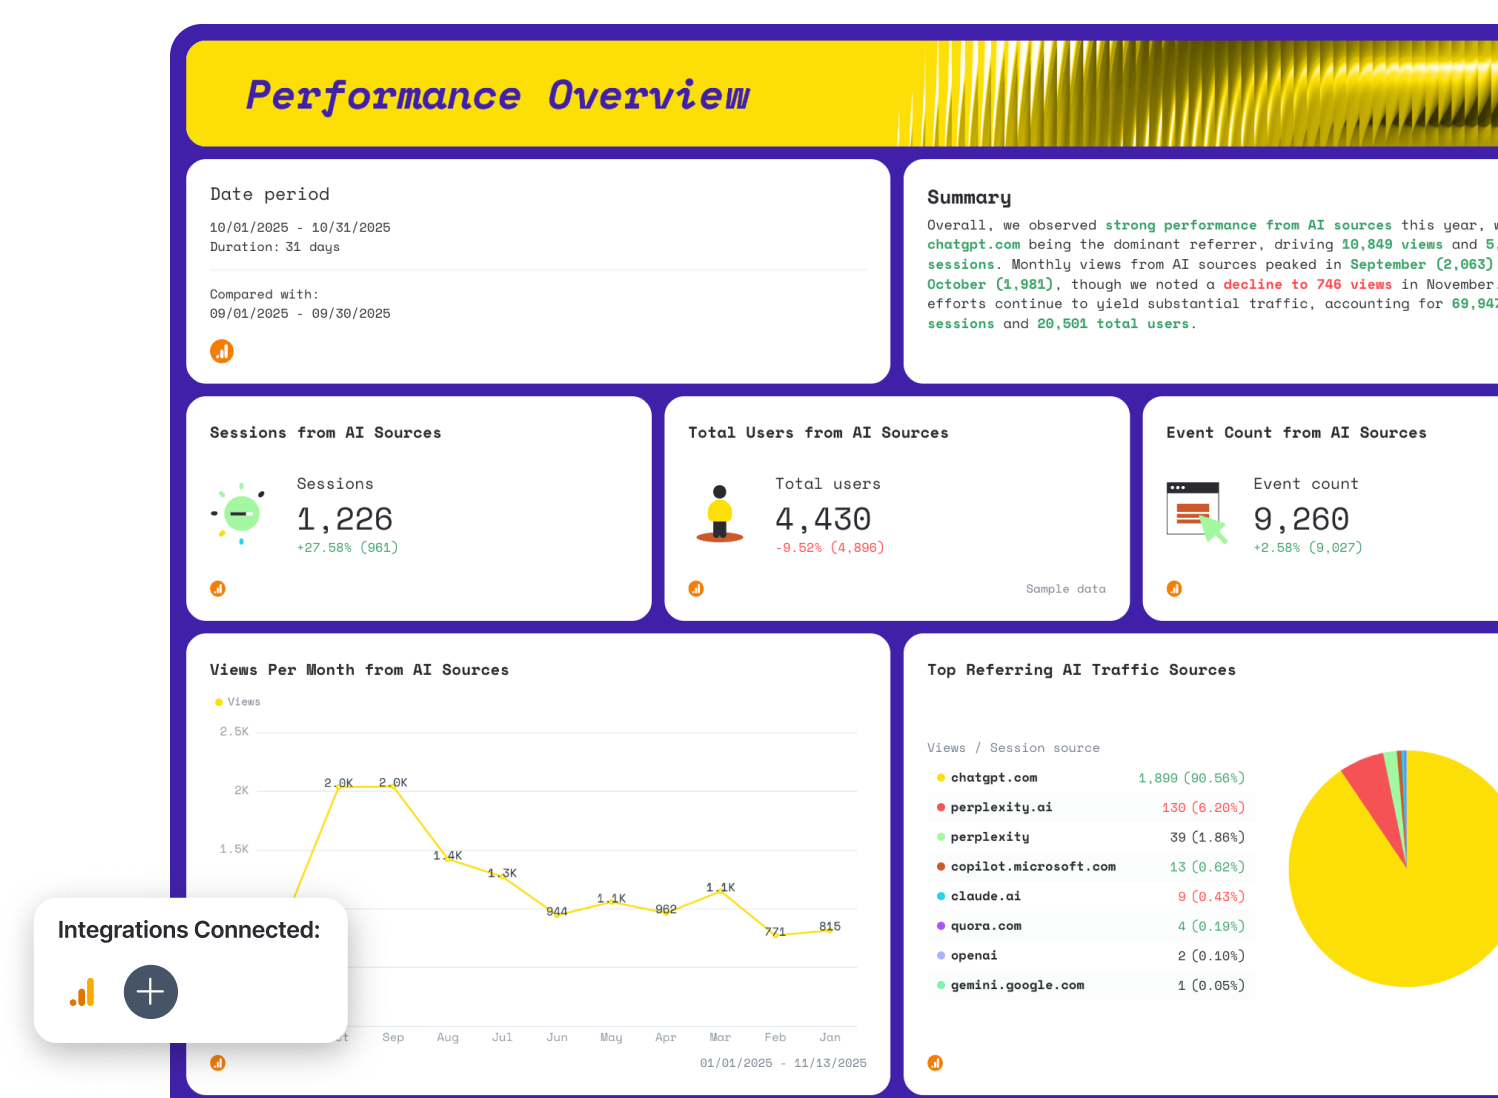
With this AI report template, you can track:
- Traffic per month from AI sources (e.g. ChatGPT, Perplexity)
- Top referring AI sources
- Session breakdown by AI source
How to use this AI report template
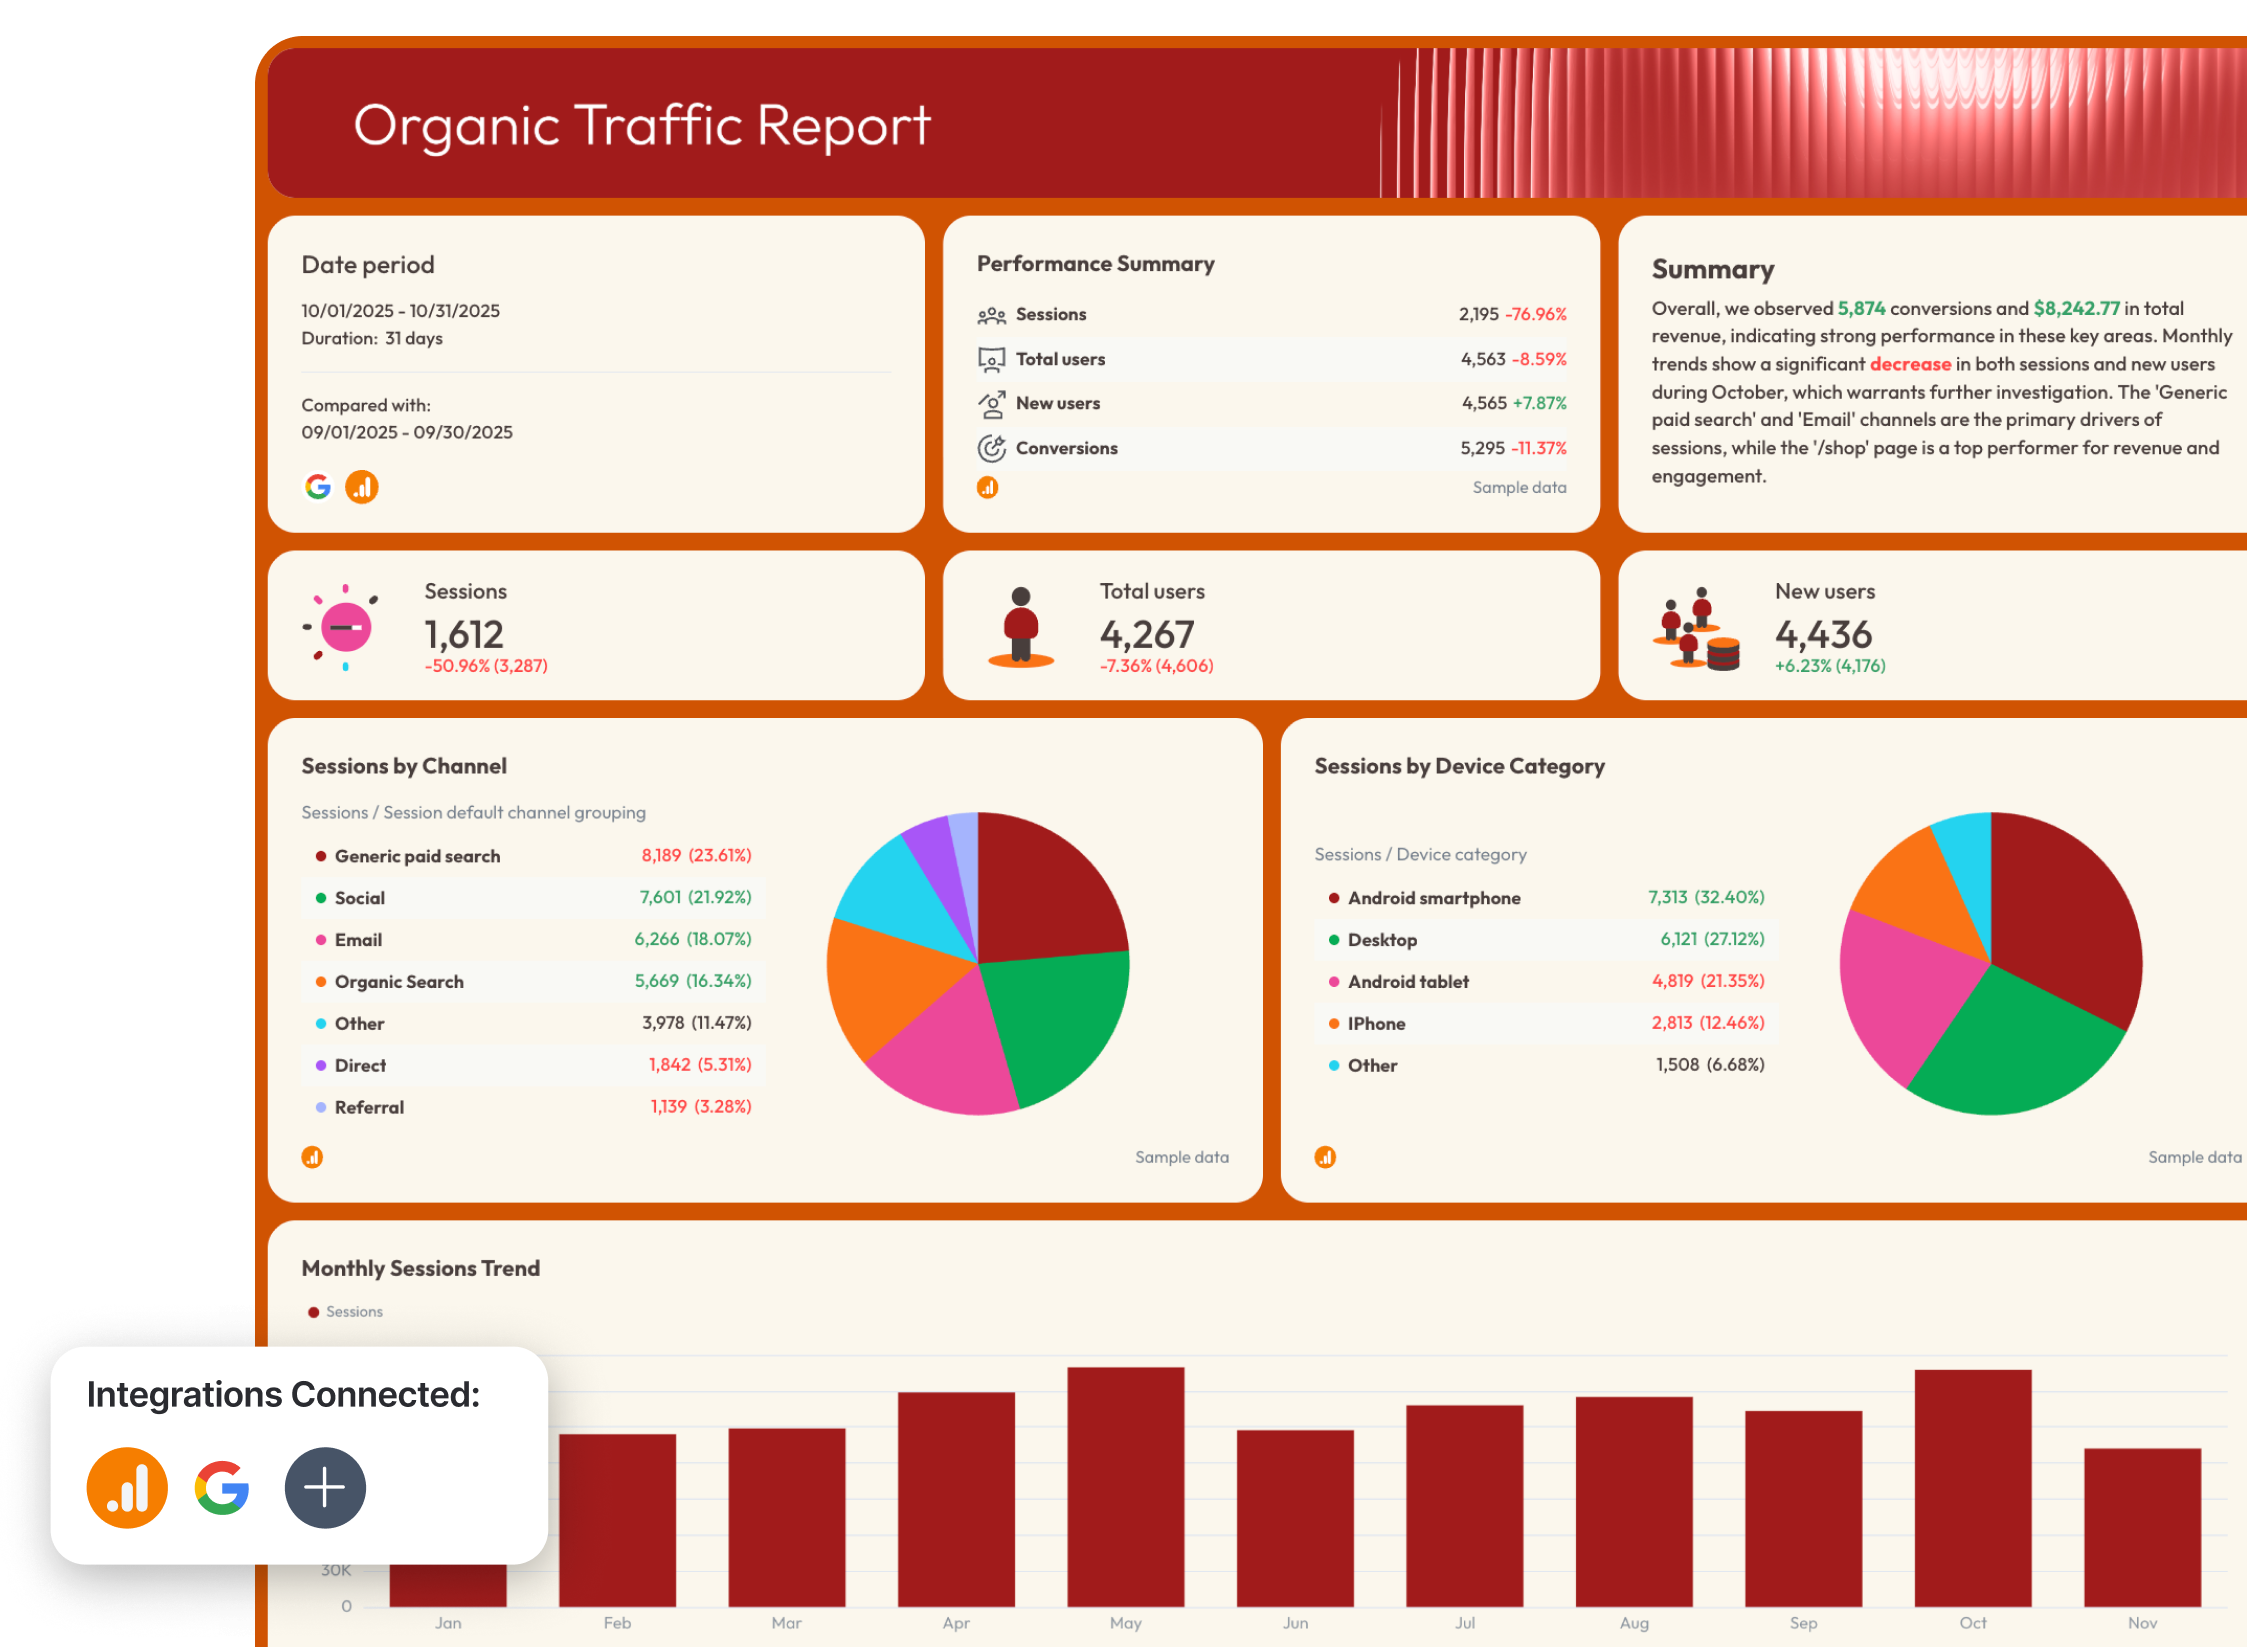
3. Google Analytics 4 Report
Channels connected: Google Analytics 4
 With this Google Analytics 4 template, you can track:
- Key metrics like sessions, users, engagement rate, conversions
- Conversions by campaigns, source, and country
- Site activity by specific days, campaign, or country
How to use this GA4 report template
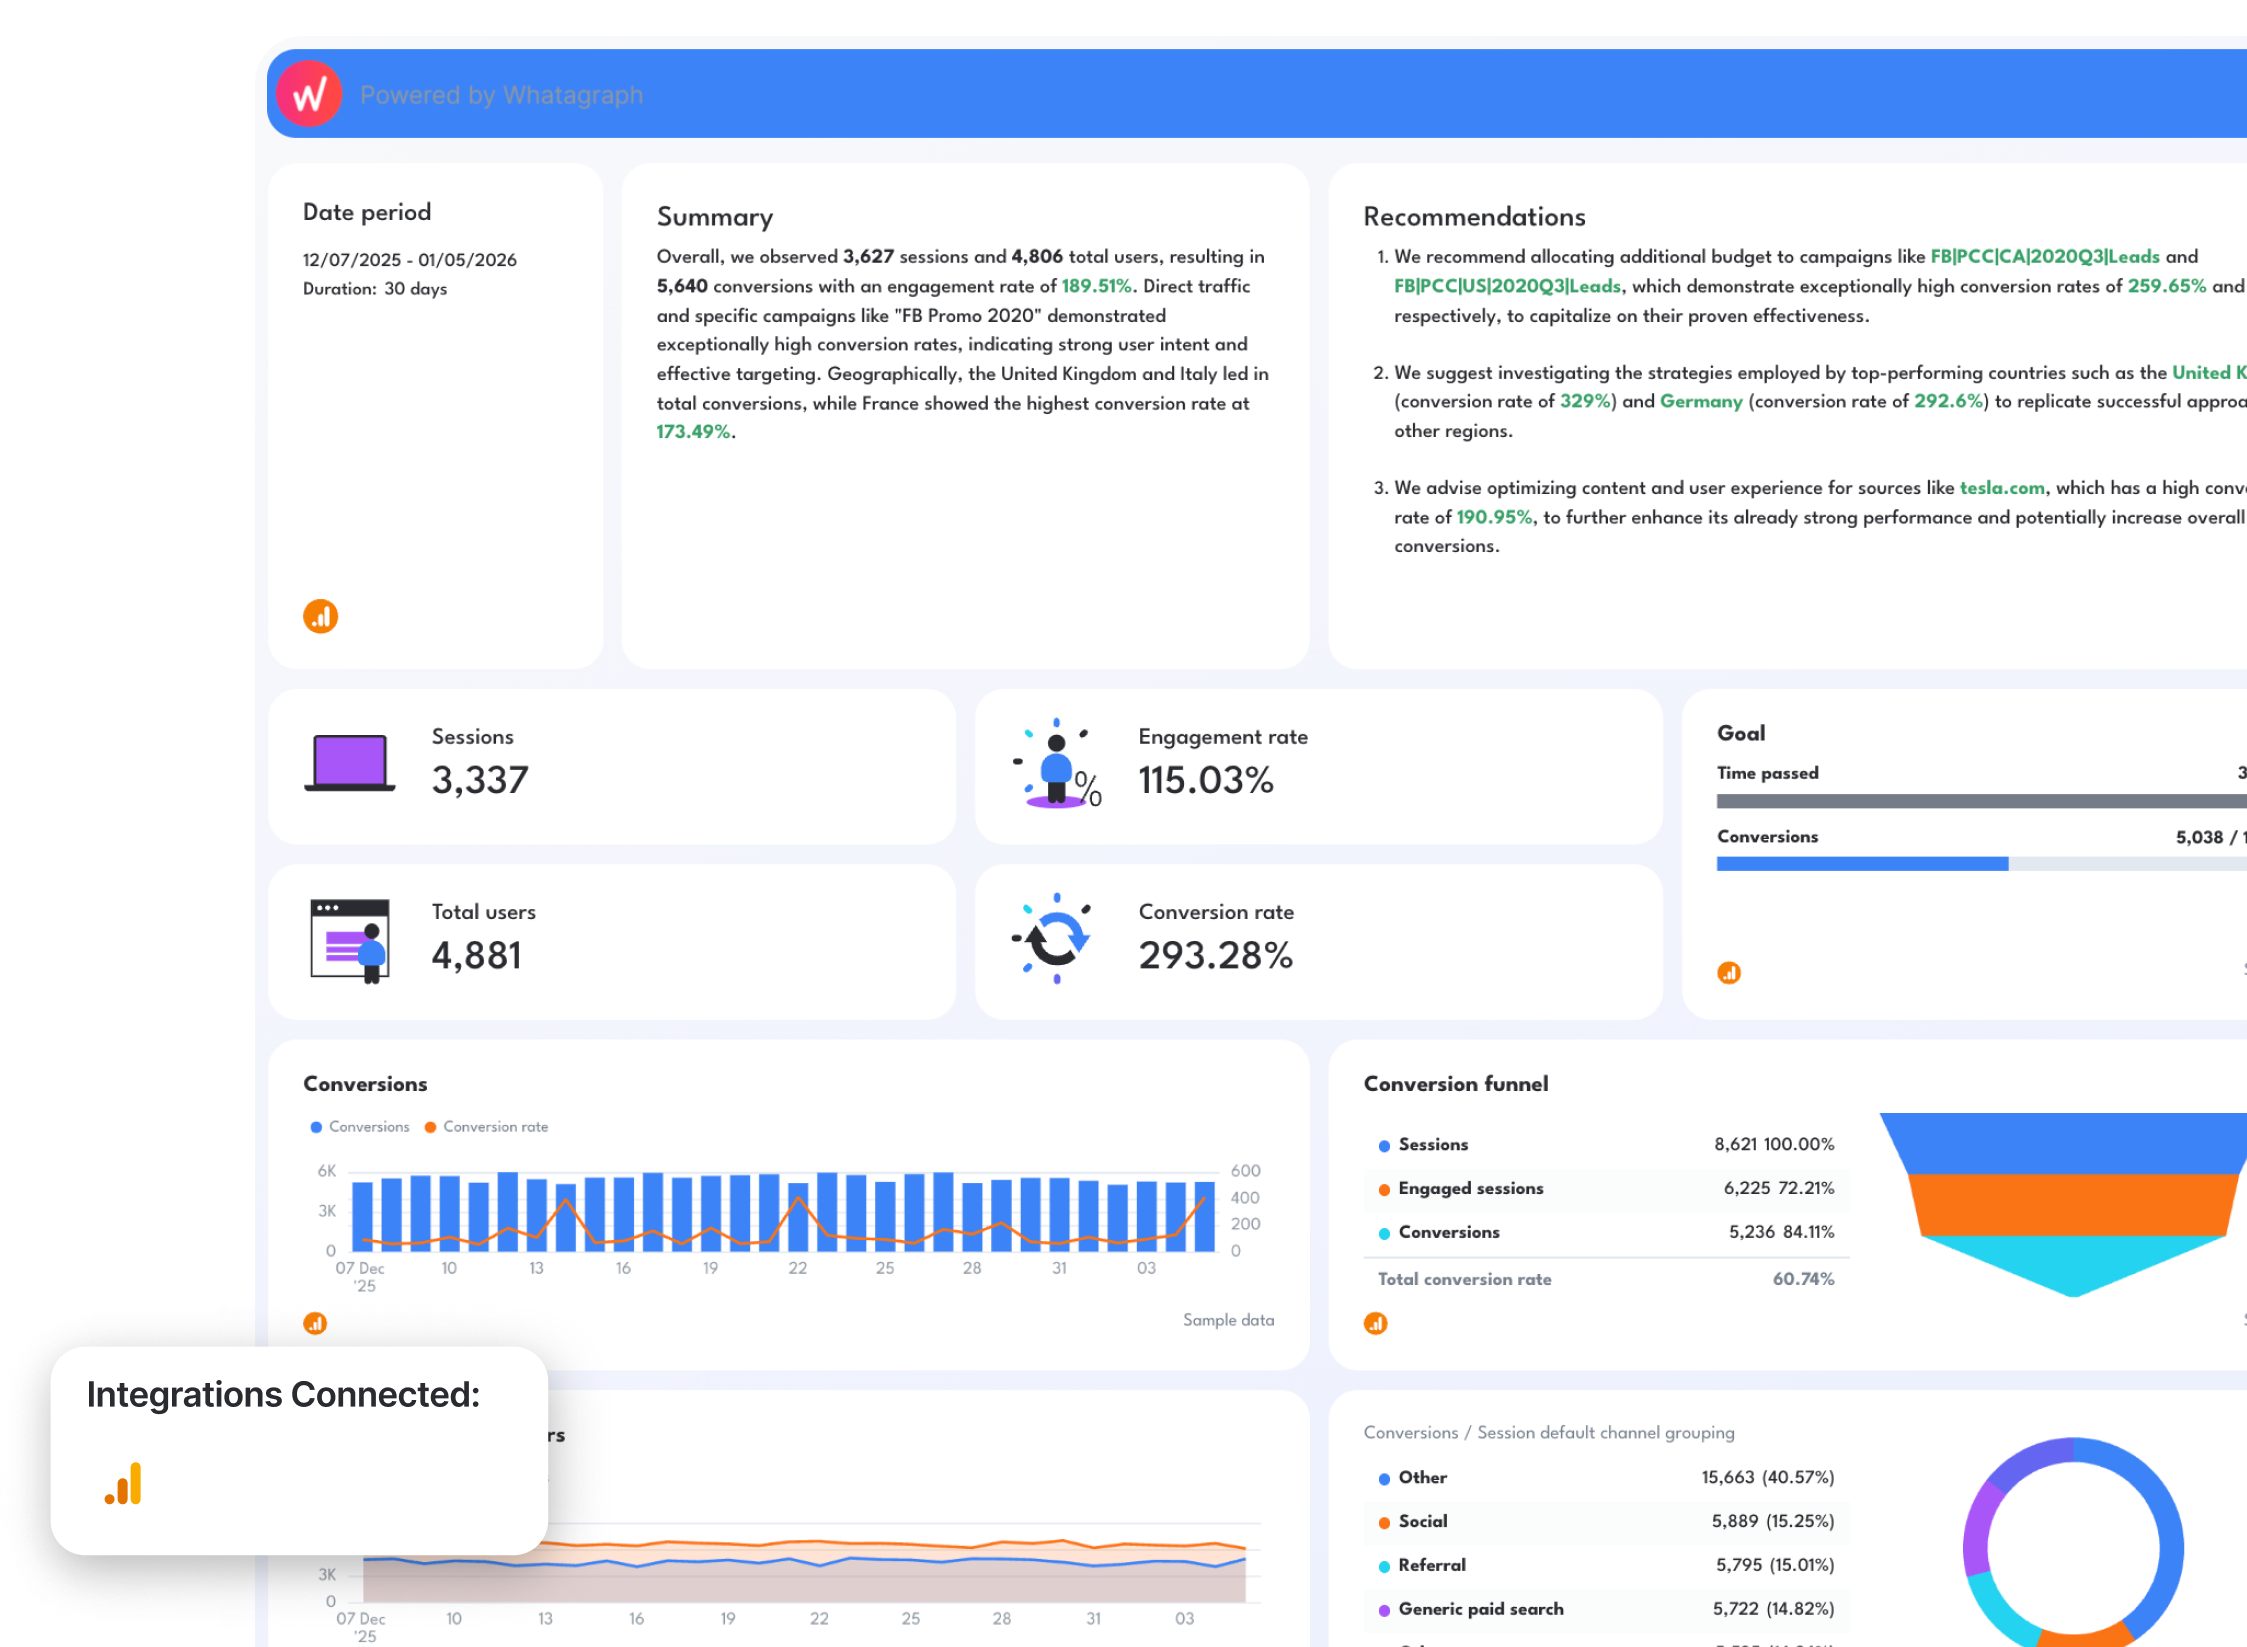
4. PPC Report Template
Channels connected: Google Ads, Facebook Ads, TikTok Ads, LinkedIn Ads
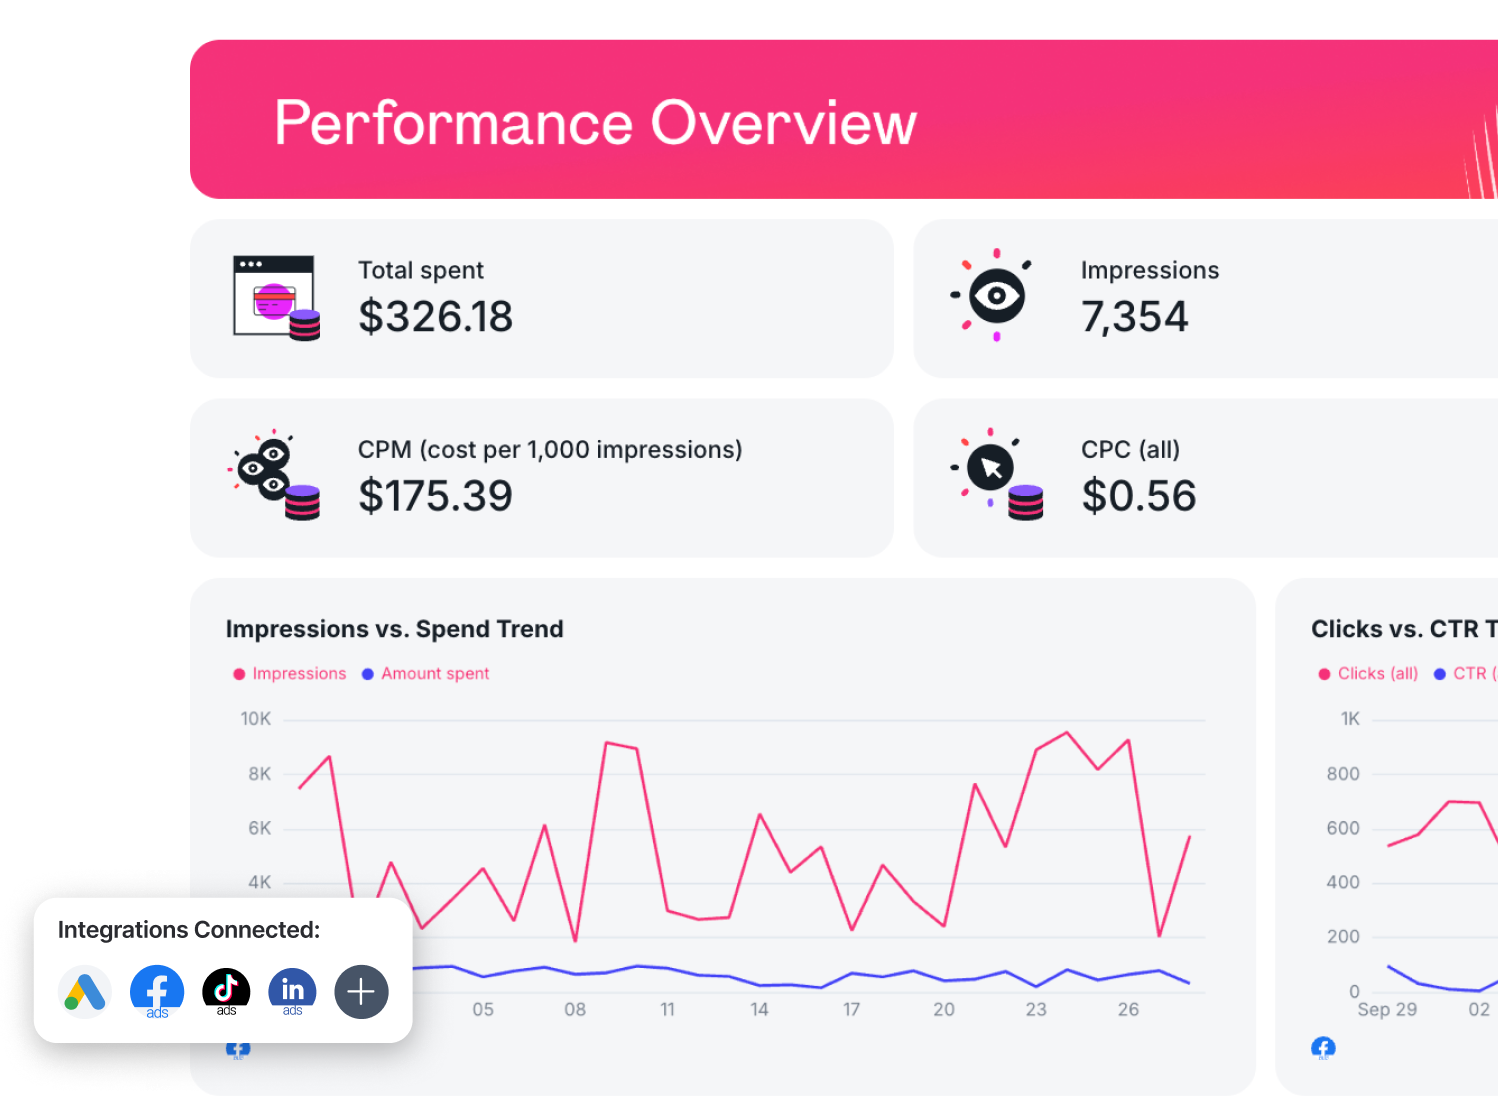
The fourth report to always have close at hand is the PPC report template. It readily displays paid search and paid traffic on one page, although they come from different data sources. Connect Google Ads, Microsoft Ads, Facebook Ads, Linkedin Ads, or any other preferred source, and track key PPC KPIs such as:
- Aggregated ad spend, revenue, and conversions figures from all PPC channels
- Clicks, impressions, ad spend, conversions, revenue and more for each channel
- Campaign and ad performance breakdown
- Conversion funnels
- Keyword performance breakdown
- Goals and progress
- Summary and recommendations
- Banner images, logos, and GIFs
How to use this PPC report template
5. eCommerce Report
Channels connected: Google Ads, Facebook Ads, LinkedIn Ads, TikTok Ads, Pinterest Ads, Shopify, WooCommerce
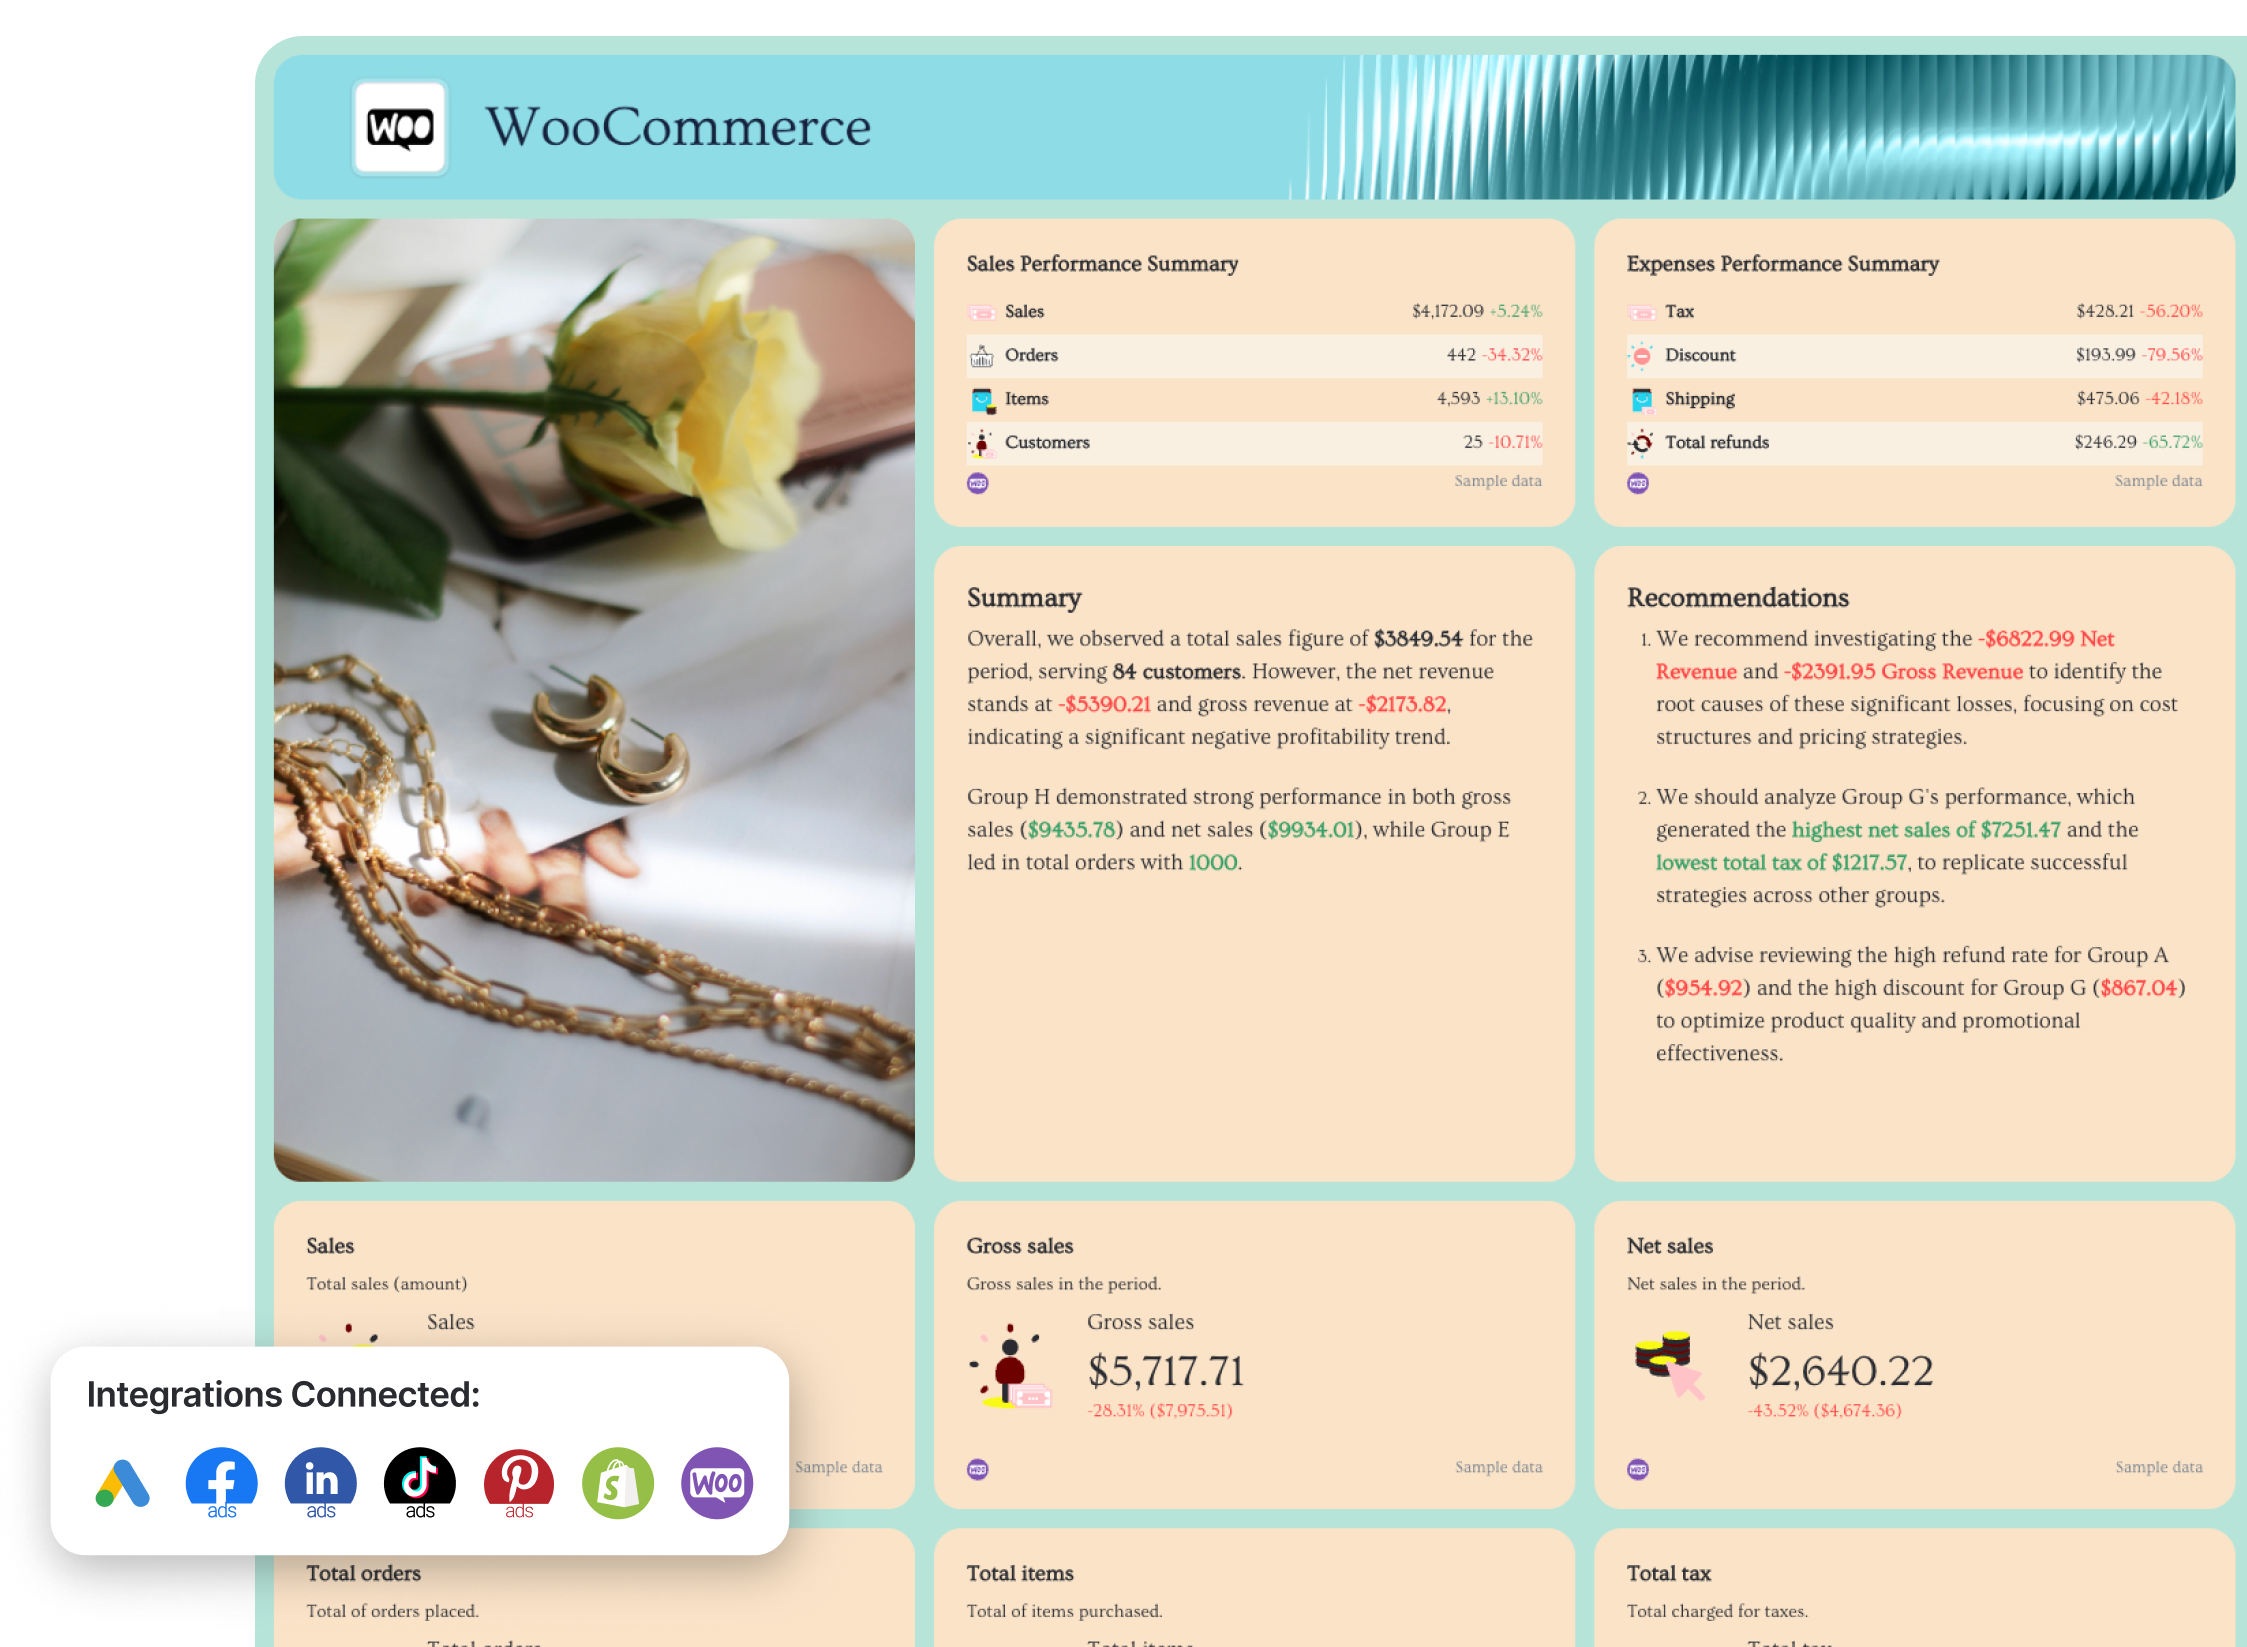 With this eCommerce report template, you can track :
- Total sales, gross sales, net sales
- total orders
- Total items
- Total customers
- Tax
- Discount
- Shipping
- Total refunds
- …plus KPIs from each marketing channel like Facebook Ads, LinkedIn Ads, Google Ads, e.t.c.
- Average order value
- Sales over time
- Sales channel performance
How to use this eCommerce report template
Whatagraph gives you a way to consolidate data coming from multiple web analytics platforms and track the metrics that make the most impact.
Start a 14-day free trial with Whatagraph and build your first web analytics report in minutes, not hours.
How to Create a Web Analytics Report - Step-by-Step Guide
If you'd rather use a Google Sheet, we've got you covered too.
Just make a copy of this FREE Google Sheet.
Or if you choose to use Whatagraph, here's a comprehensive breakdown of how to create a web analytics report.
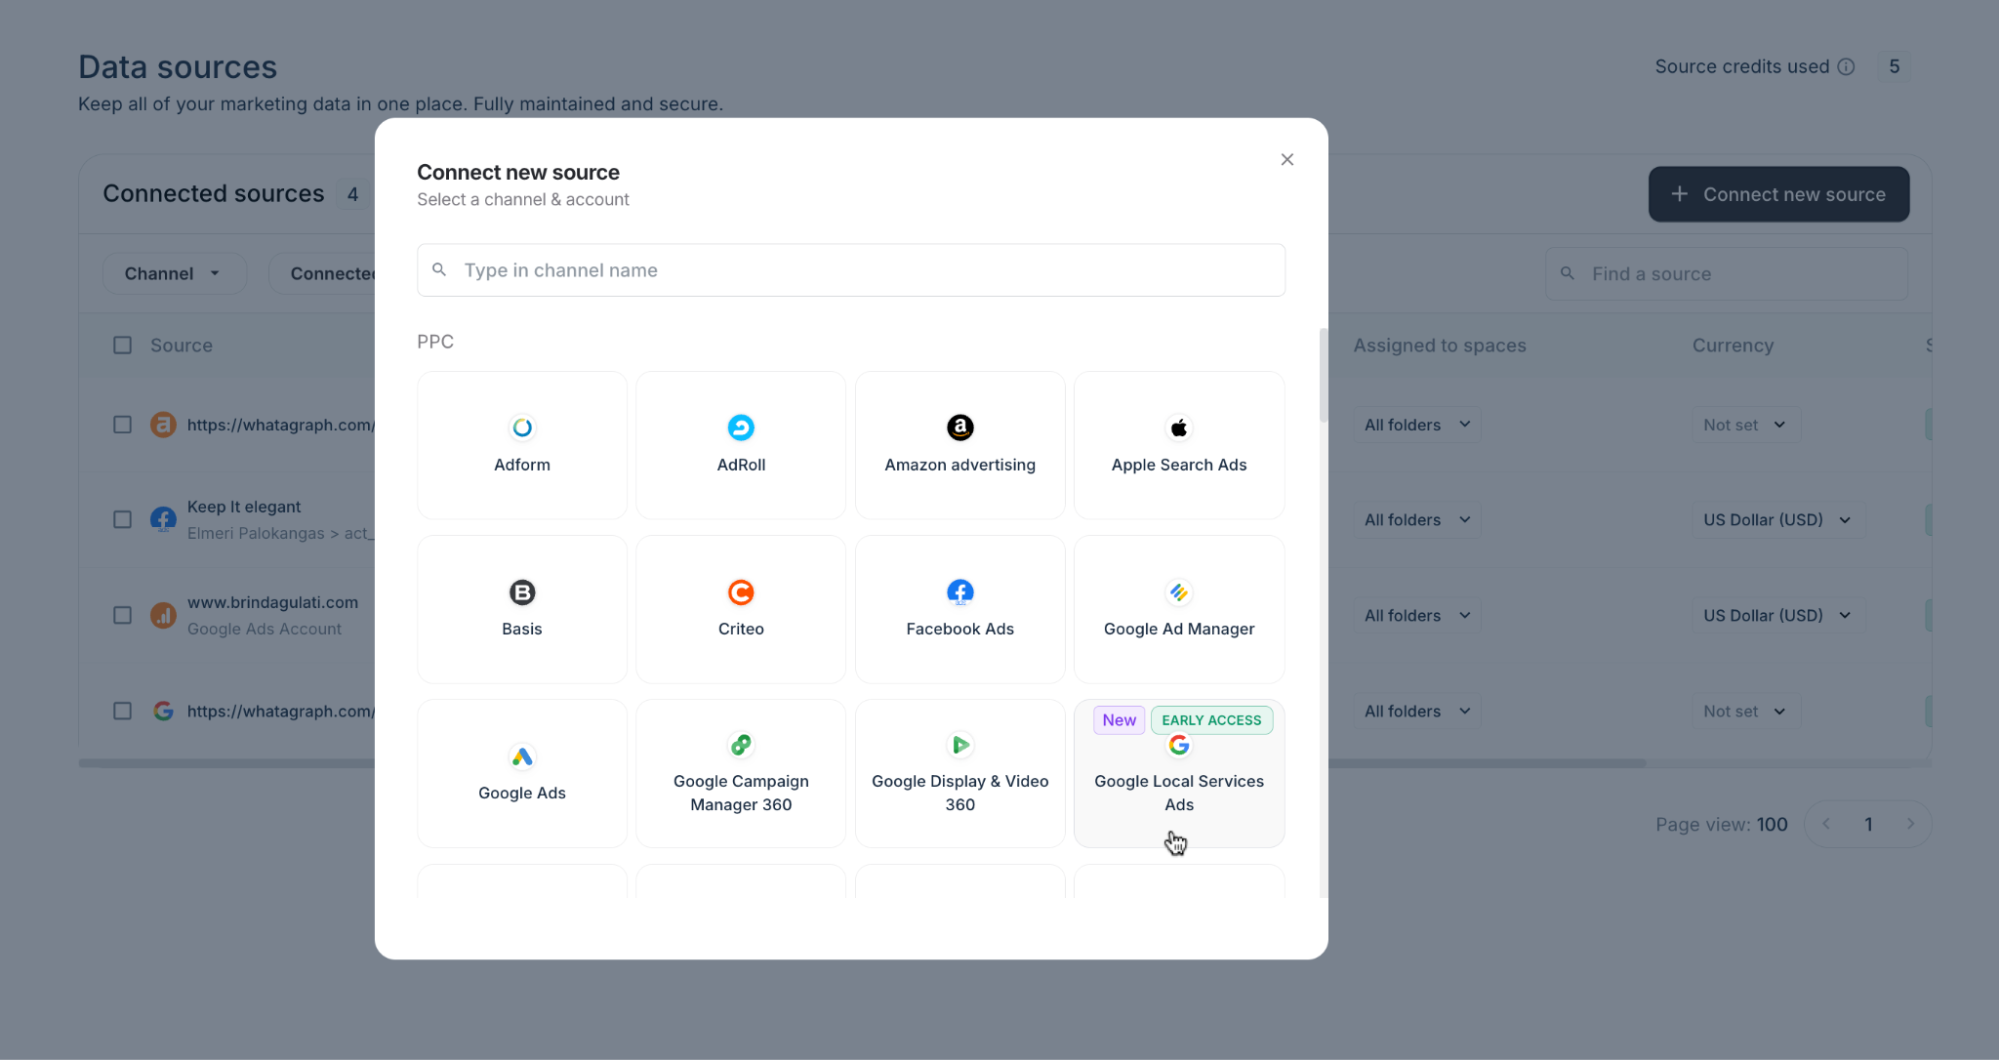
Step 1: Connect all Your Data
Start by connecting the data from all the web analytics tools and platforms you’re using for a specific client.
With Whatagraph, you don't need to stitch any spreadsheets. Instead, you can connect all your data in just a few clicks.
Whatagraph has fully managed integrations with 55+ marketing channels, including:
- Google Analytics 4
- Google Search Console
- Ahrefs
- Semrush
- Facebook Ads
- LinkedIn Ads
- YouTube
- Mailchimp
- CallRail
- Salesforce
- HubSpot
These direct integrations are much more reliable than third-party connectors that many other marketing reporting tools use. Third-party connectors can slow down your online report or give you inaccurate data as they can refresh at different rates from one another.
With Whatagraph, you can pull data from scattered sources right into your reports without missing a beat.
The integrations are developed and maintained by our dedicated team of engineers, so once you connect your accounts, there’s nothing to update or re-connect on your part.
How to do it:
- Open Whatagraph, go to Data Sources, and select the marketing platforms you need.
- Follow the on-screen instructions to provide the necessary credentials and connect each source.
- Once connected, Whatagraph will automatically pull in the latest data and update it automatically.
This way you get:
- A centralized view of all your marketing campaign metrics across platforms and tools.
- Accurate and relevant data in every campaign report you send.
Step 2: Organize your data for actionable insights
Even after you bring all your data into one place, you'll still need to clean it so your reports show an accurate and holistic view of performance.
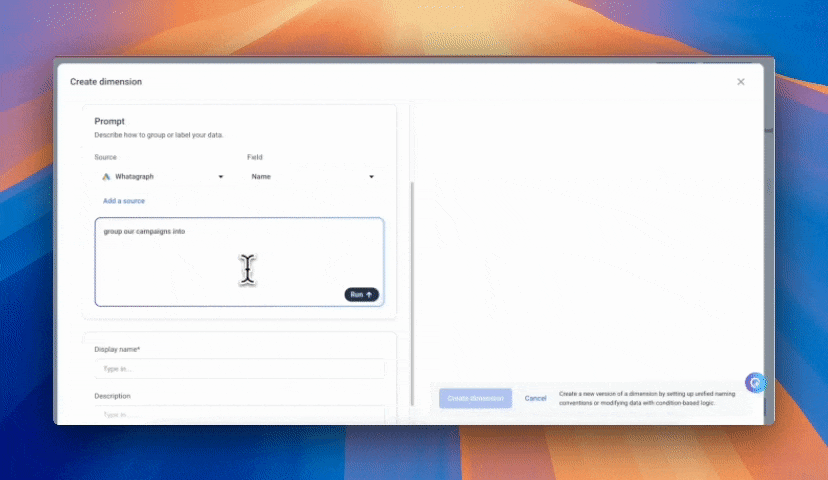
With Whatagraph, you can easily unify, blend, and standardize your metrics and dimensions through no-code workflows.
- Custom metrics: For example, merge “Sessions,” “Visits,” and “Users” into one clean metric, or build a new one using a simple formula. Once defined, these metrics remain unified across reports automatically.
- Data blending: Combine multiple sources like GA4, Facebook Ads, Shopify, and more, into a single blended dataset. See which channels drive traffic and sales side-by-side, and keep your dashboards clean and cohesive.
- IQ dimensions: IQ Plus lets you categorize and group your data automatically by any dimension you can access. For instance, “Campaign Name.” Just provide a few examples or a general instruction (like “group campaigns by region” or “separate brand vs. performance campaigns”), and the AI will:
- Detect patterns in your data,
- Create a new custom dimension; and
- Group your selected dimension accordingly.
Step 3: Generate your report
Whatagraph gives you three flexible ways to build a report, depending on how much control or automation you want.
1. Create your web analytics report with Whatagraph IQ
This is the fastest way to go from data to insights.
Click Create Report with IQ in the top right corner.
Choose which data source you want to populate your report with. Then, either choose from the auto-generated prompts or type in “web analytics report,” and hit Generate Report.
Voila! Here’s your report, ready in under 60 seconds:
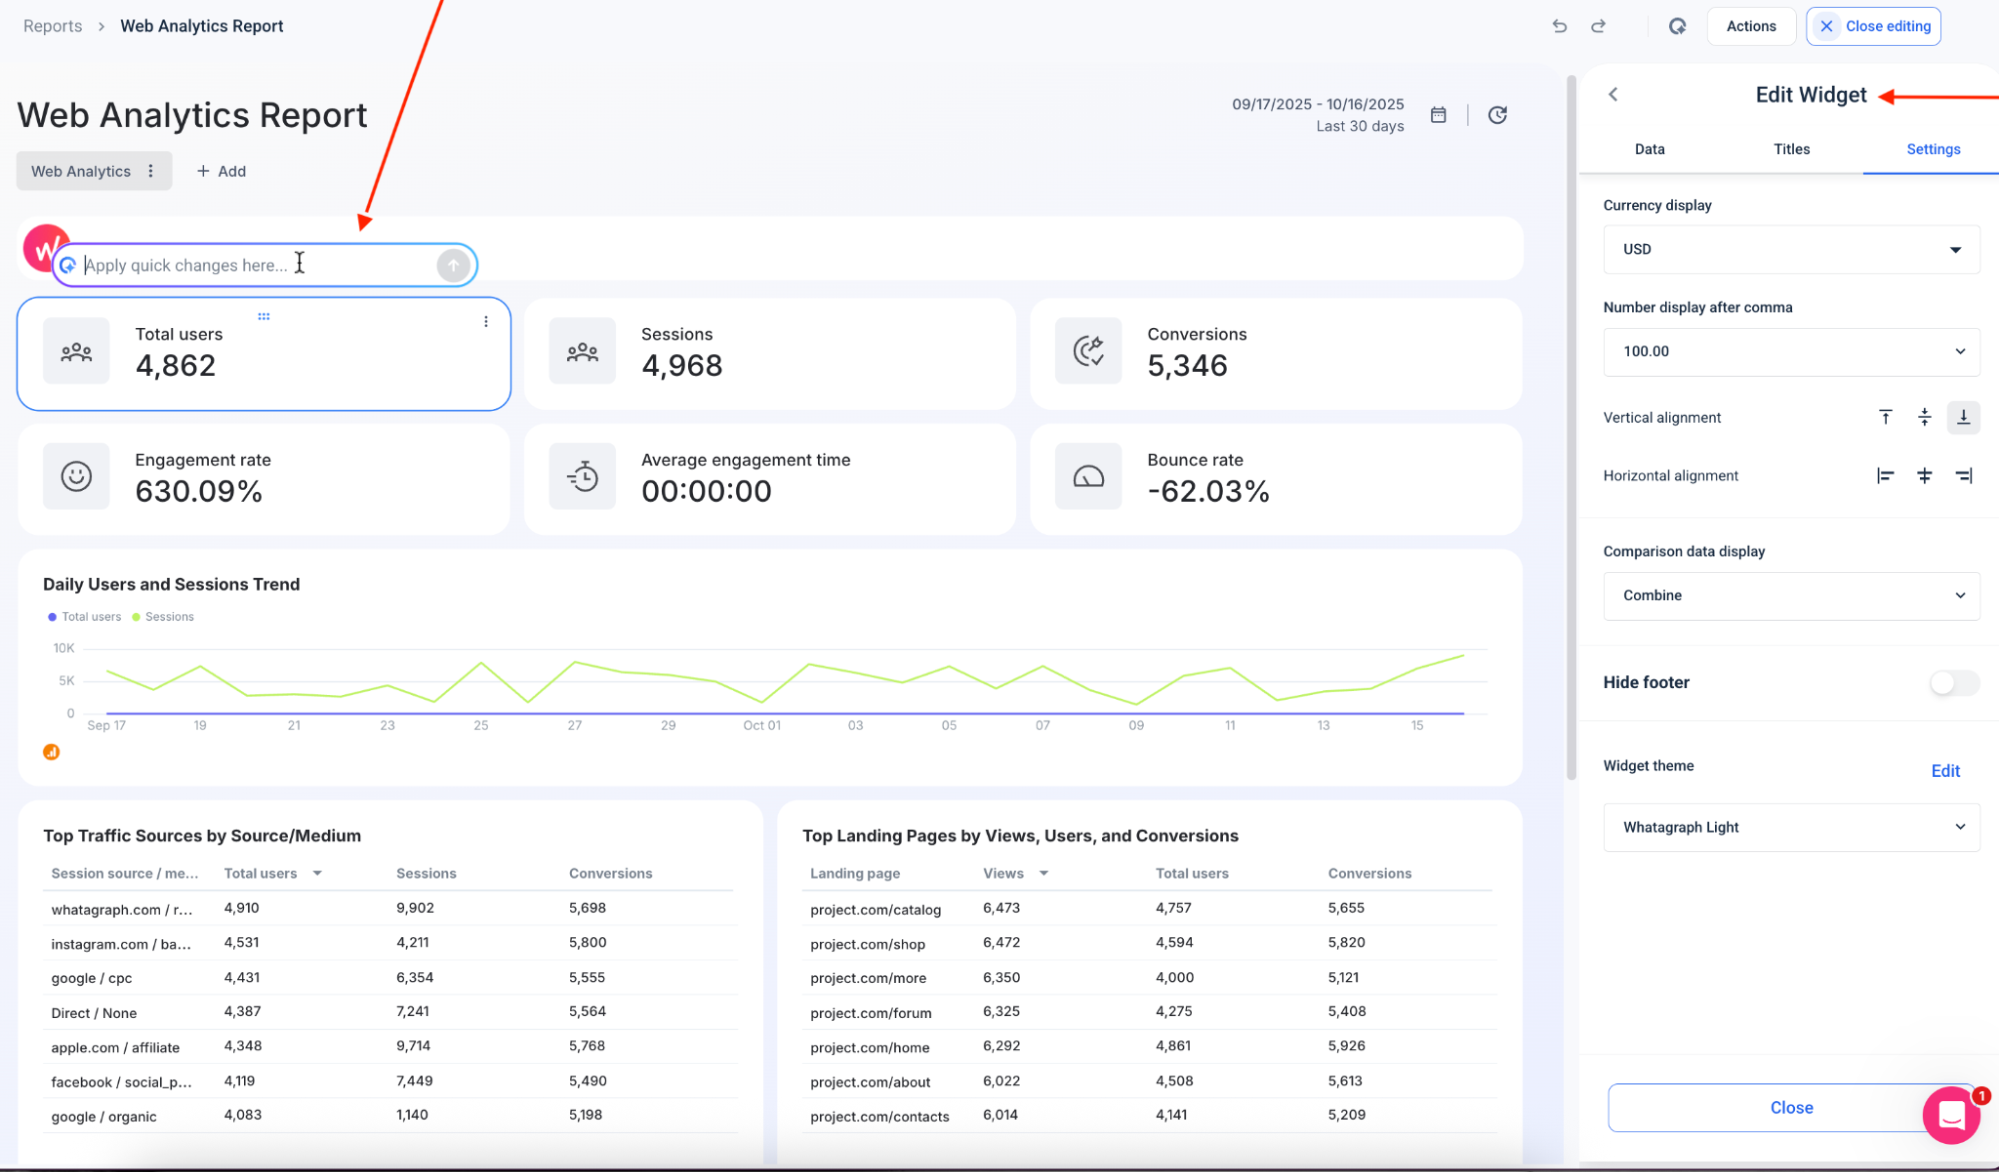
Once Whatagraph IQ has done the heavy lifting, you’re not stuck with a static layout; make it entirely your own.
From here, you can:
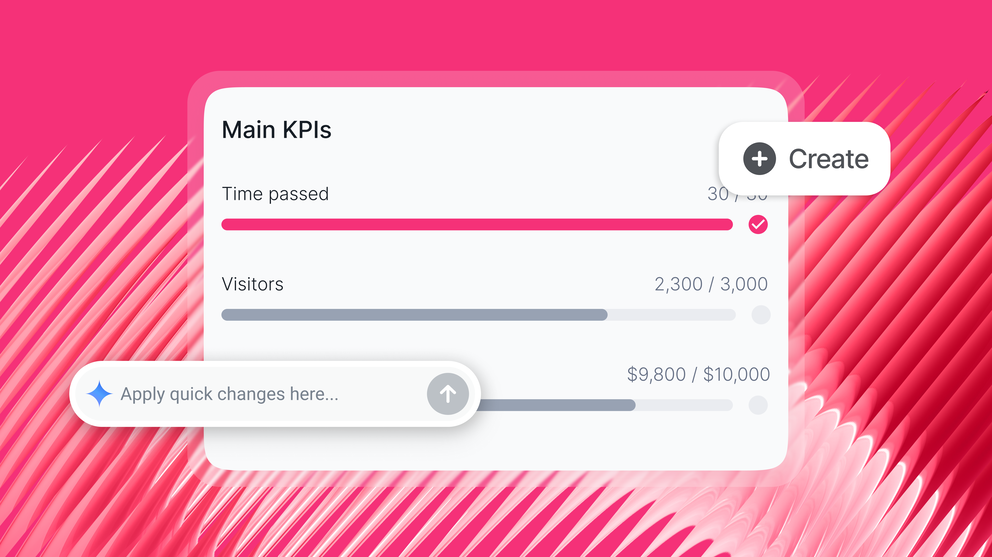
- Edit any widget: Click any chart or metric block to tweak the data source, change visual styles, or fine-tune formatting right from the sidebar. Or just ask Whatagraph IQ to modify a widget, and it’ll do it in seconds.
- Apply quick global changes: Use the top search bar to adjust currency, date range, or filters across the entire report in one go.
- Customize branding instantly: Apply your logo, brand colors, or fonts, and the report updates in real time.
2. Create a web analytics report from a pre-built template
Click the downwards arrow next to the Create Report with IQ button and select New report from template.
Type in “web analytics” and you’ll get 12 plug-and-play templates, each preloaded with widgets, metrics, and visualizations.
Choose from templates like:
- Website traffic dashboard: For top-level KPIs like users, sessions, and bounce rate.
- Web Traffic Report Template: A well-rounded overview of site performance by channel.
- Google Analytics 4 overview template: Tailored to GA4 data and engagement metrics.
- WooCommerce + Analytics: Built for online stores running on WooCommerce.
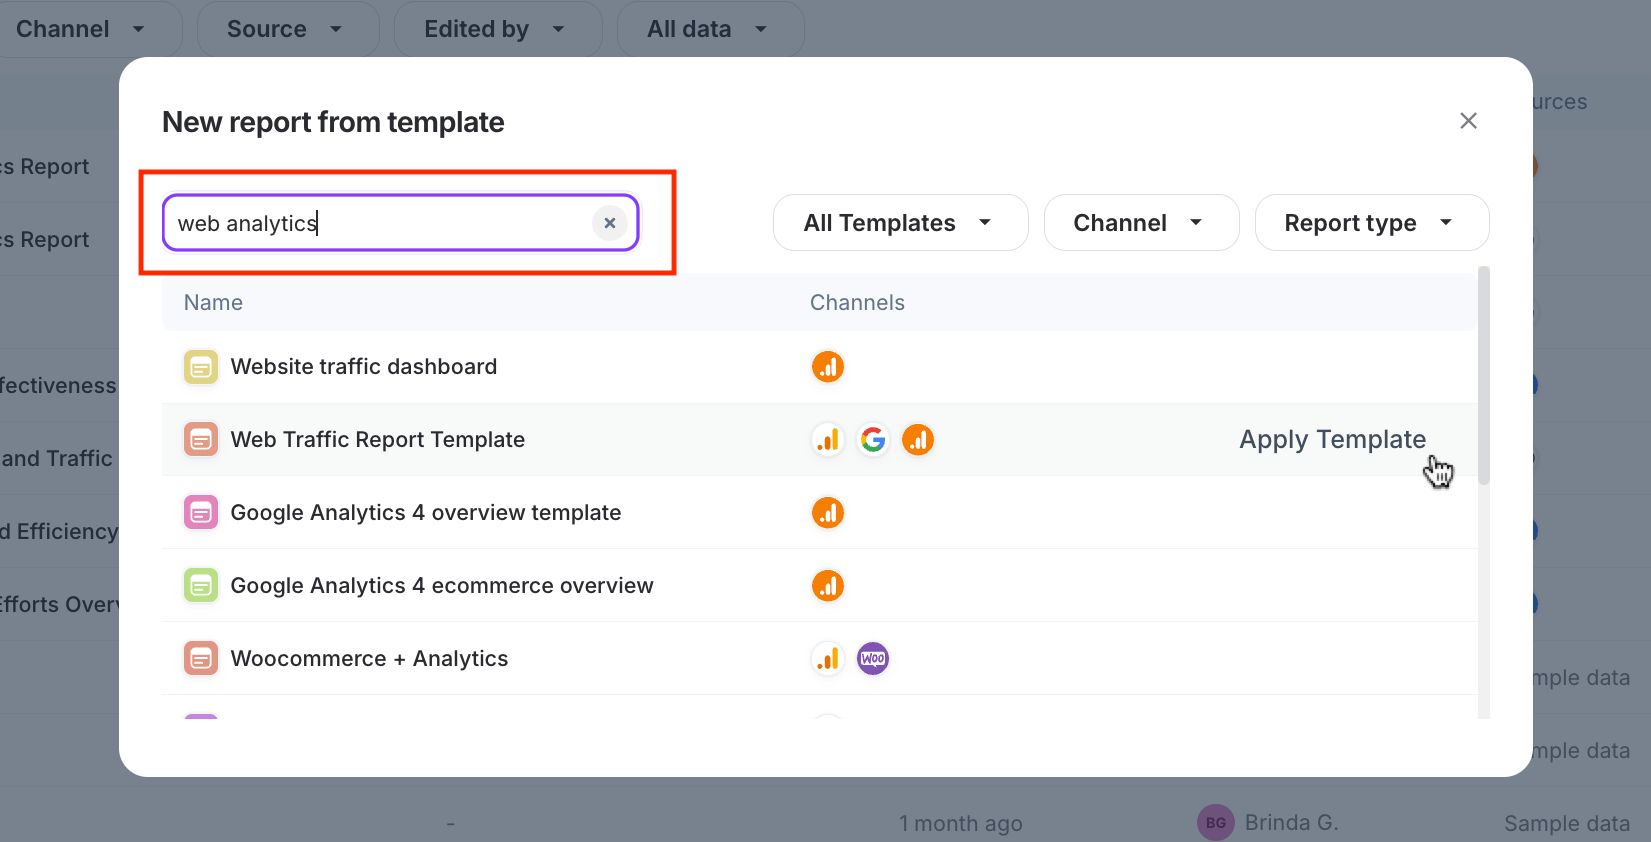
Once you hit Apply Template, Whatagraph instantly populates it with your connected data. From there, you can edit any widget, blend in other channels (like Meta or LinkedIn Ads), or rebrand the visuals in seconds.
3. Create a report from scratch
Select New blank report from the drop-down menu.
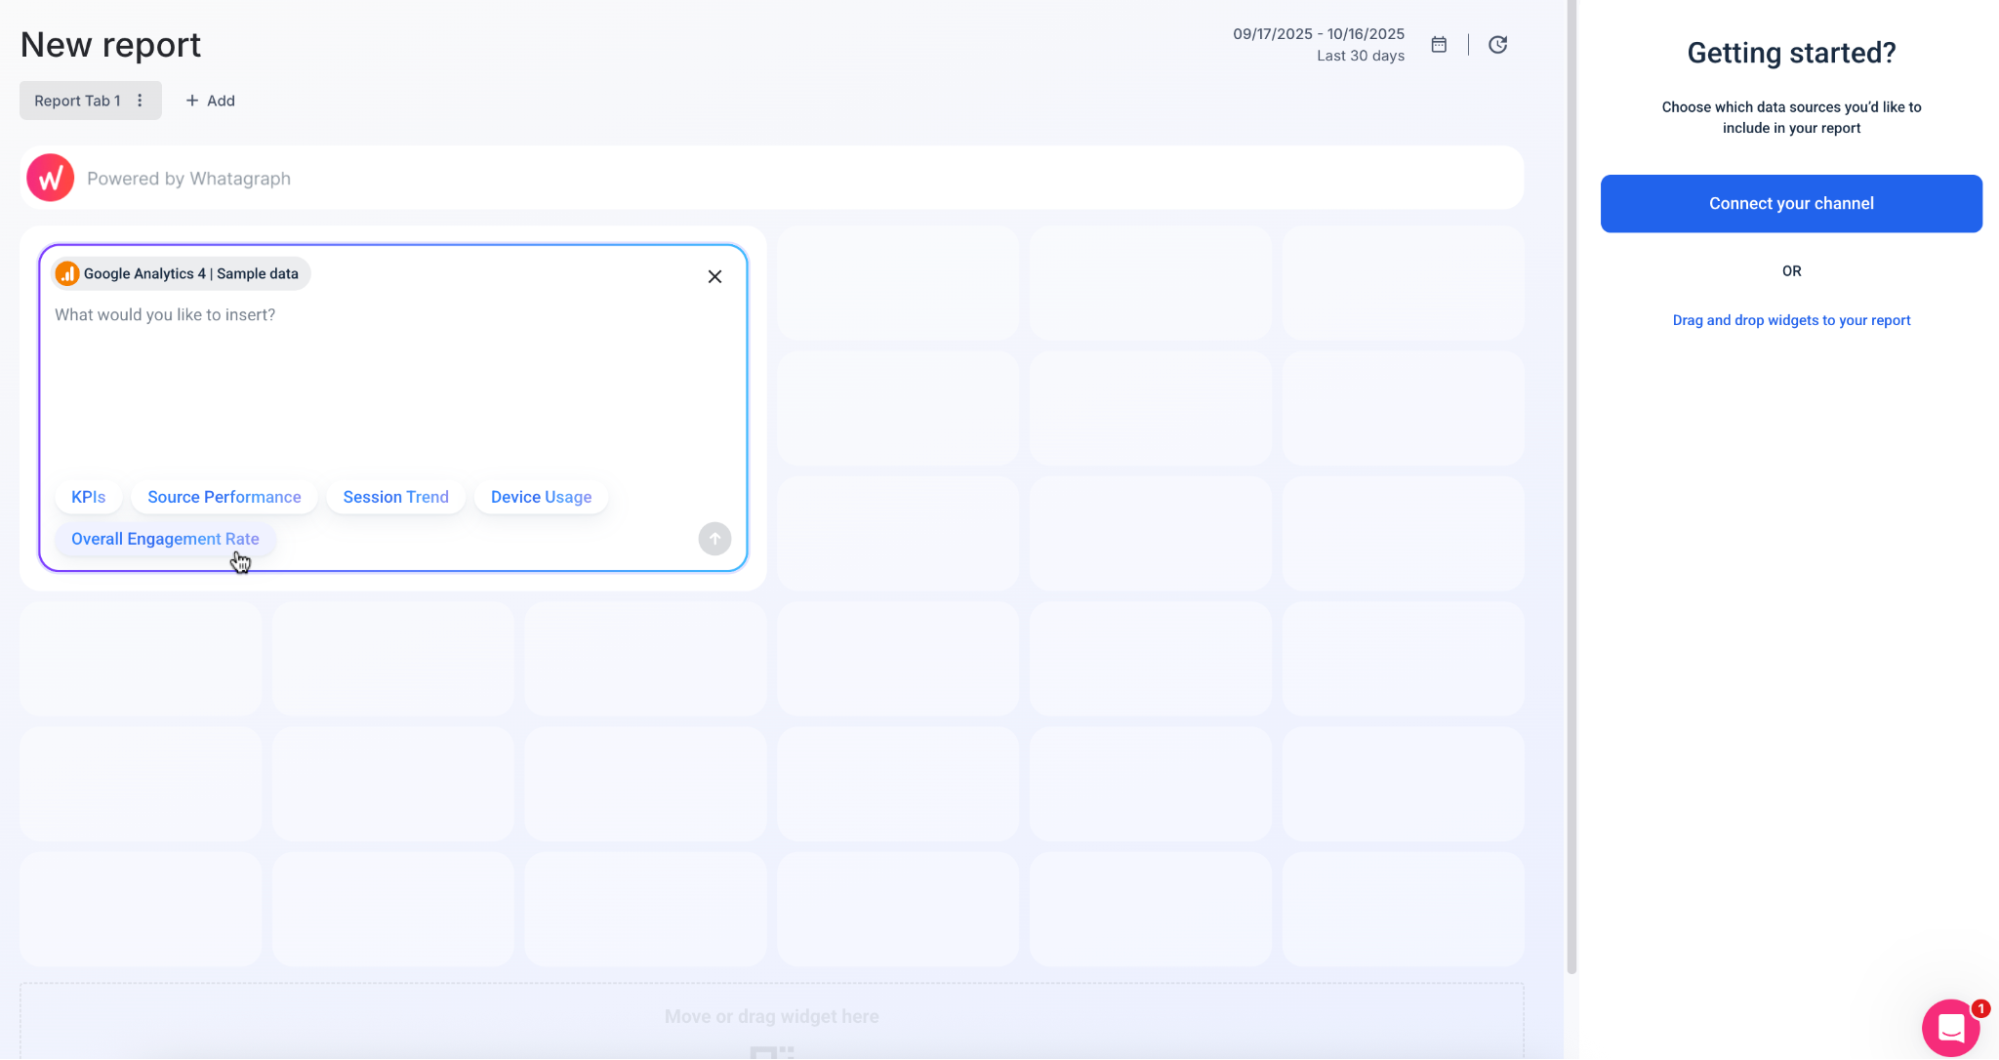
From here, you can:
- Pick your data source: Connect Google Analytics 4, Meta Ads, Shopify, or any of 60+ platforms.
- Add what matters: Insert pre-made or custom widgets for KPIs, source performance, device usage, session trends, or overall engagement rate—just drag, drop, and arrange.
- Design your own layout: Choose chart types, data comparisons, and color themes to match your brand or reporting needs.
- Mix and match channels: Combine web, social, and ecommerce data in one unified report for a complete performance overview.
Whatagraph power tip: Start blank if your clients track unusual KPIs (like custom events, assisted conversions, or regional revenue splits). You’ll have total freedom to build reports that match their specific goals.
Step 6. Automate how you share your report
You’ve built and branded your report—now let it run on autopilot.
With Whatagraph’s report automation, you can schedule recurring deliveries to clients or teammates, so they always get fresh data without manual effort.
Here’s how to set it up:
- Choose a predefined date range (e.g., Last 7 days, Last month).
- Click Actions > Automate report.
- Pick your sending frequency (daily, weekly, monthly) and delivery time, including time zone and review options.
- Add recipients’ email addresses and click Automate report.
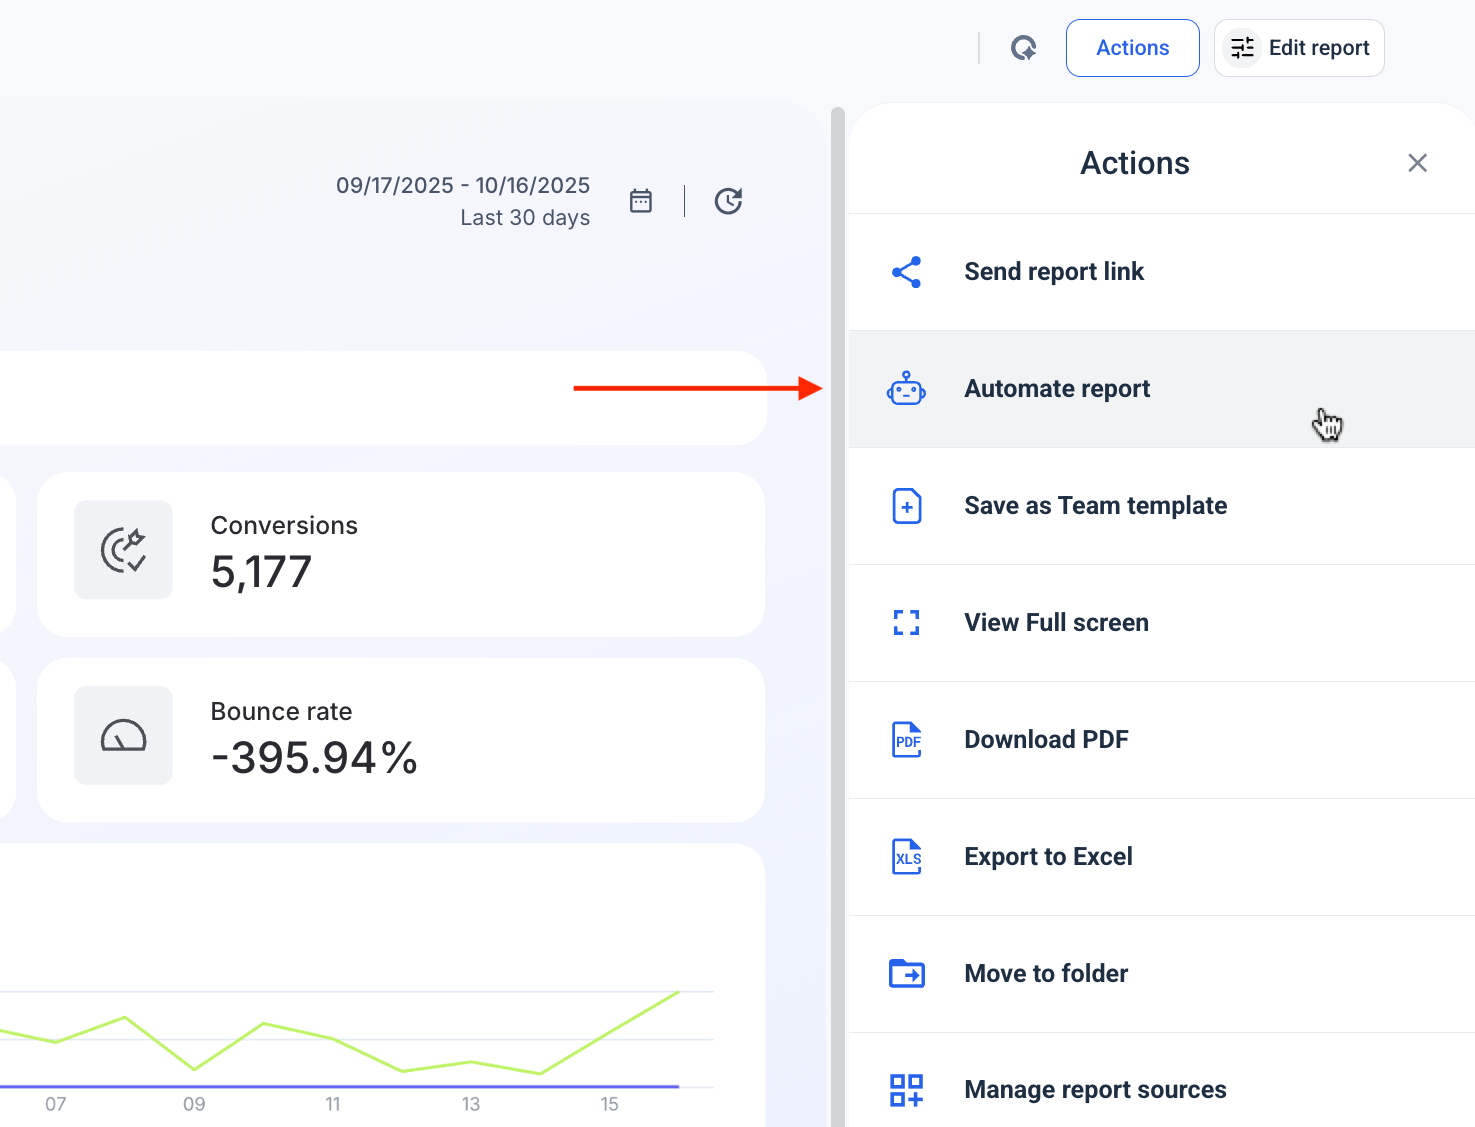
You can choose to:
- Send automatically where reports go out without review.
- Review before sending so you get an email reminder to check data before delivery.
You can also:
- Share password-protected links to a live report.
- Export as Excel or CSV files.
- Save as a “Team template.”
- Download as a PDF.
What 7 Agency Experts Say About Building Web Analytics Reports
We asked professionals from successful digital marketing agencies to share their best practices in building web analytics reports for their clients. These are the insights.
1. Different clients, different needs
When it comes to reporting to clients, one cap definitely doesn’t fit all.
For example, e-commerce clients care about metrics like conversion rates and revenue, while service-based businesses want to see leads and form submissions.
Carradean Farley, Co-Founder of Periscope Media, shares his view:
Most of our clients are in the local services like plumbers, HVAC, cleaners, painters so they don't need very in depth analytics they just want their phone to ring and people to fill out the form on their website.
Things are much different for clients in online businesses. Farley explains:
This is in stark contrast to our e-commerce clients who get into the weeds about click through rates, conversion rates, cost per conversion, cost per mille, return on ad spend, time on page, page path, and other specific stats.
This is why it makes little sense to follow a rigid report template, but create custom website analytics reports that fit clients' needs.
For example, Ameet Khabra, founder of Hop Skip Media, customizes the presentation and analysis to match each client's unique business model and goals.
Currently, we’re working on moving towards building custom dashboards collaboratively with each client. We’ve learned that what’s meaningful to one client is not meaningful to the next (i.e. ecomm vs lead gen).
What’s more clients often don’t have the technical or even marketing background to interpret complex web analytics data or metrics. This is why you need to tweak each report to different client group or even individual client.
Sebastian Ellis, CEO of Ellis Digital, has an interesting approach.
In his agency, they segment and tailor reports into three categories based on not only the specific information that clients need but also their knowledge:
The three core areas we put our clients in are: 1. Those with no knowledge, likely the older demographic, 2. Business owners that are keen to understand the data around each area of the funnels such as traffic, checkouts and total revenue, 3. Semi-pro digital marketers, those clients with in-depth knowledge around metrics, performance and raw data.
2. Keep the presentation clear and digestible
Another way to make reports more understandable is to use visuals whenever possible.
Tables are useful for a closer inspection of how the numbers have changed over time, but simplified visuals like pie charts, line graphs, and trend comparisons are much more engaging.
For Ben Duffy, Client Development Manager at Quirky Digital, it’s important to highlight whether the site’s performance is improving, staying consistent, or experiencing any fluctuations:
We structure our web analytics reports to make the data as clear and digestible as possible. One key element is the use of line graphs, which allow clients to easily track trends over time. We also provide comparisons both year on year (YoY) and period over period (e.g., month over month or quarter over quarter).
By breaking down data into visual elements and clear comparisons, they help clients quickly grasp their website’s performance.
Joshua Wood, CEO of CJ Digital, goes one step further and sends a written summary with every report:
We pop this PDF report in an email and also jot down (within the email) the key takeaways from the results and what we're going to focus on in the coming month. This way if they don't want to read the full report they get the cliff notes.
On the other hand, Ryan Andreson, President of Markiserv, believes it’s important for clients to see the impact of the agency’s work right at the beginning:
Specifically on the website front, if we are doing a redesign we get connected to our clients GA4 and their CMS. We then structure a before and after report to gauge the performance of a redesign.
In his agency, they custom-visualize client reports in Adobe Illustrator, so it’s easier for them to understand the changes.
We leave acronym definitions on the bottom of every report (CTR - Click through rate for example) while stating what each means, adds Anderson.
This is especially important when presenting to senior executives in organizations that have no understanding of marketing terms on the web.
In Whatagraph reports, however, there’s no need to explain each acronym at the bottom. You can easily change every metric name to a more understandable wording.
Khabra shares another interesting strategy that keeps clients in the loop without overwhelming them with data:
We follow a two-tiered approach when it comes to our reporting: an automated bi-weekly report that gives clients a quick glance at their account performance, followed by a comprehensive monthly report where our analysts provide detailed insights and work summaries.
This way, their clients stay informed on the high points all the time while also receiving a detailed analysis.
3. Focus on metrics that matter
Clients care most about KPIs that align with their business goals, such as revenue, conversions, and traffic growth.
Peter Lewis, SEO Executive at PIXUS, makes a good point when he says that top metrics vary between client groups.
Most of our clients are e-commerce businesses in the fashion industry and so revenue is the most important, likewise for accounts where we are doing lead generation, it is the number of conversions that are typically the most important.
Farley highlights that e-commerce clients are more interested in granular metrics such as ROAS and Cost per Conversion because they typically run ad campaigns in the tens or hundreds of thousands per month:
If they get a 1 or 2% increase in conversion rate they will see way more revenue and the tweak could have been rather small to implement like changing the color of a call to action, changing the heading of a page, or adding trust icons to a product page.
Wood, on the other hand, notices that hospitality clients in his agency mostly care about traffic growth:
We report on total unique traffic, organic traffic (because we do SEO for our clients), DA score i.e domain authority, bounce rates and time spent on specific web pages mainly.
4. Build trust through transparency
Ok, you're an agency with plenty of experience. You’ve been specializing for different types of clients and at this point, you must already know what to put in the reports.
However, it’s also important to keep clients part of the decision-making process.
Why?
Because then they feel valued. They trust you more and start seeing your relationship as less transactional and more of a partnership with a common goal.
For Joshua Wood, CEO of CJ Digital, it all starts with clear expectations on both sides.
As part of our onboarding with each client we clearly explain what we're going to report on each month and we try and keep it as simple as possible so they can understand it.
In his agency, at the start of each month, they reflect on the previous month's results and create a PDF report using Google Slides to clearly present the results clients care about.
We also use data and screenshots from Google Analytics. From feedback we have received, clients like this because it's come from a platform that can't be fudged, so they trust the results we're reporting on, explains Wood.
Best Practices to Structure a Web Analytics Report
Here are the 7 sections of a web analytics report that no marketing professional will skip.
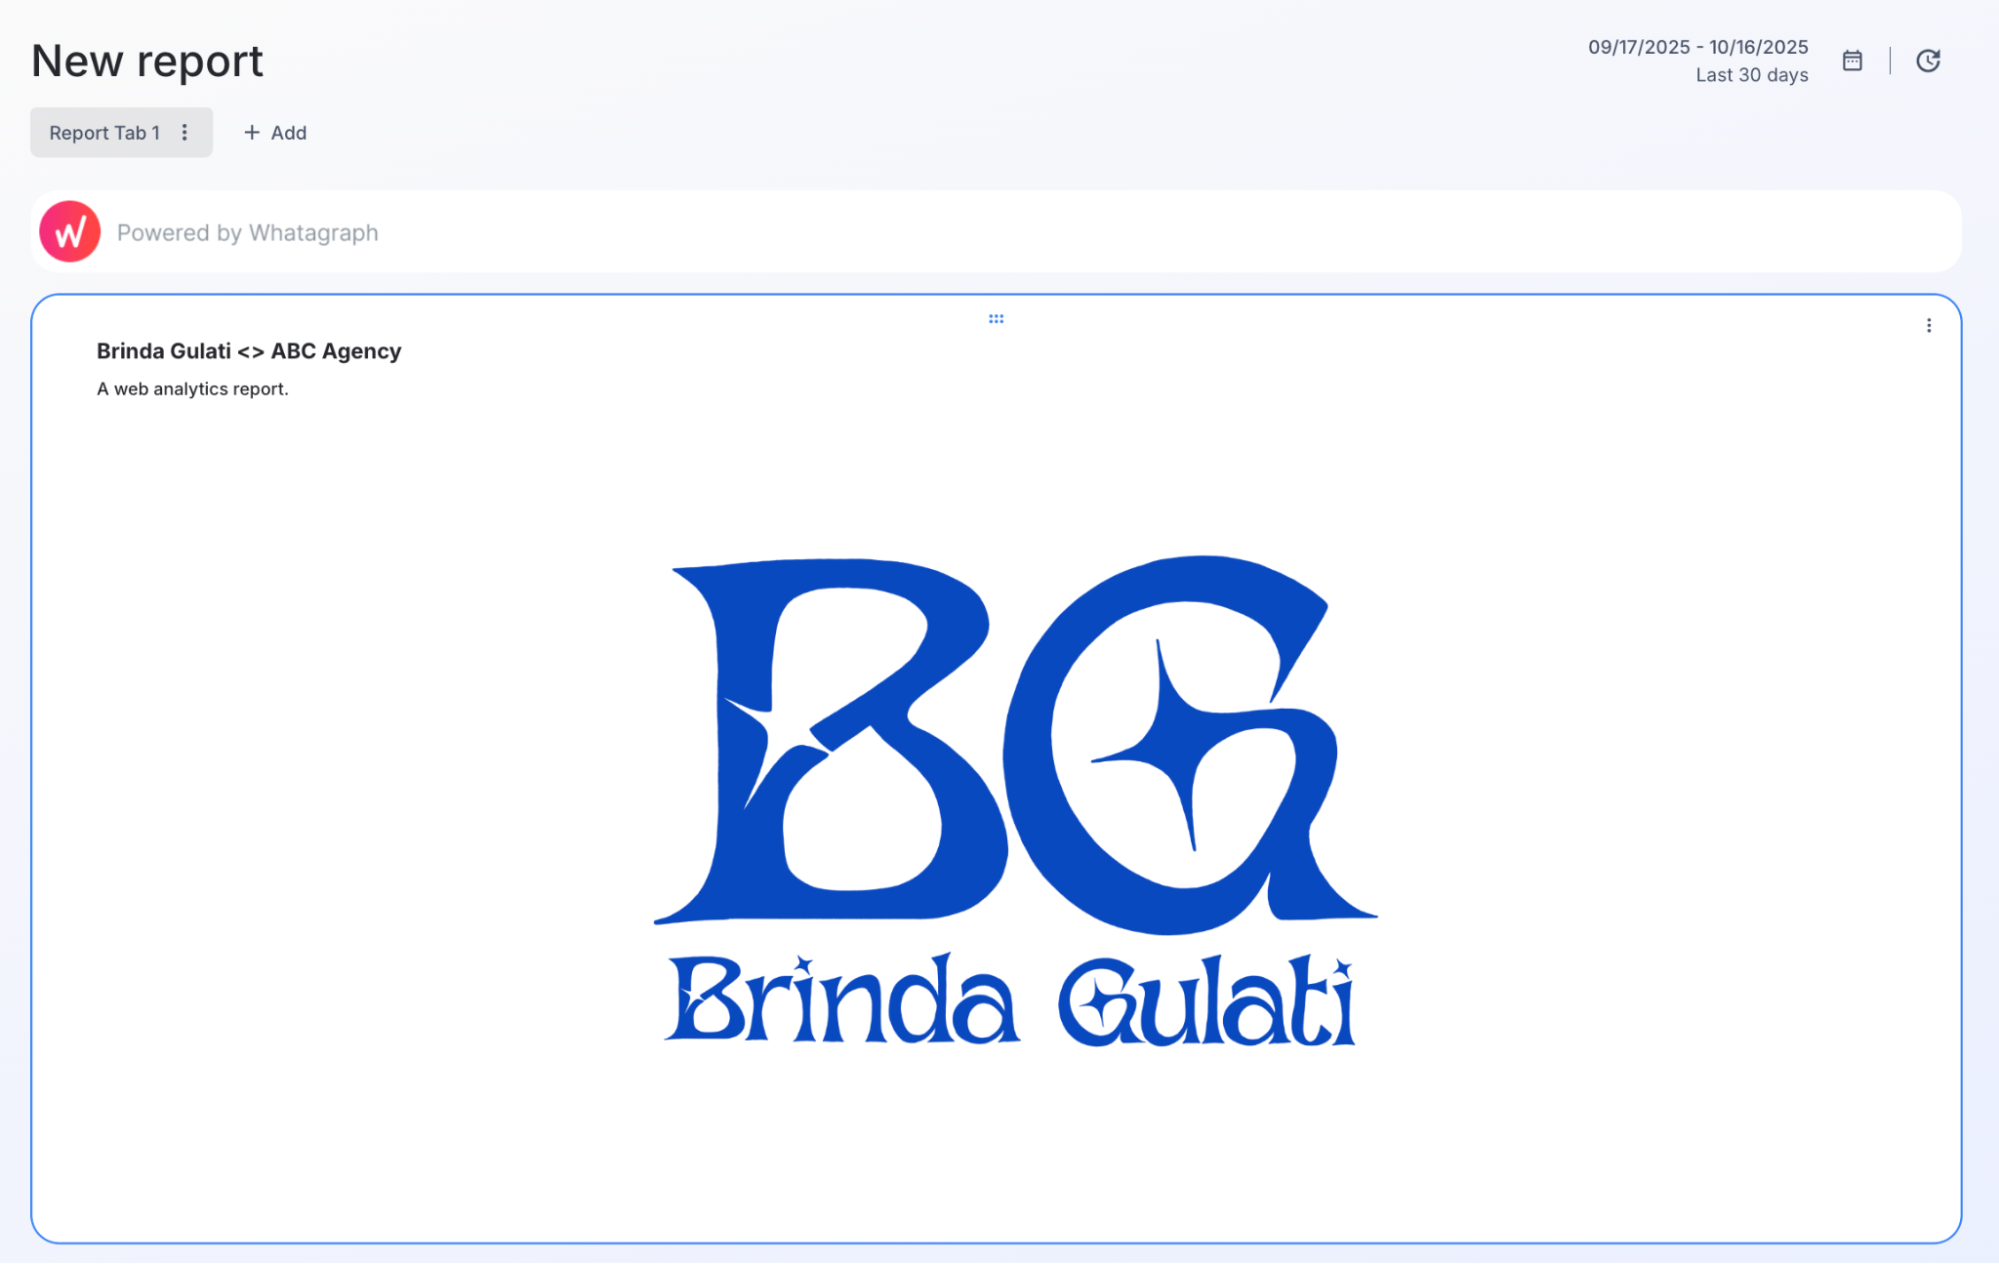
1. Design an engaging cover page
This is where you can upload a custom image that matches your agency’s brand.
The cover page sets the context for the following in-depth analysis and introduces your agency’s expertise, which gives credibility and nurtures a positive client relationship.
In Whatagraph, you can save this page as a template and use it for future reports.
2. Start with a monthly summary
Give your client a monthly summary of what is happening on their website. This is where you discuss goals, deliverables, and results in the most simple way.
Say what you did during the past month and how it impacts the overall strategy. Show real-world data and examples.
With Whatagraph IQ, you can generate this summary instantly:
Click Generate with IQ inside any text widget, and choose what you’d like the AI to highlight:
- Summary: A short overview of key results and shifts in performance.
- Wins: What performed above expectations.
- Issues: Where performance dropped or needs attention.
- Recommendations: Practical next steps to improve results.
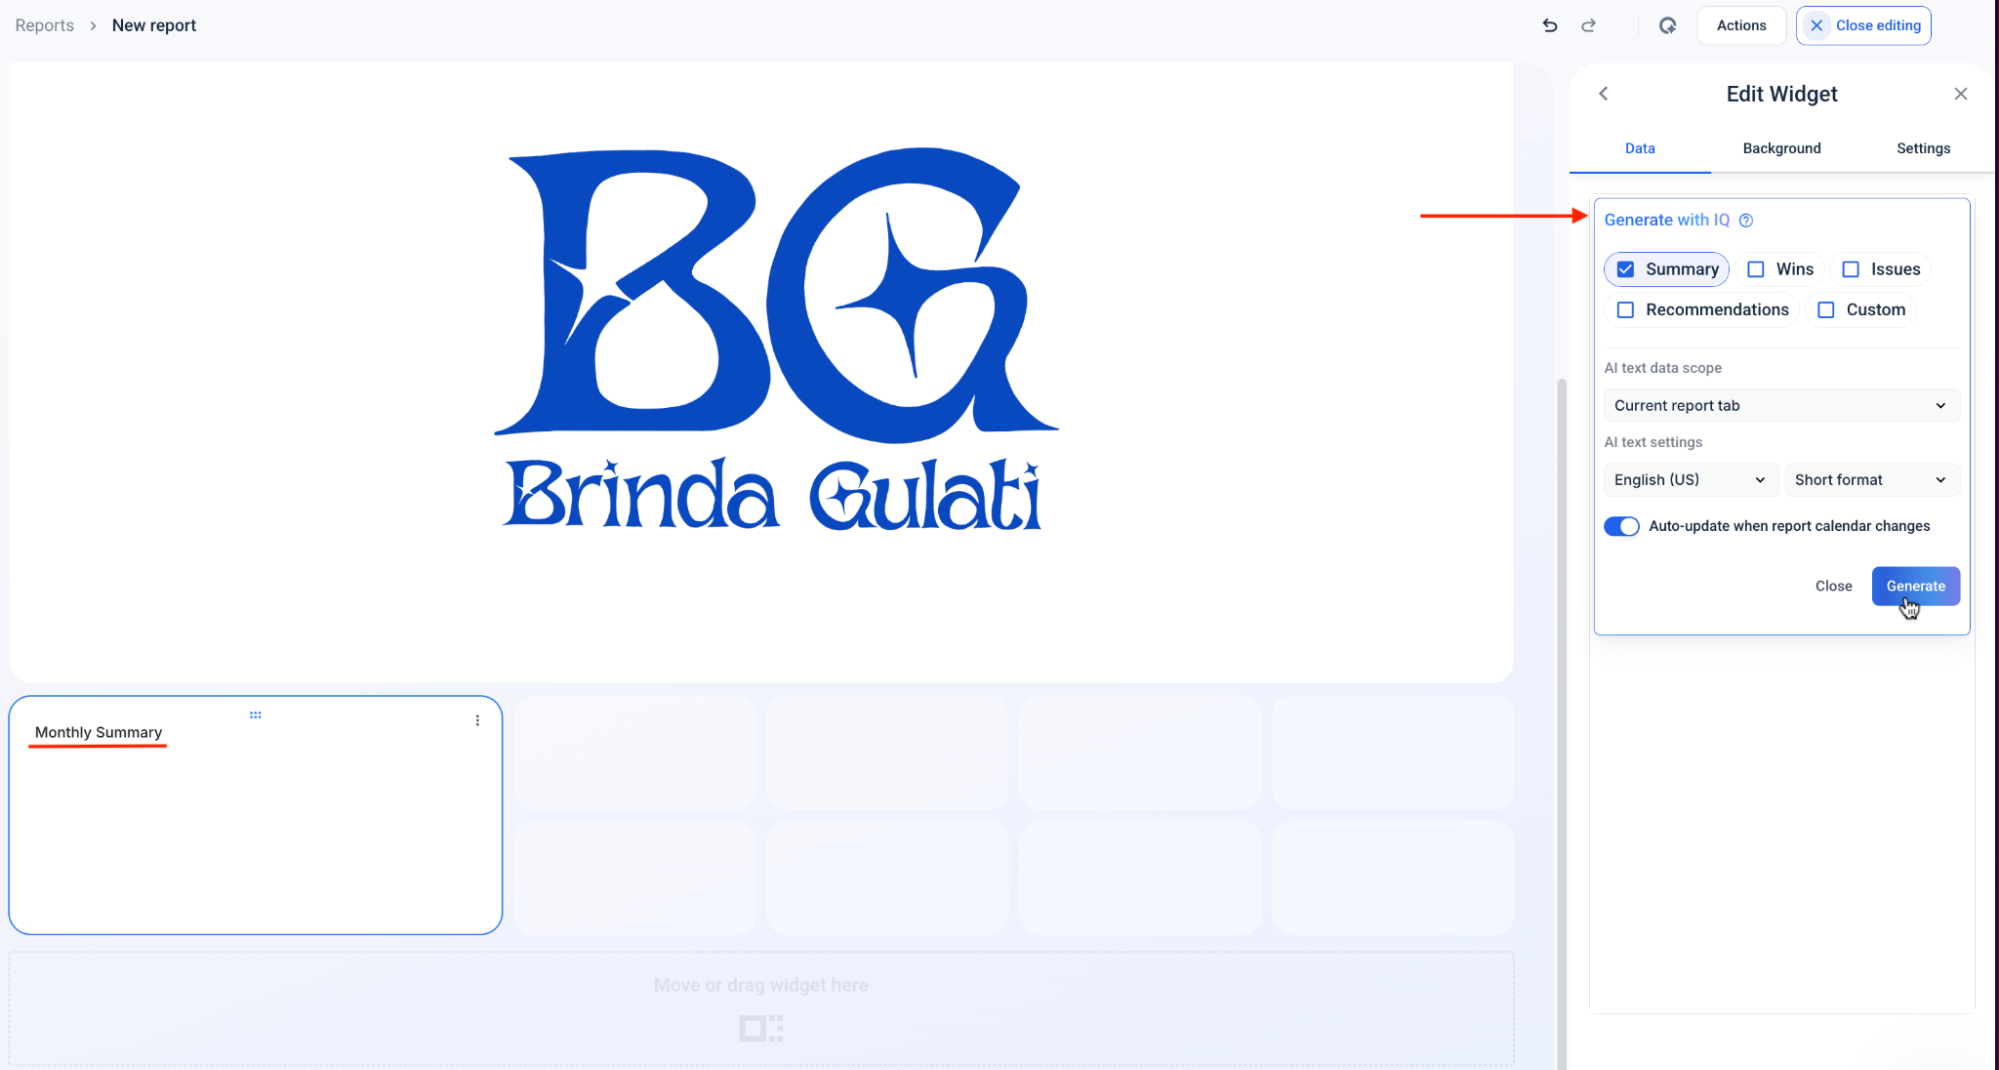
You can also adjust:
- Data scope: Choose to summarize the current report tab or the entire report.
- Language and format: Set your tone to match your brand (short, detailed, or conversational).
- Auto-update toggle: Let IQ refresh summaries automatically when your data changes or the reporting period rolls over.
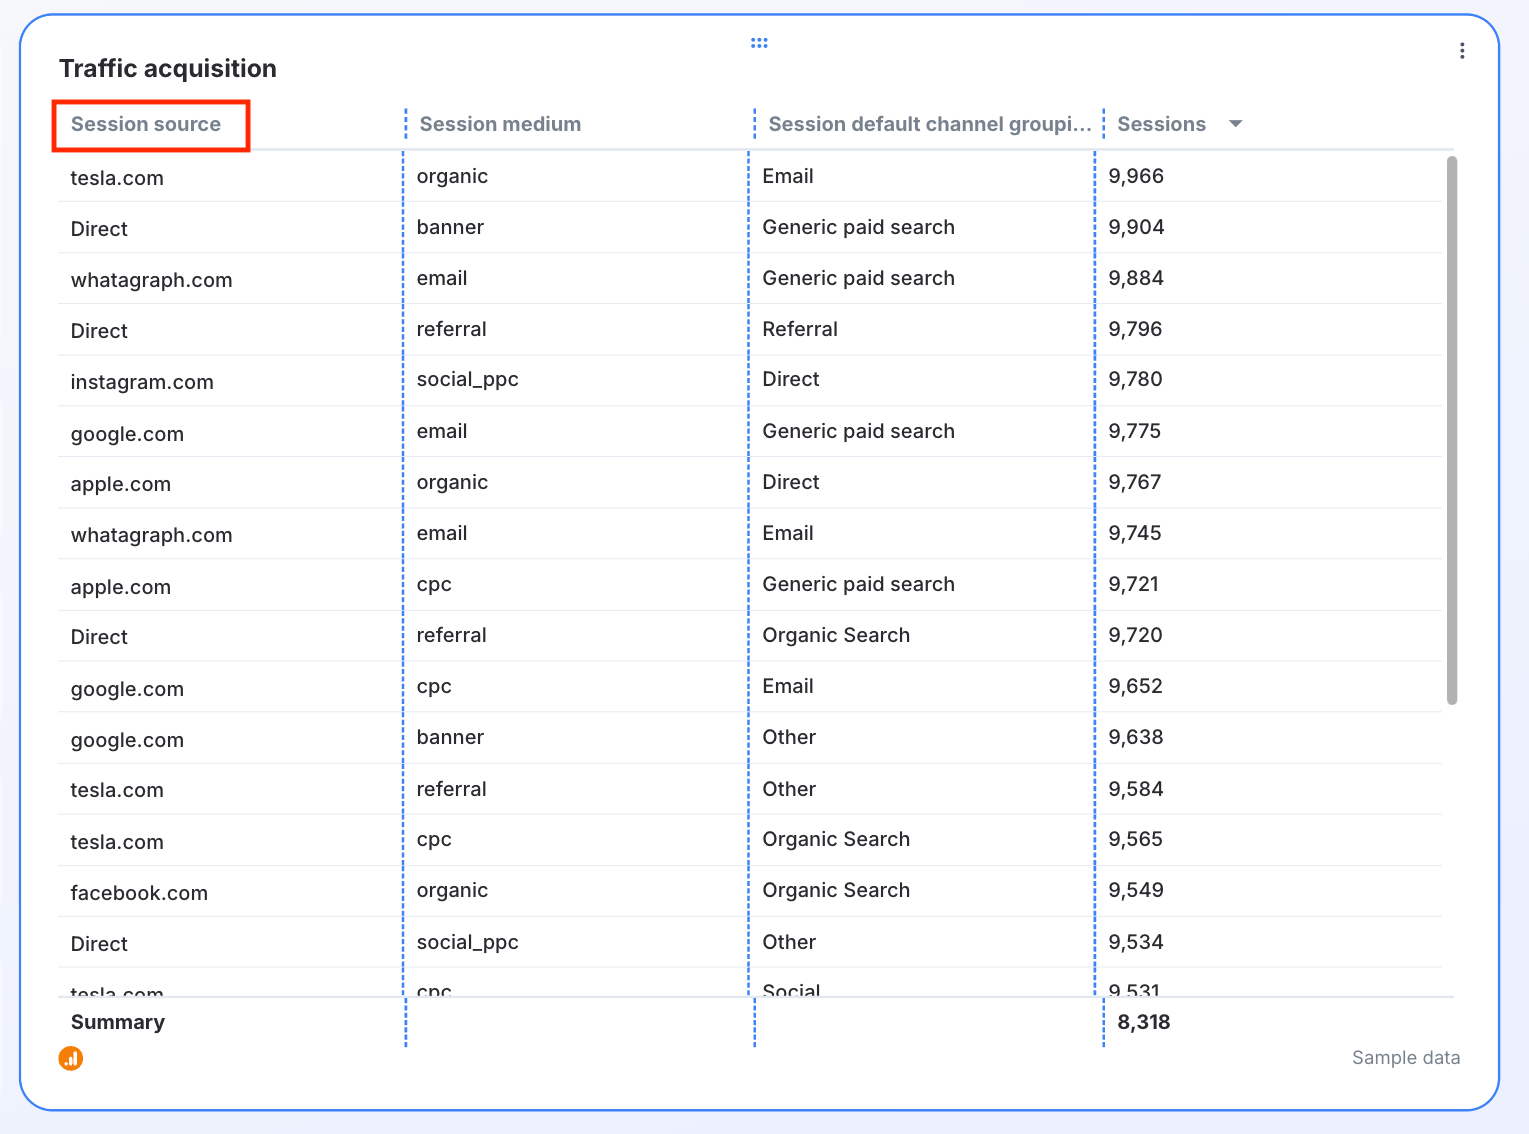
3. Show where your website traffic is coming from
This section displays all the metrics related to different traffic sources, like organic search, direct traffic, referral traffic, and social media. At this point, the report can get overwhelming for some viewers, so make sure to give an explanation of what is presented.
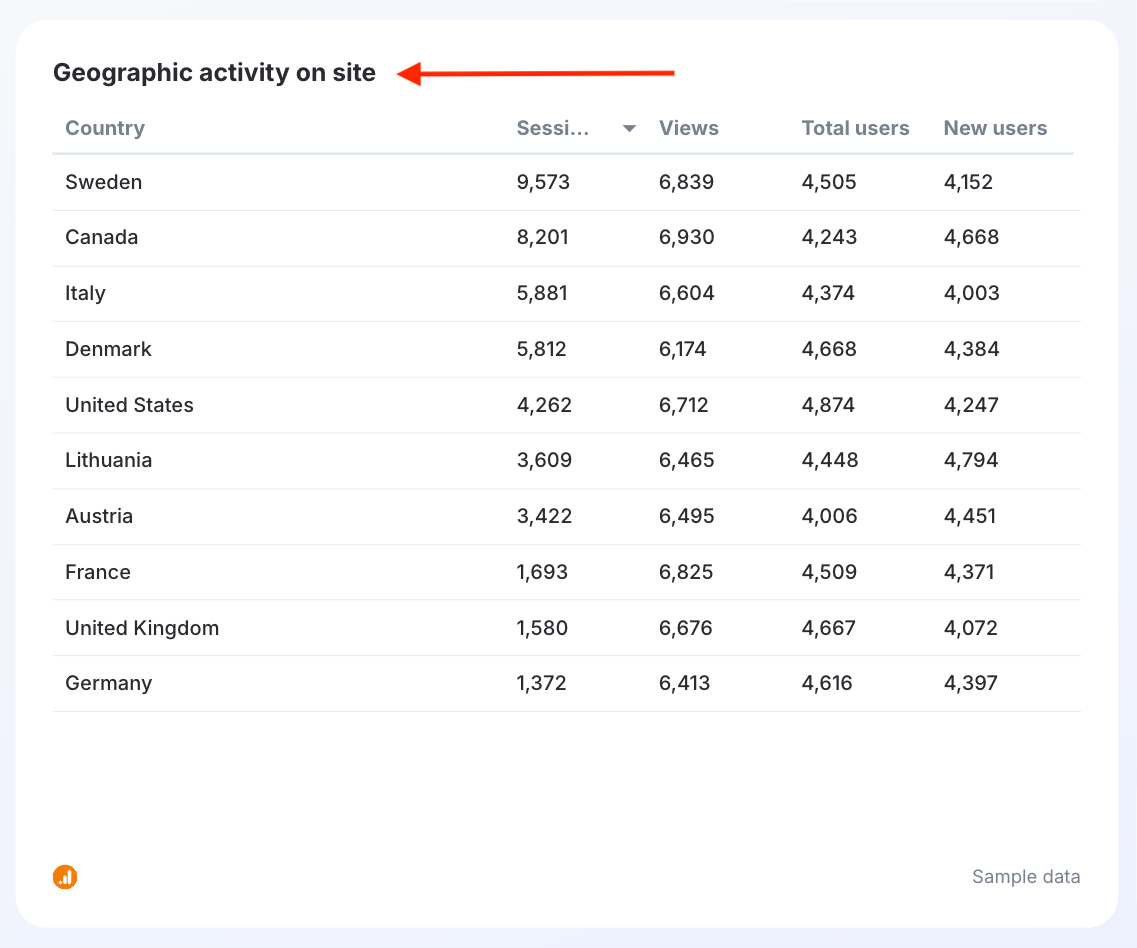
4. Give the location insights
This part of the report gives your client a look into the geography of the website visitors. You can also show how often people from different locations visit the website and how many of them convert.
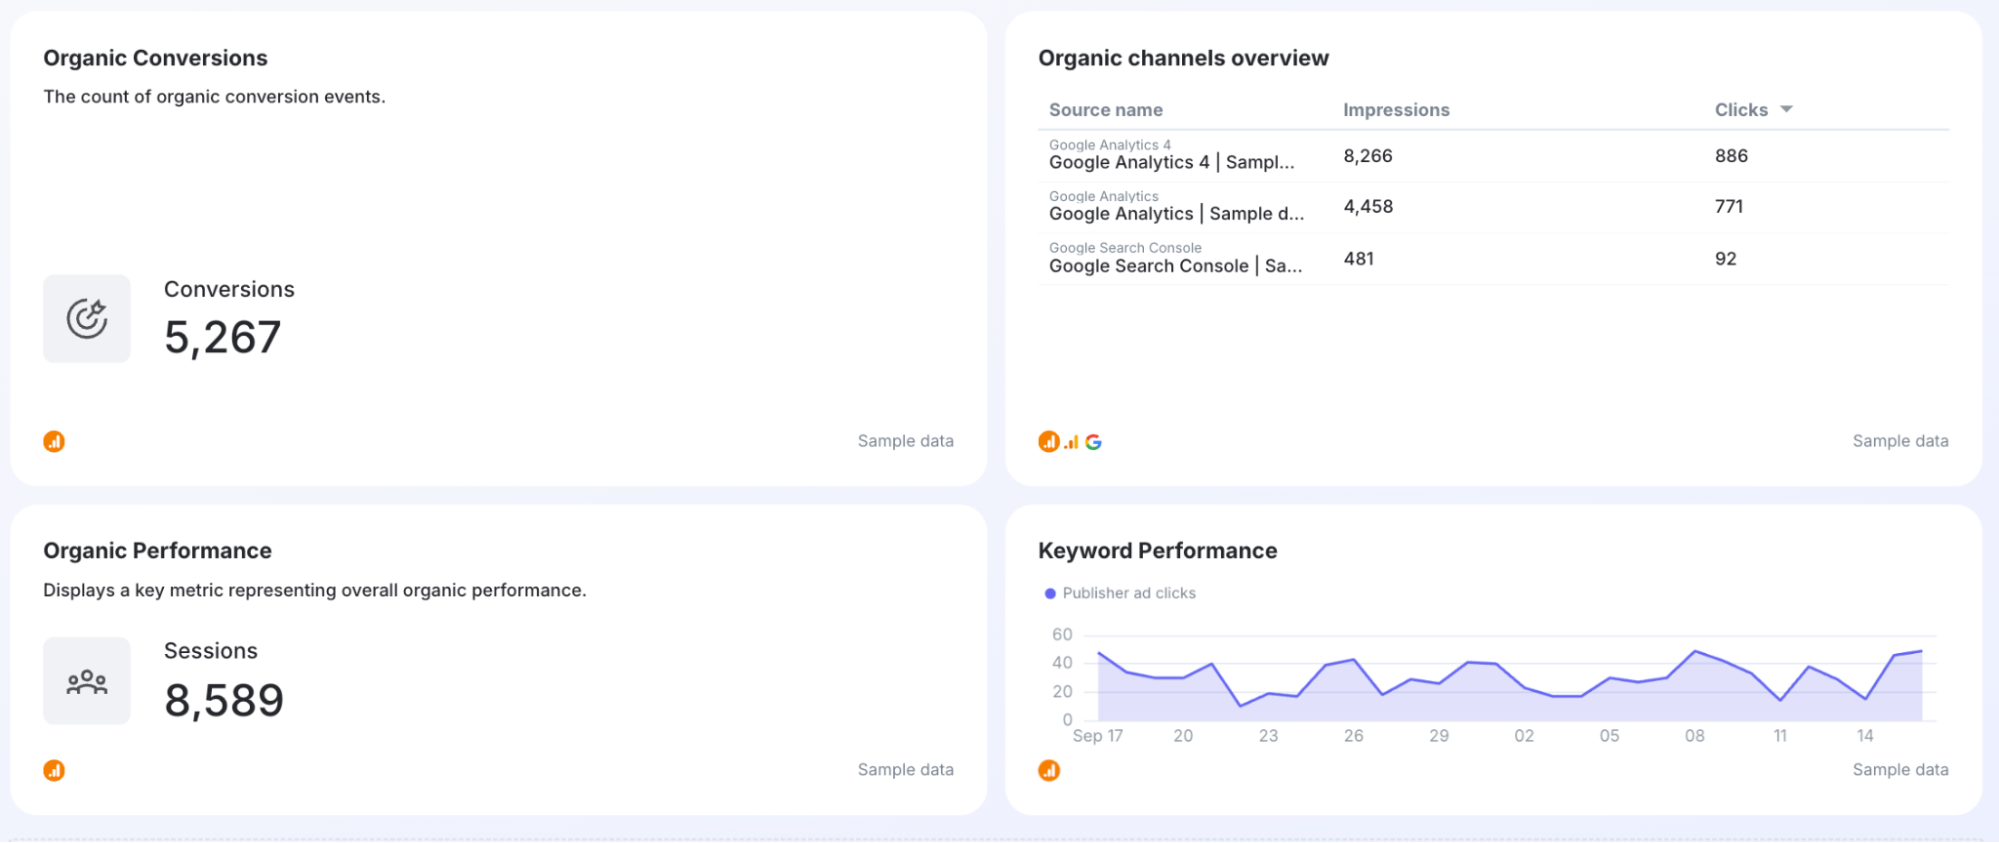
5. Share organic search goals and performance
This is where you present the metrics related to organic traffic, such as which keywords perform the best in terms of conversion. This section can also set grounds for an SEO strategy you drive with your client.
One of the best ways to prove the value of your SEO services is to show them direct conversions from organic traffic.
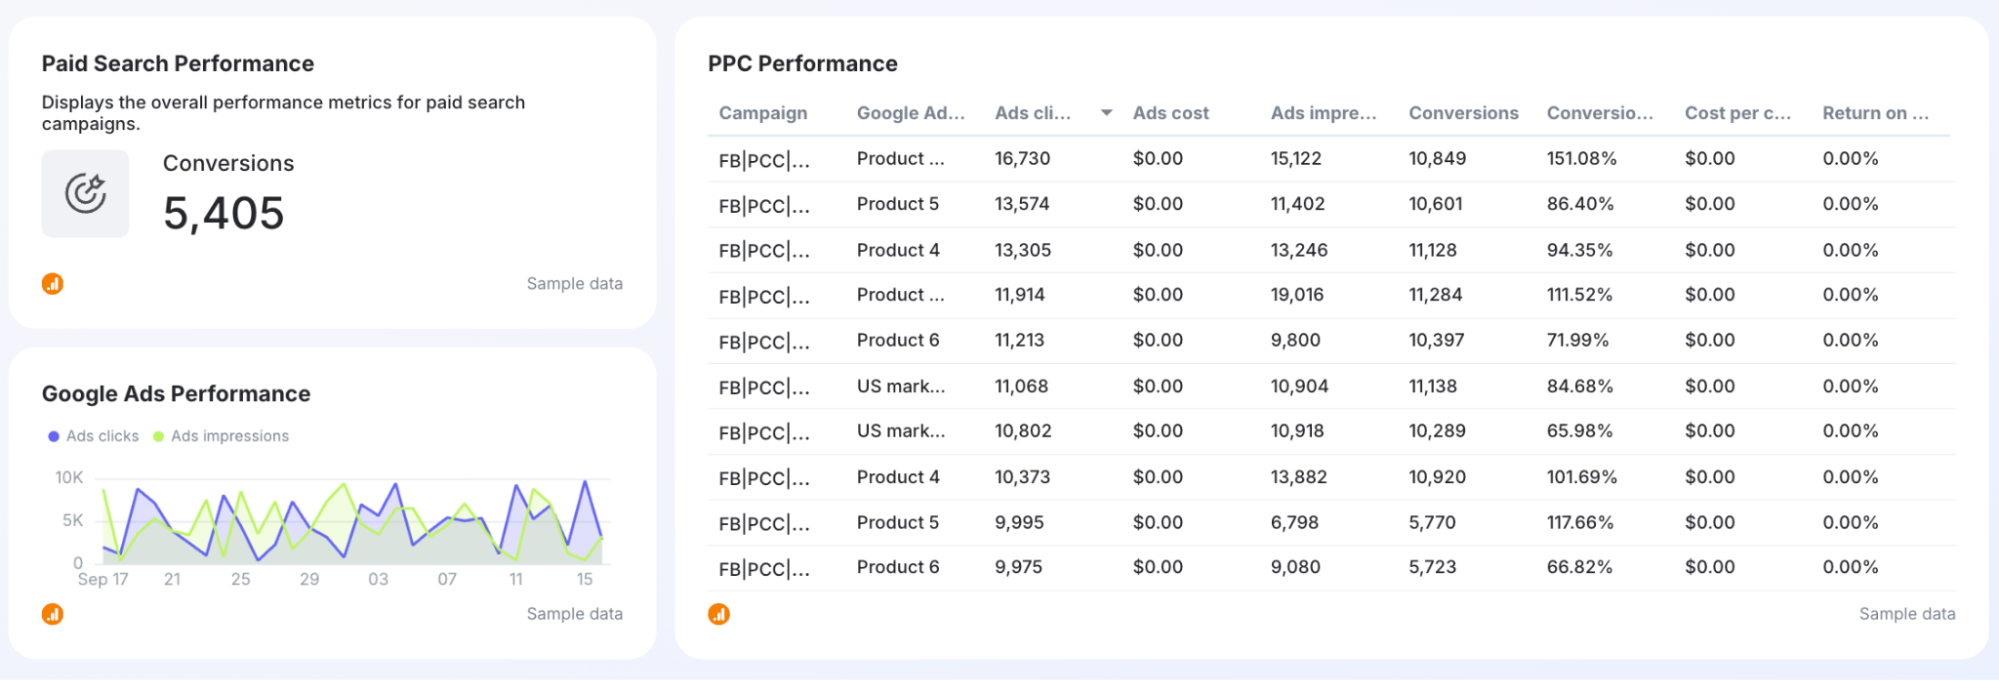
6. Break down the paid search performance
The PPC section gives your client a deeper understanding of your PPC campaign's performance. Show how much traffic each campaign drives and how each campaign impacts the conversion and other goals.
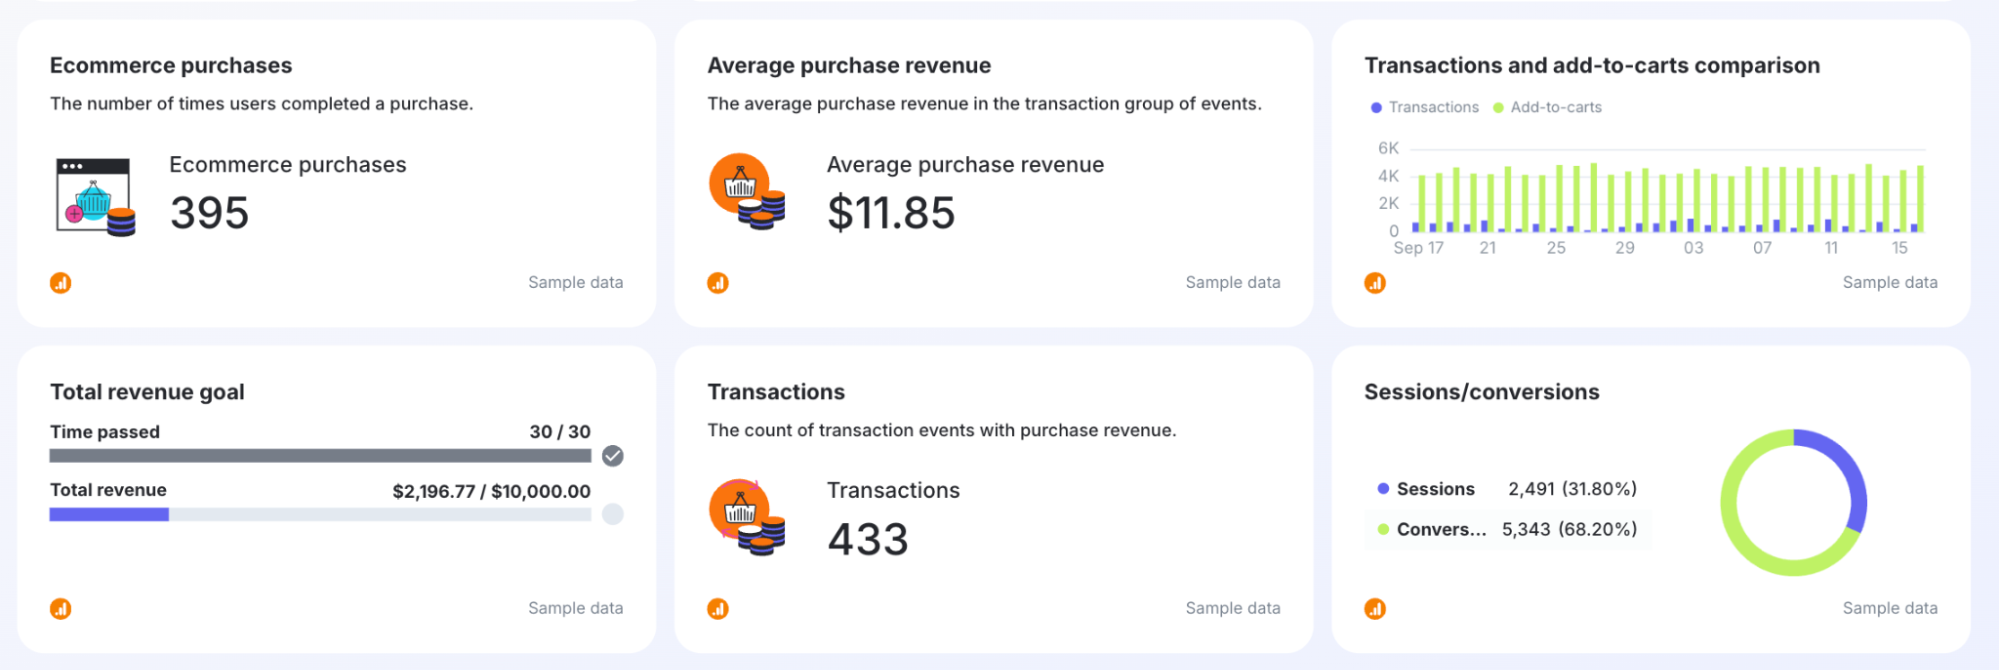
7. Include the eCommerce overview
Present all the relevant metrics for your client’s online store. Tell which products are selling the best and what kind of revenue your client earns from each product. This can be a starting point for discussions about focusing on specific products for future ad campaigns.
Published on Dec 22 2024
WRITTEN BY
Nikola GemesNikola is a content marketer at Whatagraph with extensive writing experience in SaaS and tech niches. With a background in content management apps and composable architectures, it's his job to educate readers about the latest developments in the world of marketing data, data warehousing, headless architectures, and federated content platforms.