KPI Reporting Guide: How to Create KPI Reports [+Free Template]
The best way to get on the same page with your clients? Agree on the KPIs you're going to track and improve. In this article, we explain how to create a KPI report, which KPIs to focus on, and how to track them effectively.

Dec 20 2024●10 min read
At the end of the day, your clients are interested in one thing only — results.
However, in marketing, results don’t come overnight, so you must show them that you’re making progress every step of the way.
Easier said than done — especially if you run several campaigns on different channels, like paid ads, emails, and socials, while at the same time optimizing their content for organic search.
The data that you collect can be overwhelming.
But will clients find any of it valuable? What if you chose the wrong KPIs to track? How to create KPI reports that clients understand?
We asked 12 digital marketers:
- Brandon Rollins, Founder & CEO of Pangea Marketing Agency,
- Joey Randazzo, CEO of Portland SEO Growth Partners,
- Erika Castro, Growth Marketing Manager @ Erika Castro-Morrison,
- Tom Jauncey, CEO @ Nautilus Marketing,
- Stef Oosterik, Quality Manager @ Dtch. Digitals,
- Saul Marquez, CEO @ Outcomes Rocket,
- Cheyenne Skye, Digital Marketing Analyst @ Noise New Media,
- Thomas Hasset, Owner @ TH Results,
- Zach Pittman, Digital Marketing Consultant @ Forrest Property Group,
- Jordan Stevens, Digital Marketing Consultant @ Jordan Stevens,
- Peter Murphy Lewis, CEO & CMO @ Strategic Pete, and
- Kim Strickland, Digital Marketing Specialist, @ Peak Seven
…these questions and compiled their insights in this article.
We’re also going to share a free Google Sheets template for KPI reporting.
Let’s begin.
How to Create a KPI Report: Step-by-Step Guide
You can create a KPI report in two ways:
- Make a copy of this FREE Google Sheet – this is free, but you won't get comprehensive cross-channel insights, and you'll need to spend a lot of time copying and pasting KPI data points.
- Follow the steps below to use Whatagraph – this is easy and fast since you don't need to do any manual work. Whatagraph collects, cleans, and visualizes your data automatically.
Step 1: Connect all Your Data
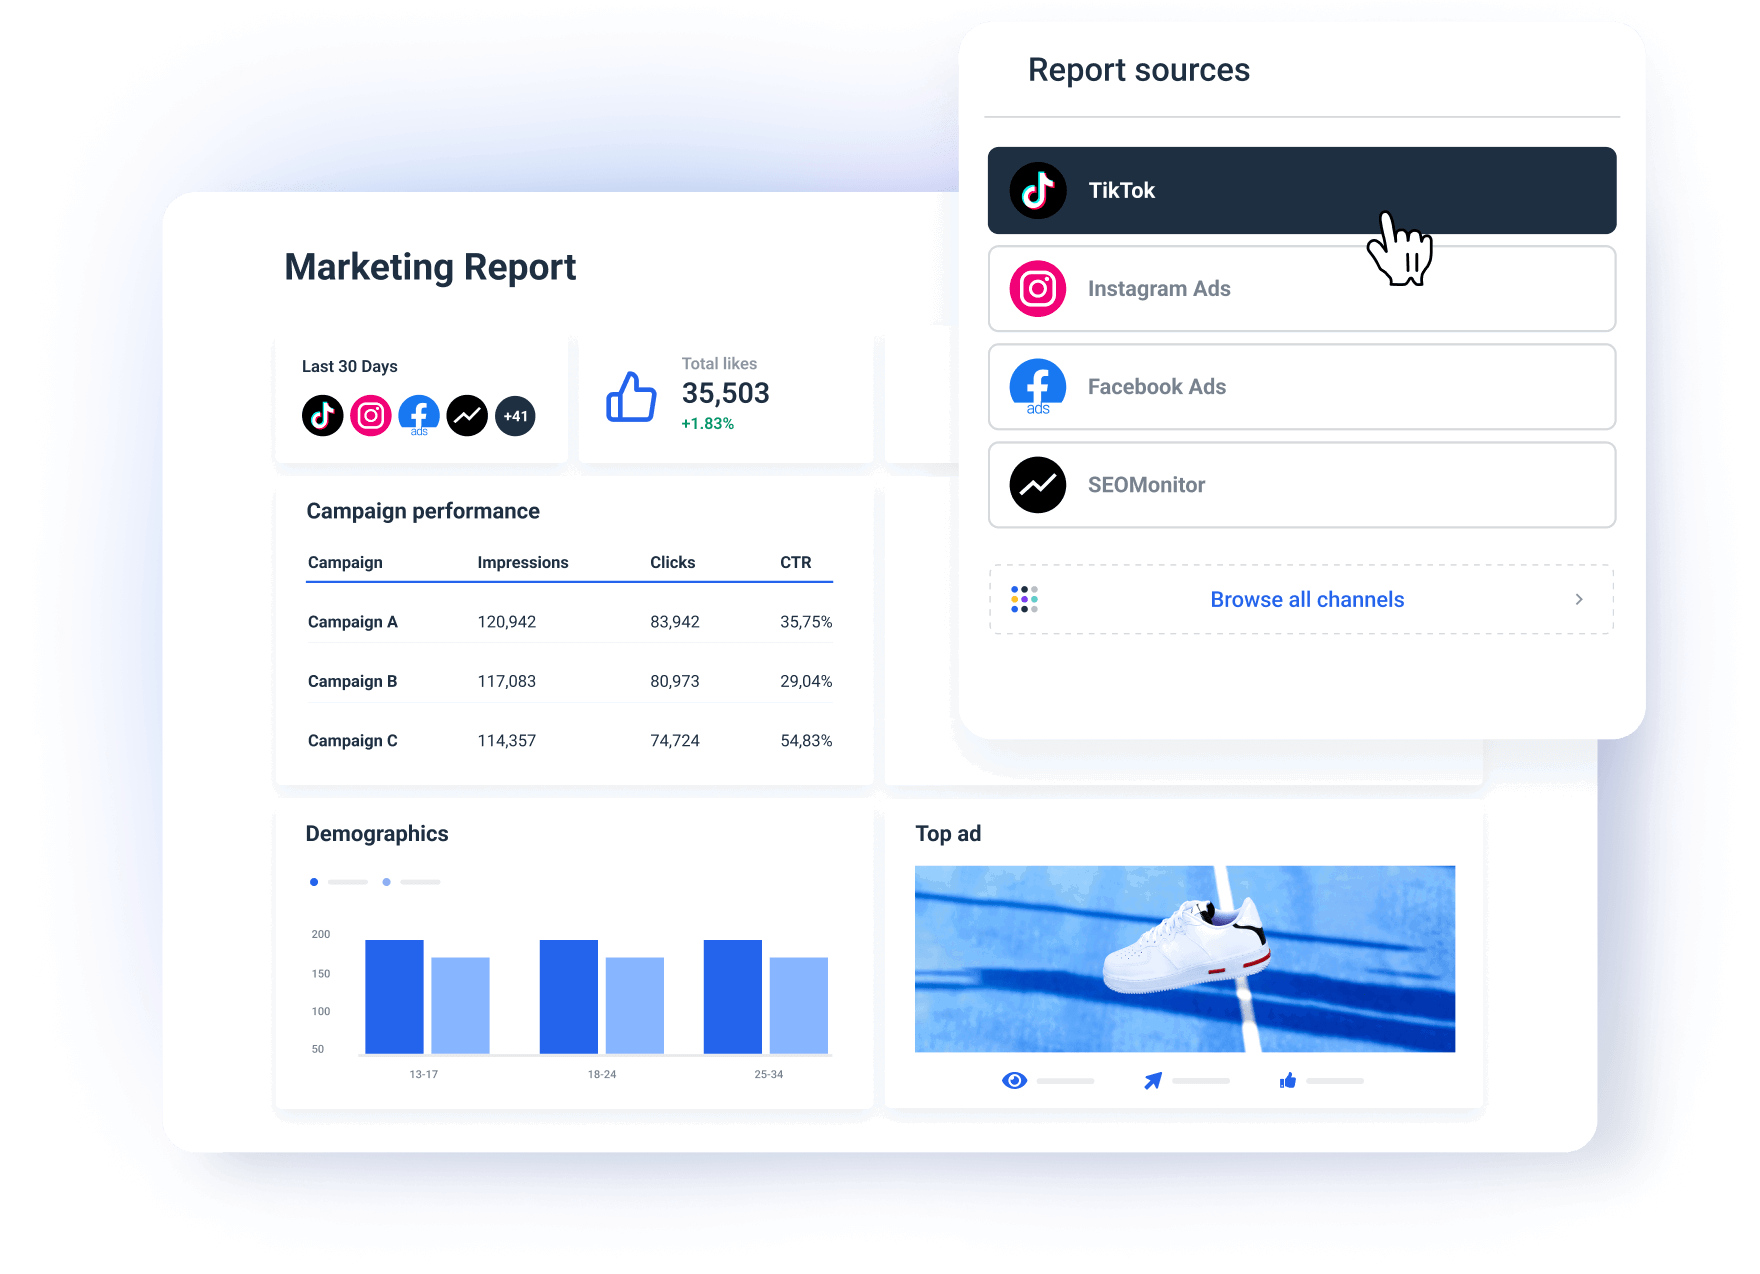
Start by pulling the data from all the marketing apps and platforms you’re using for a specific client.
If you ever tried to connect scattered data with spreadsheets, you know how much time it takes, not to mention the possibility of error.
With Whatagraph, on the other hand, your job is done in just a few clicks.
Why?
Because Whatagraph has fully managed integrations with popular marketing tools.
- Google Analytics 4
- Google Search Console
- Ahrefs
- Semrush
- Facebook Ads
- LinkedIn Ads
- YouTube
- Mailchimp
- CallRail
- Salesforce
- HubSpot
And many others.
These direct integrations are much more reliable than third-party connectors that can slow down your online report or give you inaccurate data as they can refresh at different rates from one another.
With Whatagraph, you can pull data from scattered sources right into your reports without missing a beat.
The integrations are developed and maintained by our dedicated team of engineers, so once you connect your accounts, there’s nothing to update or re-connect on your part.
How to do it:
- Open Whatagraph, go to Data Sources and select the marketing platforms you need.
- Follow the on-screen prompts to provide the necessary credentials and connect each platform.
- Once integrated, Whatagraph will automatically pull in the latest data, updating in real-time.
What do you get:
- A centralized view of all your campaign metrics across platforms and tools.
- Accurate and relevant data in every campaign report you send.
Step 2: Pick a Report Template or Start From Scratch
Creating your KPI reports from scratch gives you the freedom to structure your report just the way you want it.
Still, having a template to start with saves a lot of time.
Especially if you need to report to several clients or stakeholders regularly.
Whatagraph offers pre-made KPI reporting templates that you can customize for each client.
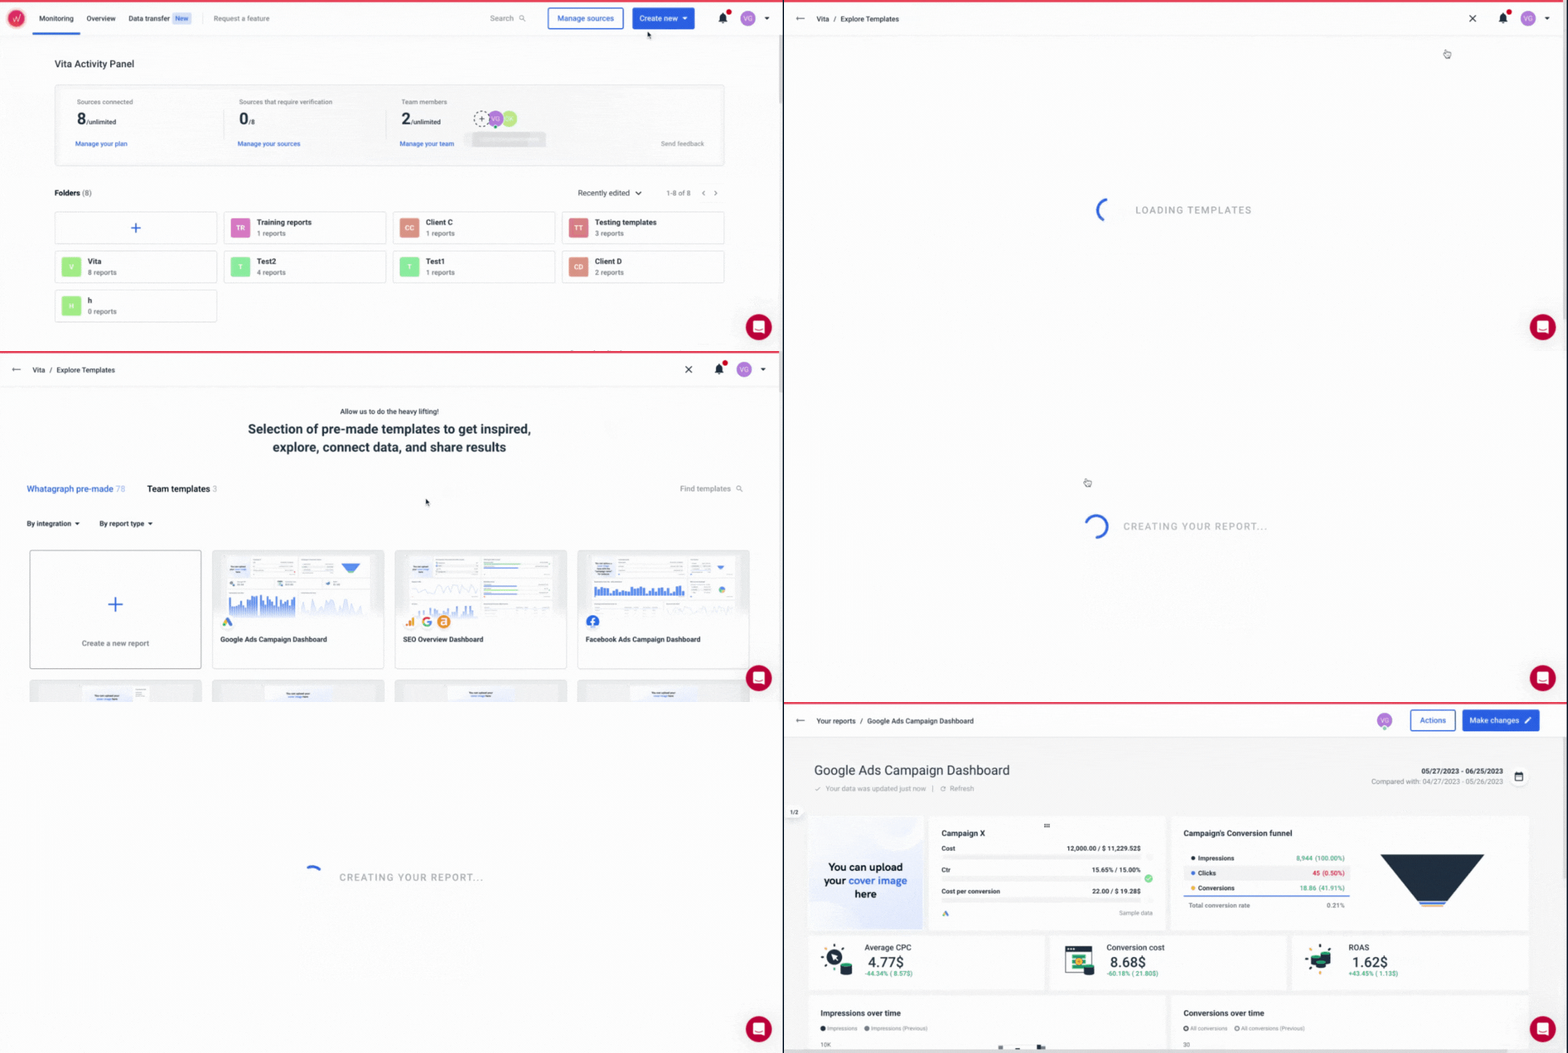
Pick a template as a starting point, and pick the metrics and sections that best present your campaign’s results.
How to do it:
- Go to the Templates section in Whatagraph.
- Choose a template that aligns with the specific KPIs you want to display (e.g., audience engagement, cost per lead, conversions).
- Alternatively, select Create New Report to build a report from scratch, choosing only the widgets and metrics that you need.
What you'll get:
- Faster report building for multiple campaigns and stakeholders.
- You can tailor each report for a specific campaign by highlighting the most relevant data.
Step 3: Customize the Report for a Specific Client
On Whatagraph, you can quickly customize any KPI report or dashboard template to the specifications given. Once you find a template that is the closest match to your KPIs, you can start tailoring it.
The first thing you want to make sure here is that you're reporting the KPIs that your client wants to see.
And where do you get this info? Right at the beginning, from the client onboarding calls and their specific goals.
Cheyenne Skye, Digital Marketing Analyst at Noise New Media, says that is one of the first questions whenever they’re onboarding a client:
There's a ton of metrics that we as marketers look at that would make no sense and probably overwhelm the customers. So we always try to be very specific about what is the client’s goal and then just show the metrics for that.
Let’s just make sure not to miss any steps here:
✅ Connect the relevant data sources: You can load a template with just one source connected, but now you need to add other sources that hold your campaign data.
✅ Customize metrics and widgets: Check out the metric already included in the template and decide if you need to remove some of them, so the stakeholders can really focus just on the important ones.
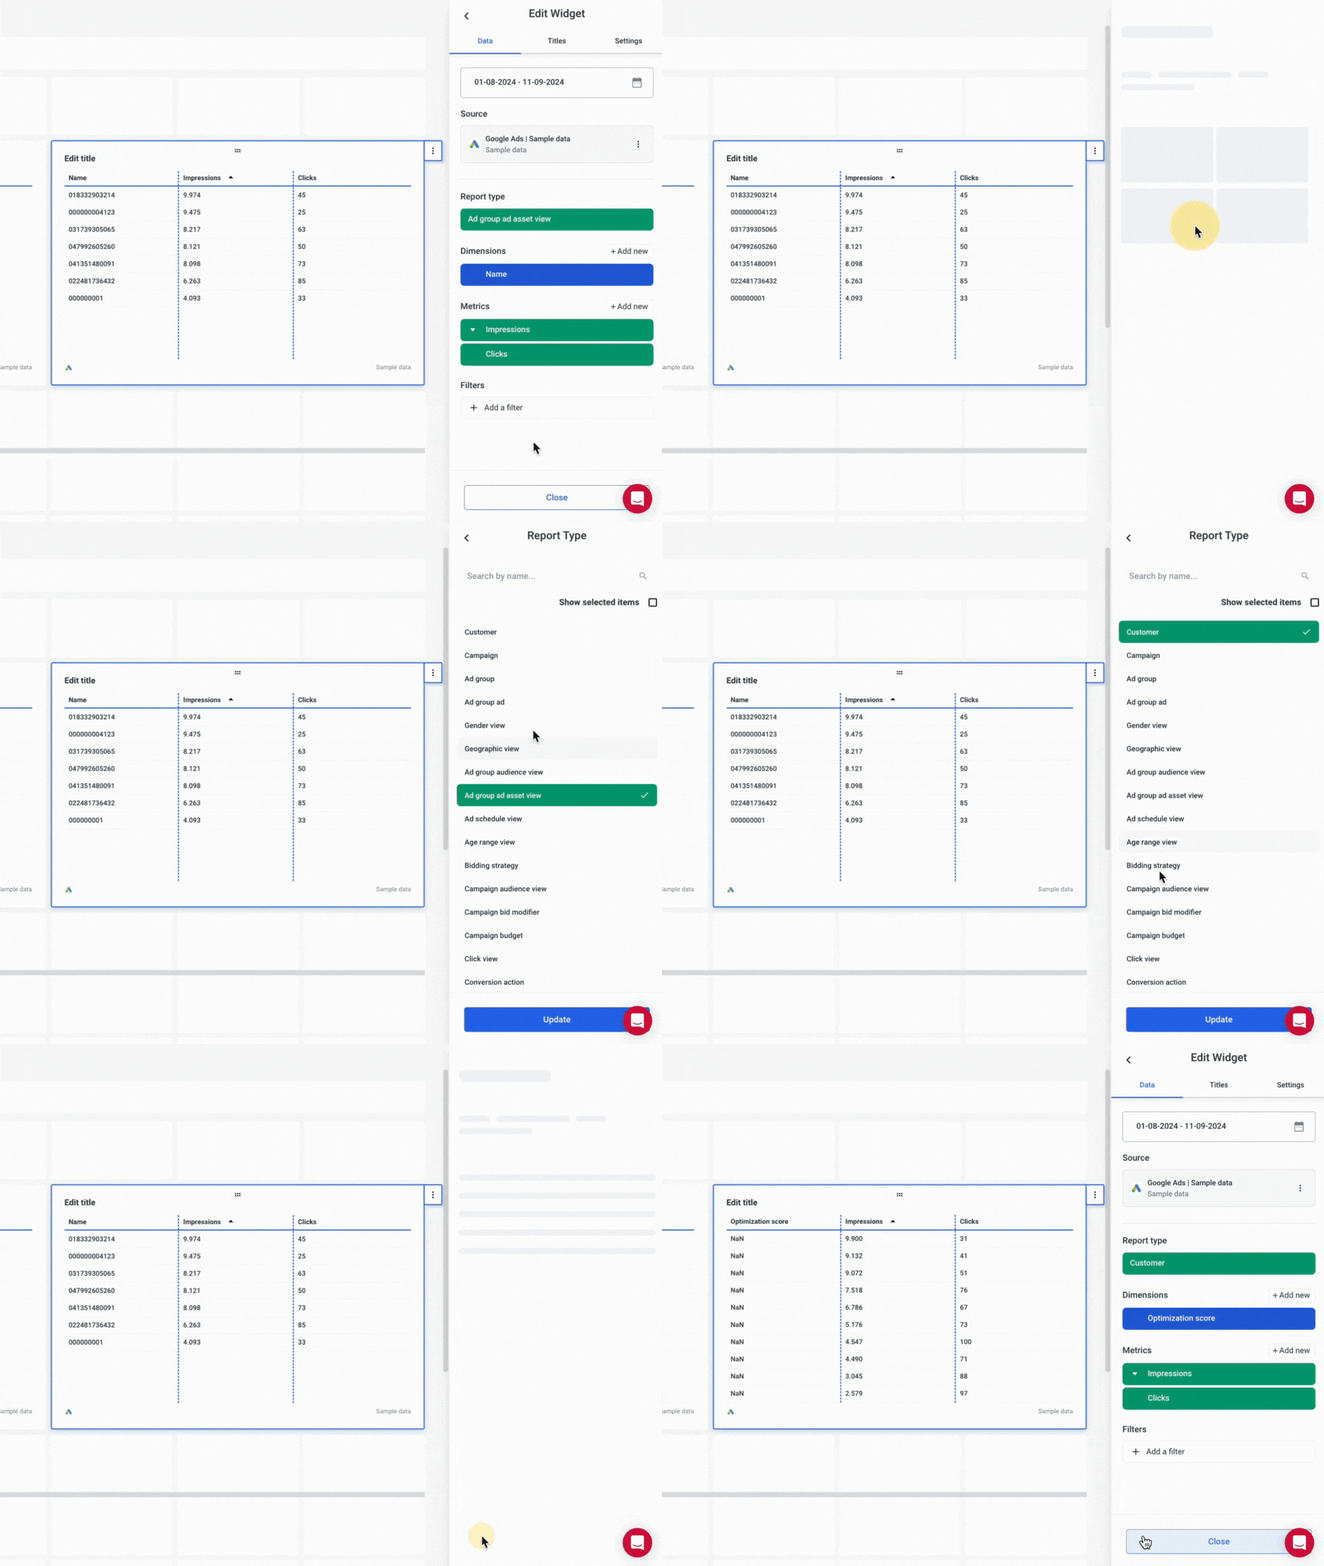
For example, if you’re reporting on a TikTok campaign, add Followers Over Time and Likes by Campaign. For a PPC campaign, highlight the ROAS and Keyword Performance.
Peter Murphy Lewis, CEO & CMO at Strategic Pete adds:
I create a custom layer that tracks key performance indicators specific to each client’s goals. For example, for eCommerce clients, we measure customer lifetime value alongside conversion metrics to showcase long-term impact rather than short-term gains.
On Whatagraph, you can go one step further and create custom metrics, such as Cost per Lead from Paid or Leads from Organic.
Also, it's not rare that the metrics you want to use depend on the client's industry.
Saul Marquez, CEO of Outcomes Rocket explains:
Our healthcare clients often focus on metrics that show patient engagement, lead quality, and brand trust. We make sure that patient engagement is front and center because this is a key indicator of marketing success.
✅ Choose the appropriate visuals: Whatagraph offers different chart options, such as line charts, bar graphs, funnels, and pie charts. If your client prefers a bar chart to a pie chart for a specific metric — nothing easier. Pick the bar chart widget and select the metrics and dimensions you want to see.
(Hey, did you know you can also create custom charts and save them as template widgets?)
✅ Arrange the widgets for easy interpretation: Always put the most critical KPIs, like Cost per Lead or Campaign Budget, at the top of your report, right next to the Campaign Goals widget.
Jordan Stevens, Digital Marketing Consultant at Jordan Stevens, says the structure of widgets should always follow the story you want to tell:
What is the main point you want to get across? The content of the report should flow from there. One flow that's useful for a lot of digital marketing projects is to follow your ABCs: Acquisition (how did the traffic arrive), Behaviour (what did the traffic do on your site), and Conversions (did the traffic convert to a lead or sale).
The best practice is to group related metrics together, such as engagement metrics (bounce rate, avg. session duration, etc.) and on-page metrics (pageviews, time on site, etc.)
Before we continue, let’s briefly say a few things about Whatagraph’s proprietary Goal widget.
You guessed it right: Whatagraph has developed a special Goals widget that is great for tracking progress toward the campaign targets.
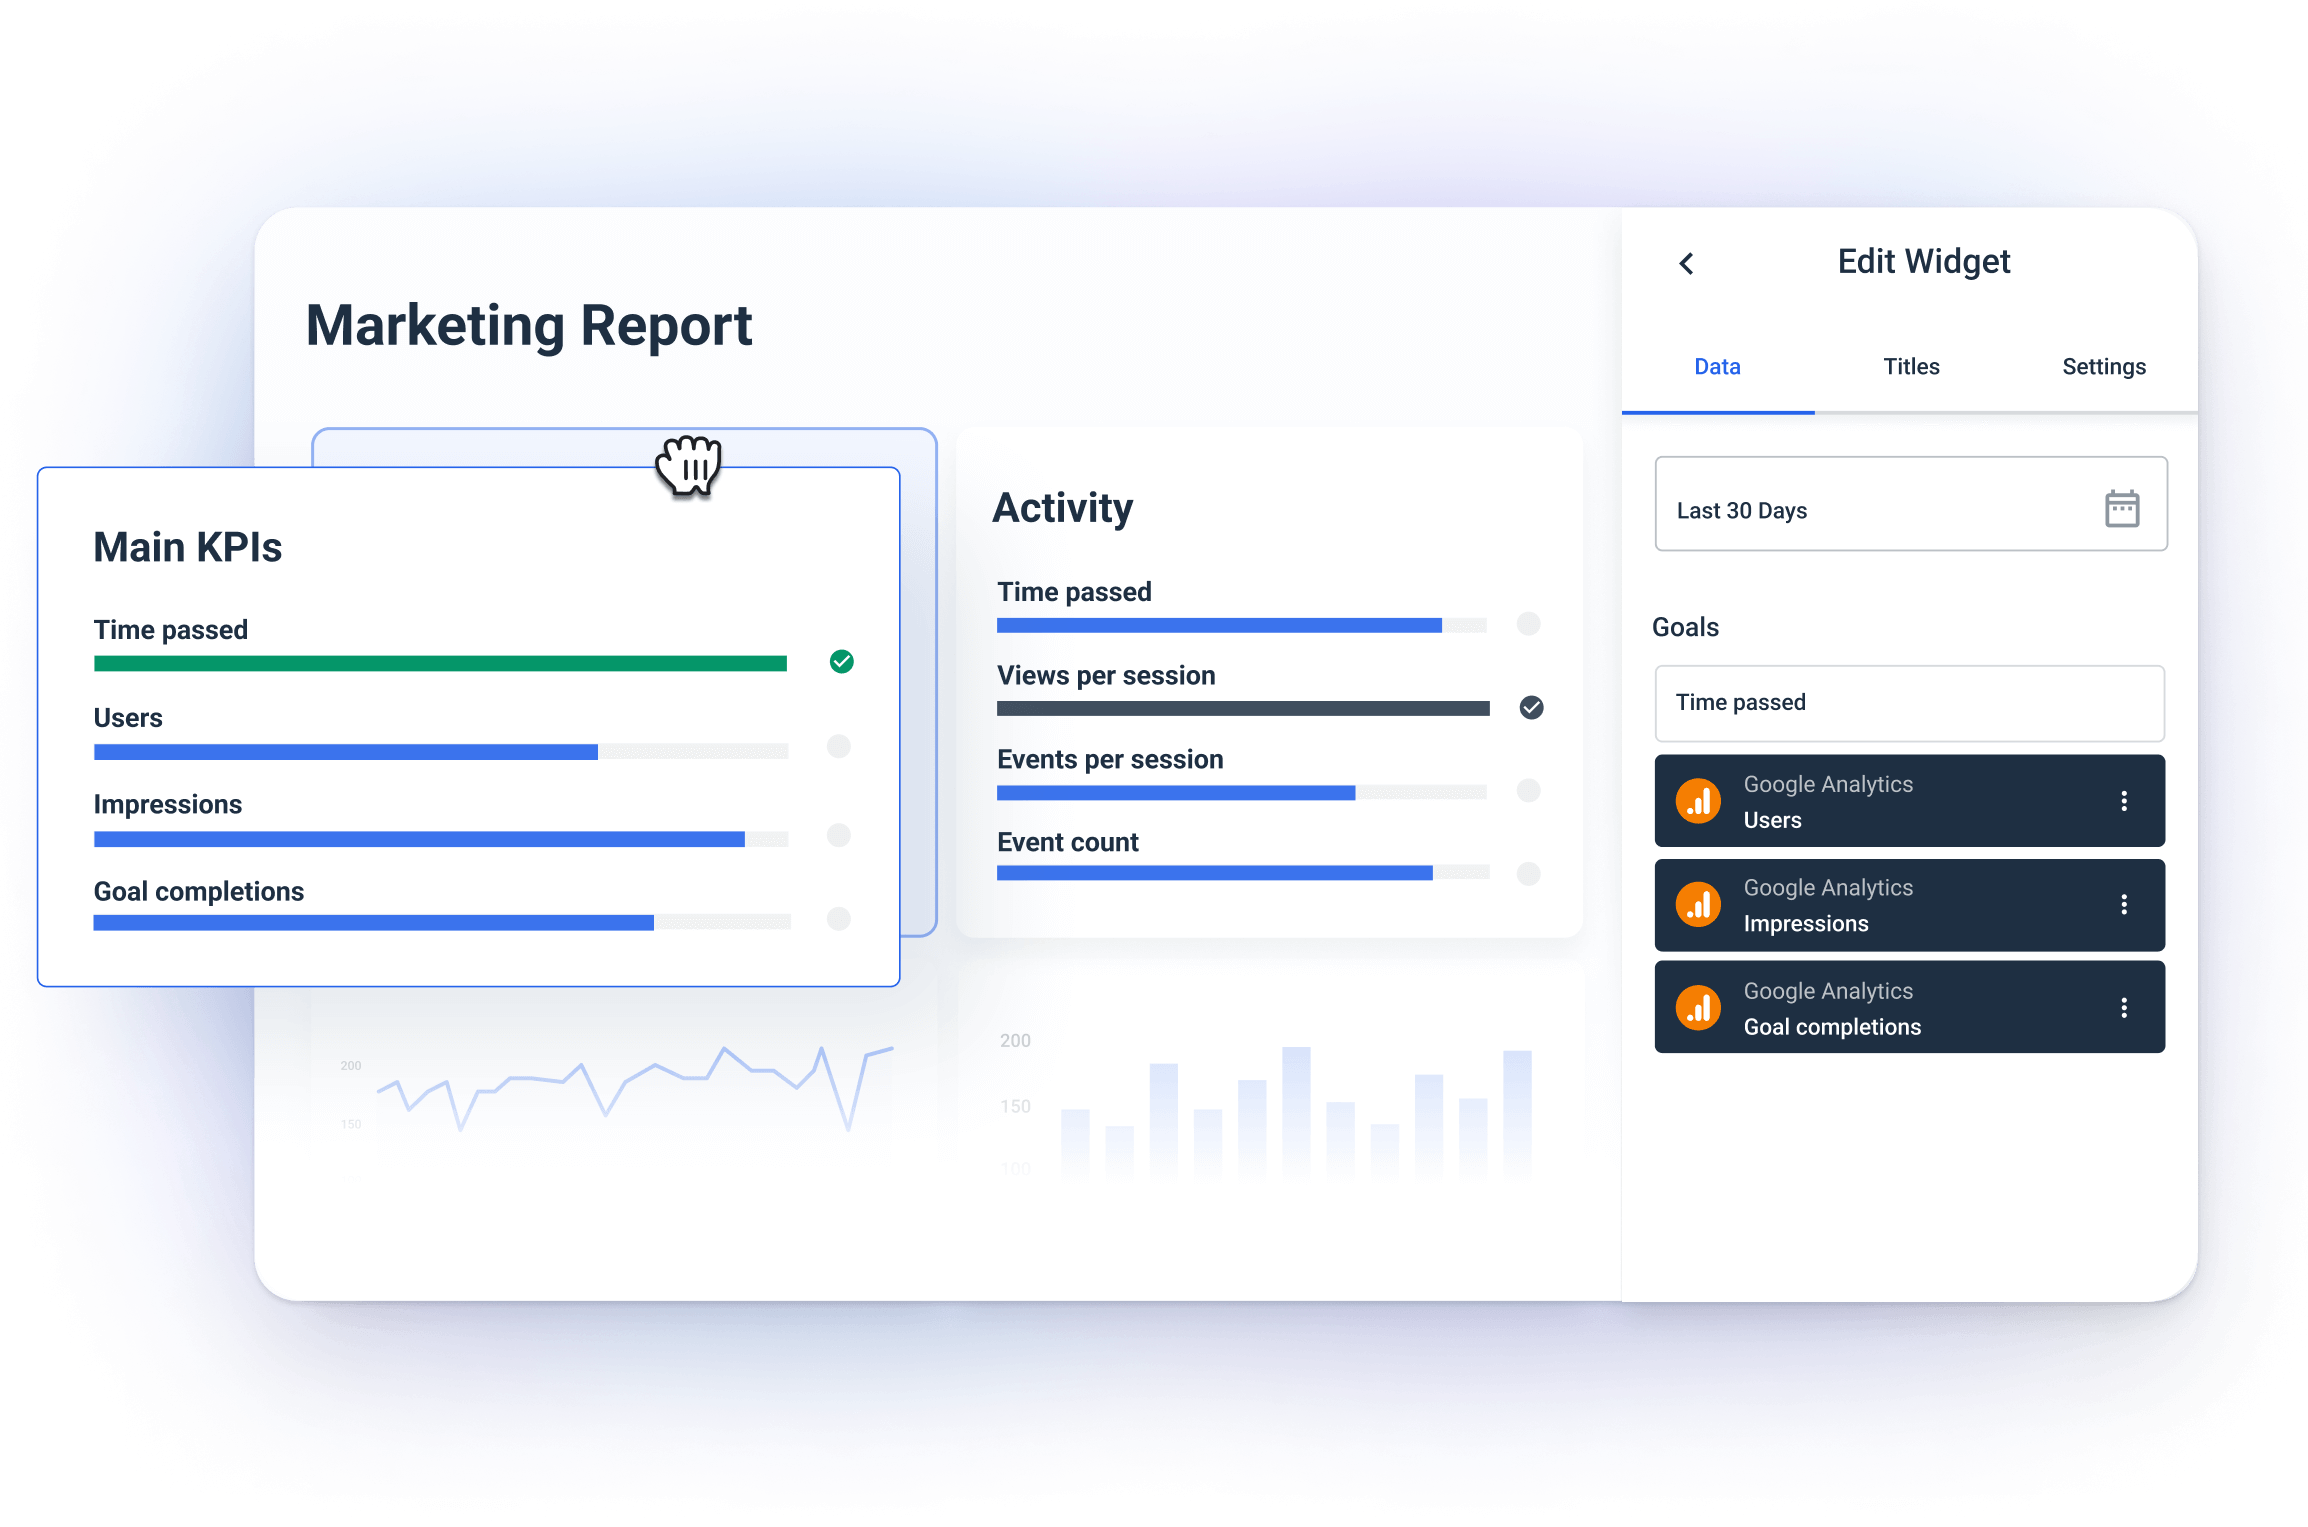
For example, you can set up the goal to reach 1,000 conversions and track how far you're from achieving that.
The widget has a visual progress bar that highlights how your digital marketing efforts come up against set business objectives.
You can create goals on any metrics to break up the monthly marketing performance targets into day-to-day action items.
Step 4. Organize Data to Uncover Hidden Insights
Let’s quickly sum up what we've done so far:
- Connect scattered sources - Done ✅
- Pick a template - Done ✅
- Tweak it for your campaign - Done ✅
The problem is that actionable insights are still hidden under a heap of data.
For Thomas Hasset, owner of TH Results, data overload is one of the top challenges:
Every platform speaks a different language, so finding the story within all that noise takes patience. On top of that, clients often want a single “magic number” that’ll tell them everything, and, as we know, there’s no one metric that does it all.
Now you need to get those insights and truly pinpoint the high and low points of your campaign so you can optimize it on the go.
In other words, you need to Organize your data.
But don’t worry, no need to involve data engineers.
In Whatagraph, you can organize your scattered data so you can get insights in seconds.
How? In several ways.
- Custom metrics: You can unify and change names of different metrics permanently in your report or create a new metric using a simple formula.
- Custom dimensions: You can also unify names of different cross-channel dimensions and group data points from different sources.
- Data blending: Great for combining different sources together into one unified data source for getting quicker insights and keeping your dashboard neat.
If you ever used two tools – one to connect and prepare your data and one to visualize it – you know what a hassle it is to switch between two workspaces all the time.
In Whatagraph, everything happens in one workspace. You connect, organize, and visualize data inside your report, and you can see the changes immediately.
Thanks to recently launched Performance Monitoring, you can get actionable insights from your data even faster.
You can:
- Group 100s of scattered data sources into unified Source Groups in seconds.
- Add custom tags to your data and filter it by client, business type, location, Account Manager, etc.
- Visualize your key metrics in one view and easily spot performance trends.
In our recent webinar “Scale Smarter: How Leading Agencies Win with Data Insights”, Kim Strickland, Digital Marketing Specialist at Peak Seven, reveals how Performance Monitoring helped Peak Seven aggregate their scattered data:
We work with a lot of franchises, their corporate locations, and then each individual location. The Source Groups have helped us pull all this data together, see all locations, aggregate all of that data not just into a top-down view, but also an individual location view. This made it so much easier to not just communicate with clients but also internally, in finding trends and capitalizing on them.
Skye, on the other hand, shared that our custom tags are an invaluable feature for an agency that markets events of different sizes across the country:
Depending on the size of our events, average results vary quite a bit. And also the geographic location of our clients, because we primarily work with fairs and rodeos. The ability to add tags to specific locations where we can get a performance overview and an average of what a specific location does, and then what a certain size of event does, has been massive.
For more valuable first-hand tips on data insights, check out the whole webinar:
Step 5: White-Label the Report with Client Branding
In Whatagraph, you can personalize your reports with your client’s brand colors, logo, and custom headings.
Alternatively, you can apply your agency’s branding so every report you send looks like a part of your agency’s website.
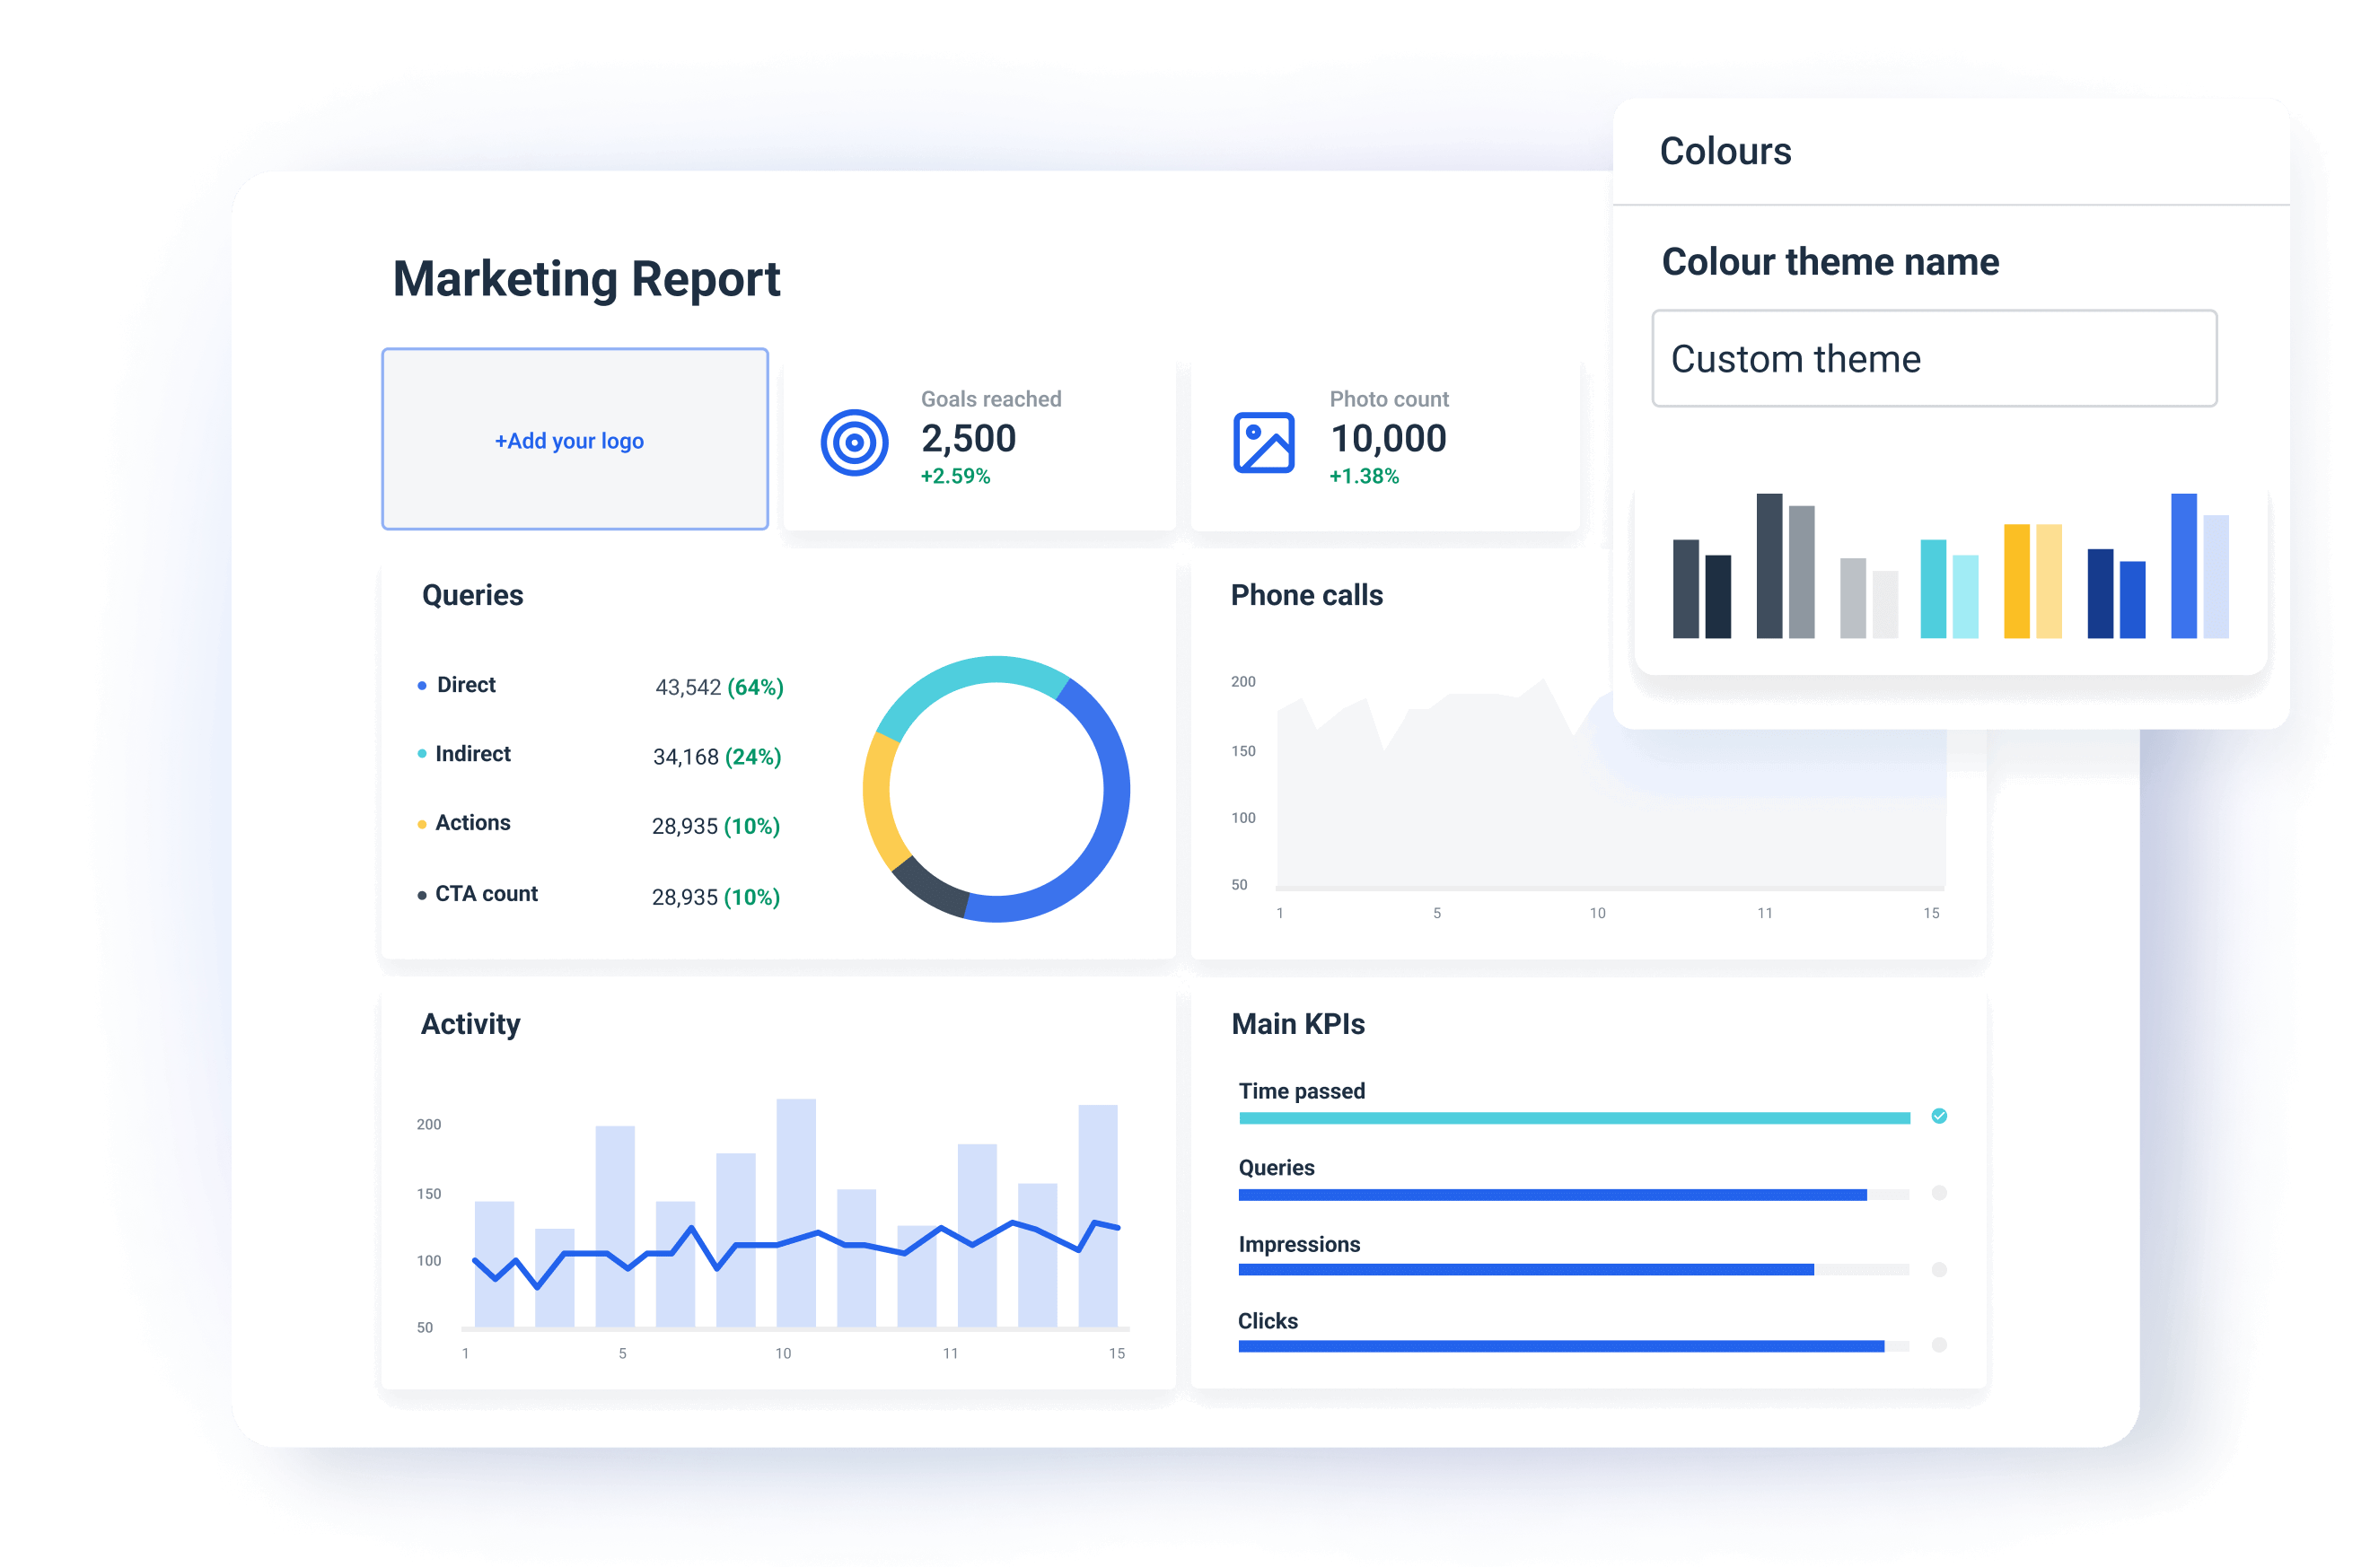
This means your clients will immediately recognize your campaign performance report as a part of your brand. You can create a global theme for your agency or create multiple themes on the report and even at the widget level.
You can also share your white label reports on a custom domain and “cut all ties” to Whatagraph as the software provider. The client will be no smarter than to believe you custom-built the whole thing yourself.
Step 6. Automate How You Share Your Report
The last step is to share your KPI reports with your clients or stakeholders.
You can do this on Whatagraph in three main ways:
- Share password-protected links to a live report.
- Send reports as automated emails on a regular timetable (e.g. every week, month, …)
- Export as Excel or CSV files.
(Psst. Now you can export data from Whatagraph to Looker Studio too.)
How to Make KPI Reports Engaging for Clients – According to Experts
There’s little use in a report if your client doesn’t find it useful or doesn’t see the value of your work. Here’s how to make your reports impactful:
1. White-Label Your Reports
White-labelling works for you in more ways than you may realize.
✅ A white-labelled report communicates that you really took the effort to create it instead of using a generic third-party tool (that's what clients think).
✅ You can use your agency logo on every report you send to boost your brand awareness. In combination with your good work, clients will automatically relate your agency's colors with efficiency and trust.
✅ Use client's branding and make them feel appreciated.
✅ Confidentiality. When you remove the third-party branding, clients feel reassured that their data is handled securely in your ecosystem.
White labelling is also important if you're after bigger clients.
Let's take the example of Dtch. Digitals, a full-service agency based in the Netherlands that made rebranding—down to the last report—a key part of their growth strategy.
In 2023, this agency grew rapidly, expanding to over 50 employees and 250 clients.
Along the way, they realized their identity and operations needed to evolve, too.
As Stef Oosterik, their Quality Manager, explained, they needed to level up their reporting tech stack to meet the demands of growing team and clients.
We wanted to make reporting more professional for our clients and ensure it aligned with our rebranding.
While with their previous reporting software, they could only upload a logo, with Whatagraph, Dtch. Digitals could fully white-label the dashboards and reports to reflect their new branding.
The look and feel of the reports is way more professional compared to before, Stef noted.
With their old reporting tool, the visuals were static and looked outdated. With Whatagraph, the agency now has sleek, professional reports that match their new identity.
Whatagraph's live dashboards, cross-channel insights, and overall intuitive design also made it easier for the Dtch. Digitals team to communicate the results of their marketing campaigns with clients.
Whatagraph’s reports are now our foundation for discussing results with clients. And thanks to attractive visuals, clients can see the professionality behind our agency, Stef concluded.
In fact, since adopting Whatagraph, Dtch. Digitals have seen a 50% decrease in churn.
2. Highlight the Most Important Metrics
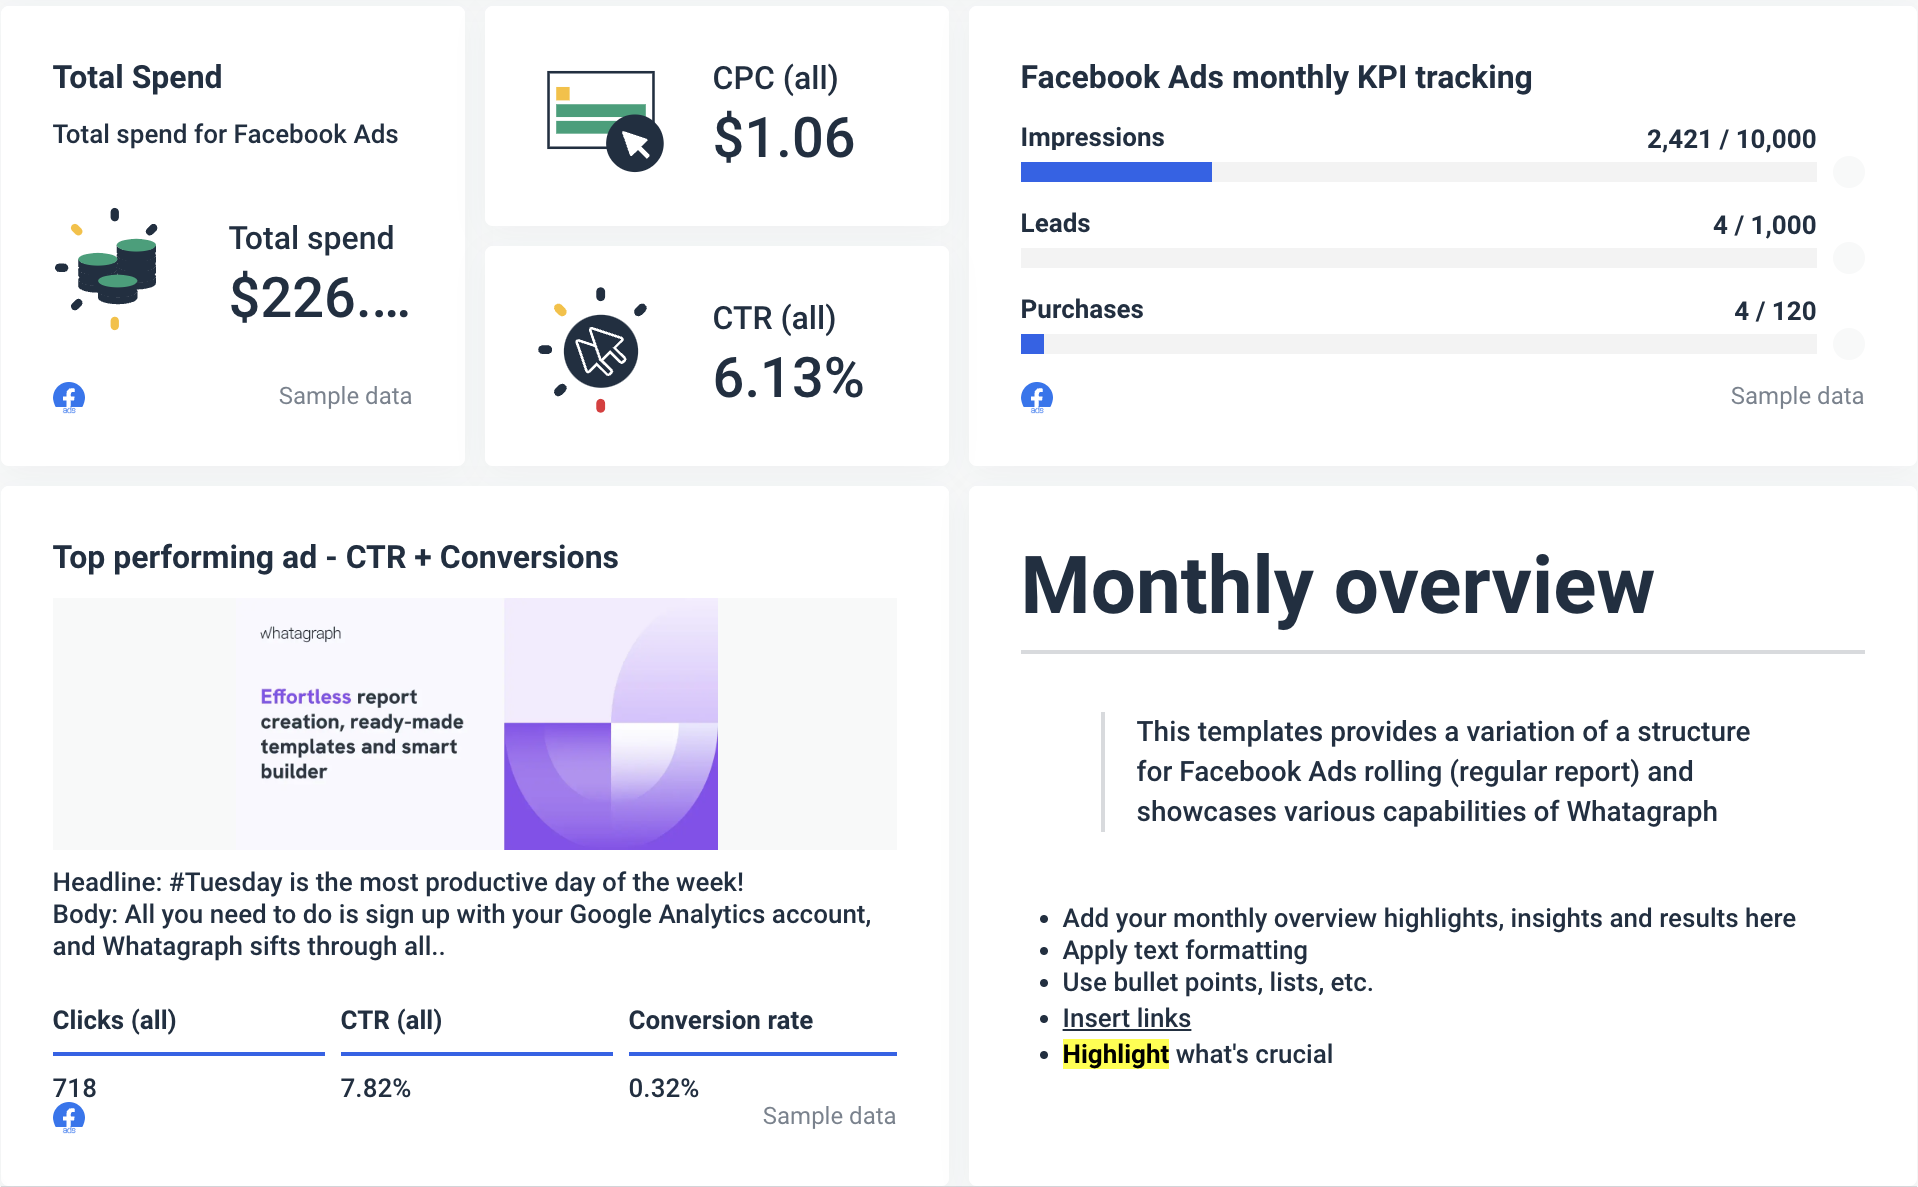
Always start your KPI reports with a high-level executive summary. It can be an overview of main KPIs as goals and a written summary of the most important points from that reporting period.
Lewis, for example, likes to put results first:
I start every report with a “Key Insights” section - this is the CEO’s two-minute takeaway. Here, we include a short, data-backed summary of what’s working, what’s not, and what’s next.
Tom Jauncey, CEO at Nautilus Marketing has a similar approach:
Clients don’t all care about the same metrics, so focus on what matters to them. Keep it clear, concise, and actionable. Start with the wins, explain what’s driving results, and then outline the next steps.
Castro, on the other hand, often starts a report with blended CAC, ROAS, LTV/CAC Ratio so C-Suite can immediately grasp the main points.
From there, I break down performance by channel, starting with the highest spend (e.g., Meta, Google, Pinterest, etc.). For each channel, I explain the overall performance, highlight key insights, and discuss how different funnels are working together to drive results.
If you feel that your report is becoming top-heavy with data, divide it into several sections, like PPC Campaigns, SEO Performance, Social Media, etc.
On Whatagraph, you can split your report into multiple tabs so your clients can quickly go through all sections with no need to scroll up and down.
3. Provide More Context and Actionable Insights
Your clients will understand reports better if you put performance metrics in context. You should always explain what the numbers mean and why they’re important.
For example, next to a website traffic line graph, you can say, “A 15% increase in website traffic is due to the new blog series we launched last month.”
However, you shouldn’t just be reporting data, but also interpret it and offer clear, actionable recommendations. For example “To further improve conversion rates, we suggest A/B testing the call-to-action on your landing pages.”
Lewis points out that in his experience, clients value actionable insights that help them understand the next steps more than past performance reviews.
If a campaign underperformed, suggest a specific, data-backed adjustment, like adjusting ad spend distribution or refining target audience segments based on engagement patterns.
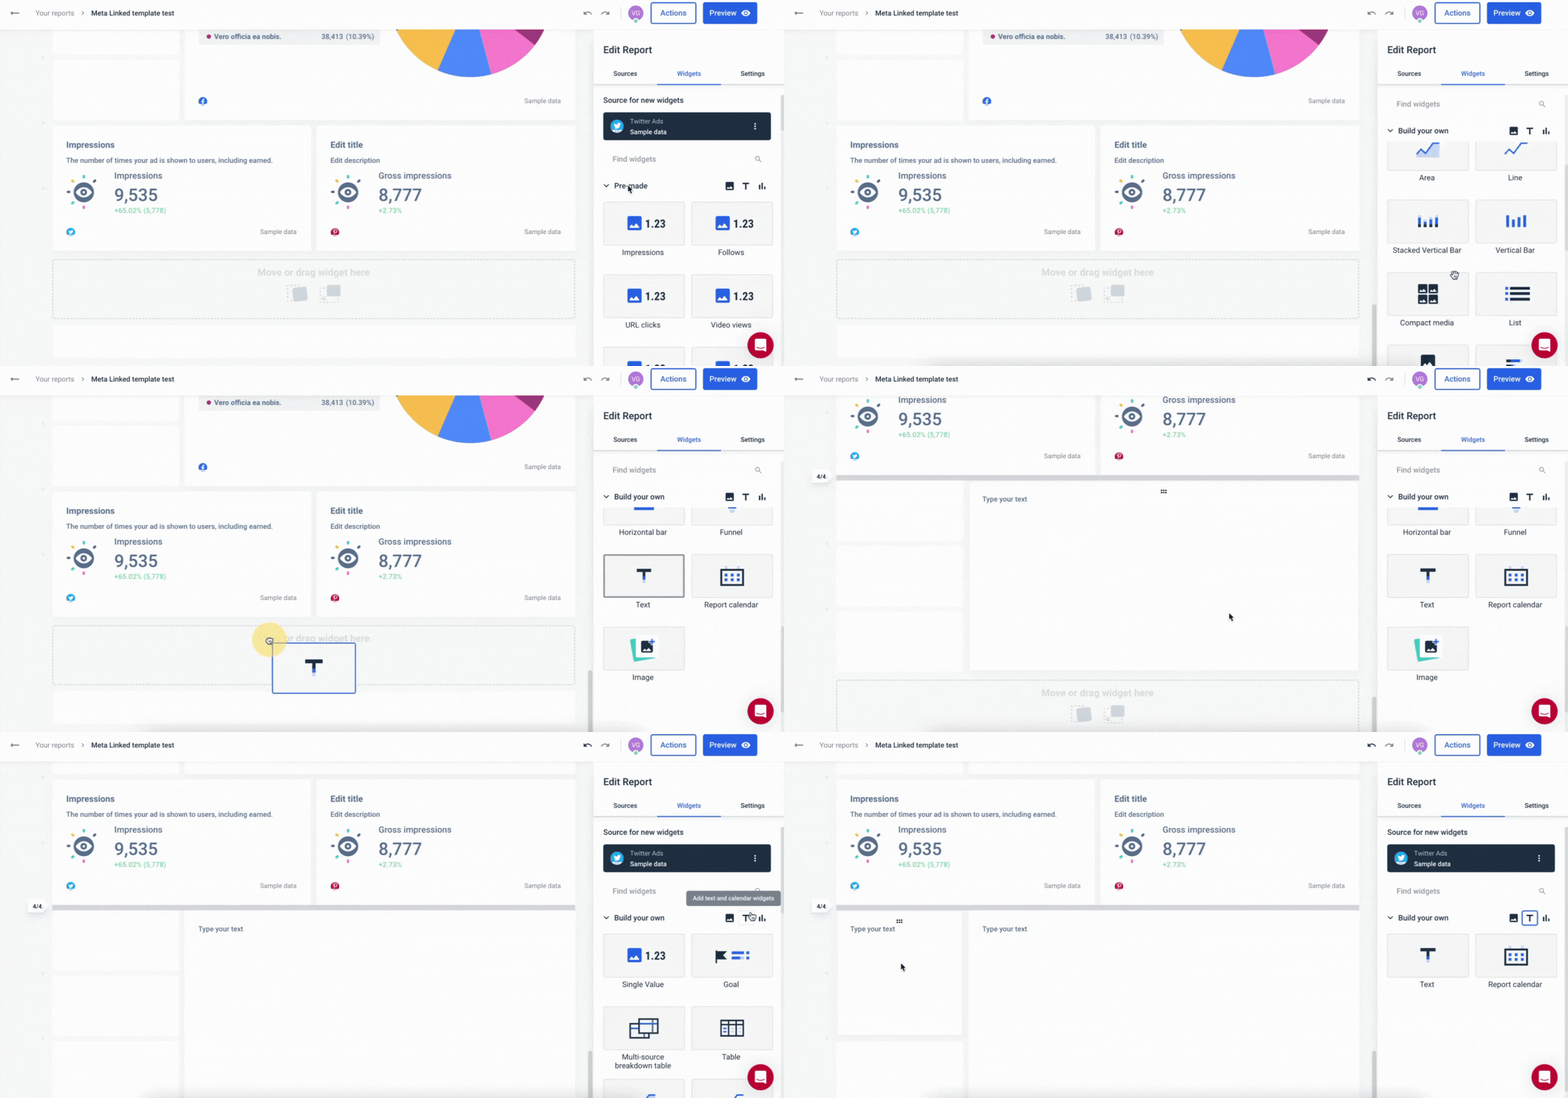
This is why it’s important to include written notes next to important performance metrics. On Whatagraph, you can easily add a Text widget to any part of your report:
4. Show Collaboration
You should always ask for client feedback and use the information to make your reports better and more tailored to what they want to see.
This way, you can show that their input is important for the campaigns’ success.
You can make clients’ contributions feel valued in several ways. For example, you can include their feedback in actionable insight notes:
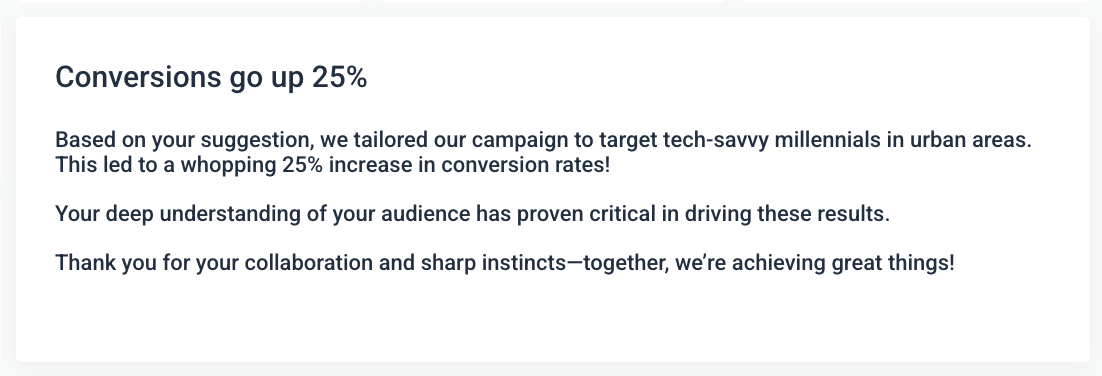
A dedicated section in the report thanks clients for their role in decision-making.
Another way to make reports more engaging is to mention team members or departments—both your agency's and the client’s that worked on the project.
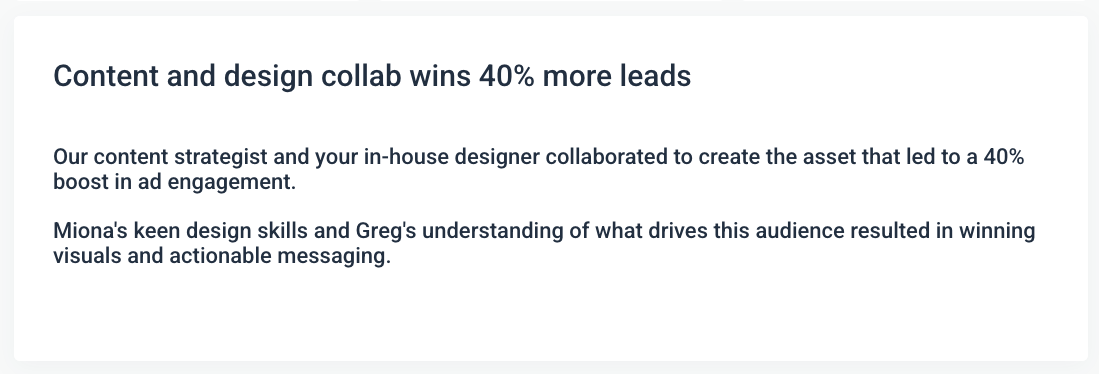
Testimonies like this give a human touch to your agency and your reports.
Similarly, you can use Whatagraph’s note widgets to add screenshots or quotes from communications, planning sessions, and brainstorming meetings to show the process behind key decisions.
For example, you can include specific moments where collaboration directly impacted the outcome to make reports feel more personalized.
When you add examples of collaboration, you show your clients that success isn’t just about your agency’s work but about teamwork and alignment between the agency and their team.
5. Keep the Reports Consistent
Use the consistent report format, structure, and terminology in every report you send.
You may think that changing the report layout from time to time is good for keeping the readers engaged, but it will only confuse them.
To avoid this, Lewis regularly uses report templates:
Consistency also matters—use the same report format every time so clients can quickly find and interpret what matters to them.
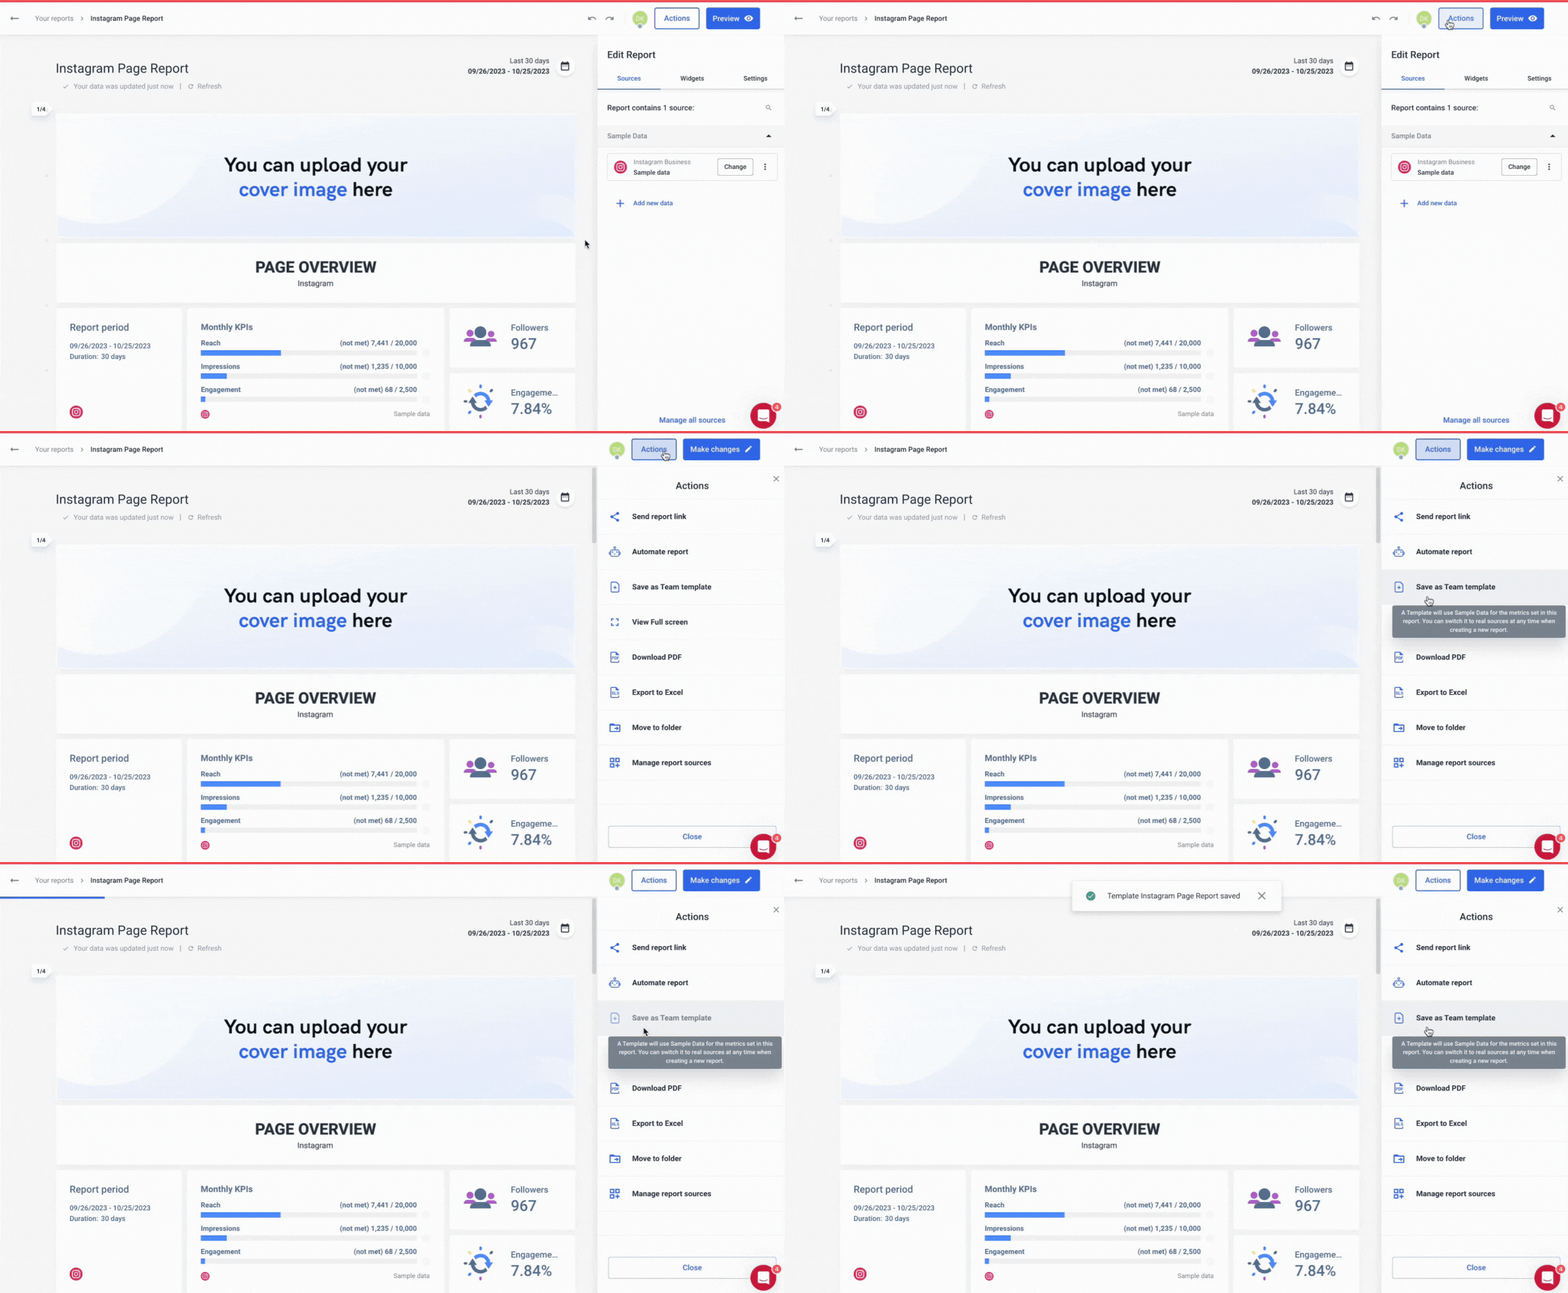
Apart from the library of pre-made templates, on Whatagraph you can save any report as a team template and use it whenever you want.
Which metrics to Include in Your KPI Reports?
In short? There are no wrong and right KPIs. Report on those that tie closely to your client’s business goals. Here are the most important KPIs you should consider for each marketing channel.
Paid Advertising
Cost per Acquisition (CPA): Also known as Cost per Conversion, this metric shows the total cost of a customer who completes a specific action. It measures how much it costs to get one customer down your sales funnel.
Erika Castro, Growth Marketing Manager at Erika Castro-Morrison tracks both Blended and New CPA in her agency:
Blended CPA shows the average cost to get a customer, giving you a big-picture view of your spending. New CPA tells you how much it costs to bring in new customers, which is key for growth.
Brandon Rollins from Pangea Marketing adds:
For PPC, the main guiding light is cost per conversion. We'll watch click-through rate (CTR) and cost per impression (CPM), but only care about them if we see an opportunity to improve cost per conversion by improving one of those metrics.

Return on Ad Spend (ROAS): This metric shows the revenue from every dollar spent on advertising. It measures how profitable your ad campaign is. ROAS is a key metric for understanding the effectiveness of your advertising.

Click-Through Rate (CTR): CTR is the percentage of people who clicked on your ad after seeing it.
This tells you how often people click on your ads. It’s a good indicator of whether your ad designs and messages are catching people’s attention, Erika explains.
A high CTR shows that your ad is interesting to the audience, while a low CTR means you should give the copy and design a second look.

Need to report the paid advertising KPIs? Save time with our PPC Report Template.
SEO
Organic Traffic: Organic traffic is the website traffic that you get from organic search. It measures the number of visitors who land on your website from unpaid search results on Google. Organic traffic directly shows how successful your SEO strategy is. The more organic traffic, the higher your website ranks for relevant keywords.
Keyword Rankings: Keyword ranking shows the ranking position of the keywords you target. It measures how well your website is optimized for specific search terms on Google. High keyword rankings help you increase visibility and traffic.
Joey Randazzo of SEO Growth Partners underlines the importance of local searches:
We track keyword rankings for our clients revenue-driving keywords daily and by location. For example, if we're working with a hair salon in Portland, OR, we're tracking how they're ranking for keywords like "best hair salon Portland" or "balayage in Portland."
Domain Authority (DA): Domain authority is a ranking score that predicts how well your website will rank on search engine results pages (SERPs). It measures the overall strength of your website. A higher DA usually leads to better rankings and trust score.
Get actionable insights from your SEO channels with our SEO Report Template.
Social Media
Engagement Rate: The engagement rate is the percentage of people who like, comment, and share your social media posts. Similarly to CTR in paid ads, this metric shows how interesting your content is for your audience. Higher engagement rates show that your followers find your content valuable.

Follower Growth: This metric shows the rate at which your audience on social media grows. It's a measure of your brand visibility and content reach. A steady growth rate suggests your content strategy is effective and your brand relevant for the target audience.

Reach: This social media metric shows the total number of unique users who see your post. It measures how well your content is being shared. A higher reach is a sign of a higher brand awareness. Low reach, on the other hand, signals that there might be a problem with the content type or optimization.
Gather the essential KPIs from all your social media channels with our Social Media Report Template.
Email Marketing
Open Rate: The open rate is the percentage of recipients who open your mail. It shows how effective your subject lines are in sparking audience interest.

A high open rate indicates that your email captured attention. It also shows how well people recognize you as a relevant sender.
Rollins shares his approach:
For email marketing, we'll watch for open and click rates primarily, but we also keep an eye on spam reports and unsubscribes just in case we need to change course.
Click-Through Rate (CTR): Email CTR shows the percentage of recipients who clicked on links in your email. It measures the relevance of email content and call-to-action. This metric shows how well your email engages readers to take a desired action.

Unsubscribe Rate: The percentage of people who decide to unsubscribe from future emails is called the unsubscribe rate. Just like the engagement rate, the email churn rate measures how relevant your emails are for the audience.
A low unsubscribe rate signals that you're delivering interesting and relevant content to your subscribers. By analyzing it more closely, you can improve audience segmentation.

For a more detailed list of relevant KPIs you should include in different types of campaigns, check out our 35 Digital Marketing KPIs and Metrics guide.
KPI Report Examples to Get You Inspired
Let’s now take a look at 3 examples of effective KPI reports:
Whatagraph KPI Reports
Whatagraph is designed specifically for marketing agencies and teams in large organizations that need to create KPI reports fast and at a large scale.
Example 1
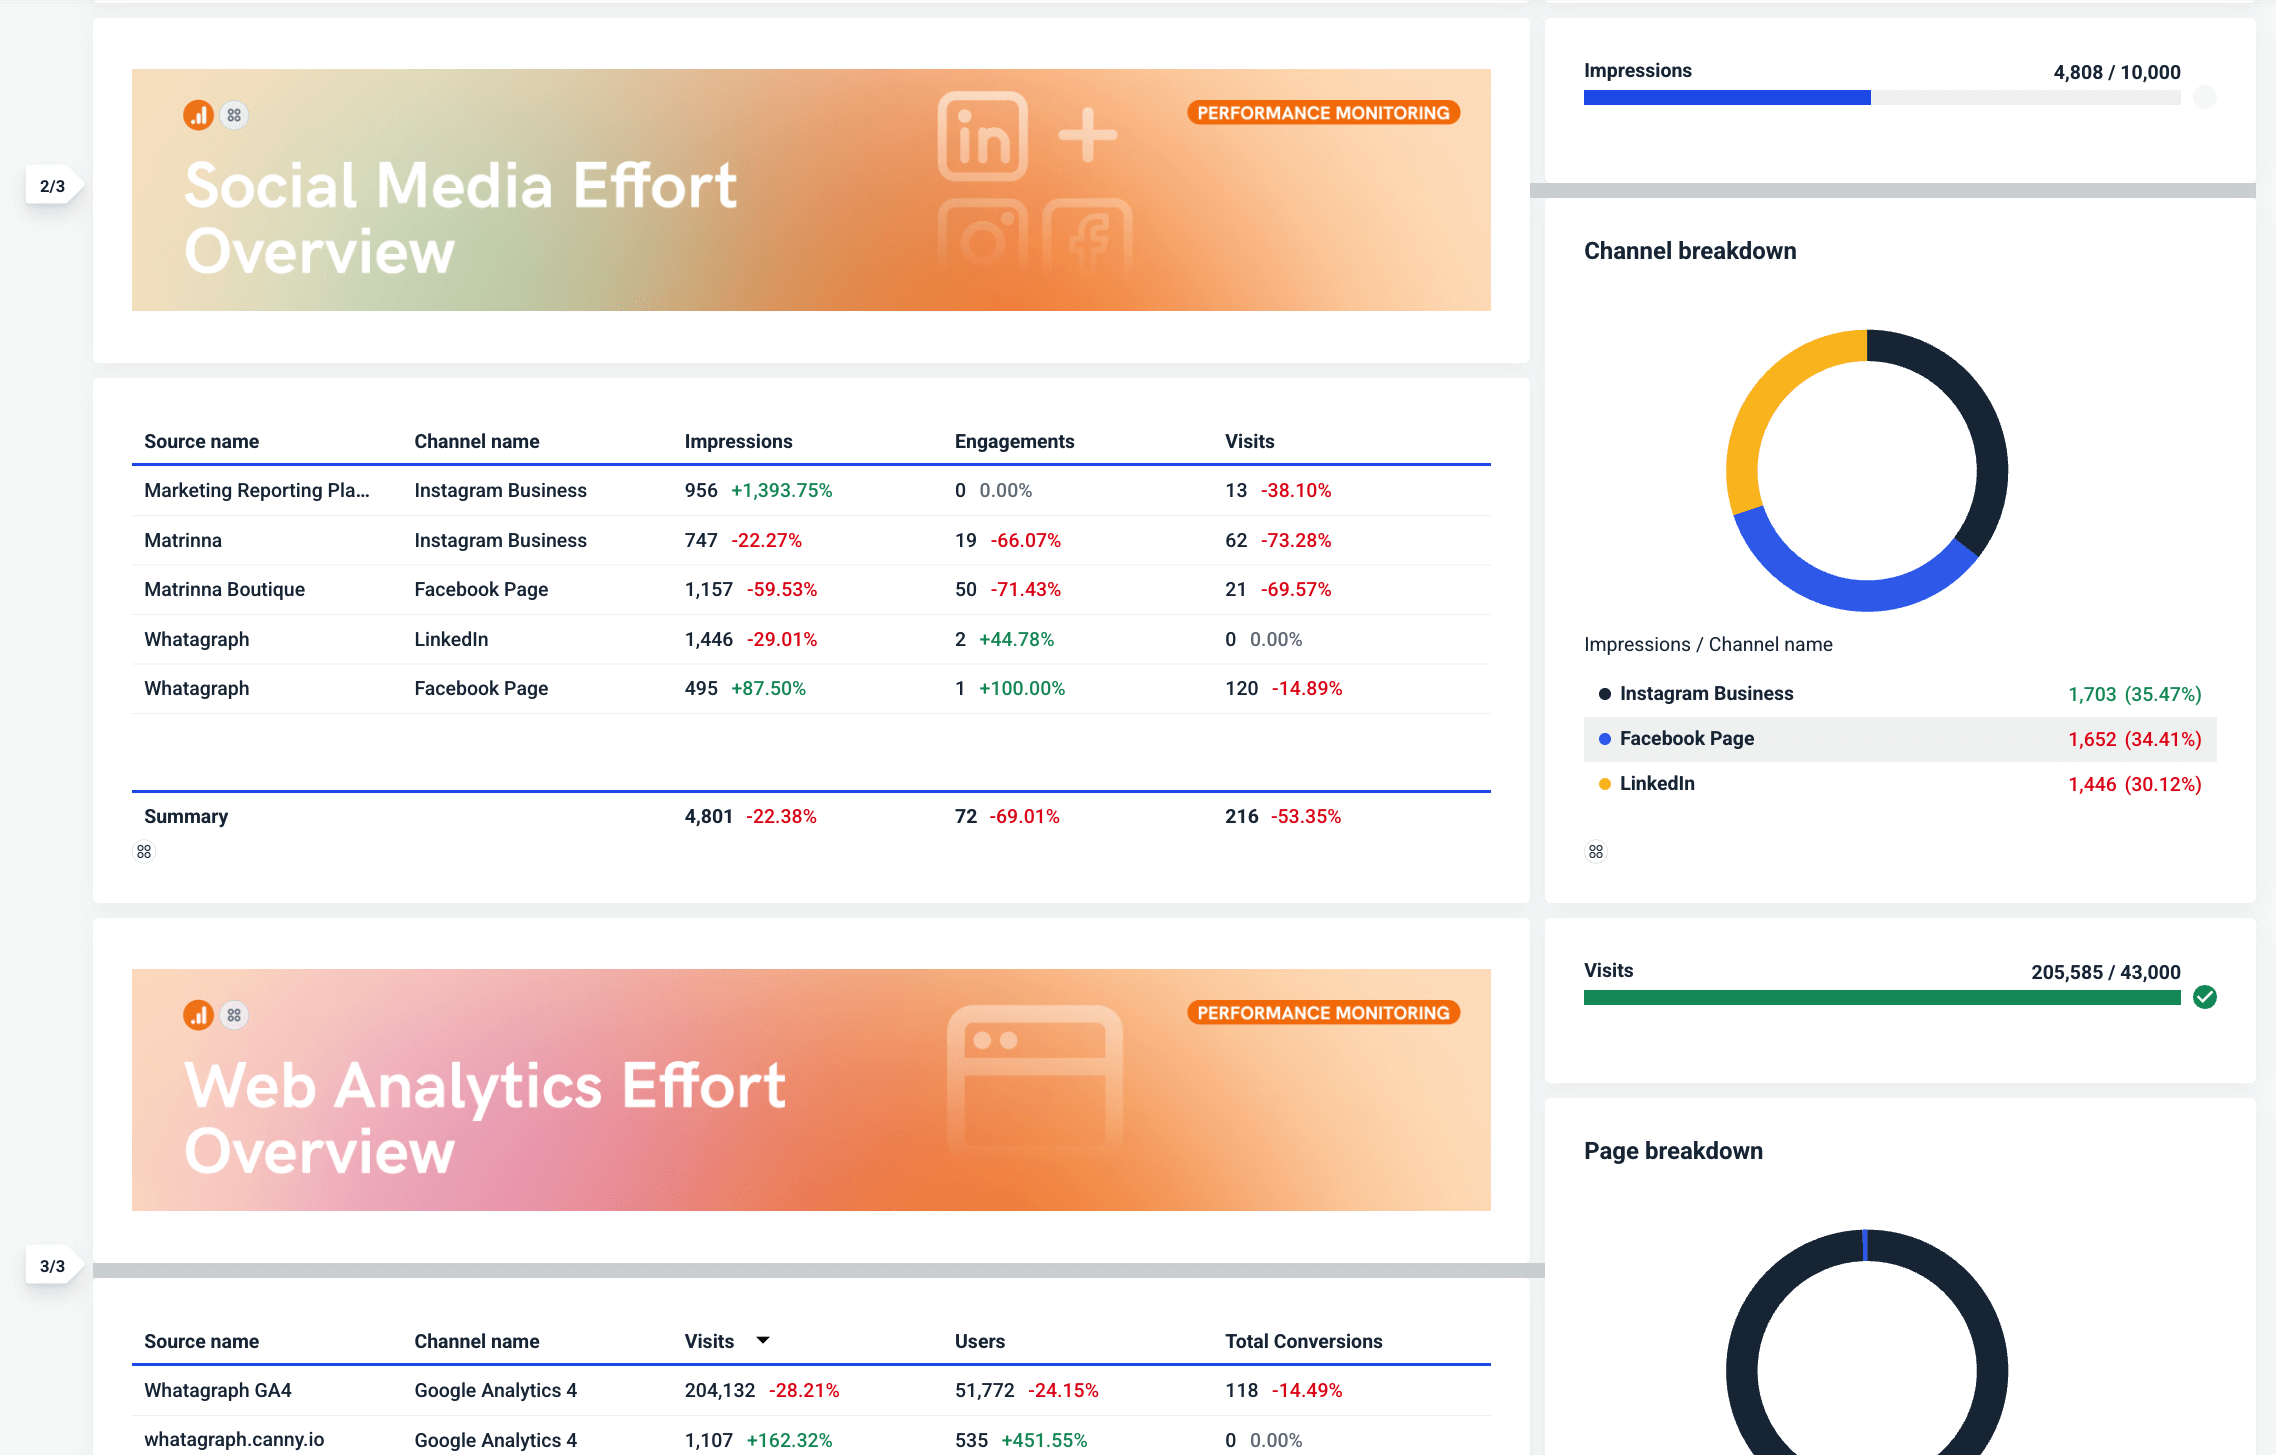
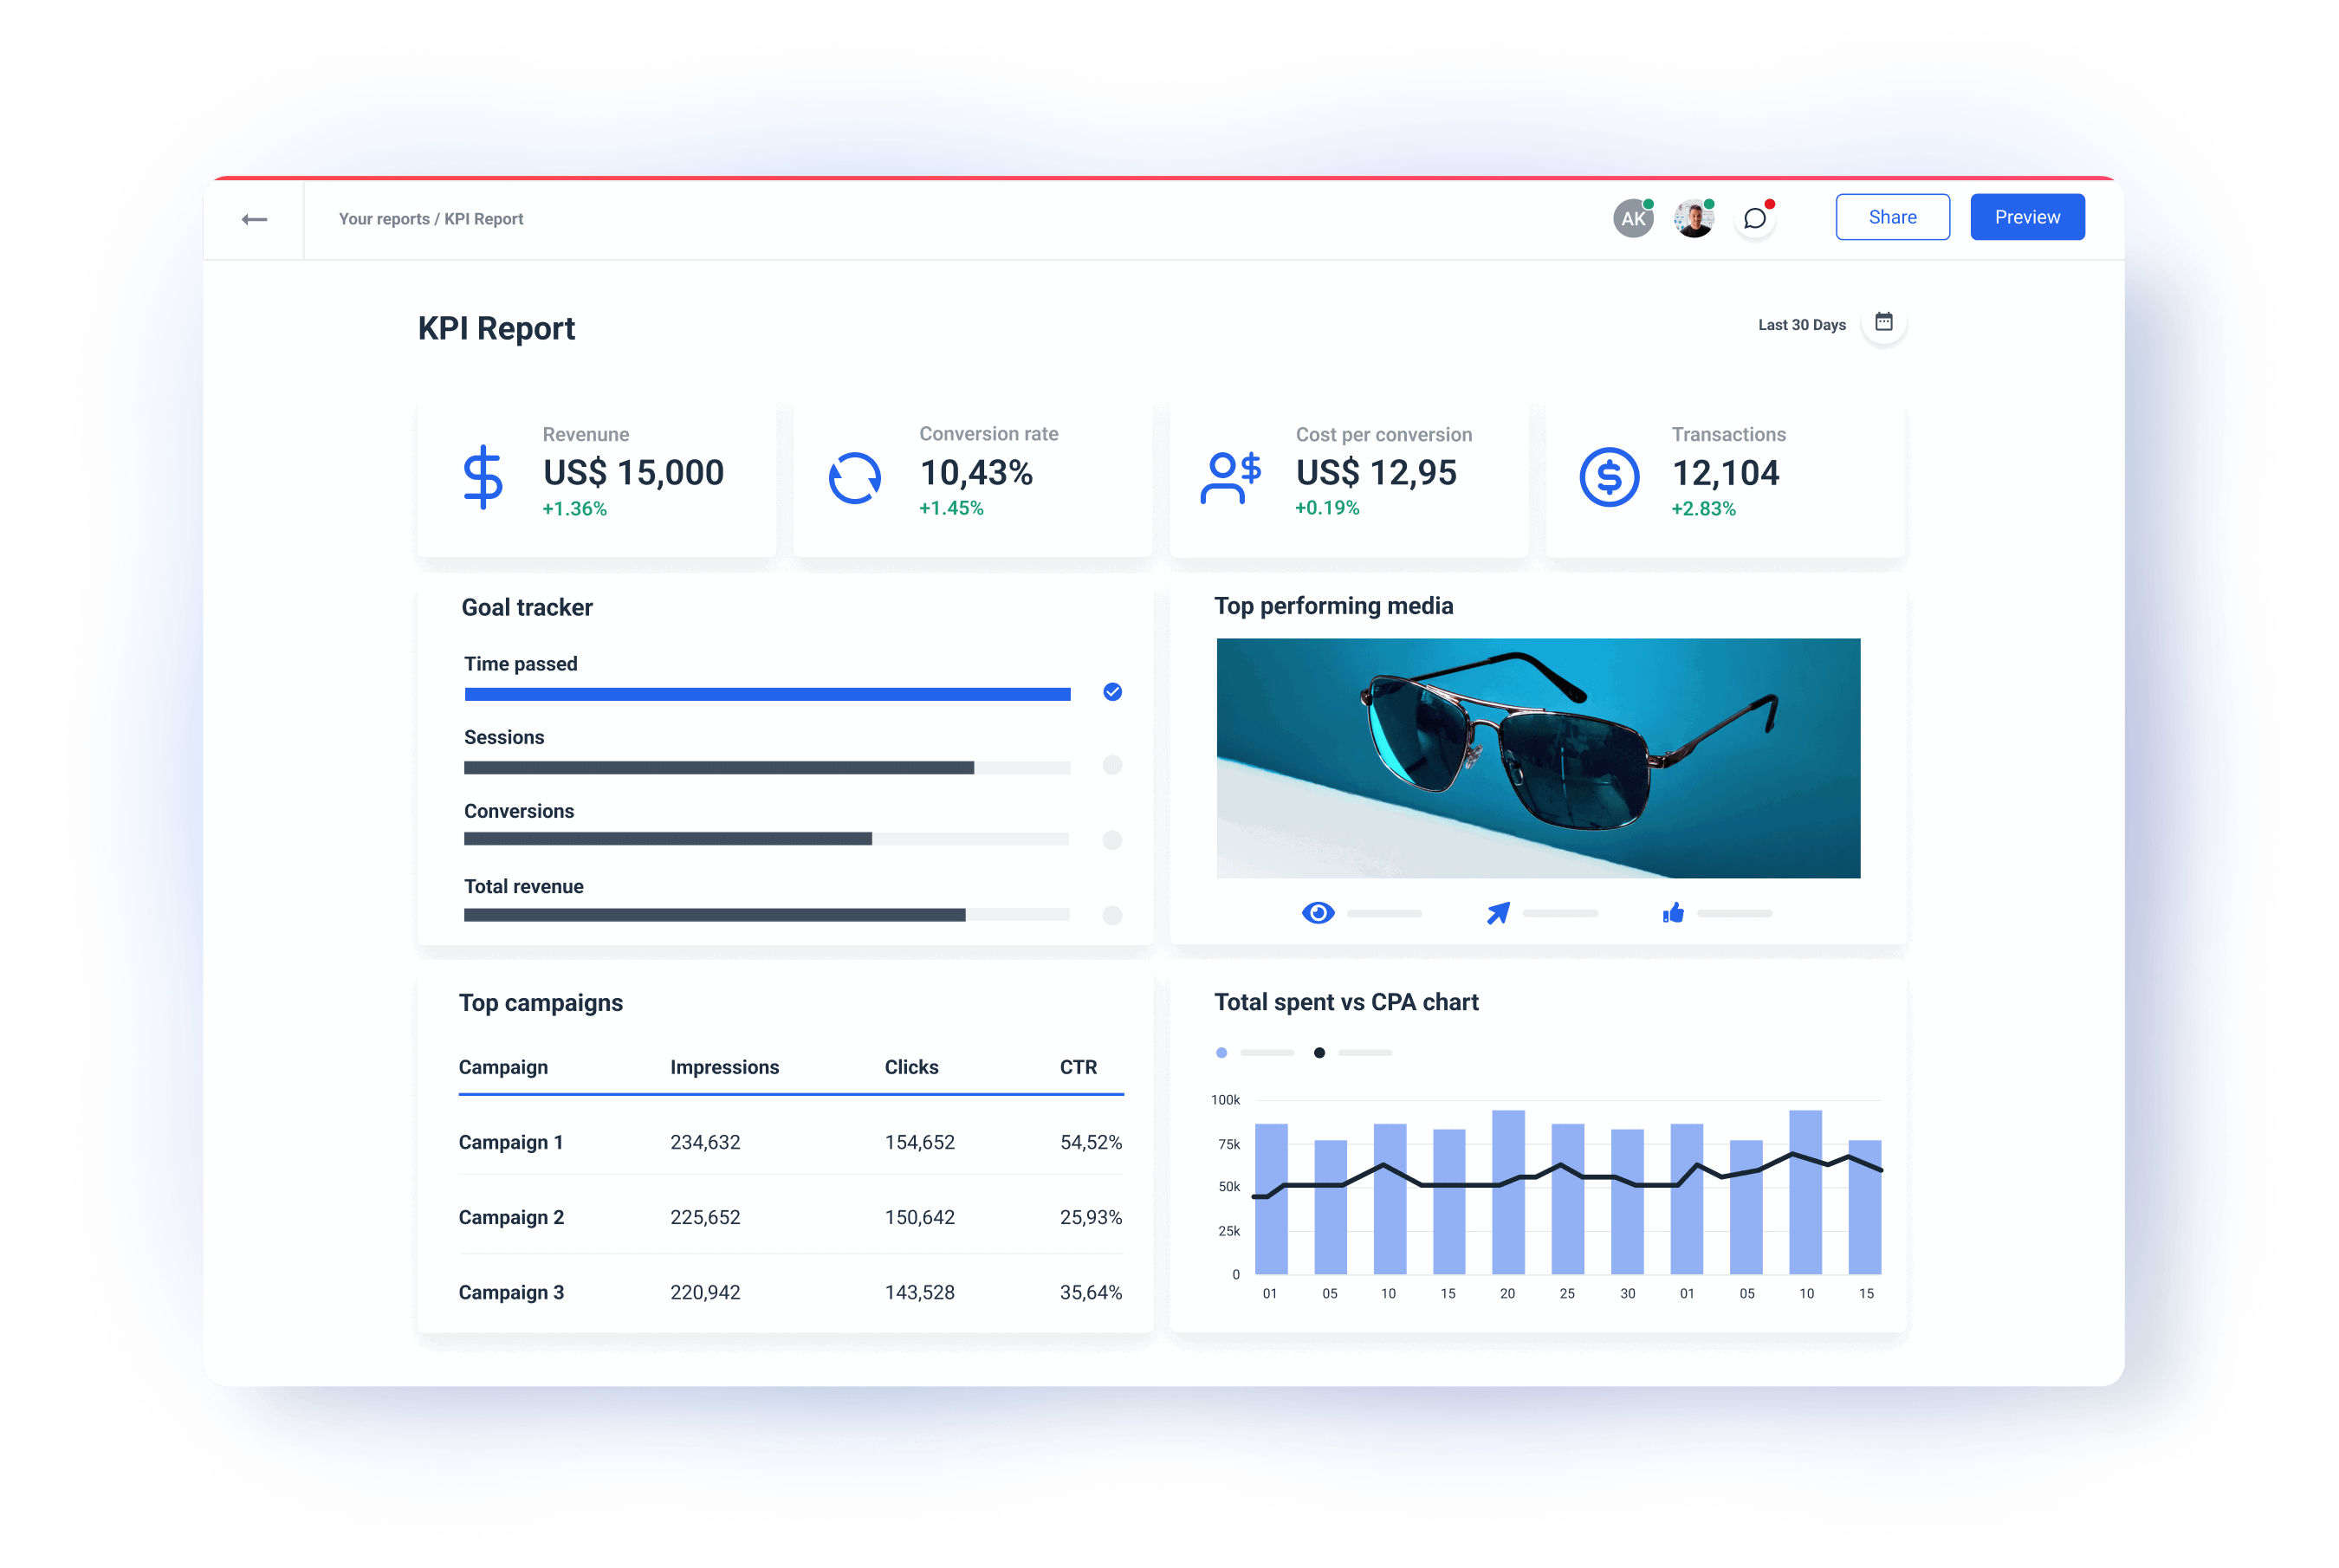
You can build each report by dragging and dropping widgets from the sidebar. Resize each widget to fit it where you want it and eliminate the empty space.
Example 2
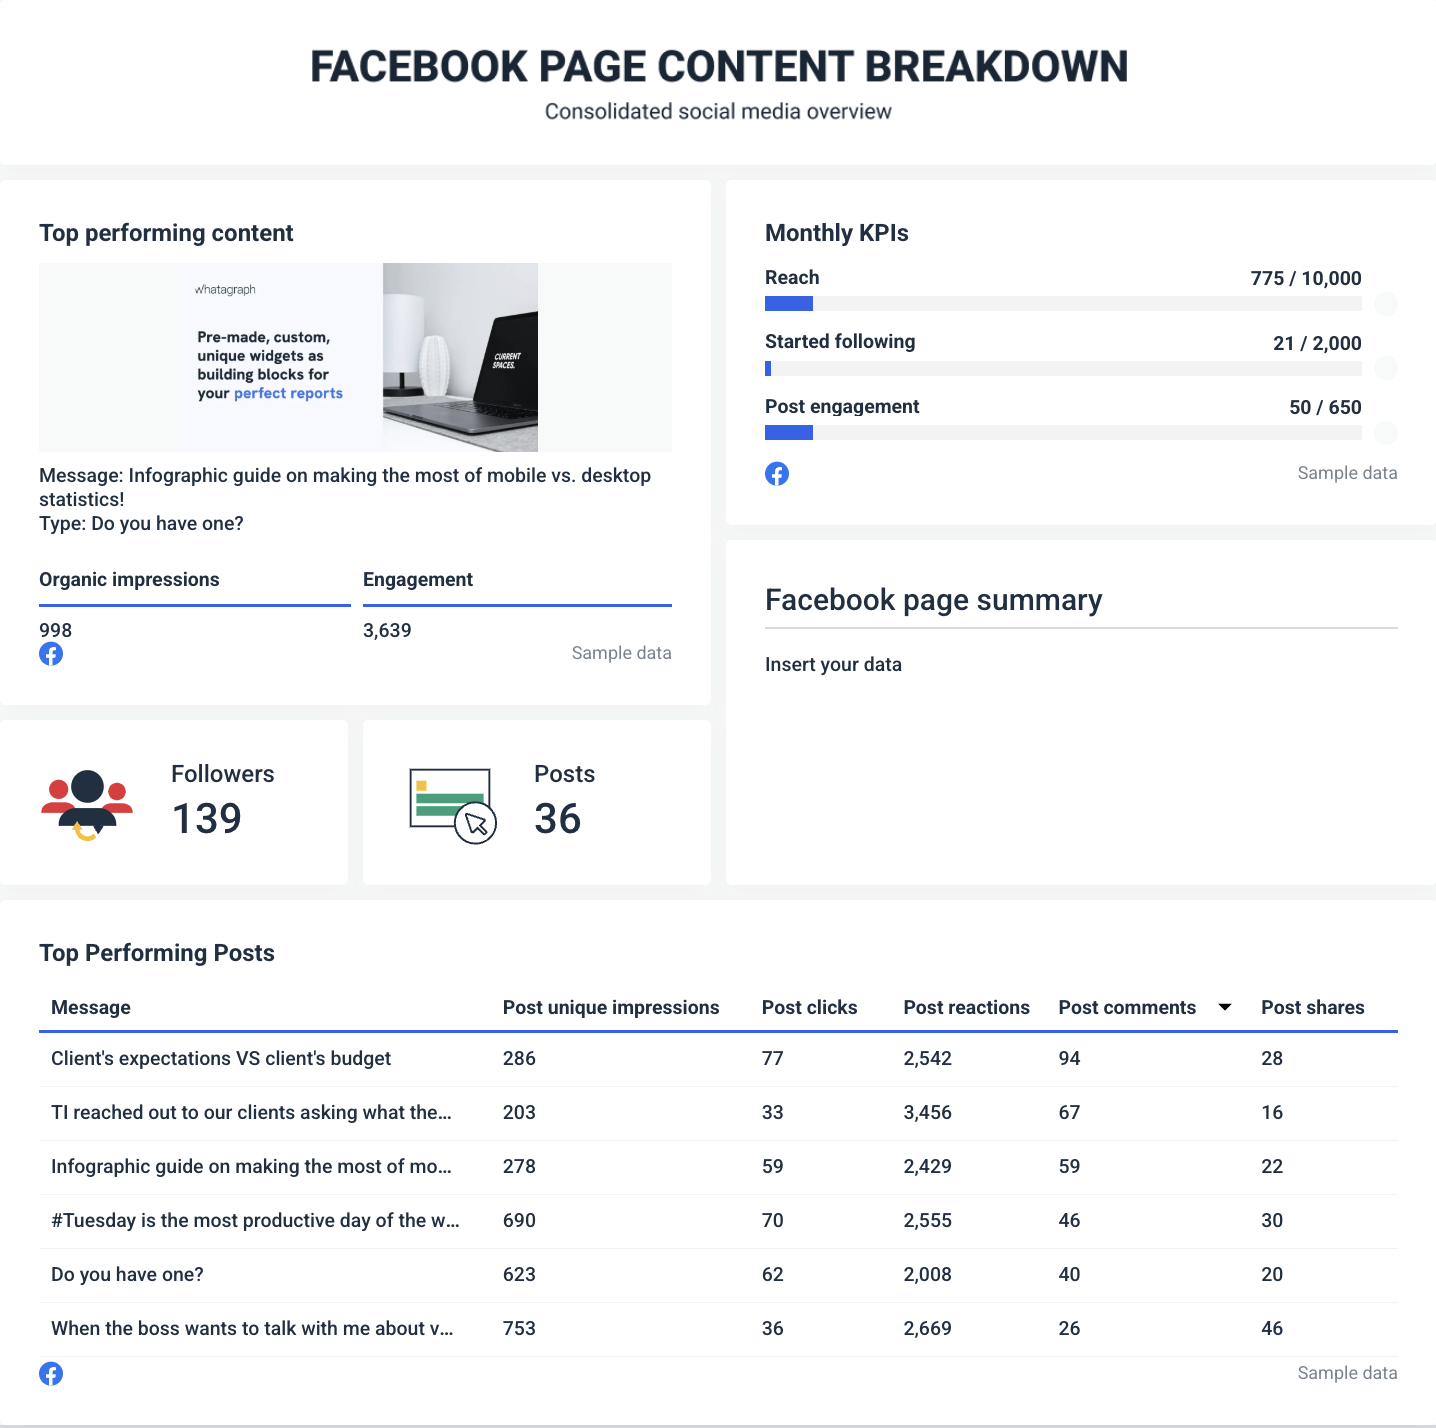
Use media widgets to automatically show your best-performing social media or paid ad creative. Easily set and track KPI goals and provide written summaries of the latest developments.
Spreadsheets KPI Report
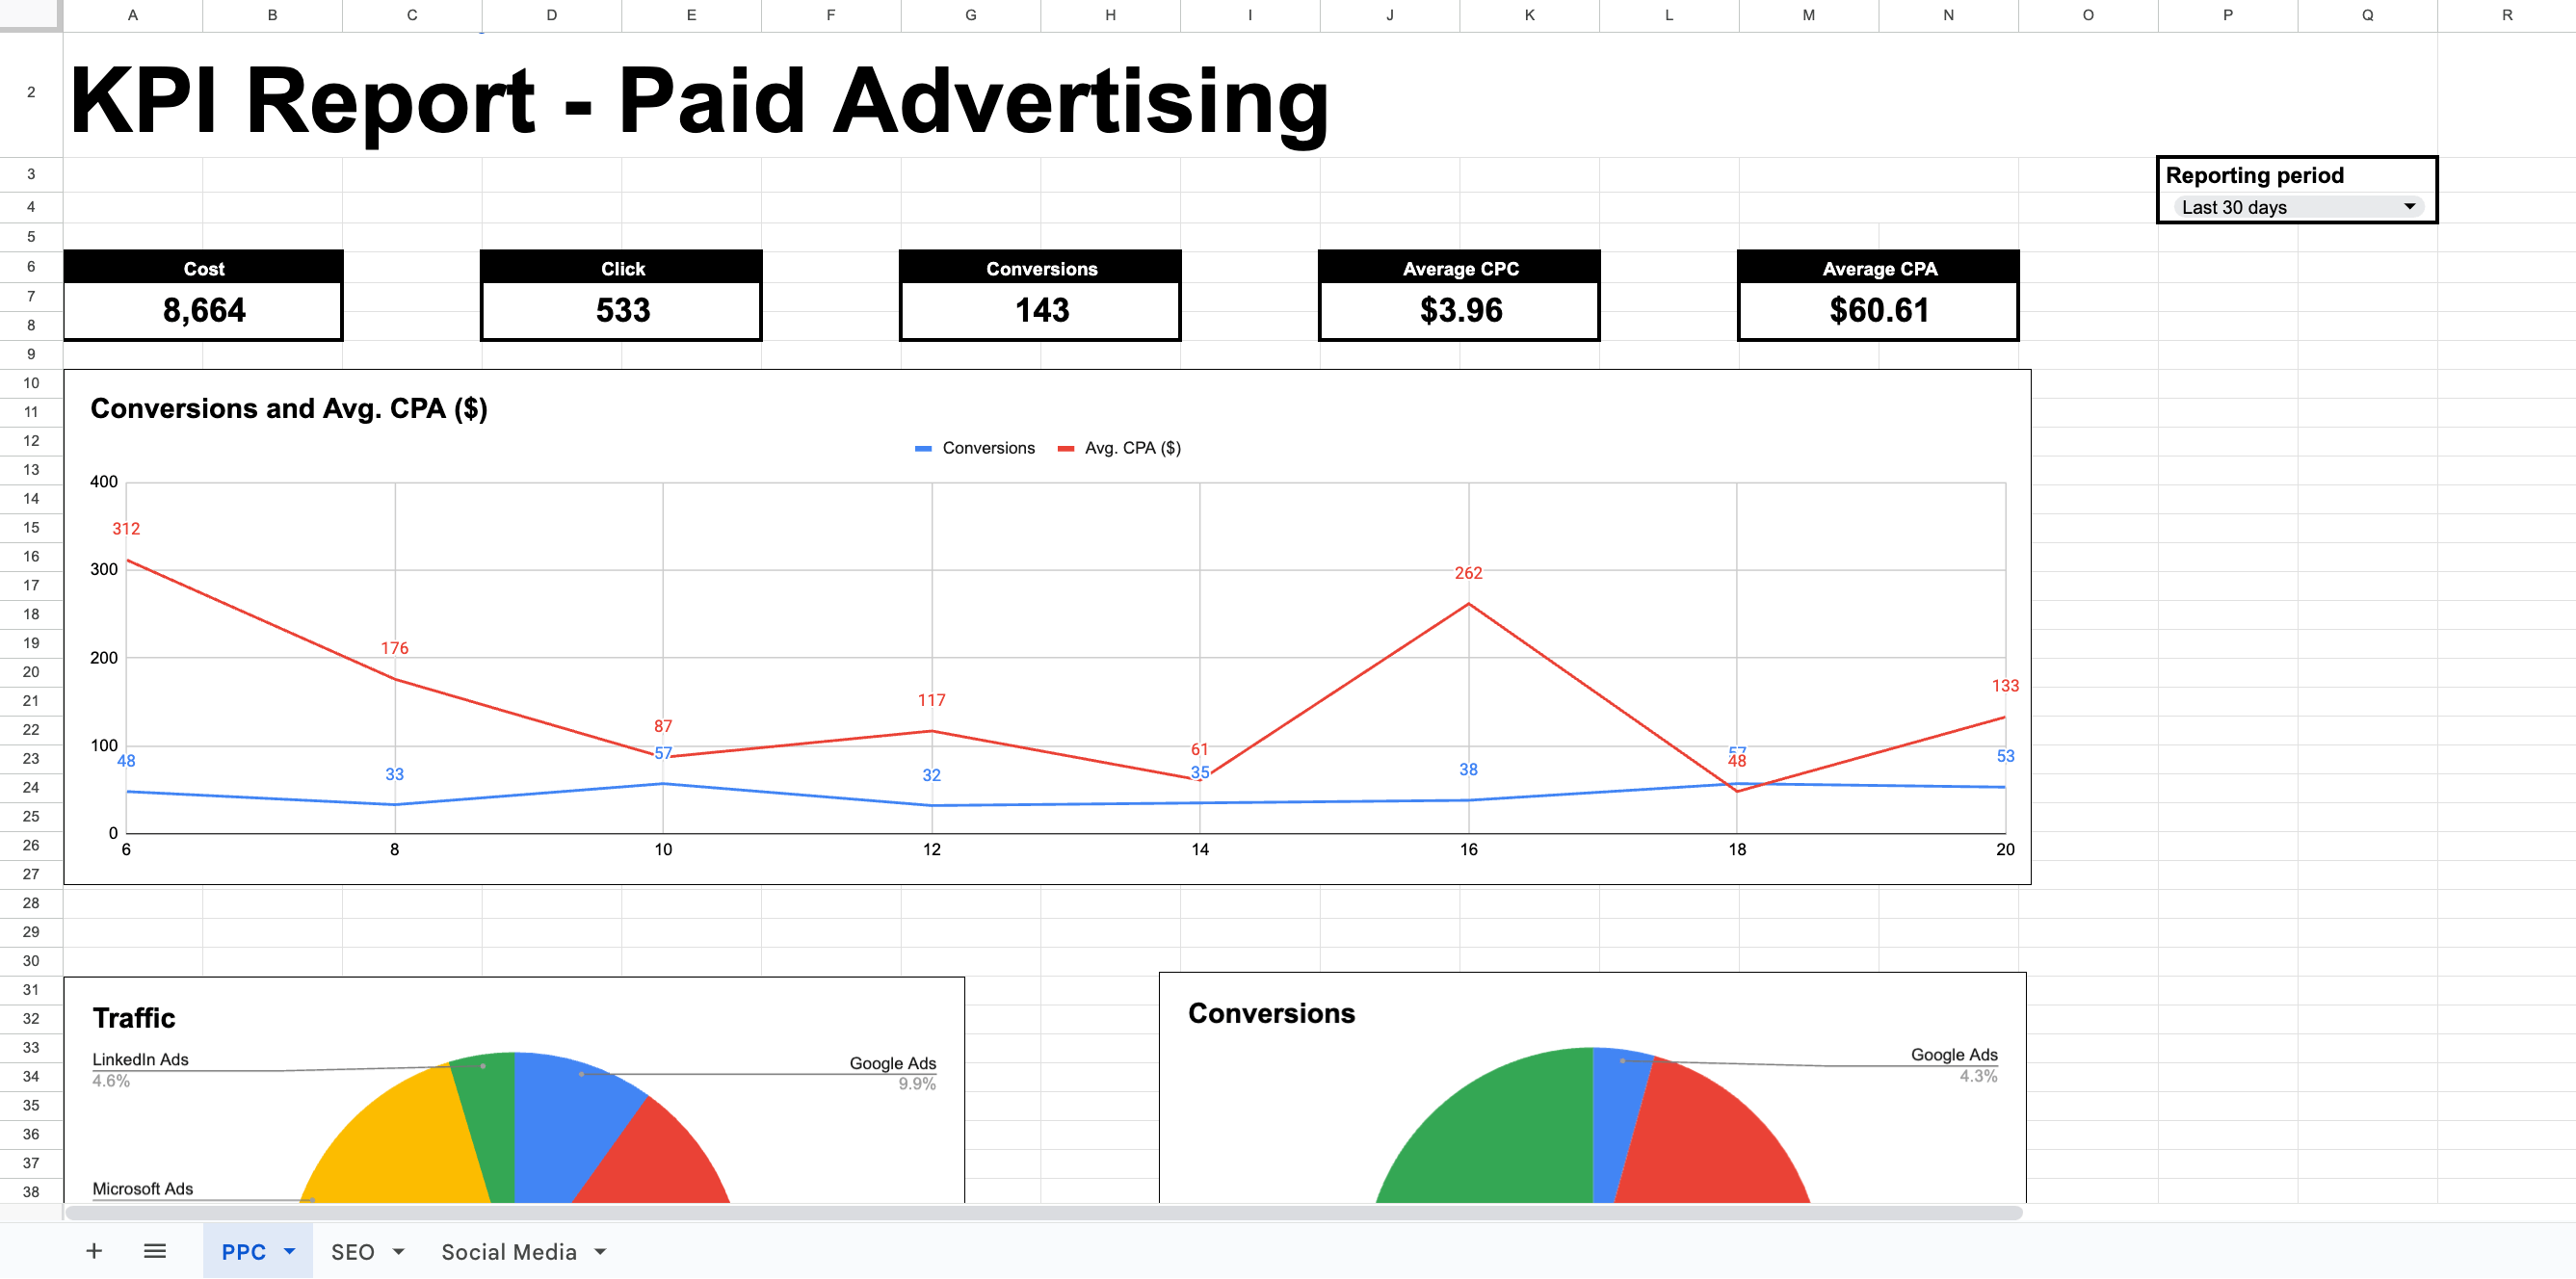
Spreadsheets are free and offer a lot of flexibility for different KPI reporting needs. With little or no training, you get direct access and full control over your exported data.
However, there’s the other side of spreadsheet reports, especially when you need to visualize the data:
❌ Lot of manual work: It takes a lot of time to maintain and update reports with a HUGE margin for error in both data entry and calculations.
❌ Difficult to scale: Spreadsheets quickly become unwieldy with large datasets. Also, there’s no report automation with sheets — you need to manually set up every report.
❌ Static and limited data visualization: You get only basic charts and graphs with zero interactivity.
Looker Studio KPI Report
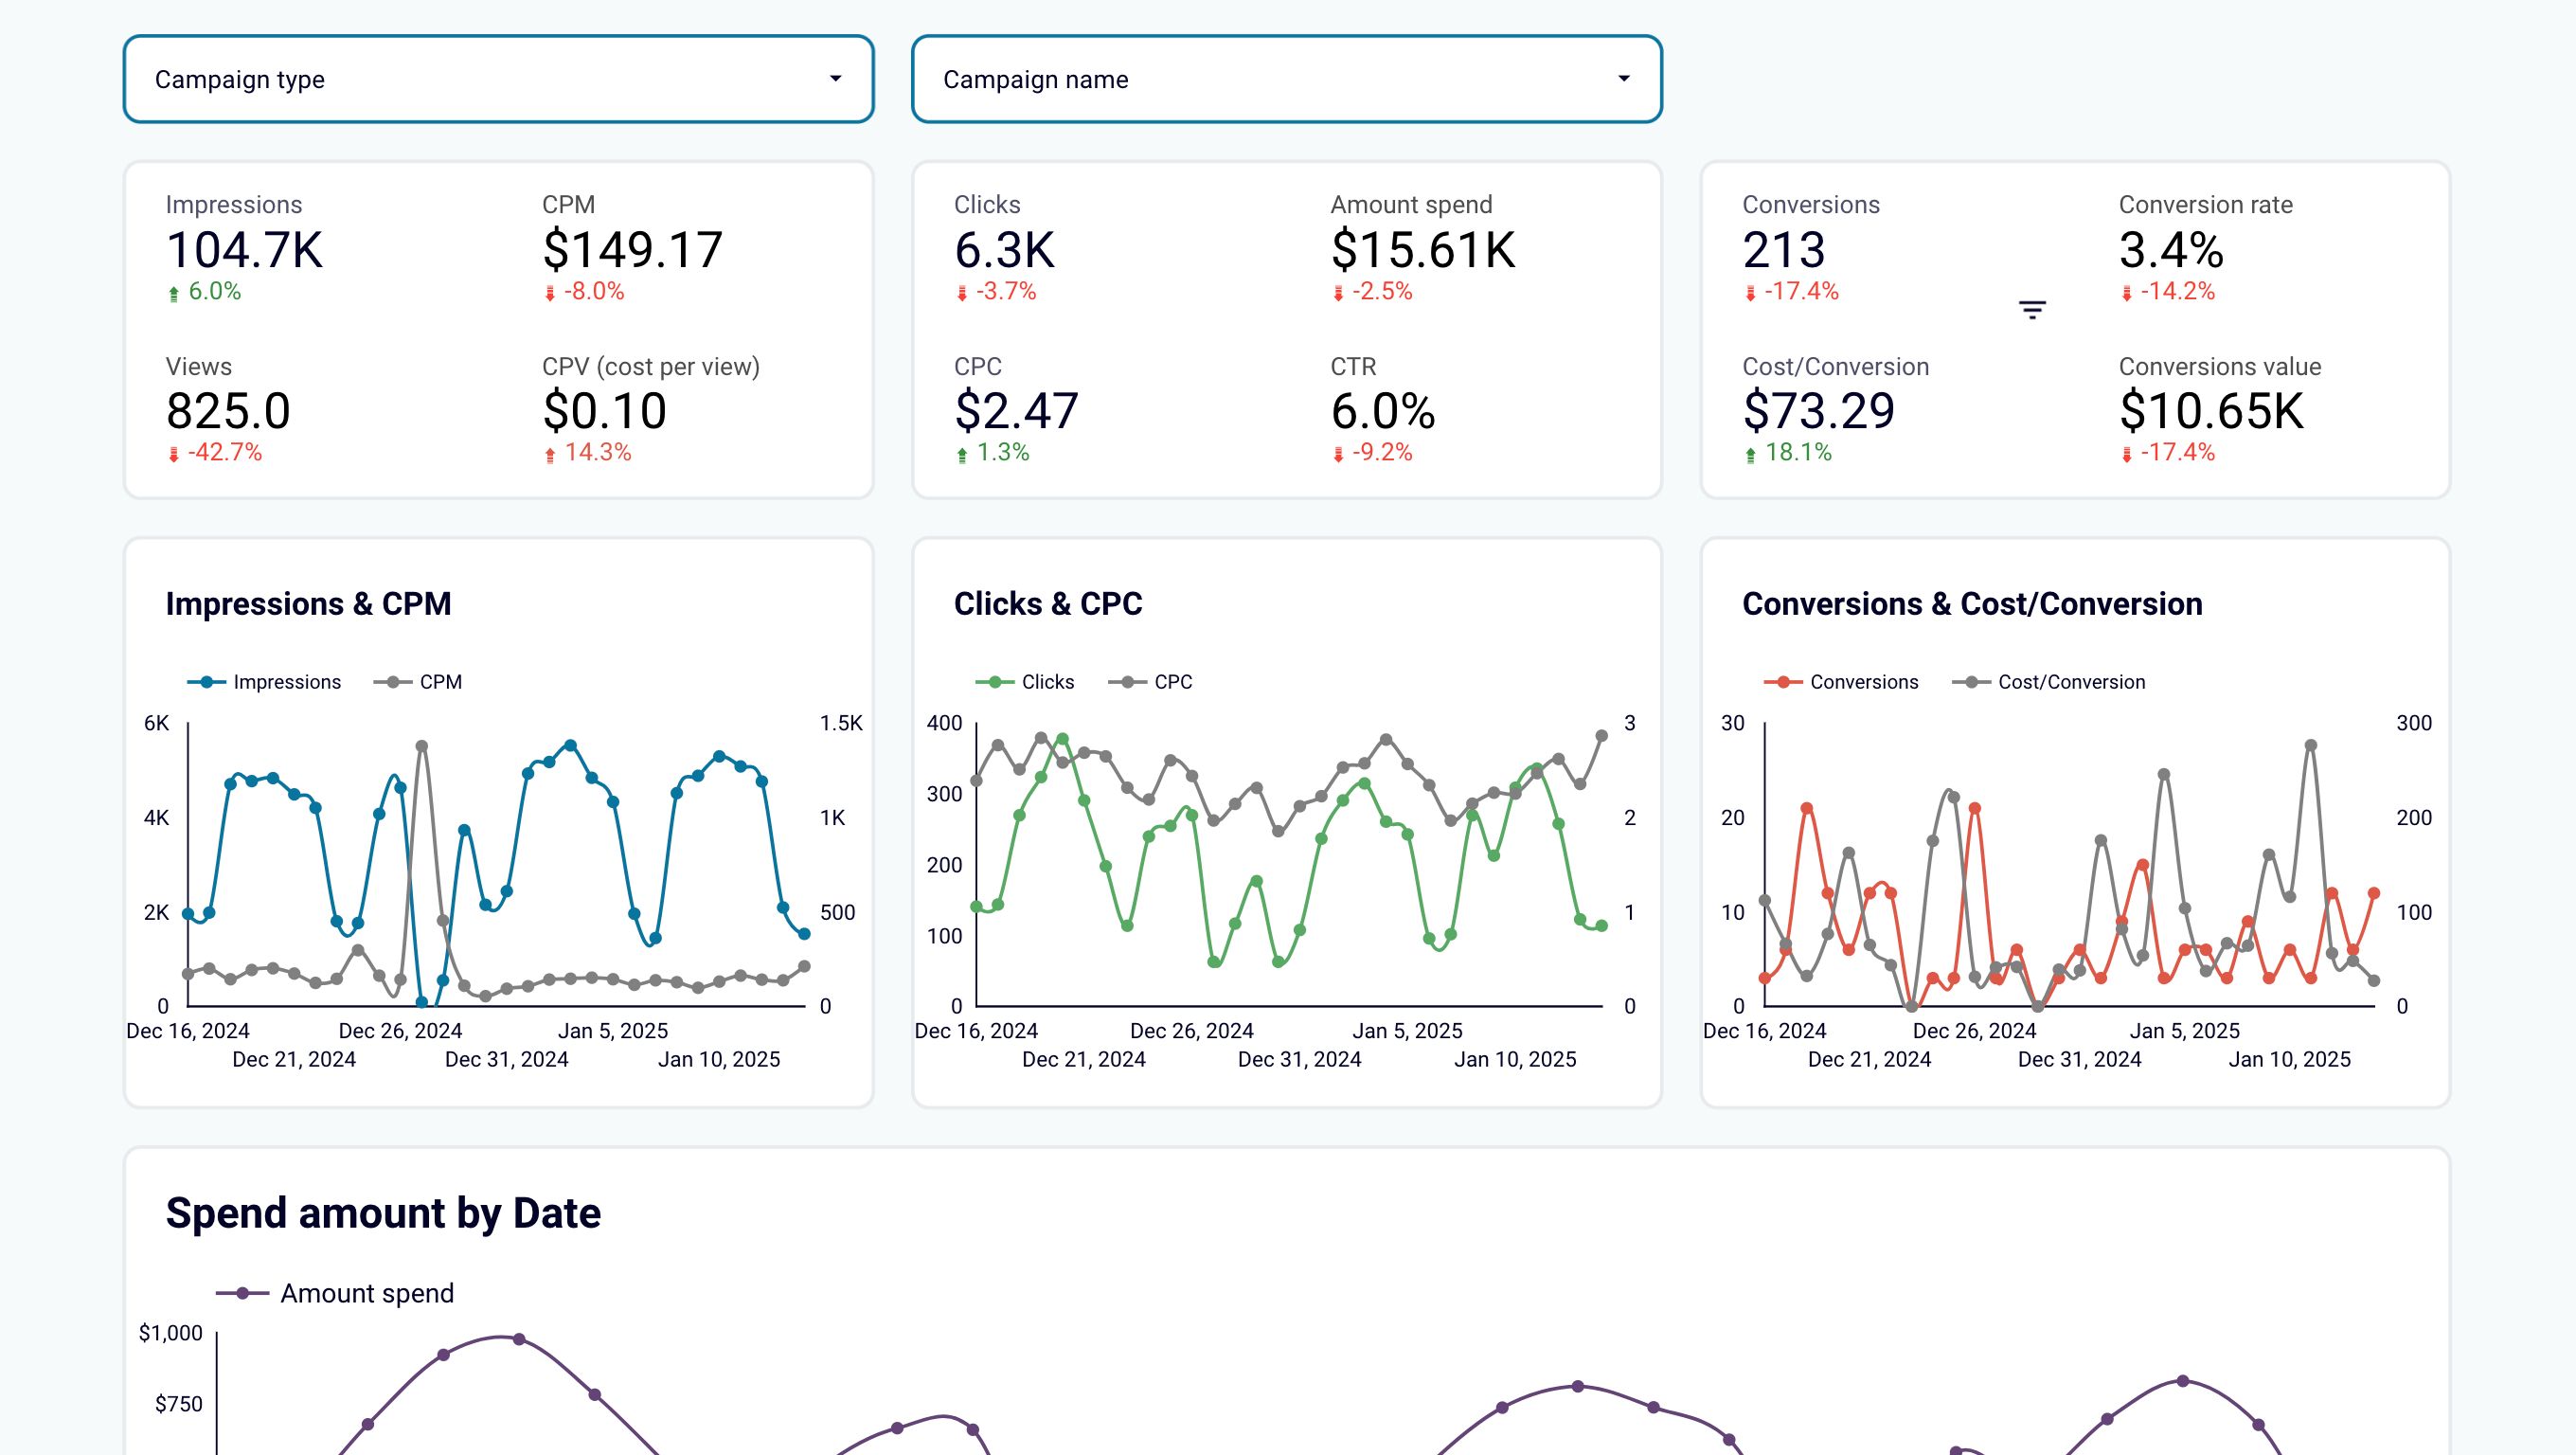
It takes much skill and many hours to create a clean and organized Looker Studio report like this one.
You should be especially careful if you use Looker Studio as your reporting tool. It works fine with Google data sources, but with non-Google sources, things can get complicated.
Why?
❌ Complex to set up: To make the process automated and scalable, you need a data integration tool to handle the data. Getting this reporting process to work takes some or a lot of technical expertise, depending on both the KPI tool and the data platform.
❌ Unreliable connectors: Many data integration platforms use third-party data connectors, which are unreliable and have different bandwidth or refresh rates, which makes your reports less dependable.
❌ Learning curve: Creating basic reports on Looker Studio is relatively easy, but things get complicated once you need to customize something.
❌ Performance: These tools can become slow or unreliable with large datasets. For example, Looker Studio can get notoriously slow once you connect more than 5 sources.
Zach Pittman of Forrest Property Group shares some of the problems he had with Looker Studio:
We've had issues with data not updating correctly or graphs suddenly showing incorrect information. When data is wrong in our reports, we find ourselves spending a lot of time problem-solving by looking at the original data in GA4 or Google ads, and in some cases, simply explaining to the client that the data is not showing correctly.
Facing similar struggles with Looker Studio reports? Book a call with us and let us know how Whatagraph can help.

WRITTEN BY
Nikola GemesNikola is a content marketer at Whatagraph with extensive writing experience in SaaS and tech niches. With a background in content management apps and composable architectures, it's his job to educate readers about the latest developments in the world of marketing data, data warehousing, headless architectures, and federated content platforms.