19 Social Media KPIs and Metrics for Business Growth
Most marketing agencies that use social media as a tool for advertising strive to have a fantastic social media presence. Not only that, but they also seek to create the best-performing social media marketing strategy, achieve clients’ business goals and optimize marketing campaigns.

Feb 03 2020●8 min read


Without using important metrics and social media KPIs, it is very difficult to know with absolute certainty if you have the right impact on social media (with your client’s target audience).
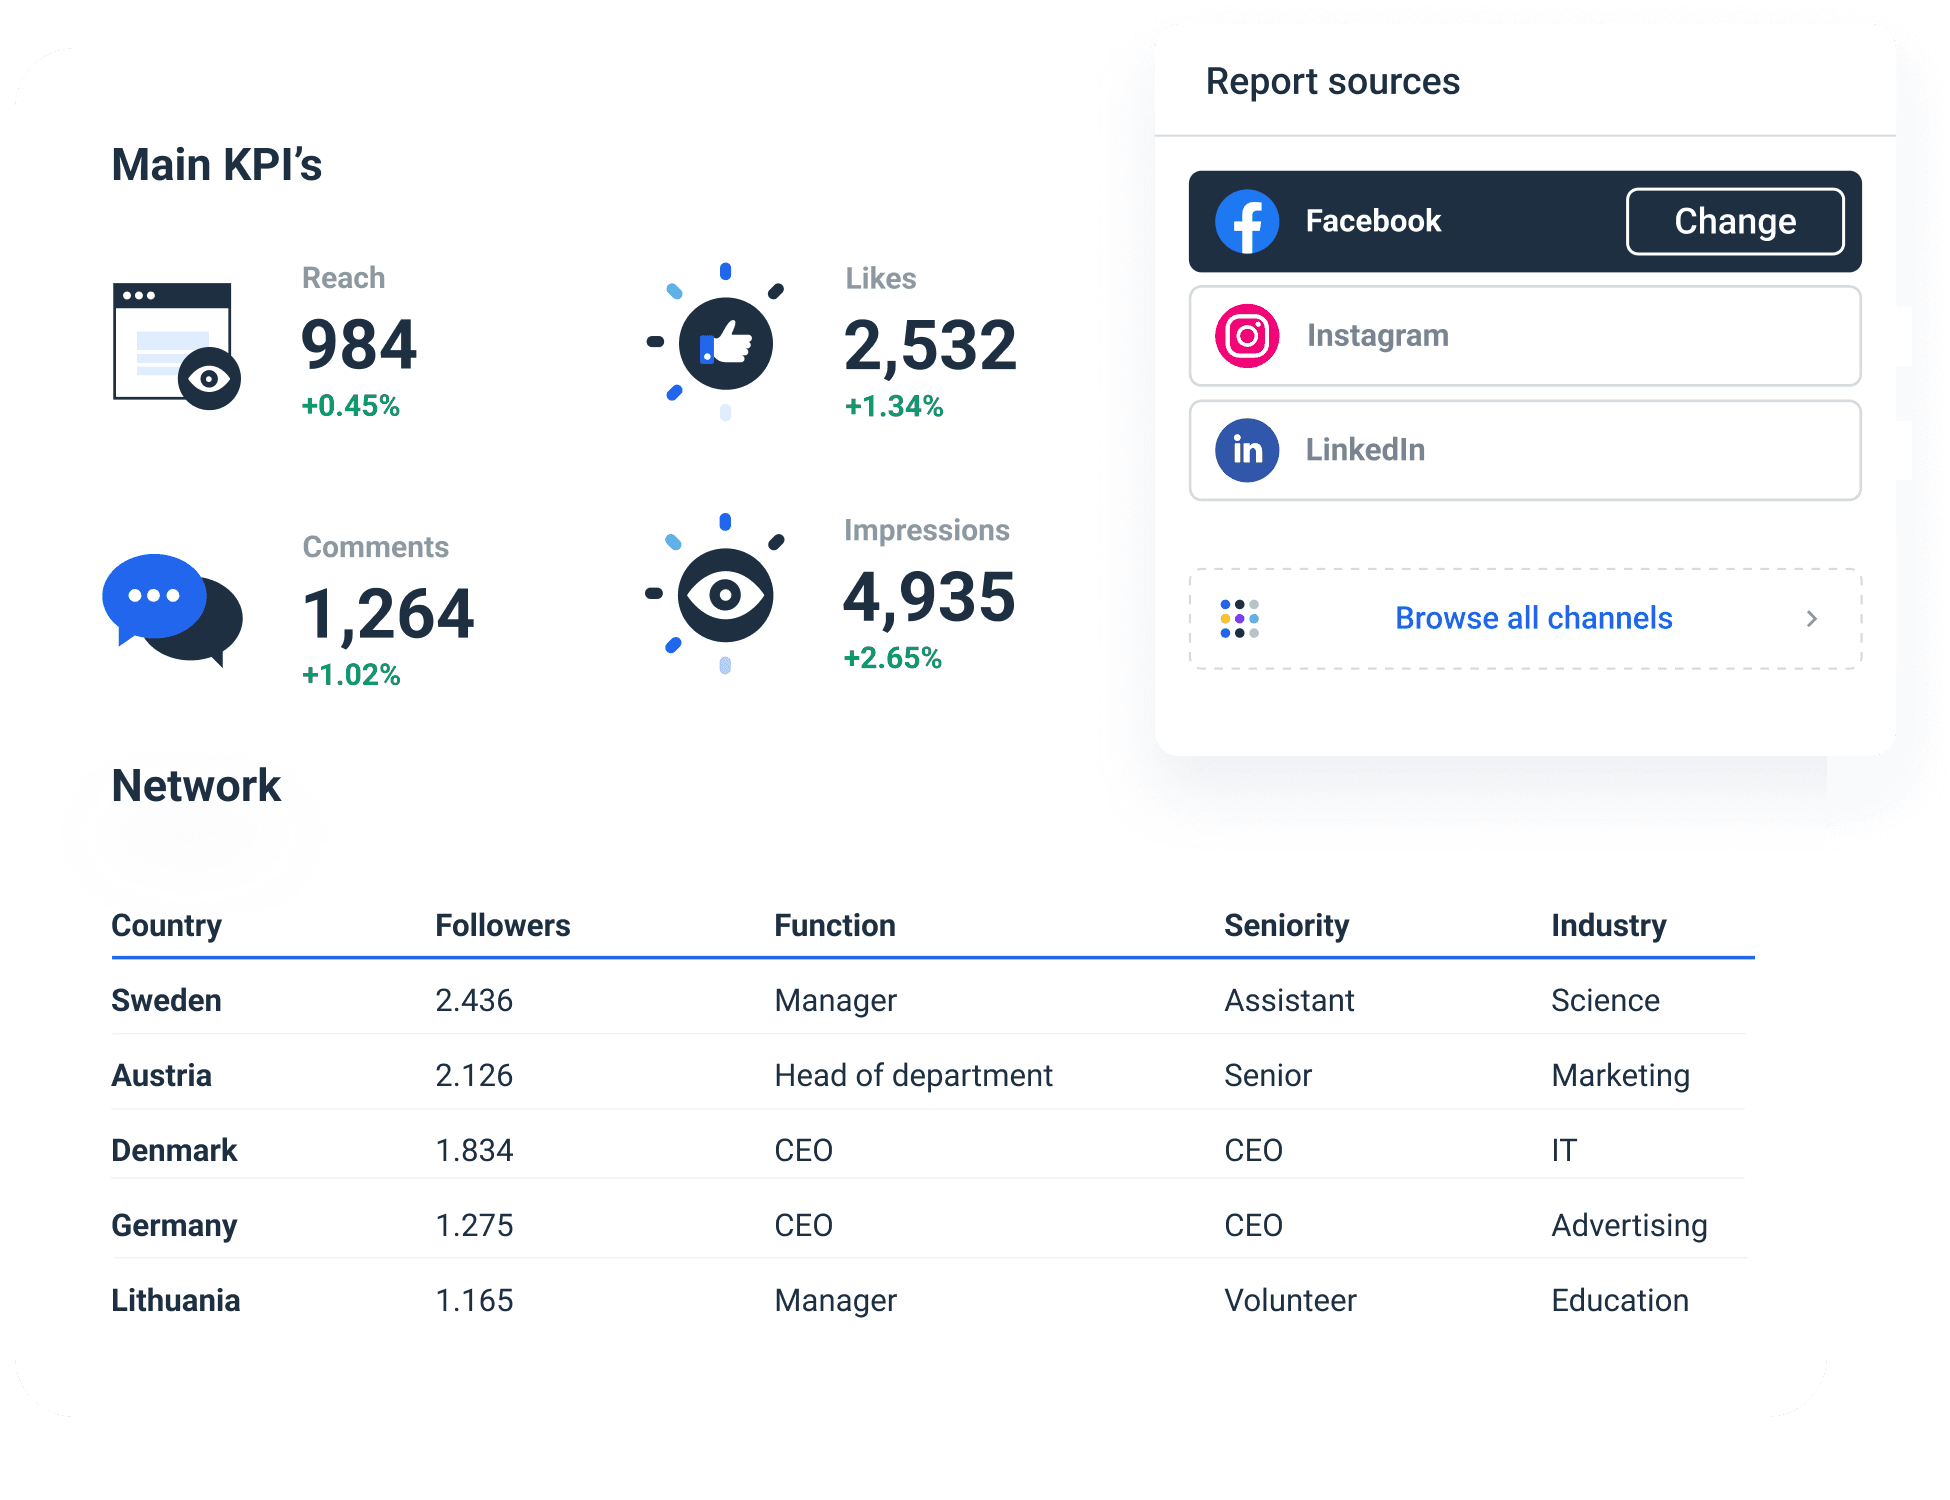
Unlike most individuals and agencies believe, social media analytics and metrics go further than viewing and tracking website traffic on the platform. It even goes deeper than having many followers. So much is involved in social media tracking, and that is where KPIs play a greater role. Here are some social media KPIs used for tracking social media performance.
How to Choose Which Metrics to Track?
There is no such thing as a "one-size-fits-all" KPI. However, the metrics we are going to mention later are the ones that provide the most in-depth and accurate insights into the performance of your social media efforts and marketing strategies.
Marketing agencies should consider the KPIs that best examine their initiatives when determining which ones to track.
Whatever KPIs you choose to track, they must meet the SMART criteria. You should keep an eye on the following KPIs:
- Specific
- Measurable
- Achievable
- Relevant
- Timely
This neat acronym is a great way to determine if a KPI actually makes a difference or if it’s just another vanity metric that looks good on a report and is in accordance with the latest algorithms.
Serg Aspidoff, the Founder & CEO of Shoutcart, says they are tracking engagement rate, CTR, and social shares. These three KPIs are the most important ones for a self-serve influencer marketplace.
Keep on reading to find out the most important KPIs for each objective according to us.
Social Media KPIs for Engagement
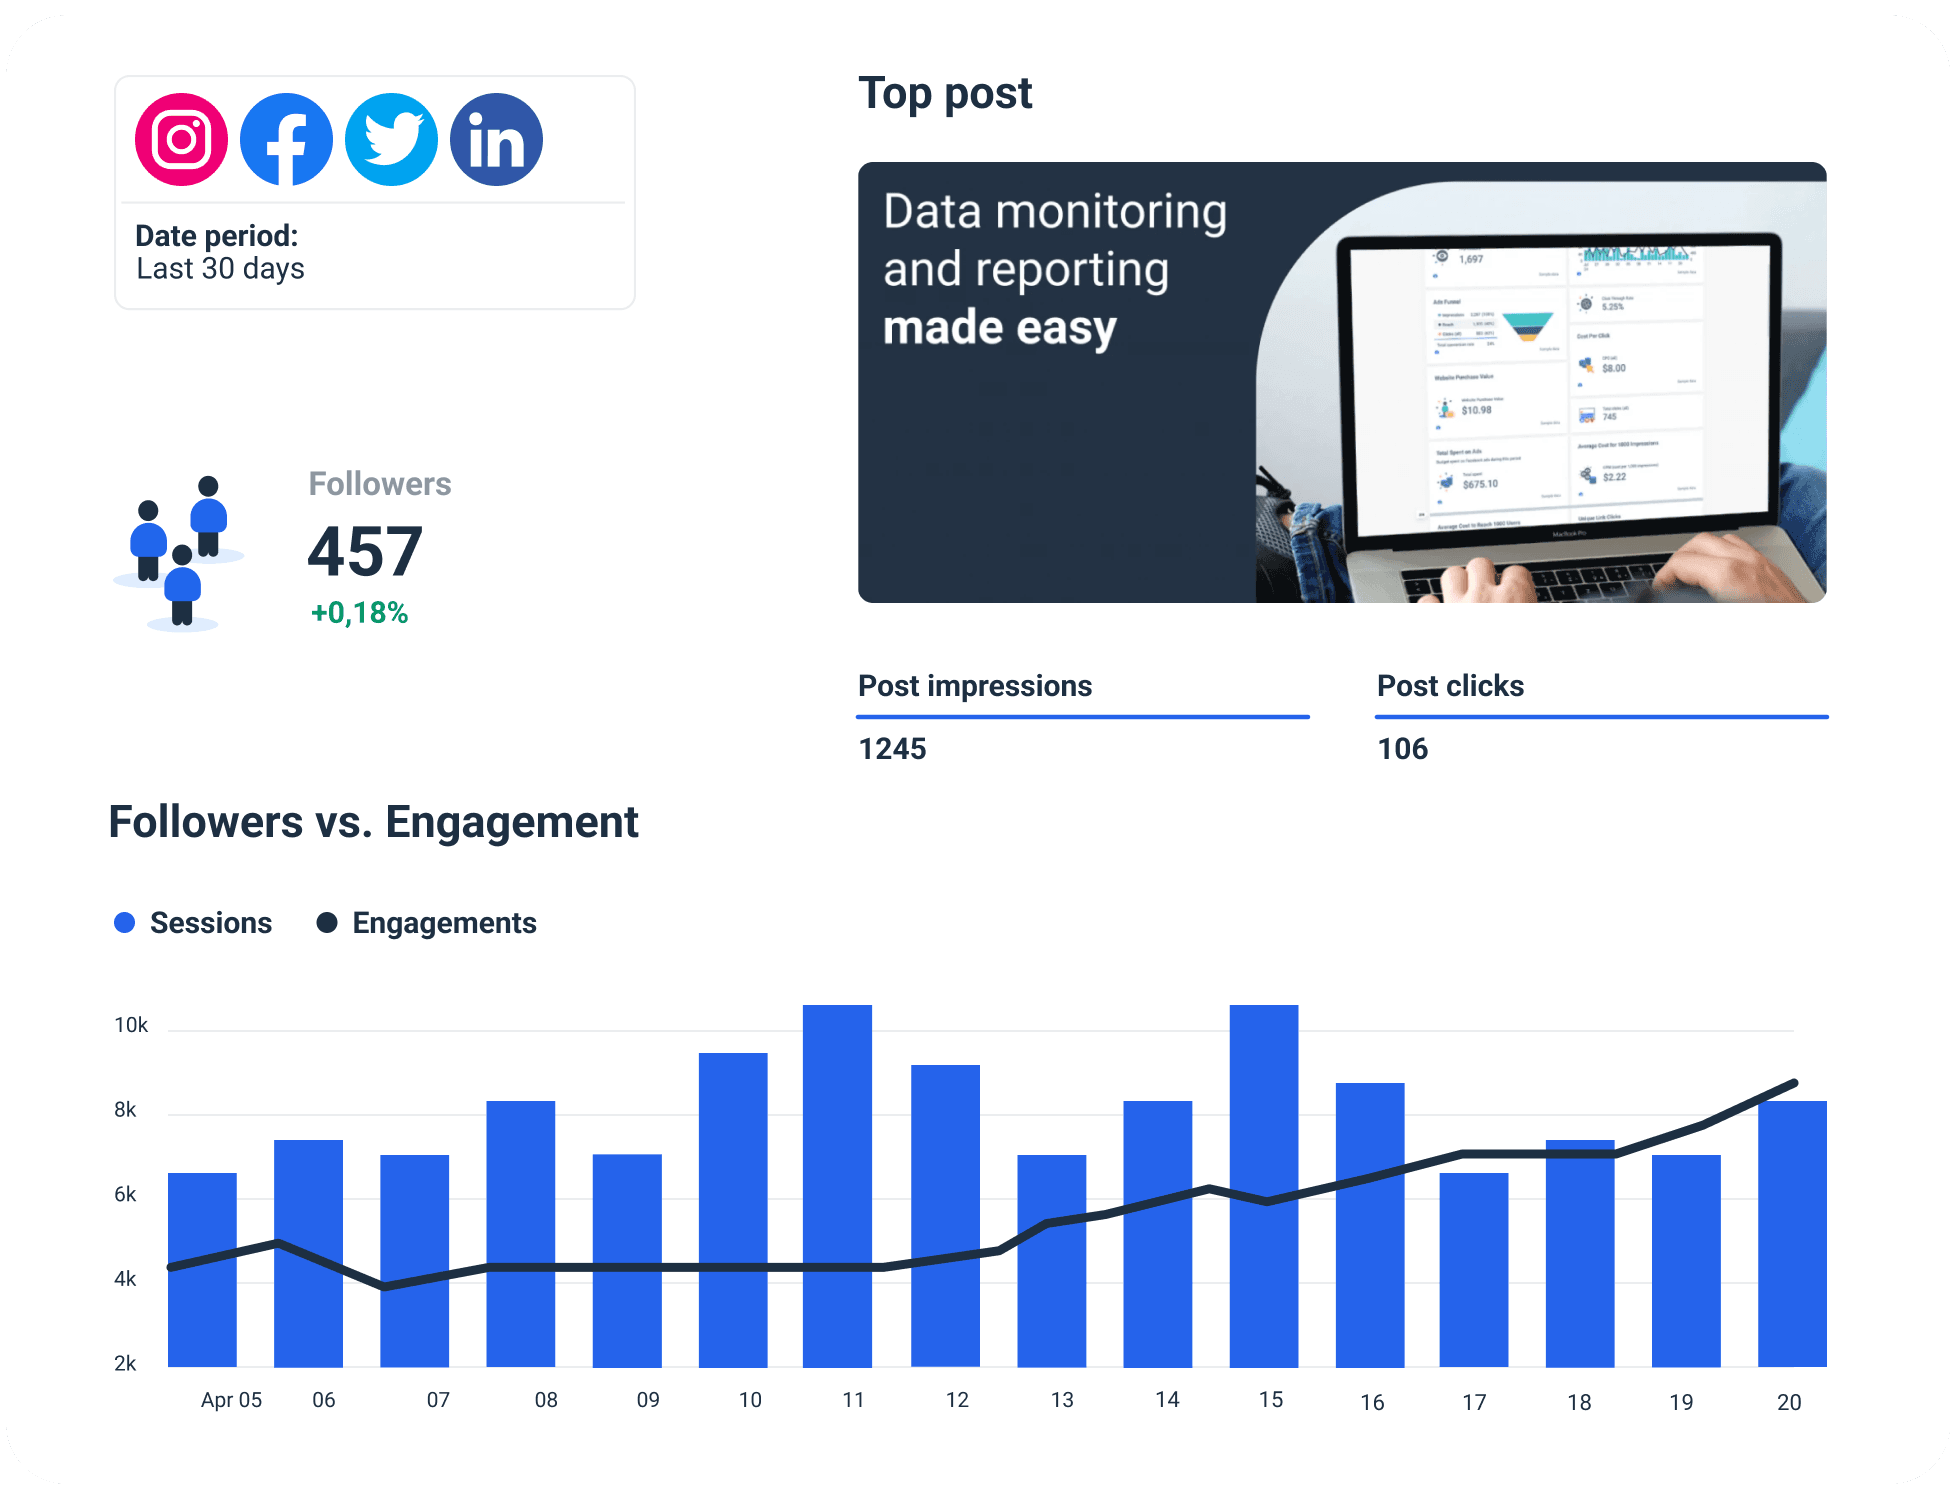
Social media engagement metrics are important because it shows how productive your campaign is; more engagement is good, less means you can do better, and none is bad. Engagement highlights the social aspect of social media by displaying likes, comments, and shares.
1. Engagement Rate
Engagement rate assesses your client's audience behavior and actions in response to the post. This could include things like liking, commenting, or sharing.
It is important to track this KPI because High engagement rates indicate that the content you provide to your client's audience is well received. You can also collect historical data to learn what they like to see and adjust your strategy accordingly.
2. Likes
Likes are the KPI that tracks and counts the number of likes your pieces of content receive from social media users.
More likes on a social media post indicate that your content is of high quality and is well-liked by your audience, and people tend to listen to and follow popular things, with many likes coming from authorities.
3. Clicks
Clicks are a KPI that counts the total number of clicks your client’s post receives. The higher the click number, the better their social media content performs.
4. Comments
Comments are the KPI that tracks and counts the number of comments your client’s pieces of content receive from social media users.
For most people that take their time to leave comments on posts, it means that they are very much interested in what you are selling. The comment section is a very good engagement for getting feedback from your client’s target audience. With many comments comes loyalty.
5. Bounce rate
Bounce rate is the percentage of visitors who click on a link in your social media post and then quickly leave without taking any action. It indicates that your content is not too engaging or the user experience you provided is not great.
6. Shares
Social shares KPI measures and tracks the number of people who shared (retweets on Twitter) your content on their newsfeeds or stories. Depending on the context in which people share your client’s content [as people sometimes call out and criticize the content], it is a great way to learn how many people liked and disliked the post.
It is also a metric that you can use to evaluate your marketing efforts. The greater the number of shares, the more viral your client’s content is and the better job you've done.
Social Media KPIs for Reach
You cannot start making leads or ROI without social media management; the reach of KPIs for social media is integral in social media. A large follower count alone is not enough. You need to connect with the right people, show your client’s business to the right people, and build your reach to increase your client’s social media performance.
7. New Followers
The number of followers is the most basic way to determine how far your reach has spread. It measures and tracks user engagements on your client’s social media accounts and identifies how many new followers they get.
8. Traffic on The Web
Traffic is generated when a user clicks on a link to your client’s website or lands on any of their landing pages from social media channels. Knowing how much web traffic your client’s site gets through social media is a way to know how good their social media reach is.
9. Follower Growth Rate
The rate at which your client's follower list grows is referred to as the follower growth rate. The higher the number, the better. Because the goal is to increase the number of subscribers, every digital marketing agency should monitor this KPI. How will you know if your list is growing or shrinking if you don't track it?
Social Media KPIs for Conversions
Another set of marketing KPIs is social media conversions. This KPI helps to know how many people are brought in as customers through your social media platforms.
10. Revenue From Sales
The terms sales revenue and revenue are frequently used interchangeably. Revenue from sales is defined as income generated from the sale of goods and services. Conversely, total revenue includes profit from sources other than your client’s core business, such as savings interest or dividend payments.
Long story short, revenue from sales is a metric that shows how much money your client’s business generated specifically from sales.
11. Lead Conversion Rate
Conversions from social media refer to the number of times the target audience performs the action outlined in your client’s social media CTA, such as subscribing to a mailing list, making a purchase, visiting a landing page, etc.
12. No-revenue Conversions
This indicates leads that are gotten through social networks.
13. Share of Voice
SoV KPI assesses how popular your client’s company is compared to its competitors. It’s a great metric to calculate when you are just starting to work with a new client and want to find out how their company is positioned in the market.
Marketing agencies usually track online brand mentions, and analyze social media campaigns and the demographics that engaged with them the most.
14. Click Through Rate
The CTR measures the number of people that clicked on your client’s ad. It is usually expressed as a percentage and indicates the number of people likely to click on the ad/link after seeing it.
Social Media KPIs for Loyalty
This KPI is perhaps the most technical of them all. Making a new customer is much easier than keeping an old one. This KPI shows how to know if your client’s customers keep returning for more or if they don't return.
15. Cost for Lead Generation
A lead is a person who has expressed interest in your client’s product or service by achieving a goal.
The cost per lead metric shows how efficient your marketing strategies are at generating new leads at a low cost.
16. Cost per click
As time progresses, if the cost per lead decreases, you are making the right impact by creating customer loyalty.
17. Impressions
Impressions is a social media metric that counts the number of impressions your post received on any or all social channels.
More precisely, it counts the number of times any post was visible anywhere on the user's feed.
18. Return on Investment
Marketing ROI is a technique for determining a company's return on investment from its marketing budget. Simply put, it is the overall value of marketing activity in relation to the money invested in it.
19. Hashtags
Hashtags are KPIs that count how many times a specific hashtag was used in the post and, essentially, your client’s brand awareness.
Brand24 depicts five major hashtag metrics that you can track:
- The number of hashtag mentions
- The number of interactions your hashtag receives
- The social media reach of hashtag mentions
- The most influential authors
- The most interactive authors
The Best Ways to Track Social Media KPIs
If you want to track your client’s social media KPIs effectively, there are a couple of ways to do it.
1. Manually.
This implies manually typing and adding data to reports. Marketers usually use spreadsheets or Excel as documents to keep track of their progress.
Yet, keep in mind that this way is prone to human errors and is time-consuming.
2. From a template.
Whatagraph understands that manually creating reports is inefficient. As a result, we offer a gallery of over 95 ready-to-use templates.
Here is a free social media reporting template to try out now.
3. From a blank page.
You also have the option to use a reporting tool without developing a report from a template.
We offer an option for you to start from scratch, connect your data sources, pull data and optimize the report however you need to.
FAQ:
What Are Social Media KPIs?
KPIs are short for Key Performance Indicators. Social media KPIs are a metric system for measuring how much productivity a person has on social media since it can be confusing to know how much penetration, engagement, conversion and loyalty one gets. KPIs make it much easier to know, and it helps to make users get better when using social media.
What Are the Key Performance Indicators Examples?
A perfect example is the social media KPI for engagement, which shows how to know if your social media platform is engaging enough; if it is, then it is productive. Examples of engagement indicators are comments, likes, shares, and clicks.
How Do You Measure the Effectiveness of Social Media?
You measure the effectiveness of social media by using the different KPIs available and create a social media report template using Whatagraph. Examples of such KPIs are:
- Social Media KPI for Reach
- Social Media KPI for Engagement
- Social Media KPIs for Conversions
- Social Media KPIs for Loyalty
Conclusion
Choosing the proper metrics to track your client’s progress is critical when launching a new Instagram ad, Facebook page promotion or LinkedIn brand awareness campaign. Yet, simply building a list of important social media KPIs and avoiding vanity metrics is not enough. You need to monitor and analyze them with an analytics tool.
If you want to do that in an easy and modern way, you'll need a proper modern and powerful social media reporting tool.
Try Whatagraph for free today and improve your social media strategy with accurate data.
Published on Feb 03 2020
WRITTEN BY
Mile ZivkovicMile is the ex-Head of Content at Whatagraph. A marketing heavy with almost a decade of SaaS industry experience, Mile has managed multiple content marketing teams without losing an ounce of his writing passion.