Social Media Analytics Report: How to Build & Present It (Fast)
Your clients don’t want a firehose of screenshots. They want a tight story: what happened, why it happened, and what you’ll do next.
This guide shows you how to structure a social media analytics report, which metrics to include (and why), and how to build it in minutes for streamlined social media management.

Jan 21 2026●7 min read


- How to Structure Your Social Media Analytics Report
- Which Social Media Metrics Should You Add in Your Report?
- How to Build a Social Media Analytics Report in Minutes With Whatagraph
- How To Conduct Social Media Analysis?
- 6 Best Practices For Creating Social Media Analytics Reports
- What Should You Expect From a Social Media Analytics Reporting Tool in 2025?
In a world where billions of dollars are poured into platforms like Facebook, Instagram, and TikTok, your social media activity is about profit. But how do you prove that?
This definitive guide will show you how to move past surface-level vanity metrics and build a structured, actionable report that clearly links your social efforts to your business objectives.
We'll give you the formula for structuring your report, a breakdown of the key metrics that matter, and a step-by-step process for generating your next report in minutes using Whatagraph IQ.
How to Structure Your Social Media Analytics Report
A well-structured social media analytics report is about answering three questions clearly and sequentially for your stakeholders:
- What happened? (The social media data)
- Why did it happen? (The analysis)
- What should we do next? (The action plan)
Each section of your report should map back to those questions, and to your business or client goals.
Here’s a simple, proven structure marketers use:
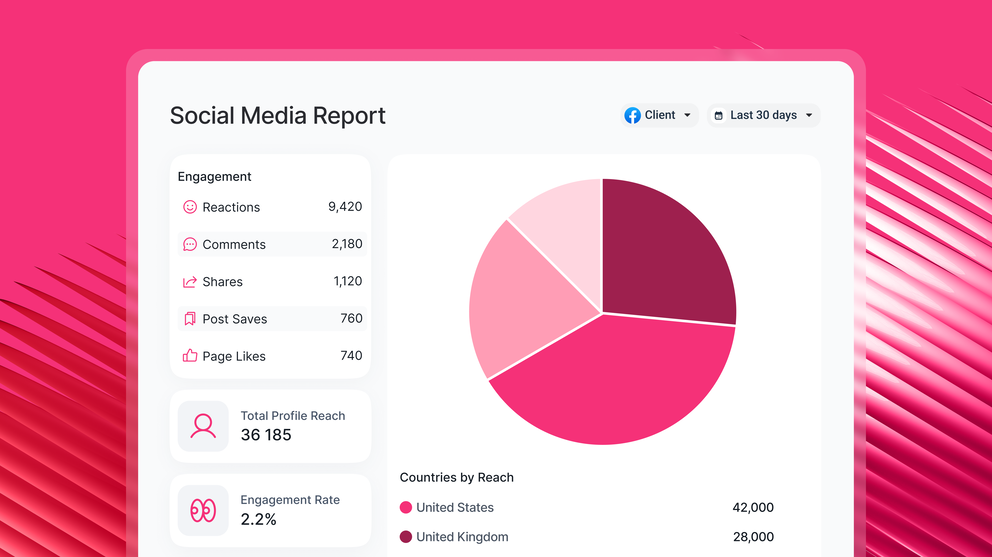
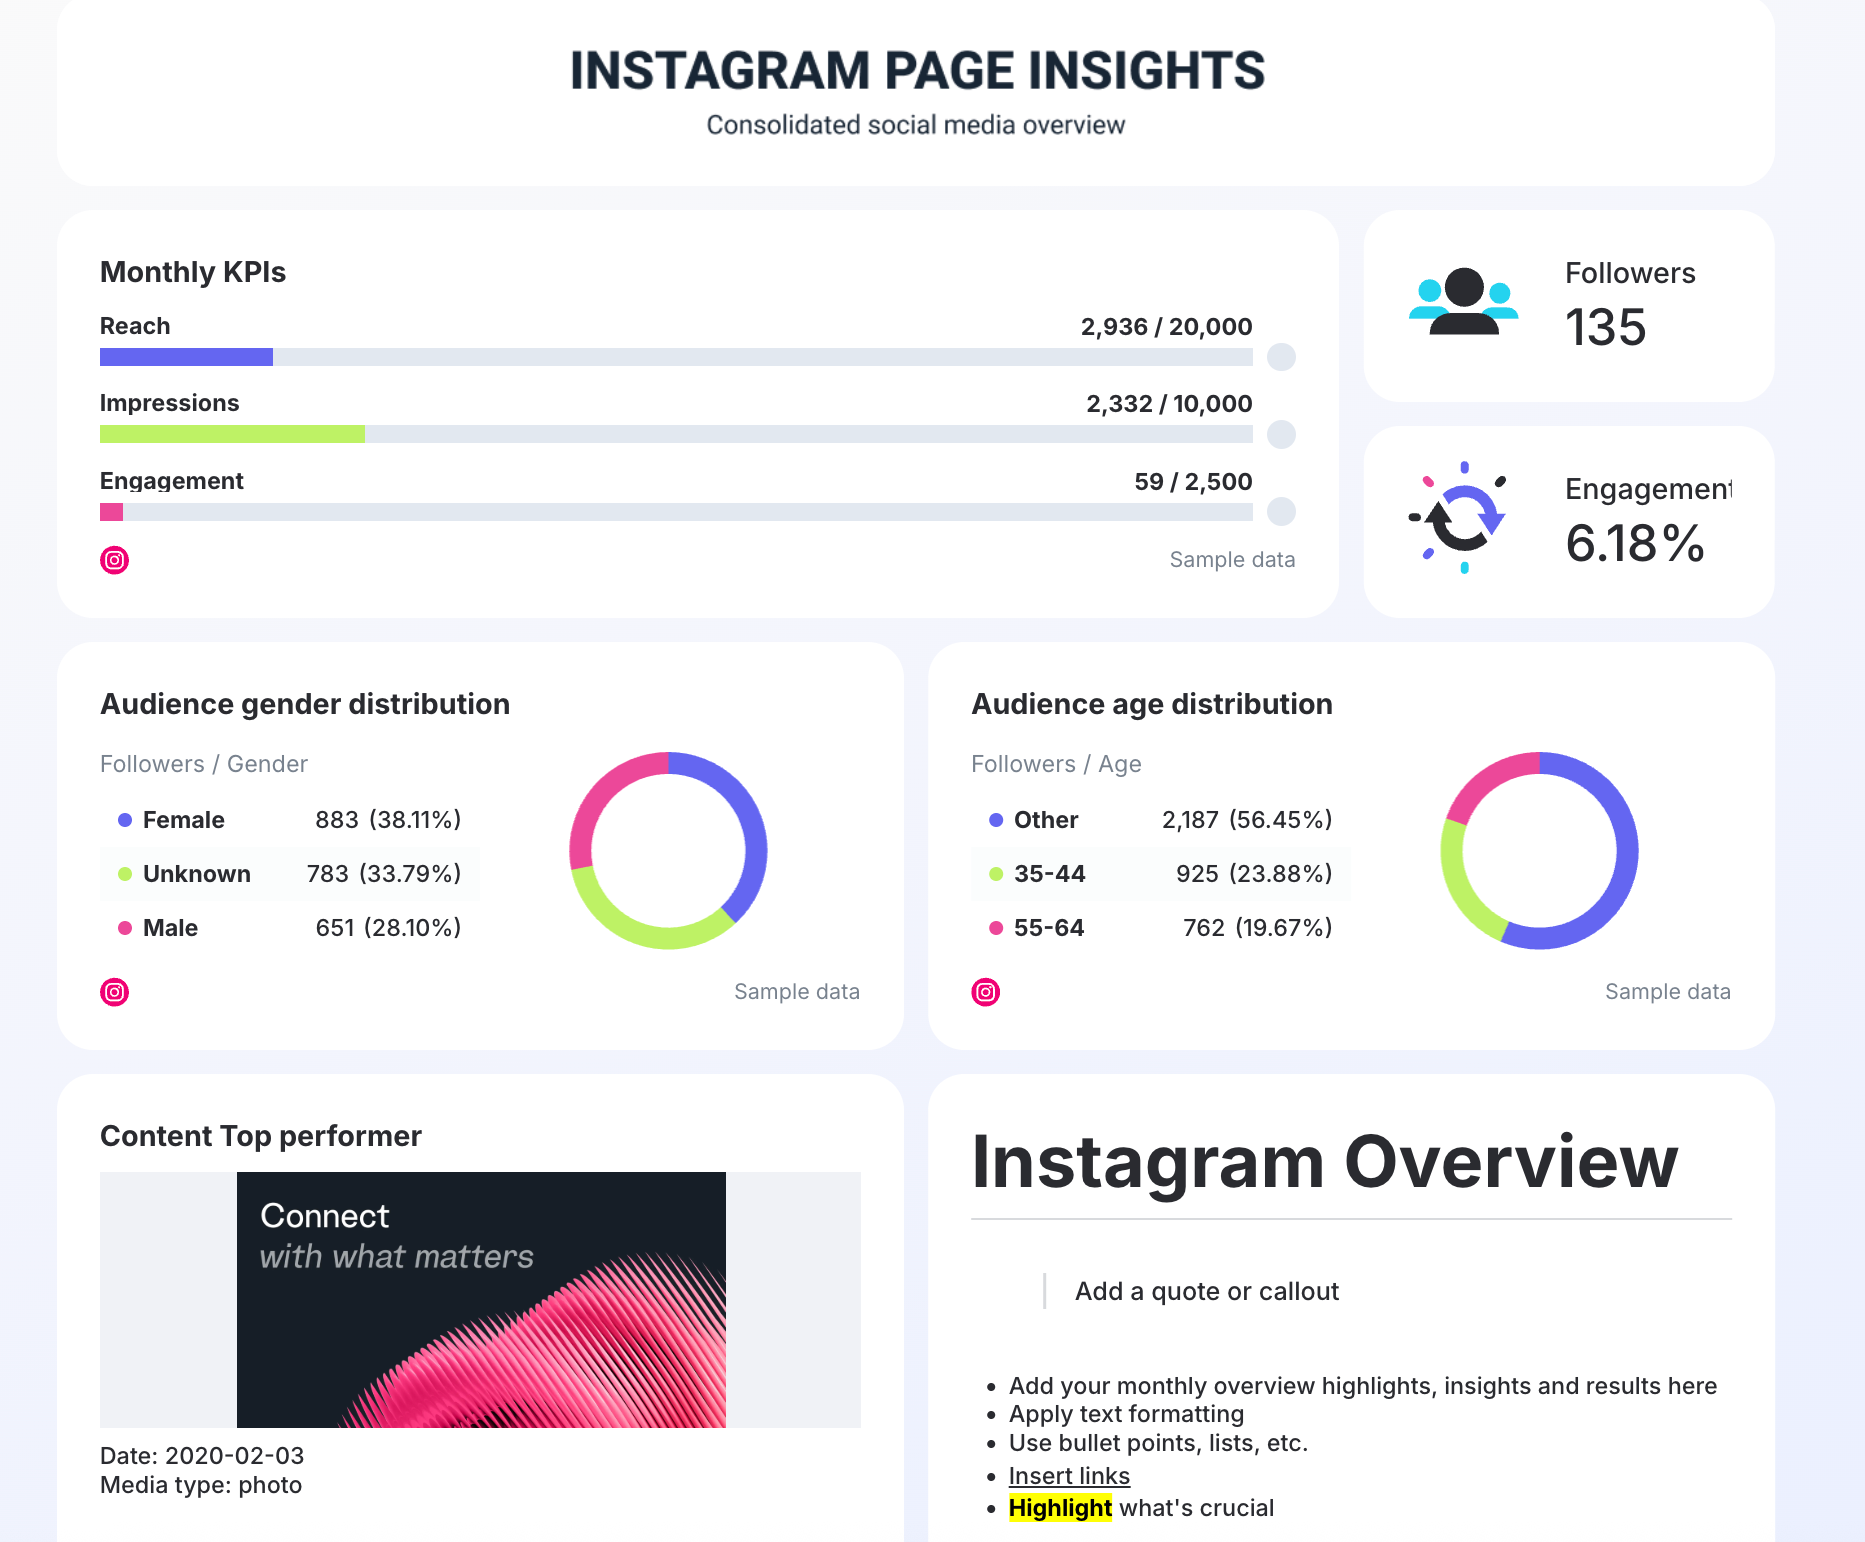
1. Executive summary/Overview
Purpose: Give a quick overview for busy stakeholders.
Include top KPIs, performance highlights, and one-line takeaways (e.g. “LinkedIn social media engagement rate grew 17% MoM thanks to carousel posts.”)
Like what you see? Use this social media report template right away for free.
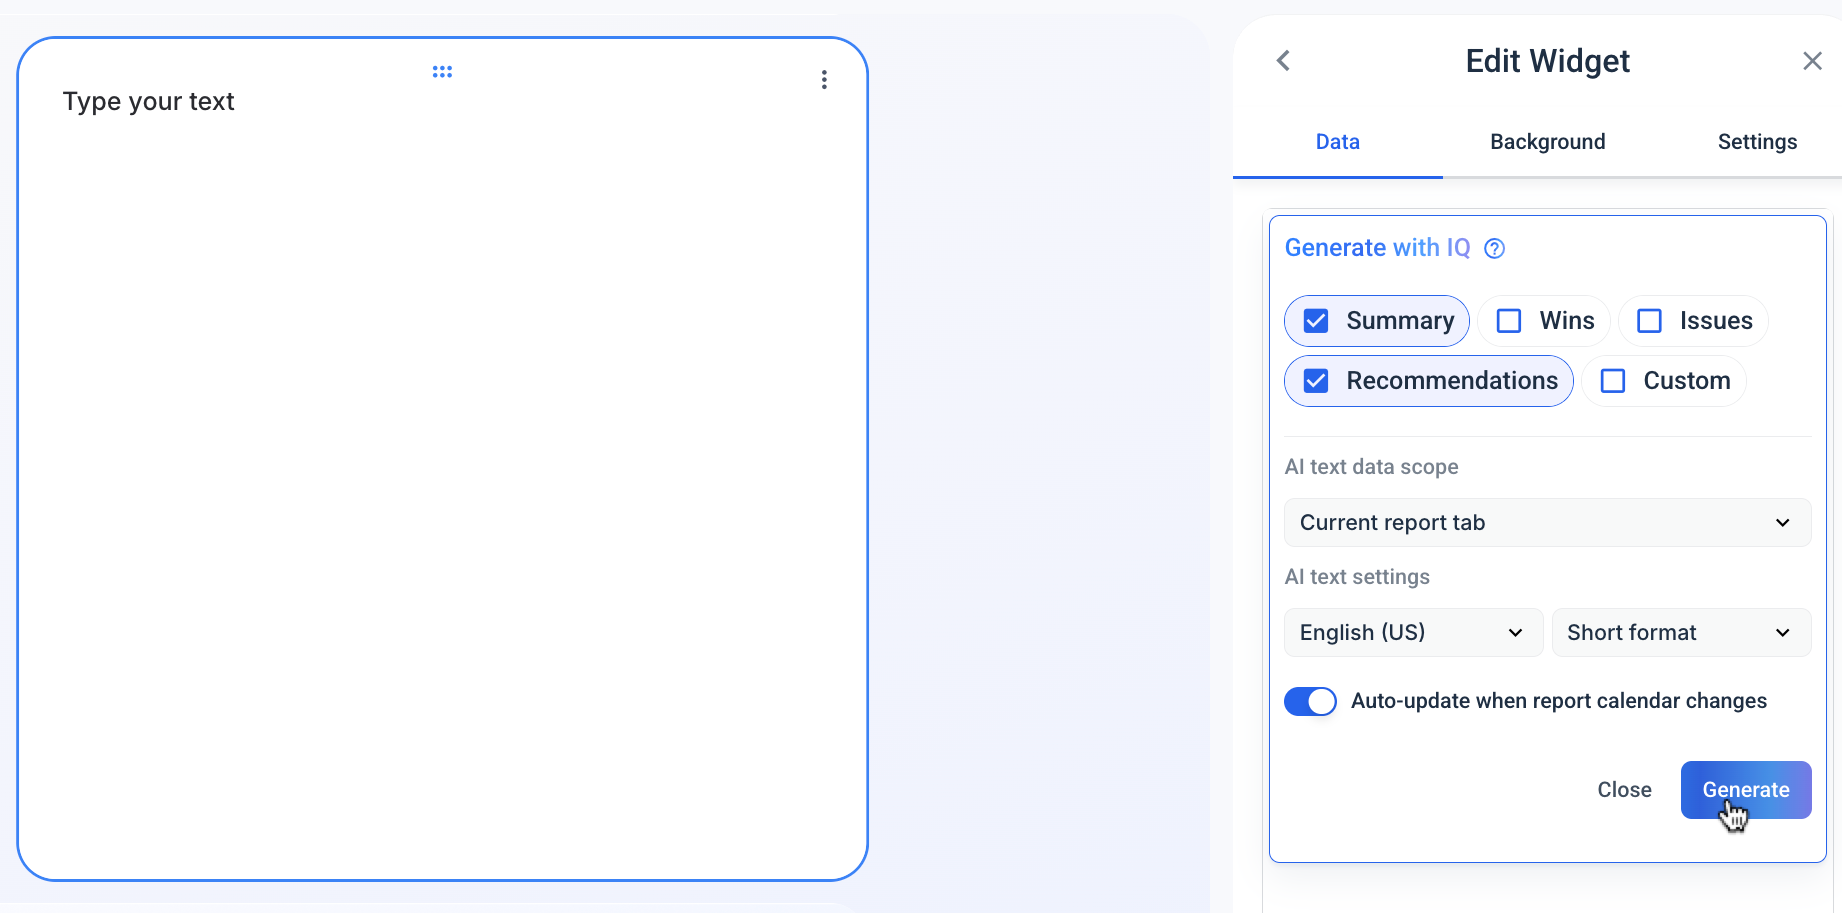
Use Whatagraph IQ to generate this section automatically: click Generate with IQ > Summary + Wins + Issues, and the AI will pull trends straight from your connected data.
When IQ writes insights or summaries, you can edit the text directly inside the widget. Use short, declarative sentences and align them with your client’s tone (e.g., formal for agencies, casual for internal reports).
2. Goals and KPIs
Purpose: Reconnect the report to strategic outcomes.
Group your KPIs under key goals like:
- Awareness: Reach, impressions, follower growth.
- Engagement: Engagement rate, reactions, shares, comments.
- Traffic: Clicks, sessions, CTR.
- Conversions: Leads, purchases, assisted conversions
Each goal should have 2–4 core metrics. Add color-coded trend arrows or benchmarks to show direction quickly.
Here’s how to build that “Goals and KPIs” section directly inside Whatagraph:
1. Create a new tab for each goal.
- Click +Add > Blank tab.
- Rename it “Awareness,” “Engagement,” “Traffic,” or “Conversions.”
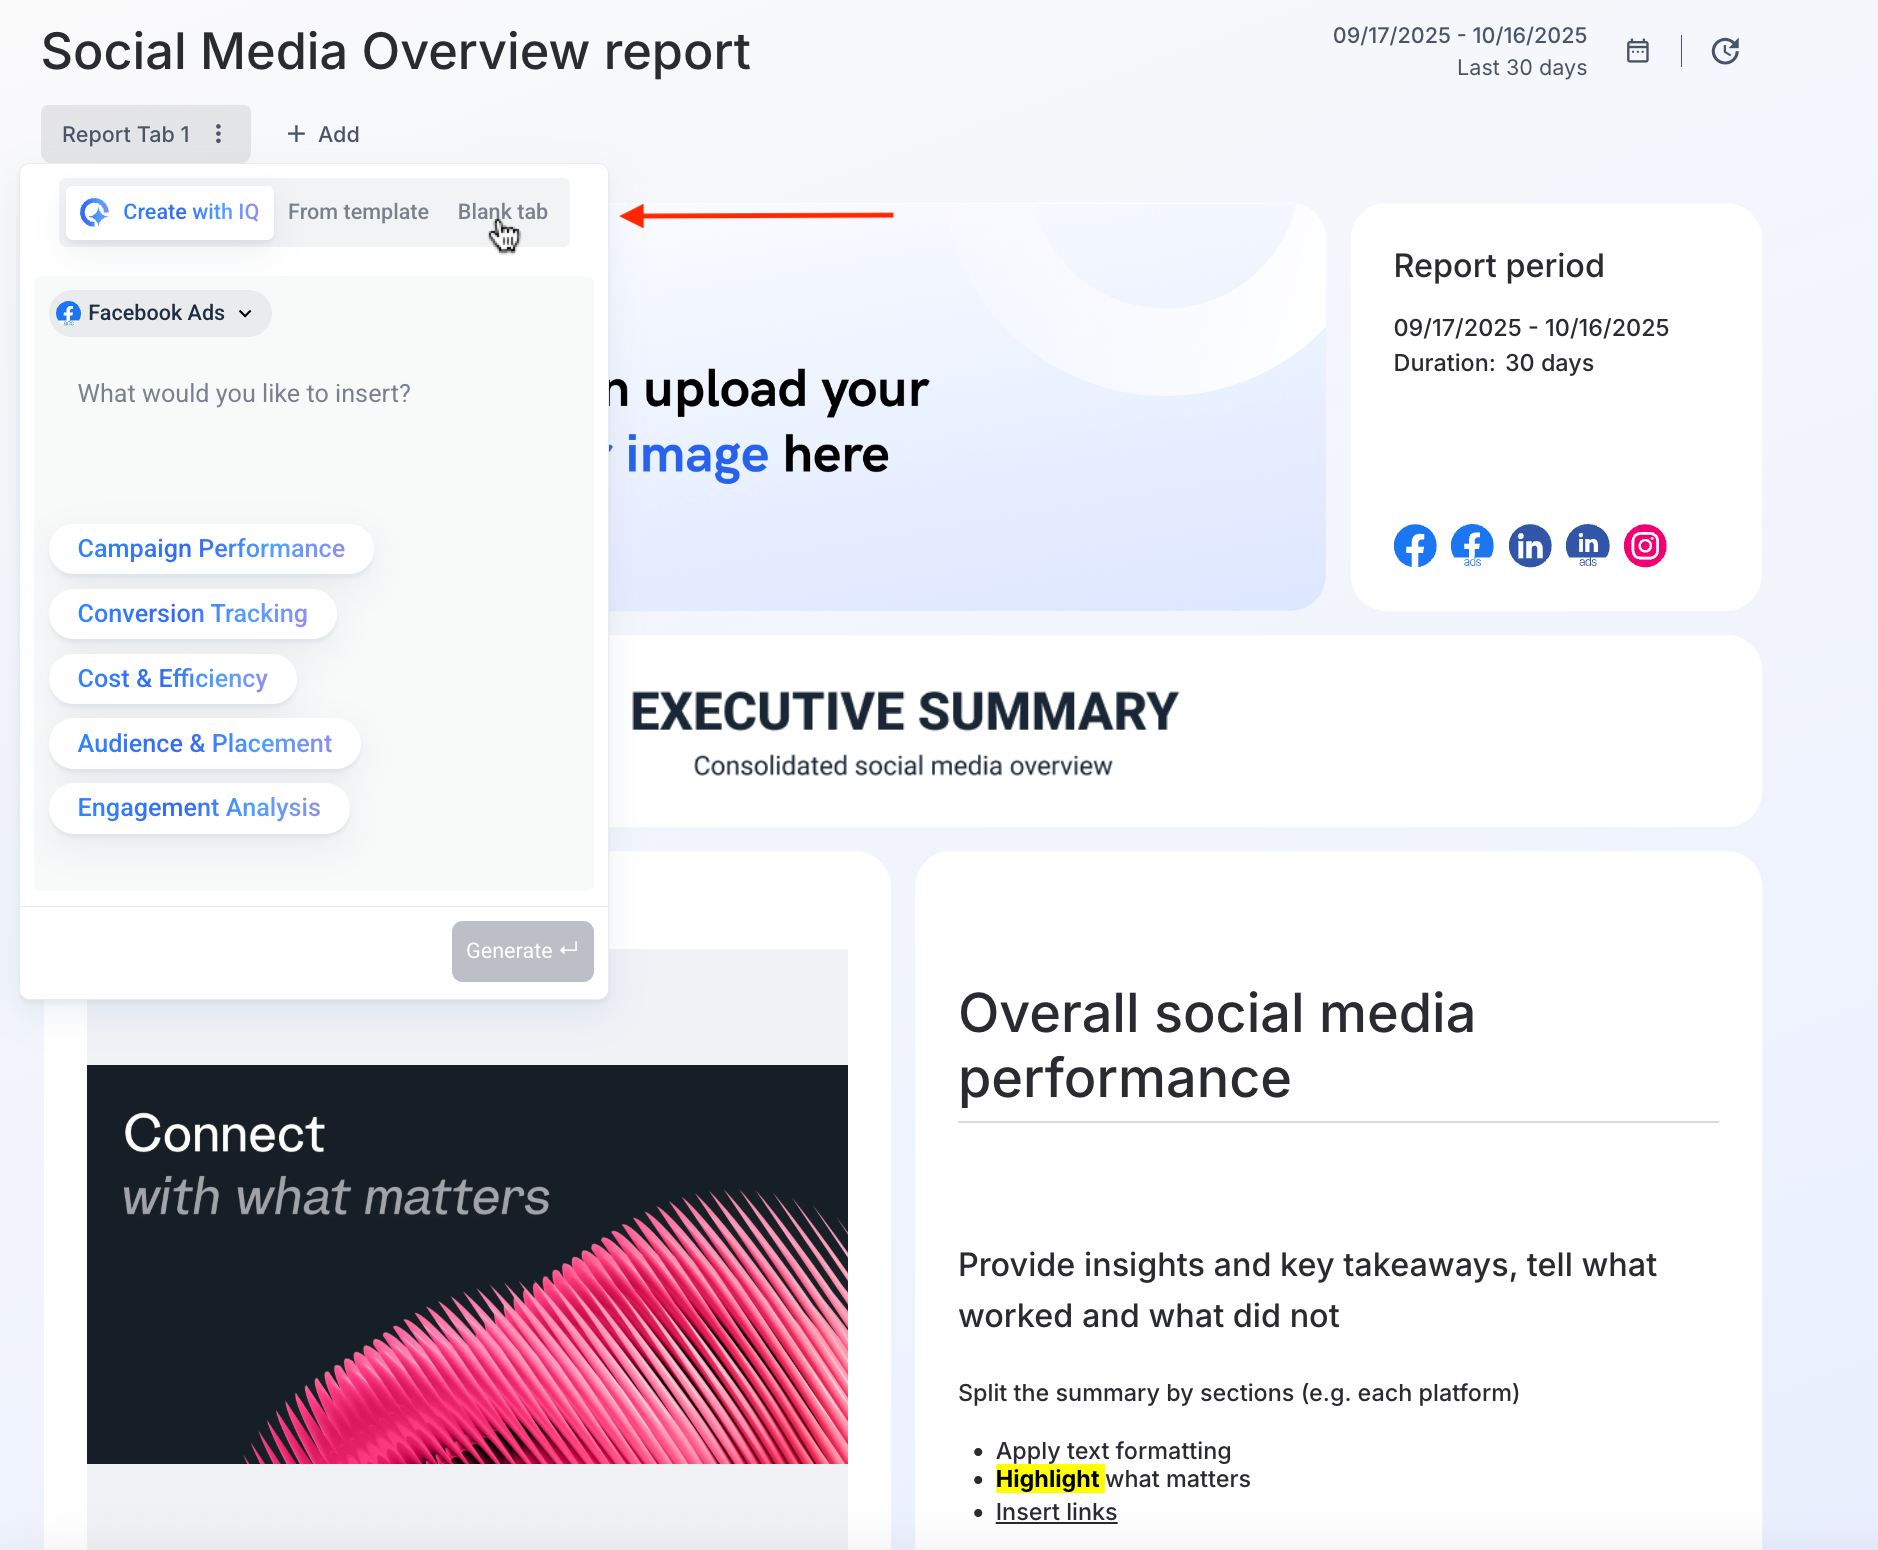
This gives you clear visual separation between funnel stages or content objectives.
2. Add your core widgets
Inside each tab, drag and drop metric widgets from your connected sources (GA4, Meta, LinkedIn, TikTok, etc.).
Or use our plug-and-play social media report format.
3. Unify your metrics and dimensions for consistency
Cross-channel naming can get messy fast: “Clicks” on Meta, “Link Clicks” on LinkedIn, “Sessions” in GA4—all technically mean the same thing but won’t line up in a single chart.
Whatagraph’s Organize features (powered by IQ Plus), fixes that automatically.
Option 1: Standardize with custom metrics.
- Go to Organize > Metrics.
- Create a unified KPI name (e.g. “Website Clicks”) that blends metrics from multiple platforms.
- Use simple formulas or drag-and-drop fields to merge them.
- Once defined, the metric automatically updates across every connected report.
Option 2: Clean up naming with IQ Dimensions.
- In Organize > Dimensions, select the field you want to standardize, like Campaign Name or Ad Group.
- Click IQ dimension.
- Pick your social media channel (e.g., Facebook Ads) and field (e.g., Campaign Name or Date).
- In the Prompt box, tell IQ how to organize your data—e.g., “Label campaigns with ‘Brand’ in the name as Brand Campaigns.”
- Click Run, review the result, and select Create Dimension.
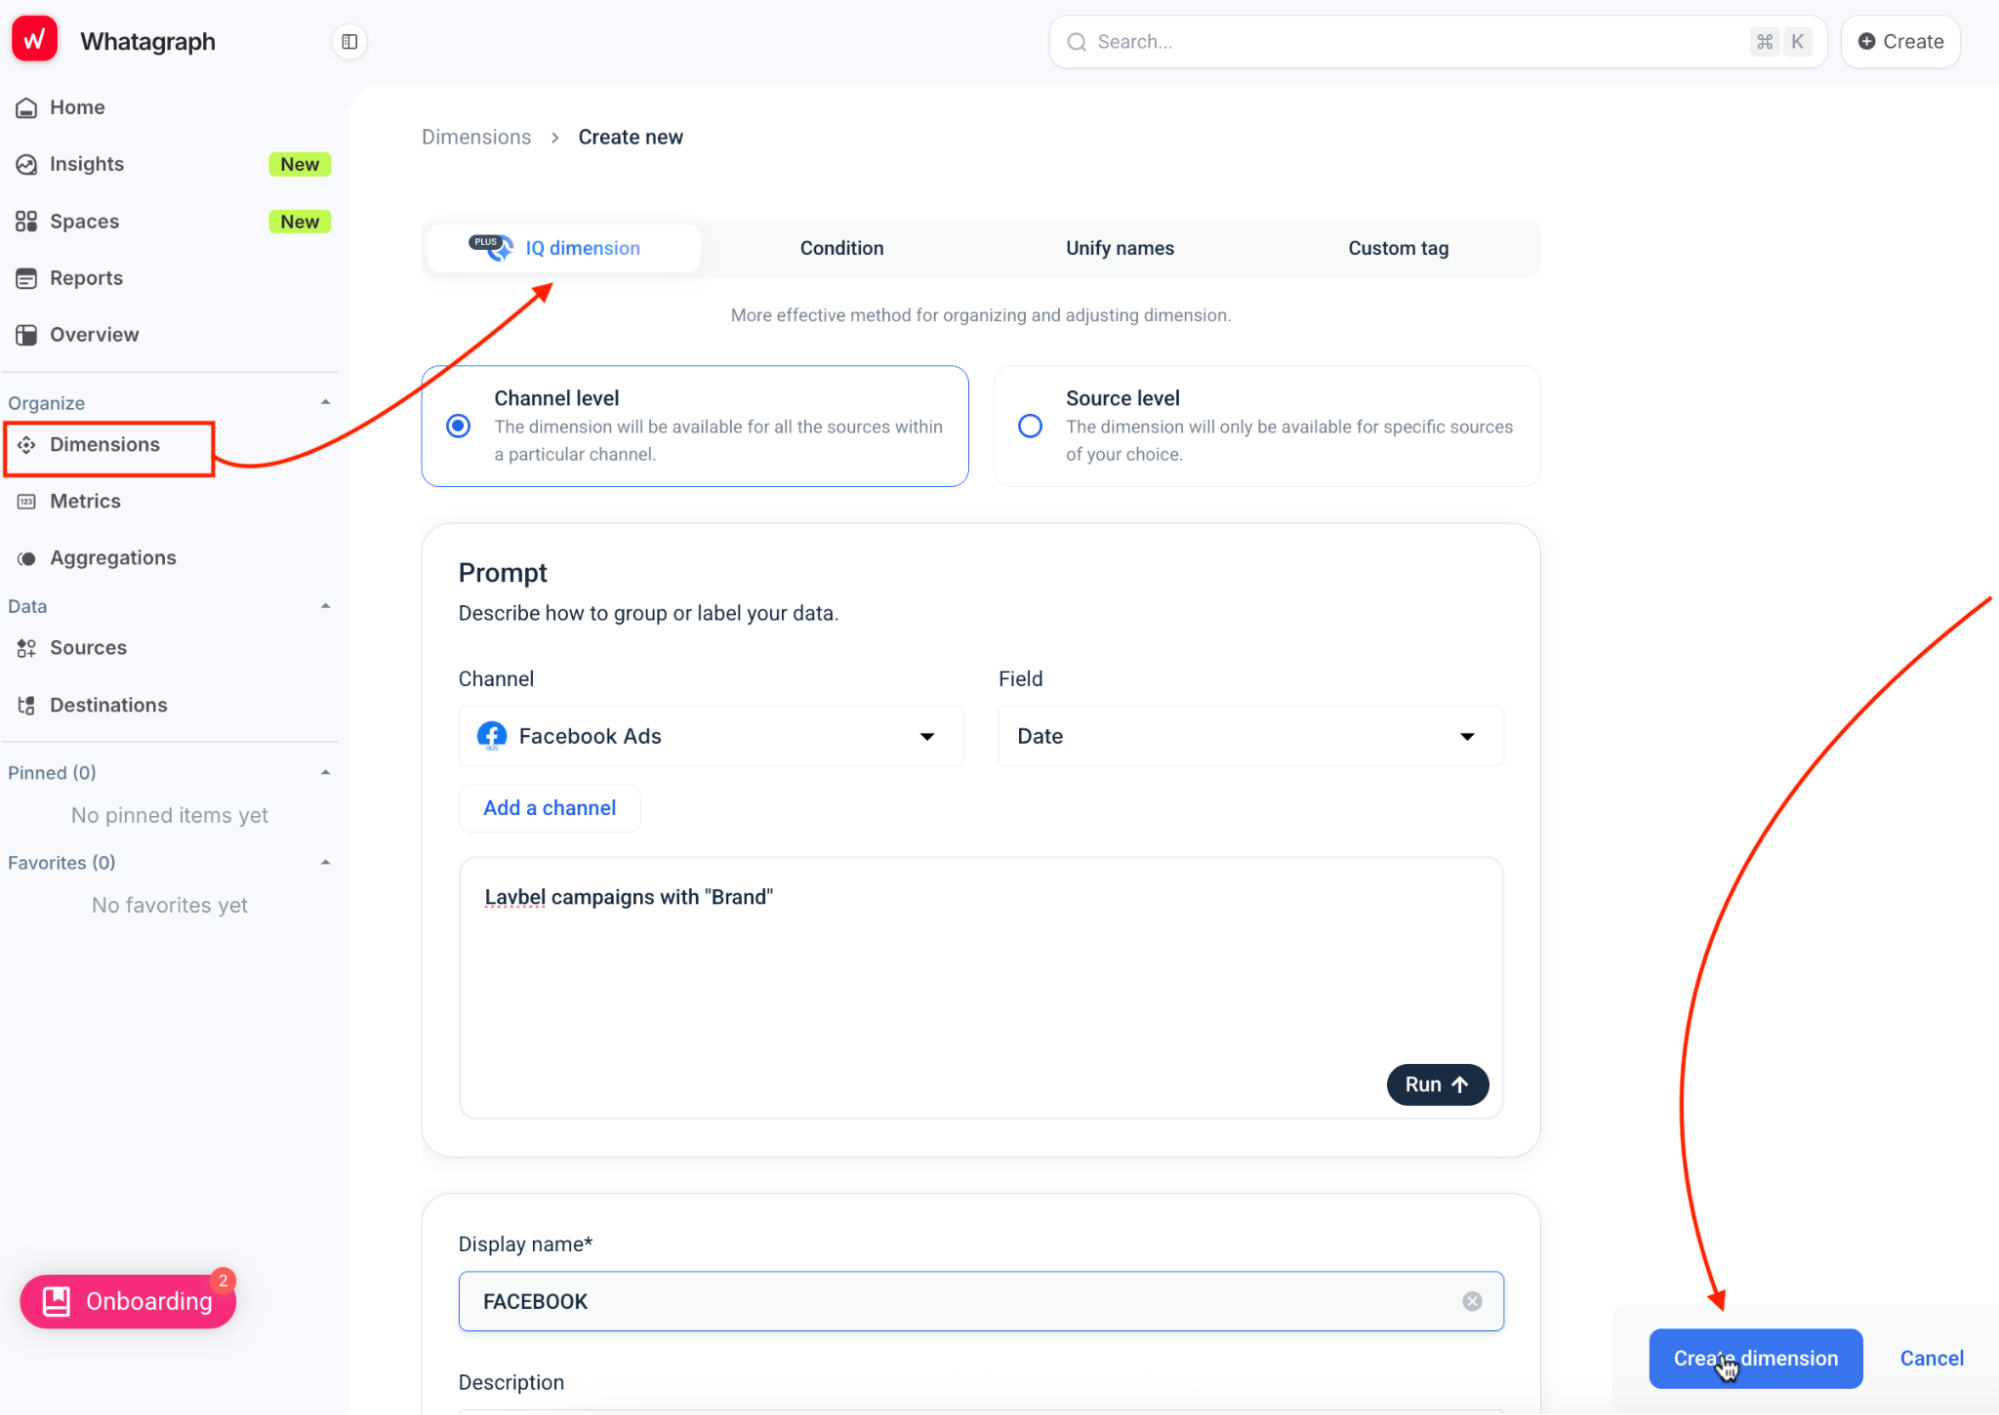
IQ analyzes the data and creates a new custom dimension, grouping your entries consistently. This saves hours of manual editing and ensures your dashboards stay clean across all data sources.
Whatagraph power tip: You can do this at either the channel level (applies across all Facebook Ads data, for example) or source level (applies to one specific account).
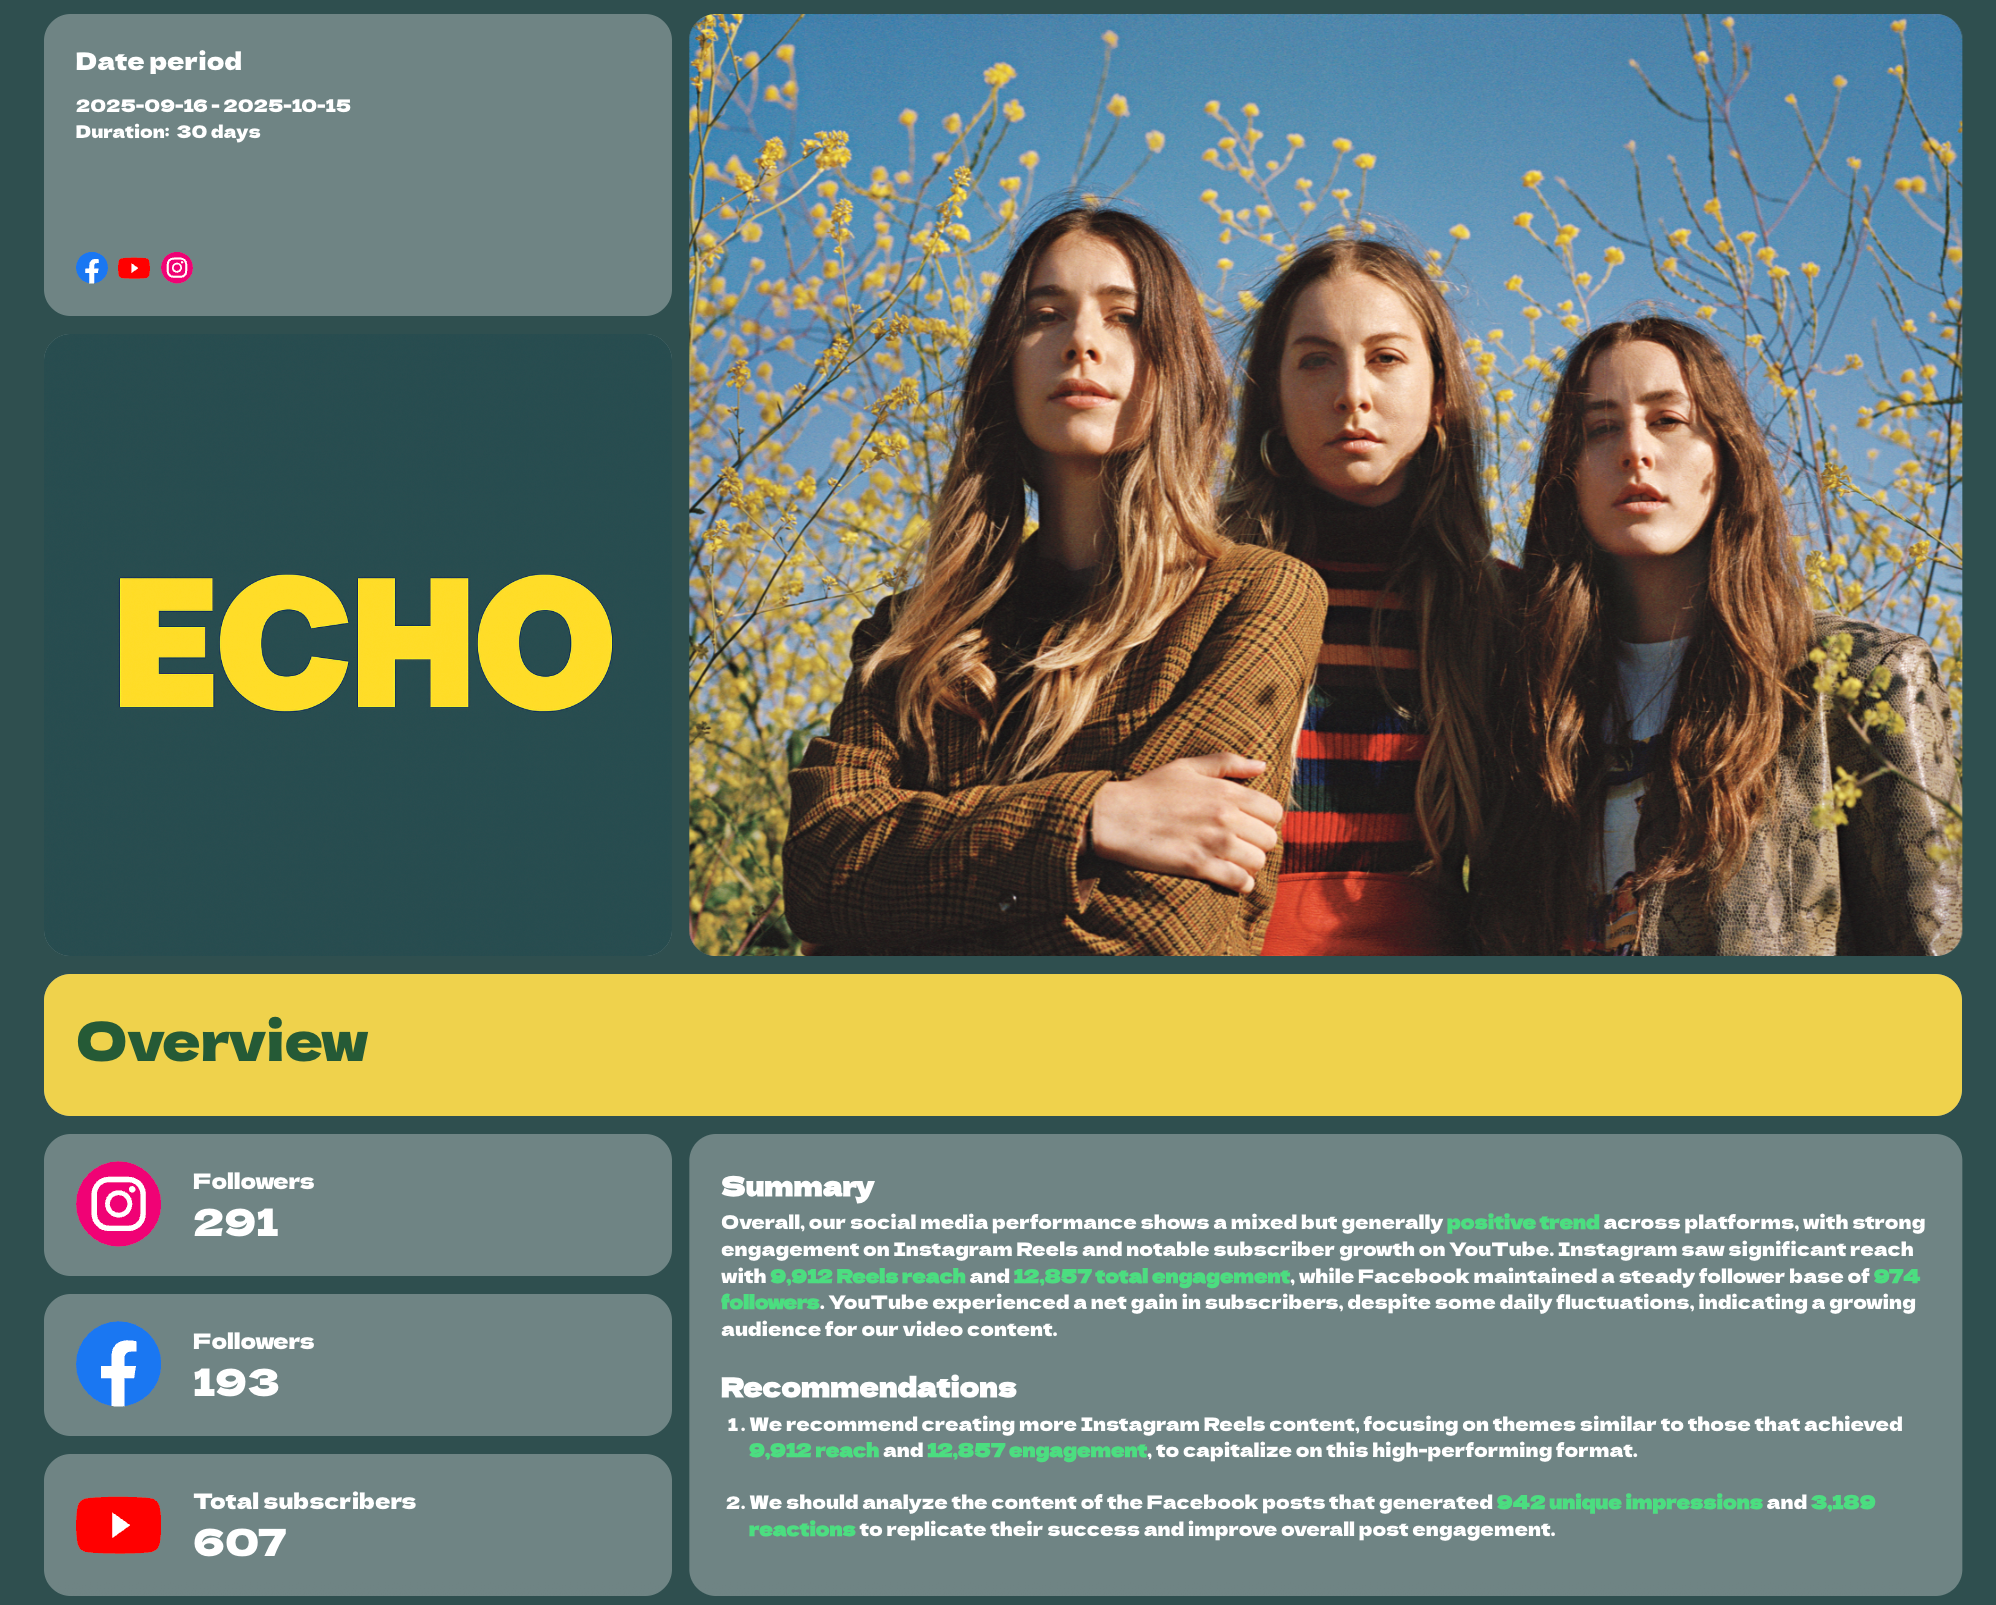
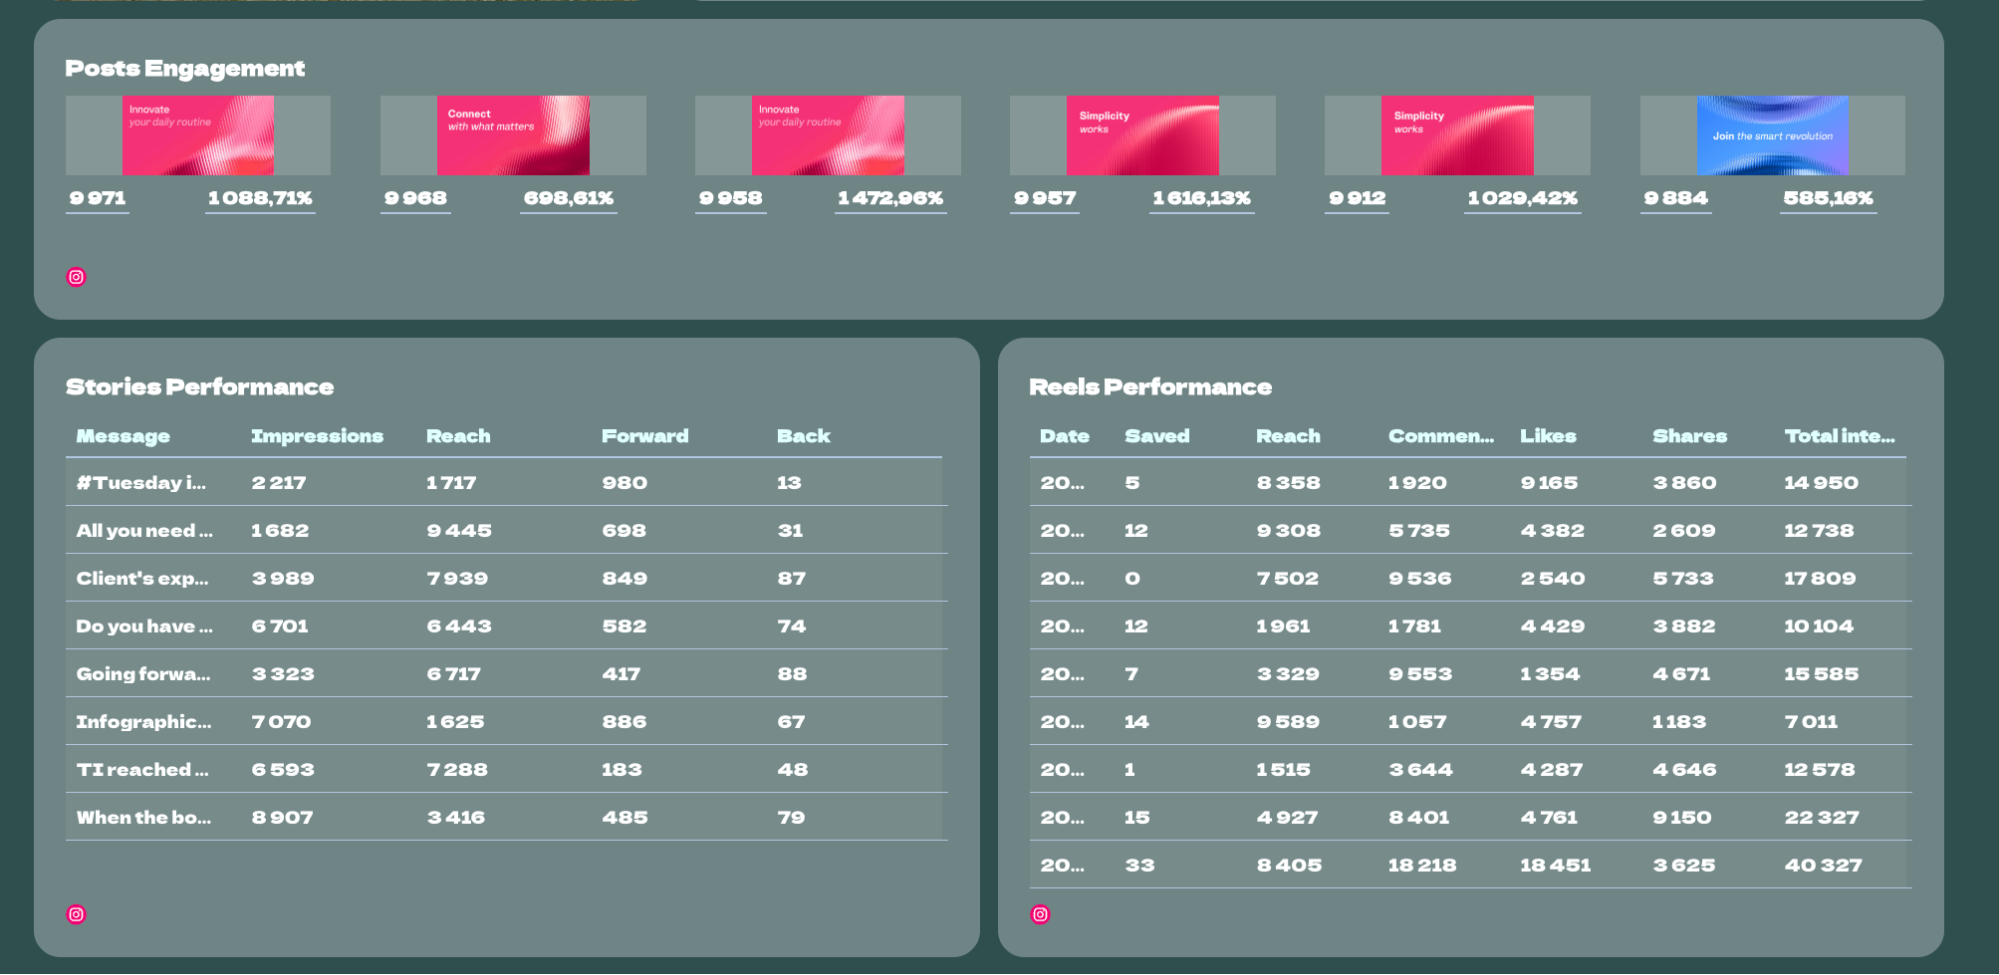
3. Channel performance
Purpose: Show how each platform contributes to results.
Instead of cramming all your networks into one table, dedicate a separate Whatagraph report tab for each platform (Instagram, TikTok, LinkedIn, X, Facebook, YouTube, etc.). This layout makes it easy for stakeholders to scan performance channel by channel while still seeing unified metrics in your summary tab.
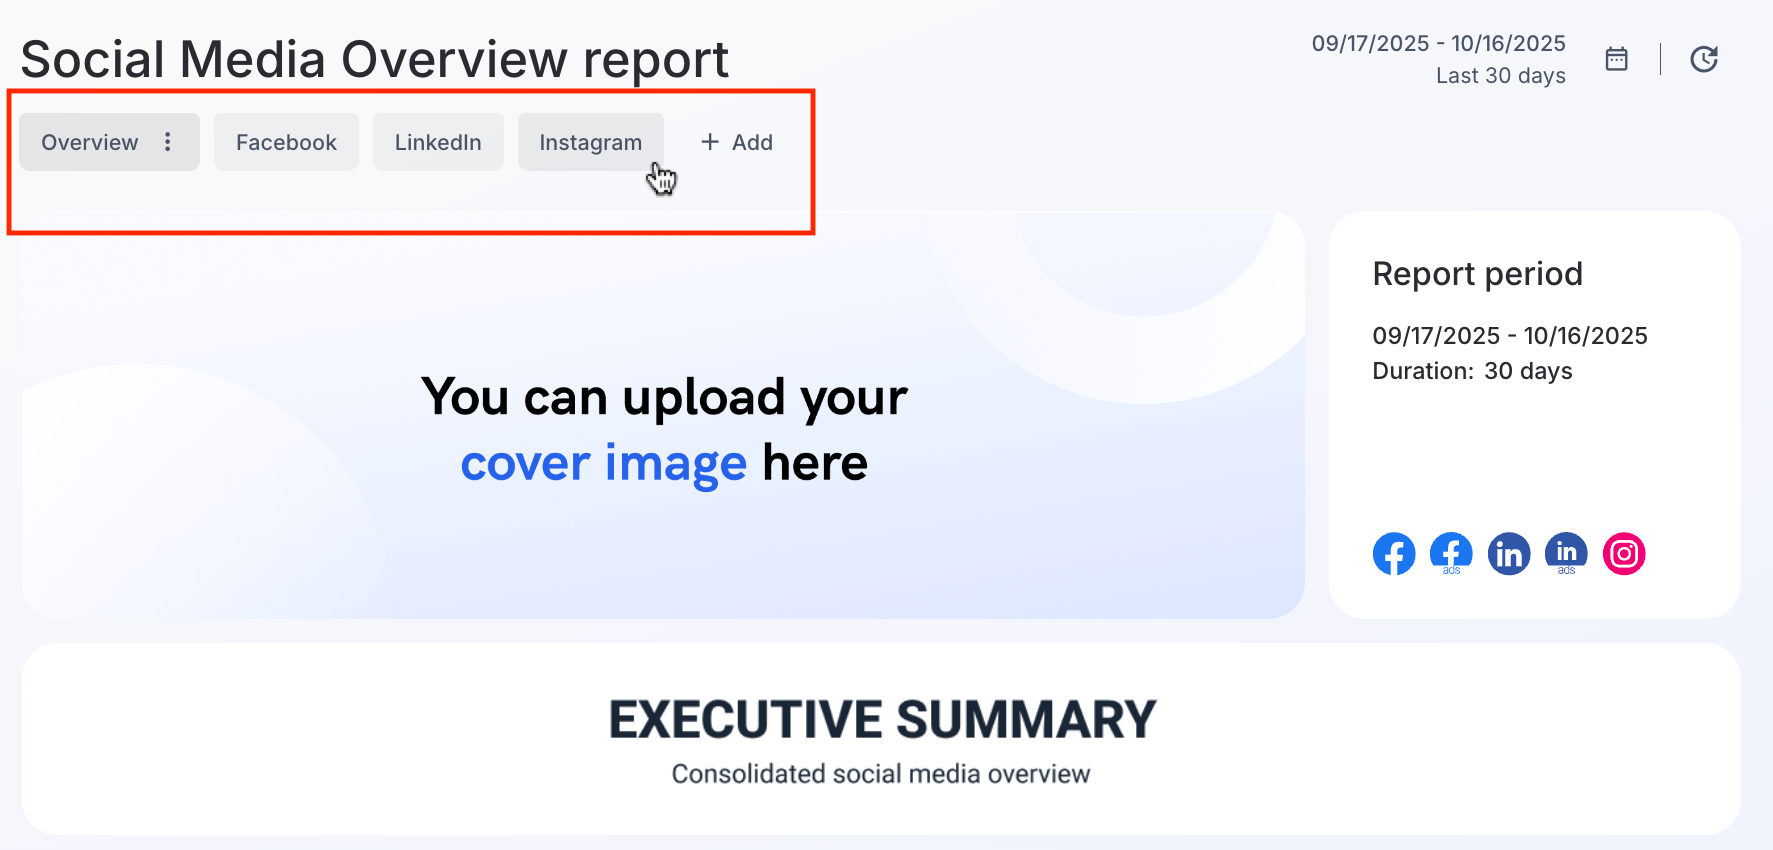
Each tab can include:
- Top-performing social media posts (auto-pulled by Whatagraph).
- Engagement breakdown by format (video, carousel, story, etc.).
- Audience growth and demographics.
- Spend and ROI for paid initiatives.
Here’s what to include in each channel tab:
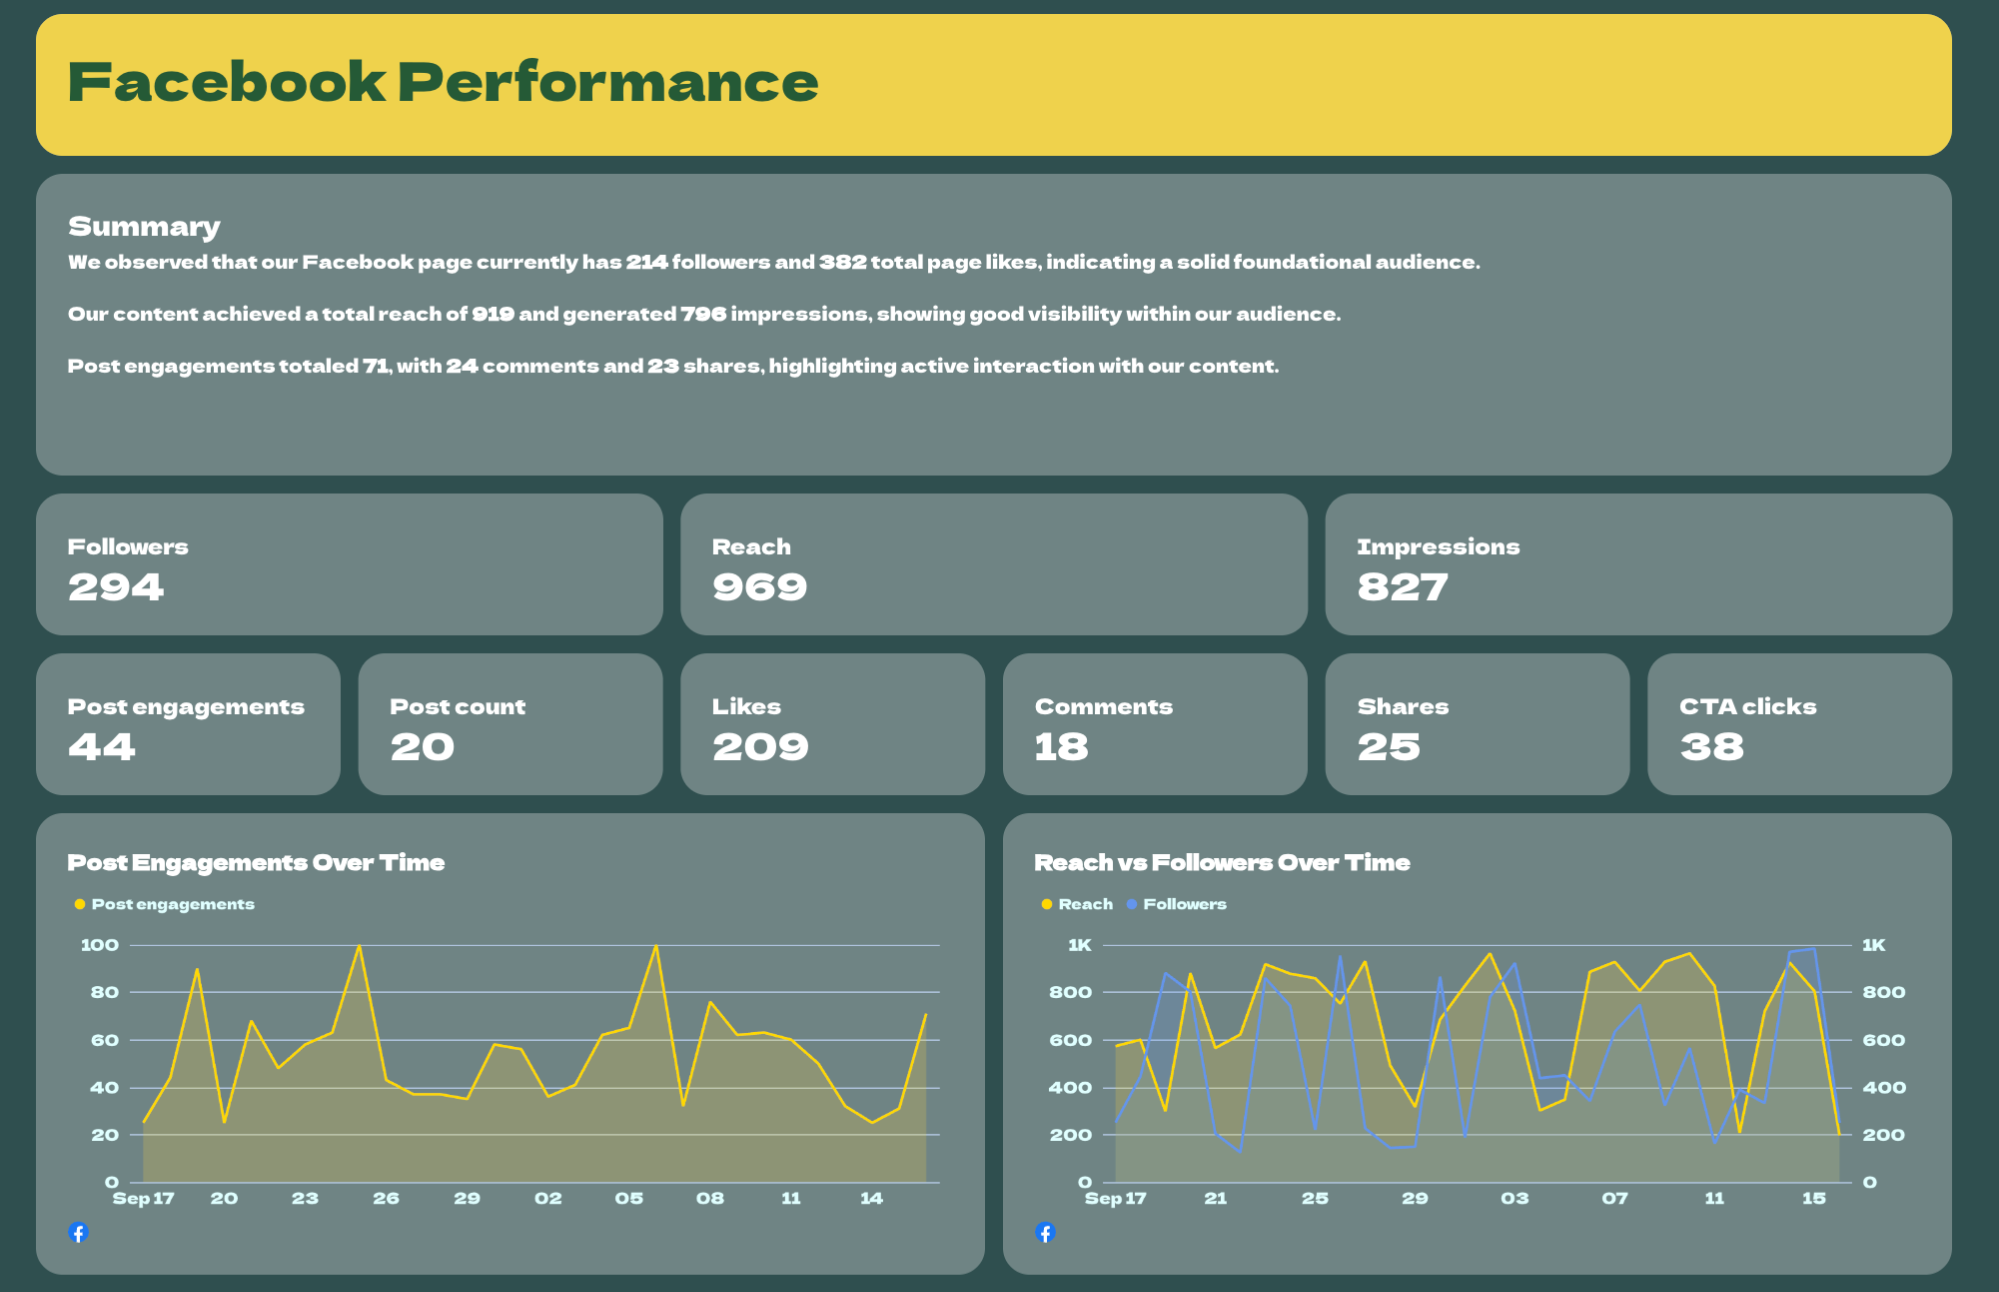
1. Overview panel: Start each tab with key KPIs like:
- Reach/Impressions
- Engagement rate
- Link clicks/CTR
- Follower growth
- Spend, cost per result (if running paid campaigns)
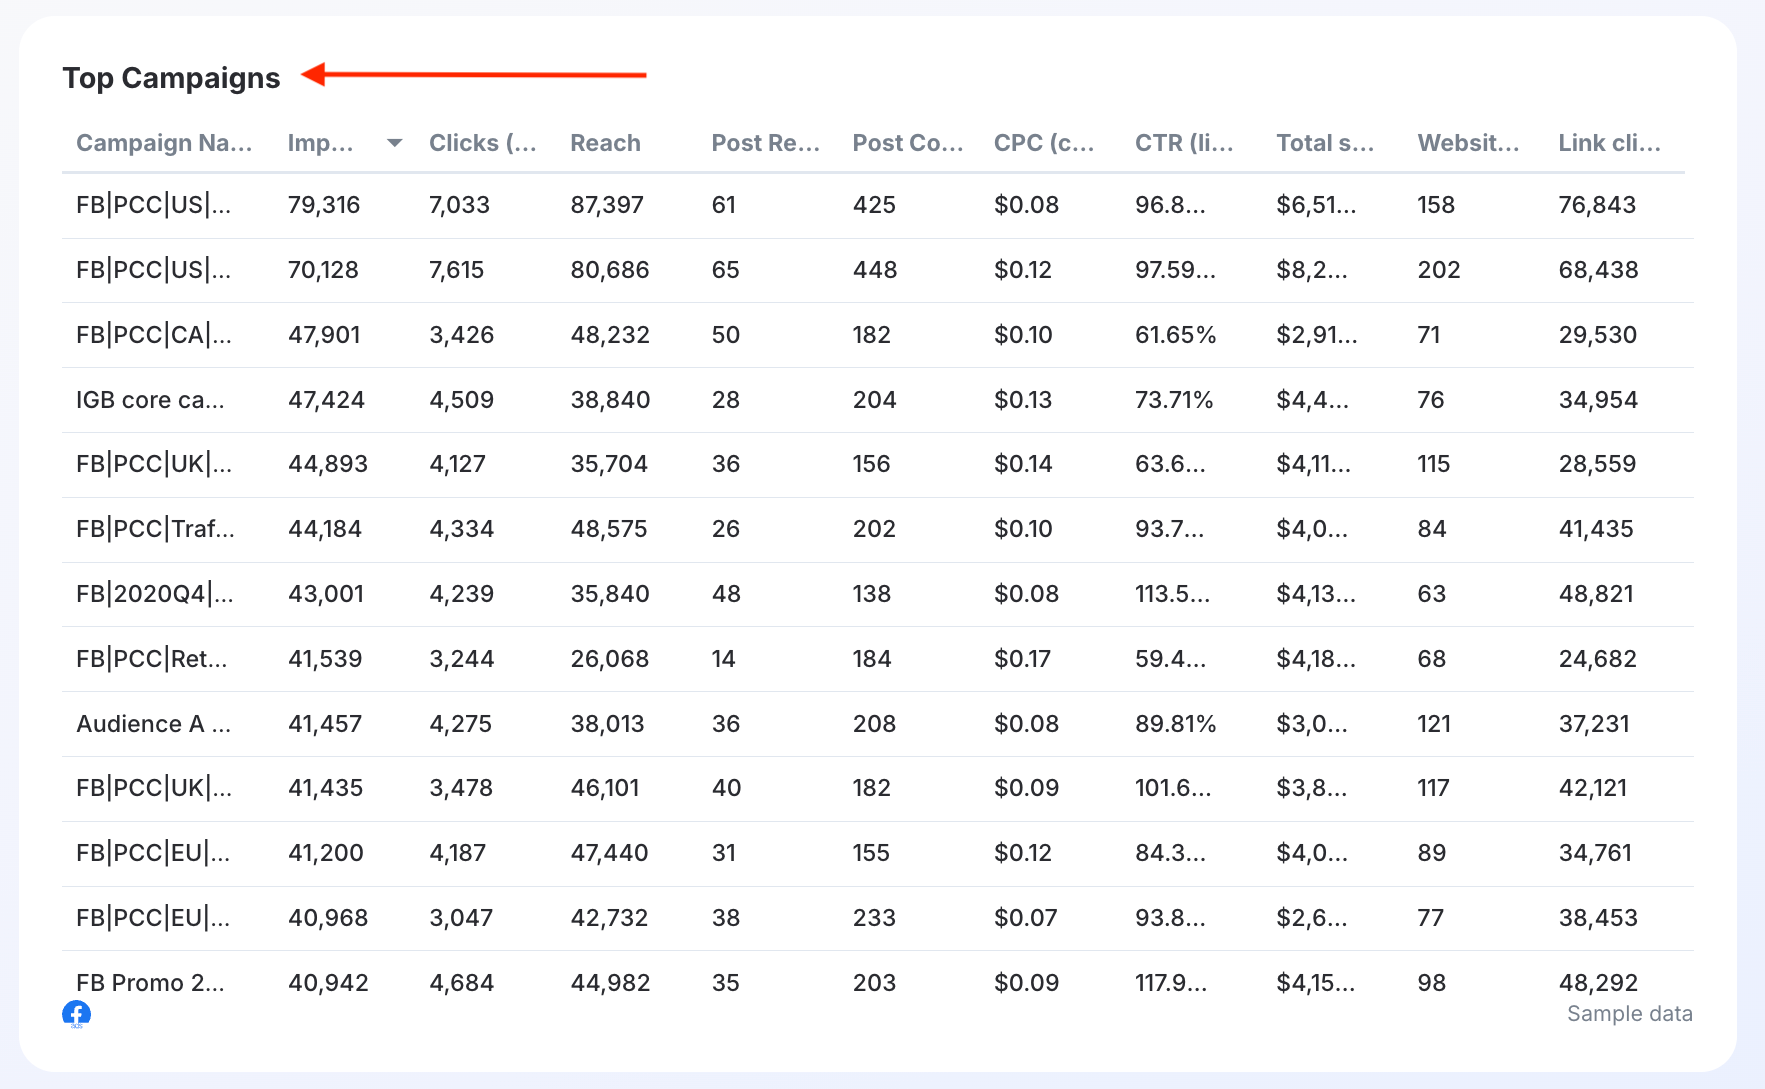
2. Top-performing content: Whatagraph can automatically pull your top posts or videos for each platform, based on engagement, reach, or conversions.
- Use the “Top Ads” or “Top Campaigns” widgets to display thumbnails, captions, and metrics side by side.
- Sort by social media performance metric (e.g., engagement rate for organic or ROAS for paid).
- Add a text widget below and click Generate with IQ > Wins to have Whatagraph write a short summary like:
- “Carousel posts drove 28% more engagement than Reels this month, likely due to product-tag usage.”
3. Engagement breakdown by format.
Don’t stop at totals, show what type of content is working.
- Add widgets comparing Reels vs. Stories vs. Static posts.
- For LinkedIn or X, compare text posts, image posts, and polls.
- If you manage both organic and paid, show side-by-side engagement vs. spend to reveal efficiency.
Whatagraph power tip: Use IQ Dimensions to group content types automatically—e.g., “Reels,” “Stories,” “Carousels,” even if different accounts label them inconsistently.
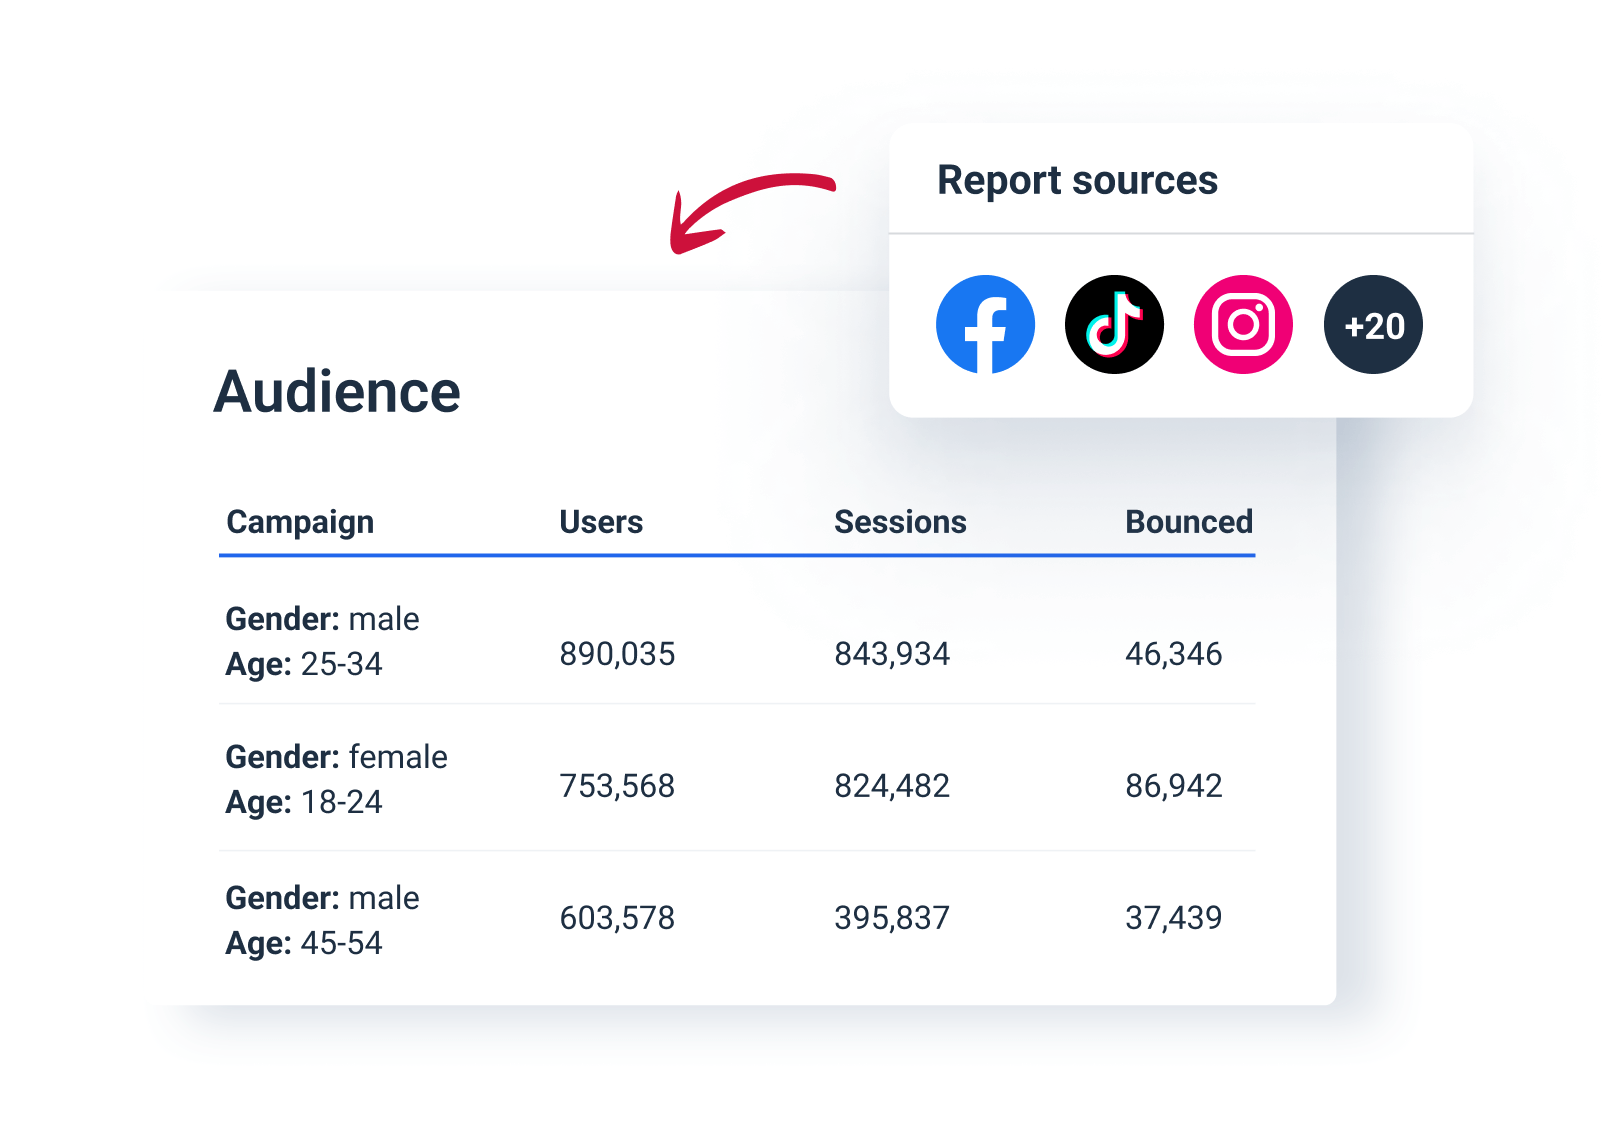
4. Audience insights.
Show who’s actually engaging.
- Include Audience growth (net new followers + churn).
- Add Demographics widgets for age, gender, and location.
- If you target multiple markets, use data blending to merge audience data from Meta + TikTok + YouTube into a single “Regional Breakdown” table.
5. Key takeaways.
Close each channel tab with an AI-generated summary.
- Click Generate with IQ > Summary + Recommendations.
Alternatively, you can also create separate reports for each channel using these FREE templates:
4. Insights and learnings
Purpose: Turn raw performance data into a clear, social media strategy.
As Dominic Bonaker, CEO at Lunar, puts it:
Start with an overt story: Objective → Performance → Insight → Action. Begin each report with campaign goals, followed by a snapshot of overall performance, then additional analysis by platform or campaign. Use repeated visuals and concise commentary beneath each chart to dissect metrics into meaning — clients must not have to interpret raw data themselves.
This is where you stop reporting what happened and start explaining why it happened—and what to do next.
A good insights section answers three questions:
- What changed?
- Why did it change?
- What are we doing about it next?
Step 1: Frame your story
For each reporting cycle:
- Objective: What were you trying to achieve? (Grow reach, lower CPC, drive more qualified leads, etc.)
- Performance: Summarize key numbers in one visual: KPIs vs. goals or previous period.
- Insight: Explain why performance shifted. (“Engagement spiked after adding carousels; conversions dropped as spend moved from Meta to TikTok.”)
- Action: Close the loop with next steps. (“Reallocate 15 % budget to Instagram Reels.”)
Step 2: Let IQ Plus do the sorting
When you have dozens of promotions or content types, manual analysis eats hours.
Whatagraph’s IQ can automatically group and compare performance dimensions for you.
Here’s how to use it:
- Go to Organize > Dimensions > IQ dimension.
- Choose the field you want to analyze (e.g., Campaign Name, Post Type).
- Enter a prompt such as: “Group campaigns by funnel stage,” or “Label content as ‘Video’ or ‘Static.”
- Click Run > Create Dimension.
IQ Plus instantly builds a new custom dimension that categorizes your data so you can compare, for example, brand vs. performance campaigns or video vs. carousel posts across all platforms, without manually tagging anything.
Recommended reading: How to Create Google Ads Reports for Clients + Examples
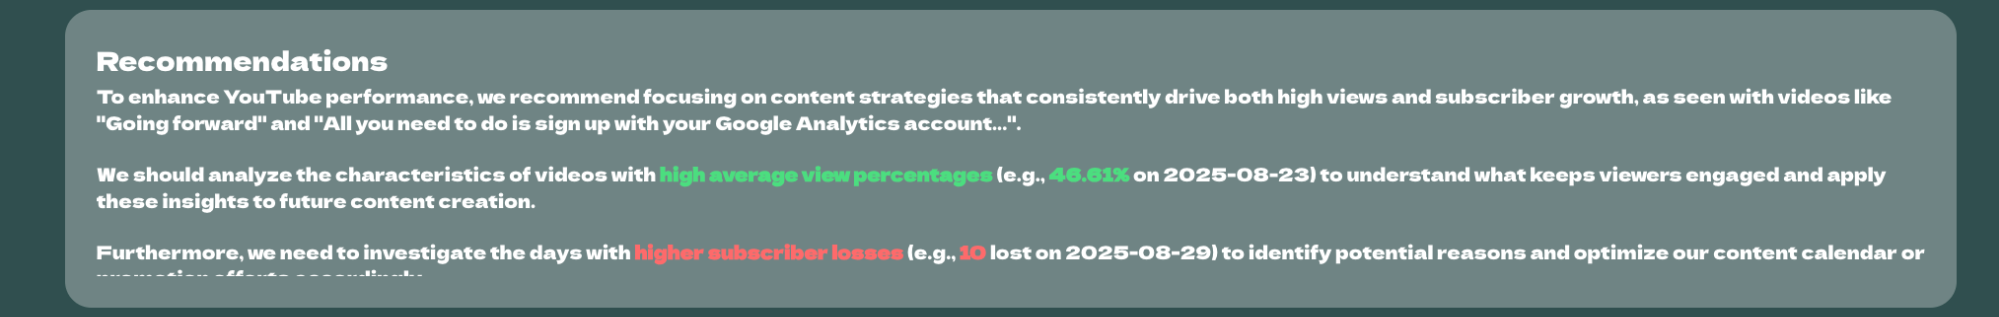
Step 3: Generate insights automatically
Now that your data’s organized, open a text widget in your report and click Generate with IQ.
Select Summary, Wins, Issues, or Recommendations, depending on what you want to highlight.
IQ will write natural-language insights like:
“TikTok outperformed other platforms in reach (+27%) but underdelivered on conversions (-11%). Reallocating 15% of ad spend to Instagram Reels next month could maintain reach while improving ROI.”
You can edit or expand on these AI insights to add business context, such as content goals, audience shifts, or budget constraints.
Step 4: Tie learnings to next-period actions
Every insight should end with an action. Summarize them in a short, scannable format.
Once you finalize your structure, save it as a “Team Template” in Whatagraph. This keeps future reports visually consistent and automatically applies your branding and custom metrics.
Whatagraph power tip: Duplicate your previous Whatagraph report and adjust the goals section. This gives you continuity across months and makes performance easy to compare.
Which Social Media Metrics Should You Add in Your Report?
You can track hundreds of numbers across every social media marketing platform, but only a handful actually move business results.
As Rebecca Hopwood, Marketing Director at YouBee Media says: “We focus on the value metrics rather than vanity, as that's what will lead to sustainable growth with a loyal audience.”
Audience growth is a big one we focus on, but also engagement. Comments, saves and interactions are good measurements of whether content is actually interesting and engaging to your audience.
Your report should group metrics into the three core stages of the marketing funnel: Awareness, Engagement (Consideration), and Conversion (Action).
1. Awareness and reach metrics
These metrics answer: “Are we effectively growing our audience and visibility?”
They quantify brand awareness lift and audience growth at the very top of the funnel.
- Impressions: The total number of times your content was displayed. (One person can generate multiple impressions.)
- Reach: The number of unique users who saw your content.
- Follower growth rate: The speed at which you are adding net new followers over a period.
- Share of voice (SOV): Your brand's mentions vs. competitor mentions in the industry.
2. Engagement and consideration metrics
These metrics answer: “Is our content connecting and resonating with the target audience?”
They move beyond simple viewership to demonstrate connection and intent.
- Engagement rate (ER): The total interactions (likes + comments + shares + saves) divided by reach or impressions.
- Saves: The number of times users bookmark your post to view later.
- Share rate: The number of times your post was shared divided by your reach.
- Comments and sentiment: The volume of comments and the emotional tone (positive/negative/neutral).
- Video completion rate: The percentage of users who watch a video to a specific point (e.g., 75% or 100%).
3. Conversion and action metrics
These metrics answer: “Is our social media marketing driving measurable, commercial business results?”
These are the most critical metrics for proving ROI.
- Click-through rate (CTR): The total link clicks divided by total Impressions.
- Conversion rate (CVR): The total conversions (leads/purchases) divided by total link clicks.
- Cost per acquisition (CPA): The total Campaign cost divided by total conversions.
- Social media attributed revenue: The direct revenue generated from clicks originating on social media platforms.
How to Build a Social Media Analytics Report in Minutes With Whatagraph
The fastest, most accurate way to produce your social media metrics report is through a dedicated reporting tool that automates the entire workflow.
Here’s the 5-step process for generating a complete, professional report in minutes using Whatagraph IQ.
Step 1: Get started with a free Whatagraph account
Start by signing up for a free Whatagraph account—it takes seconds, and we don’t need your credit card on file!
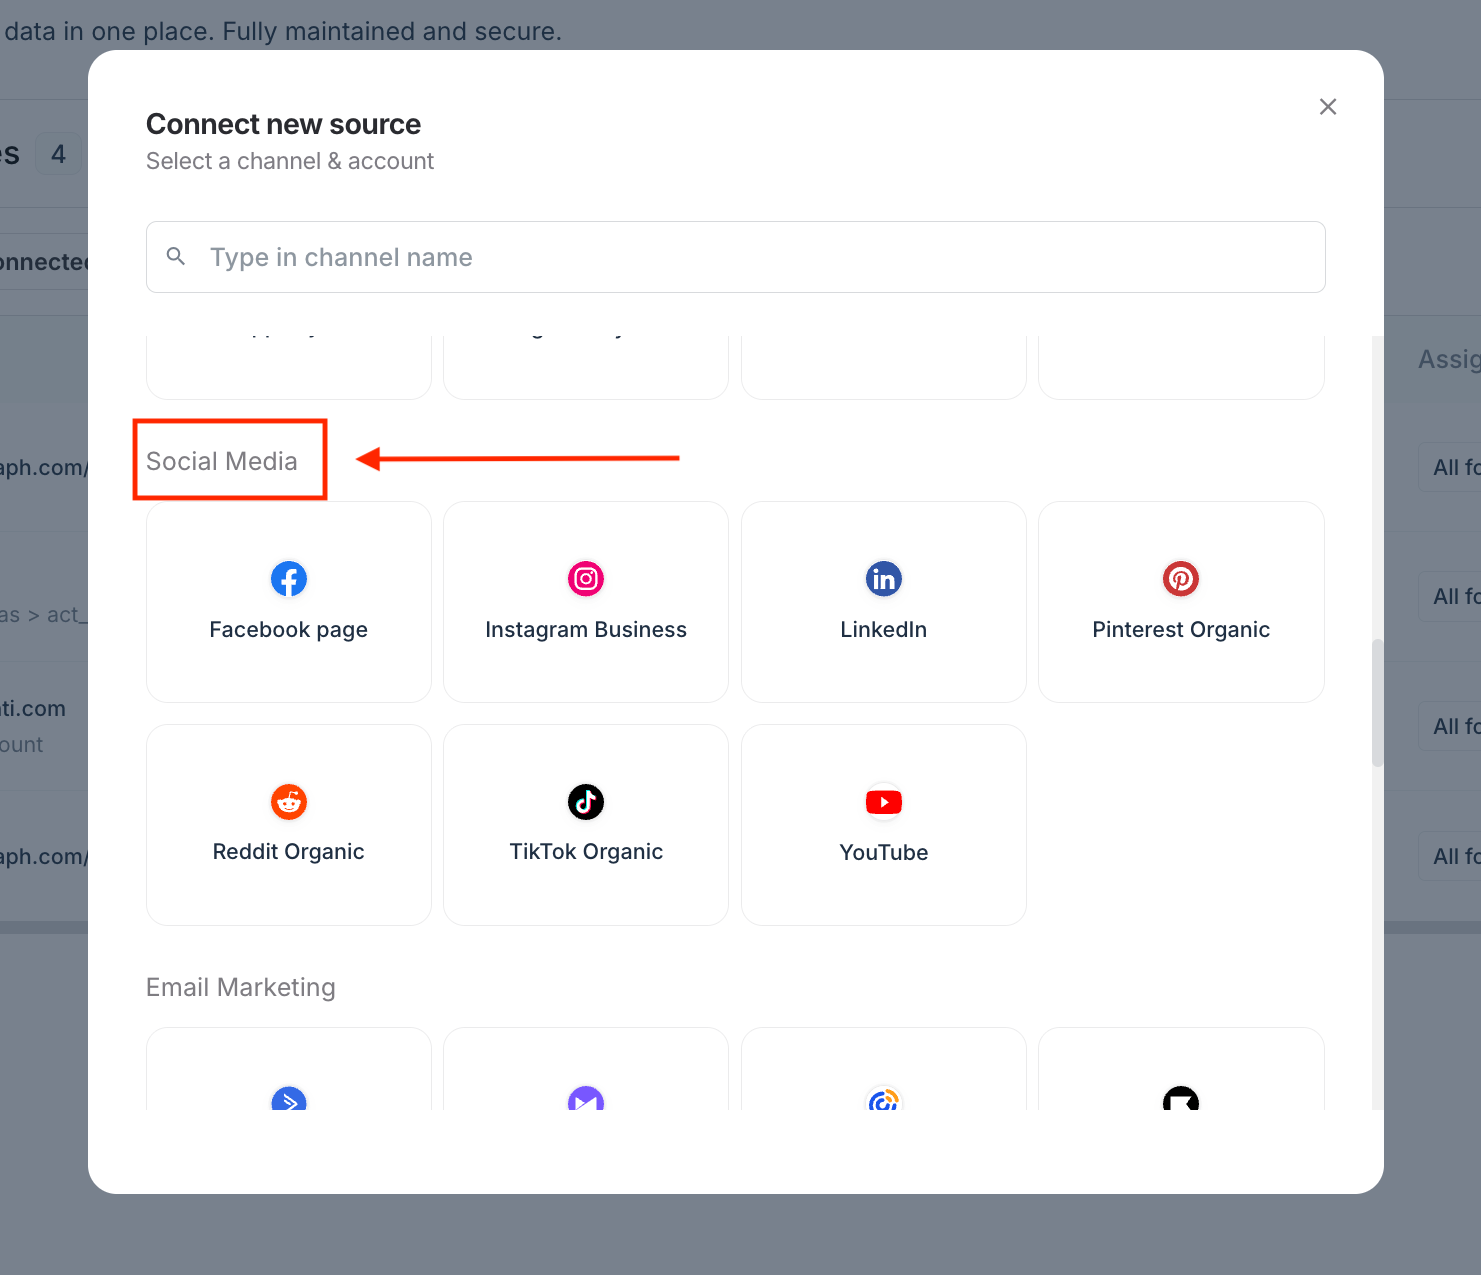
Step 2: Connect your data sources
This is the most time-consuming step in traditional reporting, but Whatagraph handles the integration in seconds.
- From your dashboard, click on Sources > + Connect new source.
- Select all the social platforms and marketing tools you use (e.g., Facebook, Instagram, LinkedIn, TikTok, Google Analytics 4, and more).
- Log in to each platform to grant Whatagraph read-only access.
- Once connected, Whatagraph automatically pulls all available historical data, making it ready to visualize.
Step 3: Use Whatagraph IQ to create your report in seconds
Click Create Report with IQ, add a prompt like “social media metrics,” and hit Generate report.
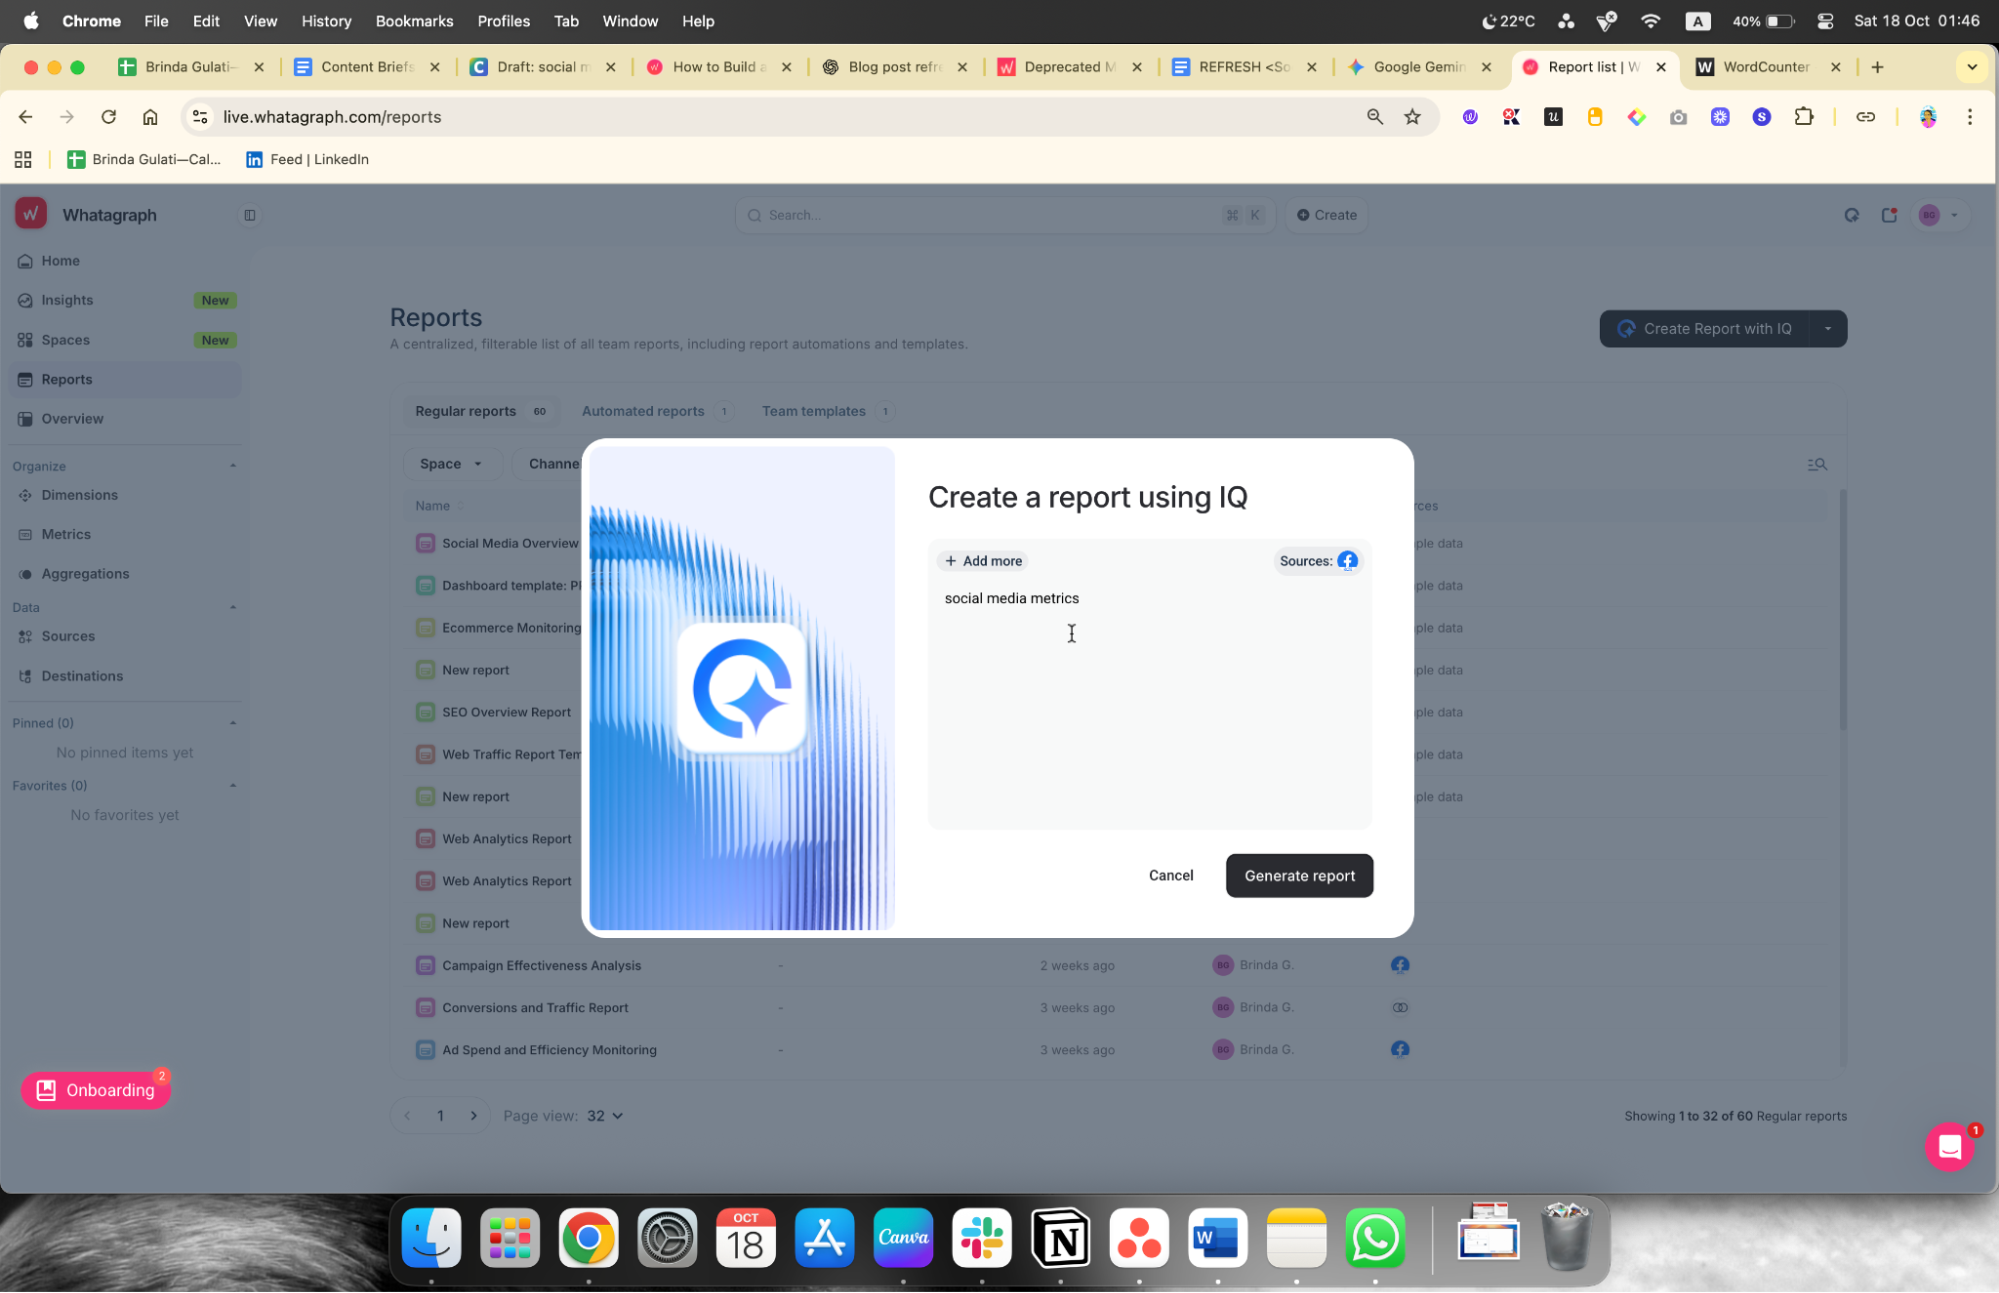
That’s it. Sit back and watch AI spin its magic.
Step 4: Customize and white-label the report
Tailor the report to perfectly match your brand or your client's brand.
- Customize widgets: Drag-and-drop elements to rearrange charts, add specific cross-channel metrics, or apply filters (e.g., showing performance only for a specific post or geographic region).
- White-labeling: Replace the default Whatagraph logo with your company’s or your client’s logo. This ensures the report looks fully branded and professional when shared with managers or clients. You can also remove the “Powered by Whatagraph” header in “Settings.”
- Add Executive Summary via IQ: Use the built-in AI insights tool on any text widget. Click Generate with IQ > Summary + Wins + Issues to have the AI write a clear, natural-language executive summary based on the performance data pulled in Step 2.
Whatagraph power tip: The Custom Domain feature allows you to change the standard “whatagraph.com” domain to one branded to your company This feature customizes two critical elements:
1. Branded report URL: You can replace the standard Whatagraph web report URL with your own company’s subdomain.
- Instead of: app.whatagraph.com/report-link
- Your clients see: reports.yourcompany.com/report-link
2. Personalized email sender field: When an automated report is sent or shared, your company's subdomain will be visible in the sender field, making the communication look like it came directly from your team.
Step 5: Share and automate delivery
The final step is to share the report and ensure your stakeholders receive timely updates without any extra work from you.
- Click the Actions button in the top menu > Automate report.
- Enter the email addresses of your clients or manager: They can view the live report on any device (with the option to password-protect it) without needing a Whatagraph account.
- Set up automated delivery: Choose the desired frequency (daily, weekly, or monthly). Whatagraph will now automatically update the data and email a snapshot of the report to your stakeholders at the scheduled time, providing continuous, effortless reporting.
From now on, your clients get live, auto-updating reports. And you get your evenings back with Whatagraph.
How To Conduct Social Media Analysis?
Depending on your aims and resources, each report will be different. We've compiled a few questions to ask yourself to help you pick which KPIs to include in your report:
1. Who is my target audience?
2. Is there any specific information relevant in this context?
3. Are you reviewing a particular campaign or ongoing results?
Now, keep your answers in mind throughout the entire process of creating your social media report.
Start with the introduction: lay down your goals, tactics, and metrics. This way, your readers will get a general overview of what this report will be about.
Also, provide a brief performance summary. Include critical details, like the number of new followers or leads generated. In other words, be sure to mention the highlights of your campaign.
6 Best Practices For Creating Social Media Analytics Reports
When it comes to building a social media insights report or dashboard, there are several key things to consider. Now you’ll find a list of essentials to go through before even drafting a report.
1. Determine the relevant metrics
When deciding what metrics you should add to the report, consider your goals and objectives. Here are the most common numbers social media marketers track:
- Number of posts;
- Follower growth metrics;
- Reach rate;
- Web traffic;
- Likes, comments, shares;
- Page or profile views;
- Clicks on post links;
- Clicks on the link in your bio;
- Video views;
- Story views;
- Top performing posts.
It would help if you considered including data that generates money for your client, such as the number of leads, conversions, the total revenue, or ad spend. Of course, feel free to add any further information if you think it’s relevant to your strategy.
2. Focus on the most important information
When it comes to developing social media analytics reports, establishing and evaluating the relevant KPIs isn't the only element to consider. Always strive to look at your data from different angles, to examine and filter your data for hidden insights that could help you improve your performance.
3. Blend data for a unified view
Combining data from multiple social media sources gives you a holistic view of your marketing efforts, leading to more meaningful insights and better decision-making.
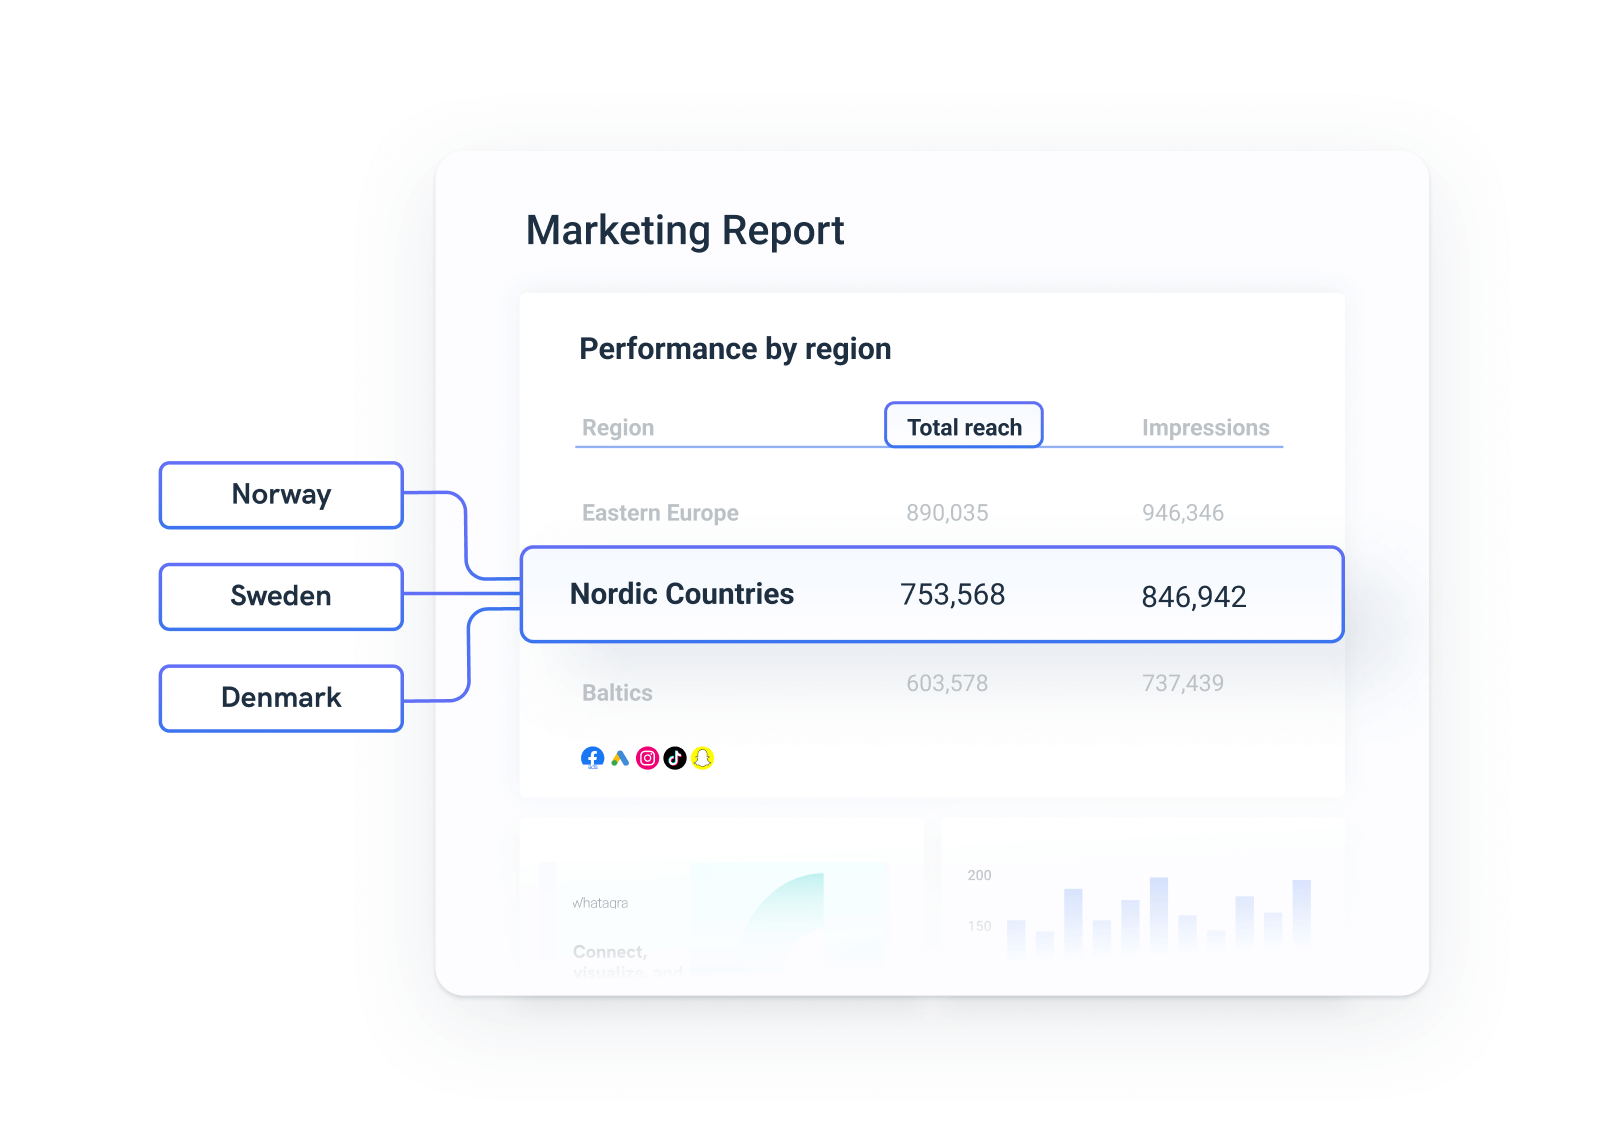
For example, you can combine data to gauge the performance by region for any of your channels. Let’s say, you want to see unified paid promotion results for the Nordic region. Whatagraph’s Organize feature allows you to quickly group metrics like Reach and Impressions from different countries into tiers.
This feature is not limited just to countries. You can aggregate your social media data by initiative, year, audience, age, etc.
However, the capabilities of data transformation don’t stop there. By integrating data from different channels and platforms and performing a cross-channel analysis, you can have a unified view of user interactions across various social media channels, which helps you optimize your marketing strategy.
Finally, data blending allows you to create custom reports and dashboards that meet specific analytical requirements — for example, having data from multiple sources visualized in the same table widget or unifying names of dimensions and metrics from different platforms.
4. Use data visualization to create more engaging reports
The amount and diversity of data generated by your social media initiatives will be significant if you use multiple platforms. This becomes especially difficult to manage when you're tracking multiple platforms, for multiple clients.
Whatagraph is a great marketing analytics tool, that can aggregate massive amounts of data from all channels and make it simple to understand for all involved.
Data visualization is an important feature of these reports because it simplifies data analytics and saves time.
5. Establish a reporting timetable and automate report delivery
Some posts become viral right away, while others take some time to reach the ideal number of impressions. However, the most crucial thing is that you and your clients always stay on top of social media performance metrics.
It would be ideal to use Whatagraph to automate reports at regular intervals (as mentioned above) and remove manual reporting.
6. Select the appropriate social media reporting tools
There are a plethora of SaaS reporting options on the market today. Only a few, however, include a user-friendly panel, data visualization, and automation features.
Whatagraph is a marketing analytics reporting solution that has not only the mentioned features but also white-label, cross-platform reporting, and a pre-made report library.
What Should You Expect From a Social Media Analytics Reporting Tool in 2025?
Now that you’ve collected the necessary information, it’s time to start working on your presentation. Reading a ton of data is already tricky, so here’s your chance to make it easier. Your report should be visually appealing yet still cover relevant information. Here are a few general tips to make the data easier to understand:
- Split data by channels. There’s no need to pack all the data in one place. It will be more beneficial to separate data by channel to make individual channel performance assessment that much easier.
- Include the growth stat per channel. Compiled the statistics for lead generation growth and the following growth separately for different channels.
- Add engagement statistics for each channel. Put the number of different engagements, including comments, likes, mentions separately for different channels.
- Calculate revenue growth for each channel. Make sure you’re not mixing conversions and ROI numbers – separate and arrange these numbers accordingly.
You can present the information in many ways: for instance, a simple slide might do the trick. But, wouldn’t it be great if there was someone (or something) that did all these things for you? Yes, the data gathering, the right metric picking, the visualizing.
Luckily, there is.
Whatagraph is software that builds social media performance reports for you. The tool gathers and visualizes the key performance indicators in one place. You can create the report from scratch or use pre-made reports and widgets. Either way, the tool allows you to compare metrics from different channels, all in a single sheet.
As a matter of fact, we even made a social media report template for you to use! It's highly customizable so you can adapt the format to the individual needs of your firm or your clients. Give it a try.
Published on Oct 27 2024
WRITTEN BY
Brinda GulatiBrinda Gulati is a fractional content marketer and freelance writer who specializes in data-driven storytelling and writing easy-to-understand, informative content for humans. She has two degrees in Creative Writing from the University of Warwick, and believes that above all, stories are a deeply human endeavor. She has two dogs, knows thrifting spots, and loves afternoon naps.