What is agentic analytics? Our lessons from 66 marketing agencies
See how agencies use agentic analytics to investigate data, update reports, and catch problems. Real examples, starter prompts, and steps for your first rollout.

Oct 09 2026●20 min read


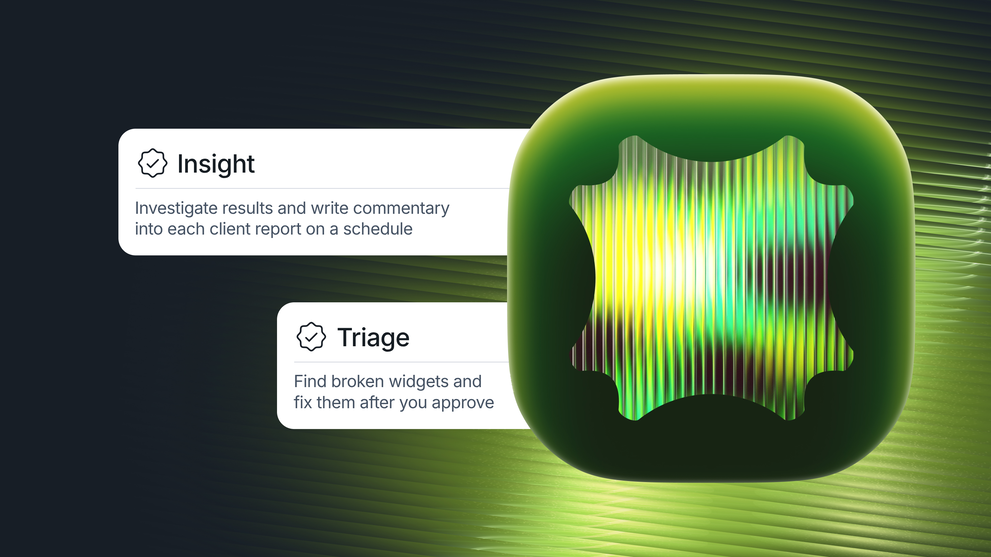
Only 17% of organizations have deployed AI agents, yet more than 60% expect to do so within two years, according to Gartner’s 2026 research. Gartner puts agentic AI at the “Peak of Inflated Expectations.”
On that peak is agentic analytics. We know the term sounds like it was coined to sell a roadmap, and often it was. Gartner estimated in June 2025 that only about 130 of the thousands of vendors claiming agents are real. The rest are "agent washing" chatbots and automation scripts.
Strip away the washing, and the core proposition remains: software that reads your marketing data, decides what's off, then edits the report, writes the commentary, or opens the ticket itself, on a schedule, with nobody prompting it.
I wanted to see if Whatagraph’s IQ Agents would hold up in real agencies, so I talked to Arturas Lazejevas, CTPO at Whatagraph, and watched 66 agencies take IQ Agents through early access. In September 2026, 36% of their agent runs started on a schedule, up from 9% in August.*
We’ll look at what they’re handing over, starting with the data the agent needs to get it right.
What is agentic analytics?
Agentic analytics uses AI agents to investigate data and act upon their findings without the need for a person to direct every step. You give the agent a task, access to the relevant data, and limits on what it can change. The agent carries out the steps itself.
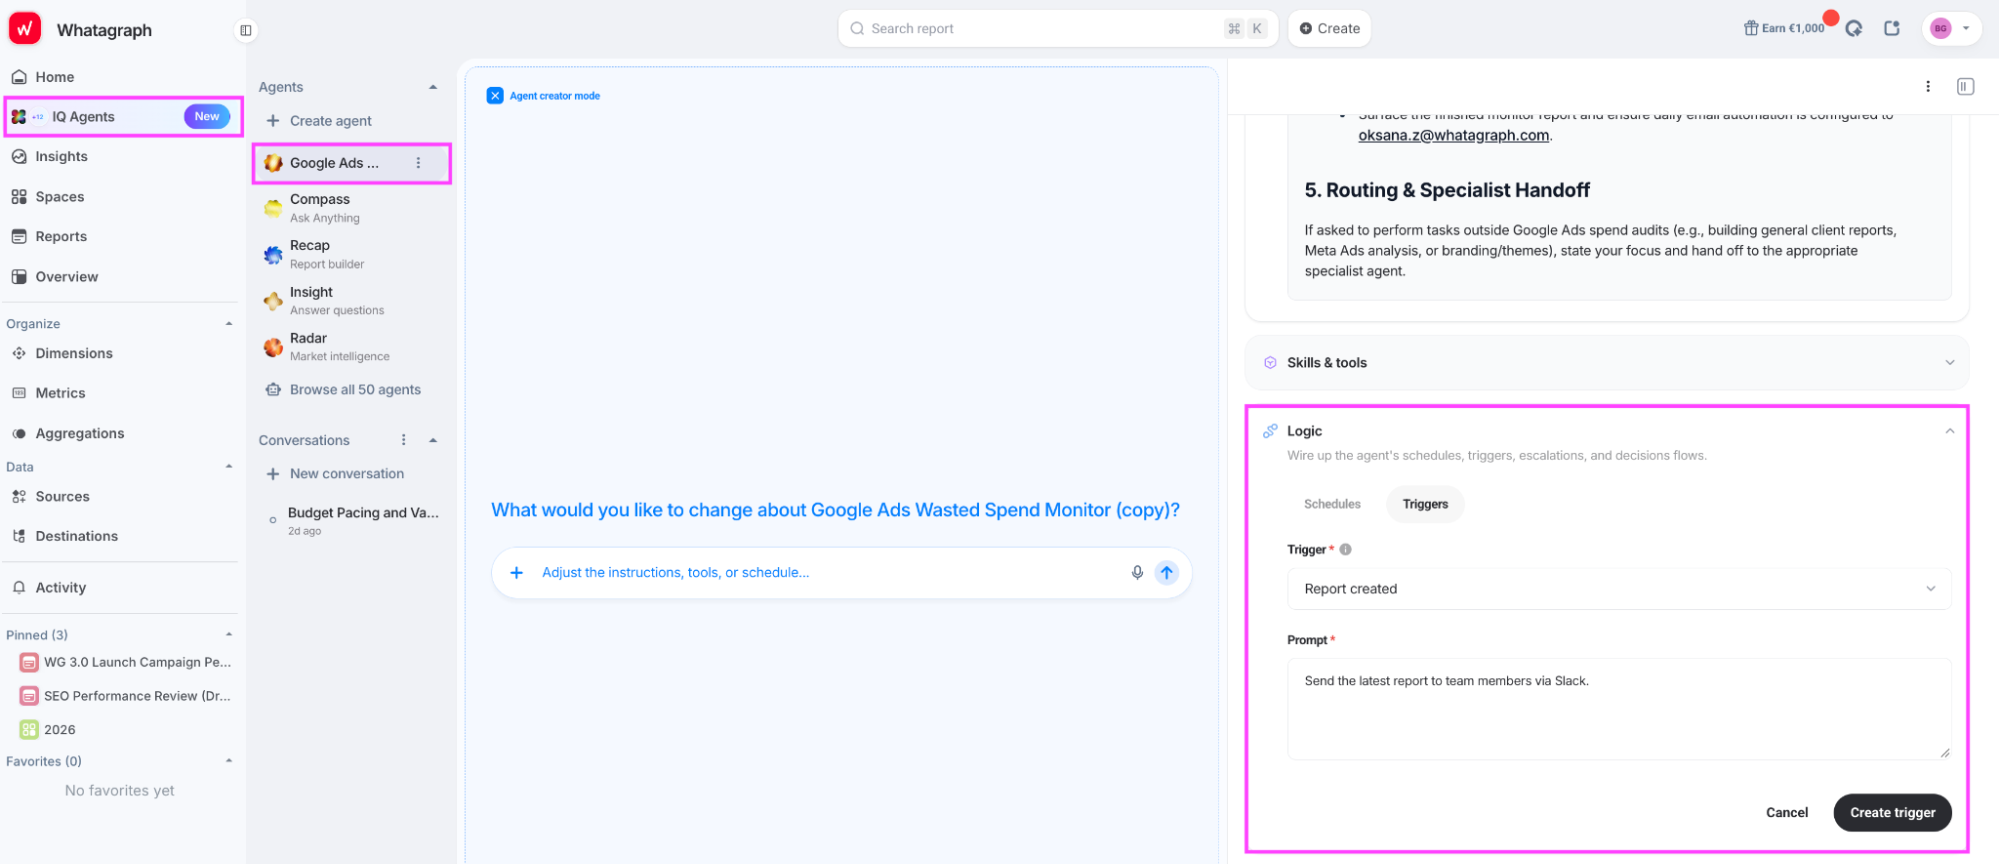
For example, Whatagraph’s Demand Generation Manager, Oksana, built a Google Ads Wasted Spend Monitor to find spending that produces little or no reported conversion activity. The agent checks search terms, placements, audiences, and ads, then groups its recommendations into action lists for review.
The instructions stay saved with the agent. You can also specify what happens after the analysis. She also decided what happens after the analysis: a "Report created" trigger sends the latest report to the team via Slack.
While we’re here, here’s what doesn’t count as agentic analytics:
- A chat assistant answering a question: You upload a CSV and ask what changed. You’re still doing the follow-up work. But if a quick answer is all you need, IQ Chat lets you ask questions about your data within Whatagraph, including in shared reports.
- A dashboard with an AI summary button: The summary still waits for you to open the dashboard. Again, if that’s what you need, AI summaries can write one directly in your report without the agent.
- An agent running your ad accounts: You can change bids and pause campaigns, but that belongs to agentic marketing. Here, we’re talking about analysis and reporting.
- A live data feed: Fresh numbers don’t investigate themselves. An agent can check them on a schedule; it doesn’t have to watch them every second.
Is agentic analytics just hype?
Partly, yes. Gartner’s April 2026 assessment says most agent deployments remain narrow in scope, and fully autonomous agents aren’t ready for most enterprise uses.
Gartner also notes that governance, security, and cost now appear as their own profiles on the curve. That means the industry has started worrying about control and cost before the technology has matured.
That's a fair criticism of agents in general, and it's also why they suit marketing reporting. The daily jobs we need to do are small and repeat on a fixed cycle: pull the numbers, check them against a target, write the commentary, update the report.
I looked at what the 66 agency teams using IQ Agents are doing with it:
- 41% run agents on a schedule, without someone typing a prompt to start each run.
- 67% have let agents change reports, including building widgets, editing filters, and adding tabs.
- 33% have let agents change the underlying data setup, creating custom metrics, dimensions, blends, or source groups.
My reading of those numbers, and this is an inference: month one is prompting, month two is scheduling. The teams run an agent by hand, check the output, and let it run on its own once they trust it.
The top agentic analytics examples in marketing data and reporting
If you're going to give information to an agent, make sure it has the data it can use and rules for interpreting it.
Google's Ads team uses the same starting point. Nipoon Malhotra, VP of Ads Analytics, Insights, and Measurement, describes moving from a "reactive report card" to a "proactive performance engine," and the first thing he lists is a strong data foundation.
Every agency in the examples below built the first two before the agent, and kept a person on the third.
1. Build monthly client reports on a schedule
Start with Recap, Whatagraph’s pre-made report-building agent. In IQ Agents, find Recap, click on the three-dot menu, and click Duplicate to make a copy for your client.
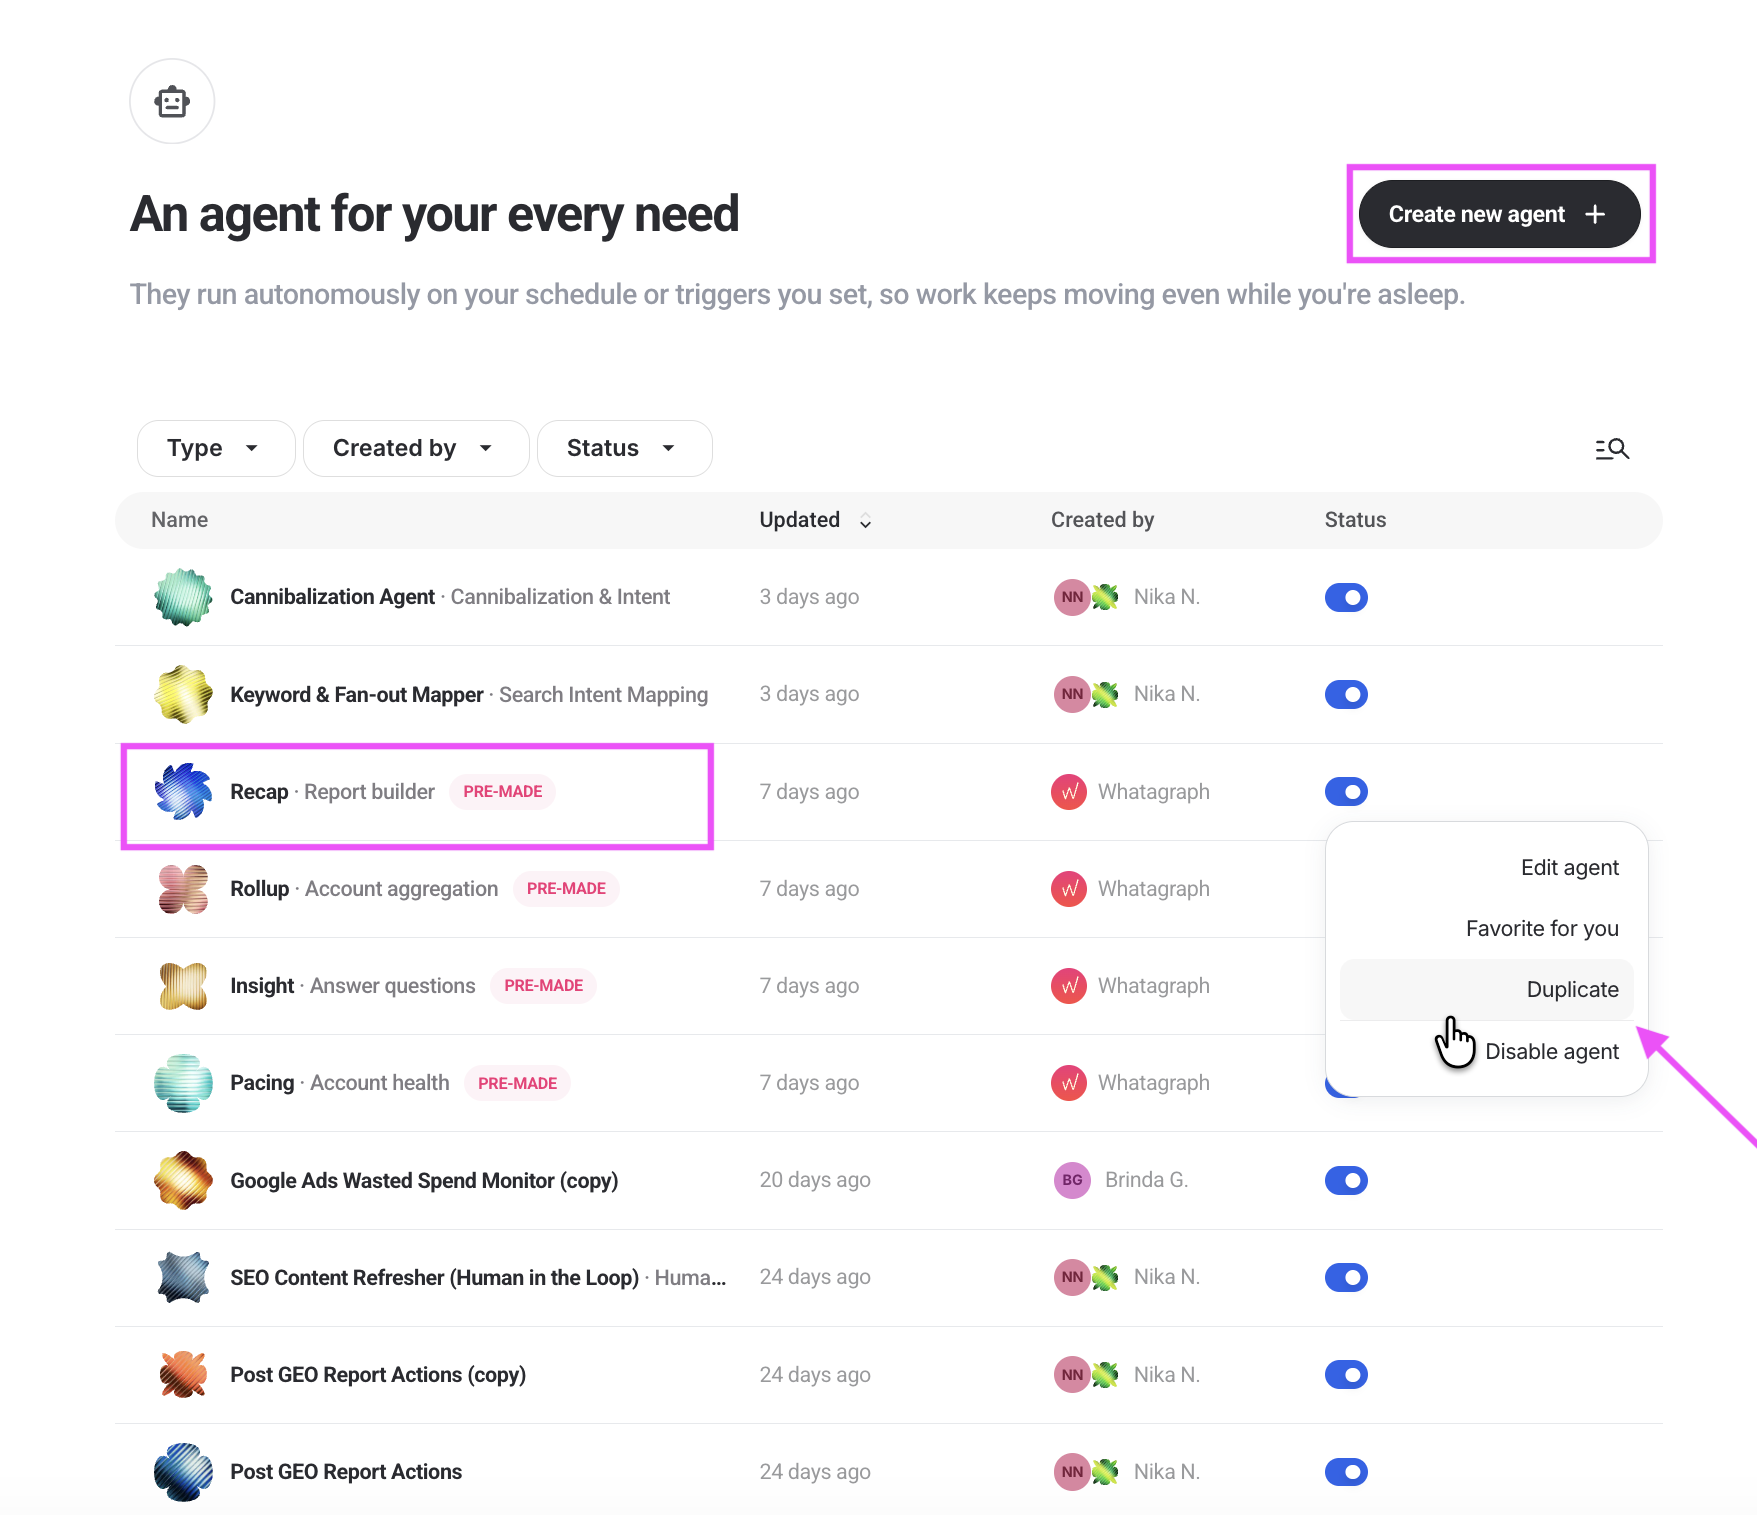
The agent can build a report from your instructions or a team template, using the sources and metric definitions you’ve already set up in Whatagraph.
Example prompt: Build [client]’s report for [month] using the previous report as a template and our connected sources. Compare results with the previous month, update the charts, and write the main changes and recommendations into the report’s text widgets. Flag anything you can’t explain. Leave the draft for review.
At one US communications agency, the analytics director gave each client a specialist IQ Agent in early access.
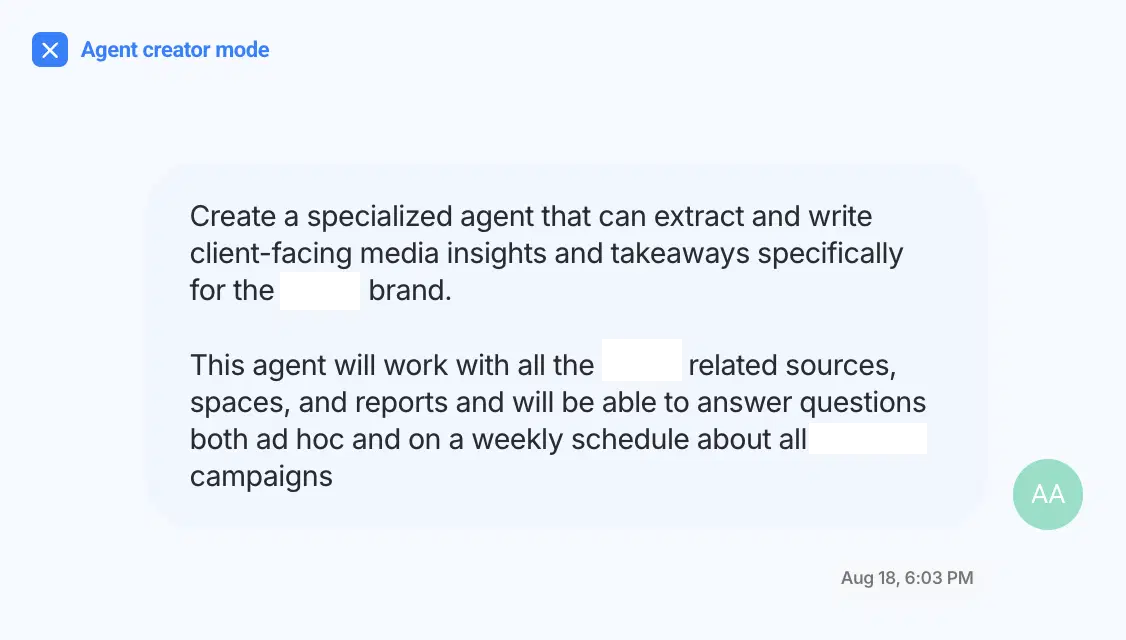
The team had already connected its sources and defined how to group campaigns and calculate metrics. Those definitions live in Whatagraph’s Data Hub, where the agents and reports can use them.
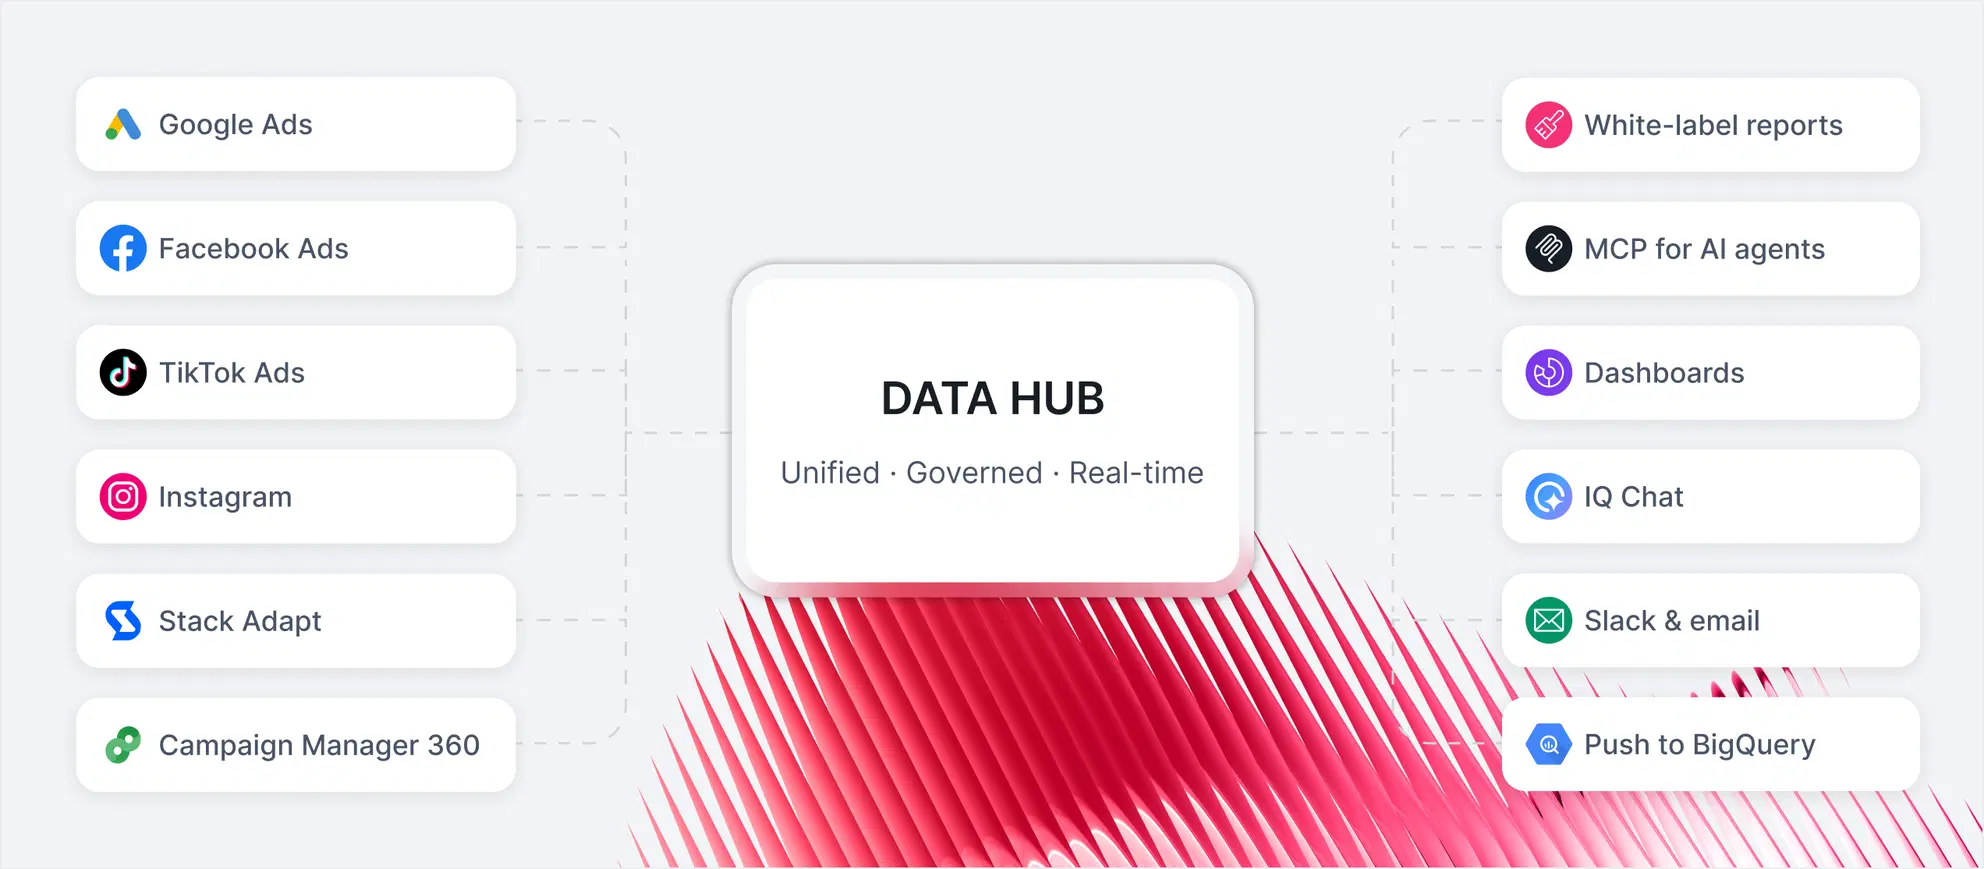
From there, the work looked like this:
- Read the results: The agent pulls the month's data from connected sources and reads previous reports for context and format.
- Write into the report: The agent adds performance takeaways, watchouts, and recommendations directly to text widgets.
- Work through the review: The director checks the draft and asks the agent to recheck numbers or investigate a finding further. The team adds client context and signs off before delivery.
The first agent was scheduled for the 2nd of every month at 9 a.m. On September 2, the draft was ready in about seven minutes, and it matched the structure of the previous reports without being asked to.*
"I have a wealth of prior reporting available in Whatagraph, and so the agent was able to, without even me telling it to, match the output to what the previous reports looked like. That was a surprise," says the Director of Digital Analytics.
A typical report now takes about four hours, including review, bringing the estimated monthly total for 12 reports to 48 hours.
Read the full case study here.
2. Write report commentary using past context and outside research
Open IQ Agents and describe the whole job. IQ Agents use the same data and metric definitions as your reports, and they can ask other agents for help. You don’t have to ferry the research between chats.
Here, two pre-made IQ agents can share the job:
- Insight analyzes the client’s results and writes commentary directly into the report’s text widgets.
- Radar does web-based research on your market, competitors, and benchmarks, and can deliver it as an answer, a widget, or a full report.
Insight can use Radar’s research alongside the client’s data, then write the findings into the report. You can inspect their conversation to see what Insight asked for and what Radar returned.
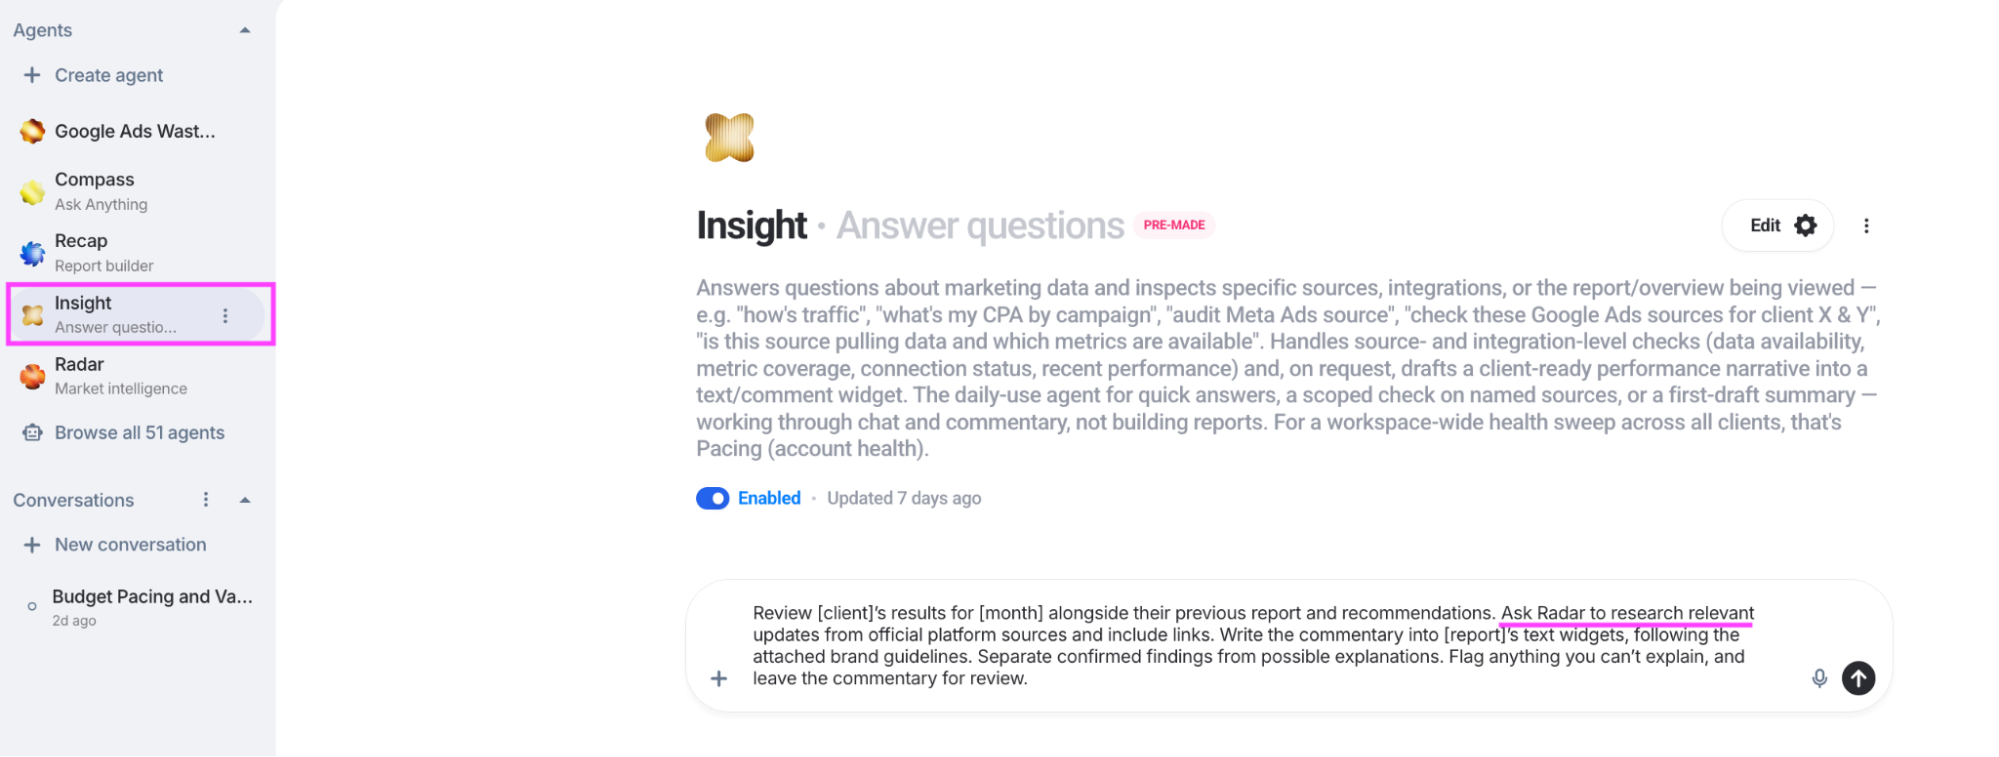
Example prompt: Review [client]'s results for [month] alongside their previous report and recommendations. Research relevant updates from official platform sources and include links. Write the commentary into [report]'s text widgets, following our brand guidelines. Separate confirmed findings from possible explanations. Leave the draft for review.
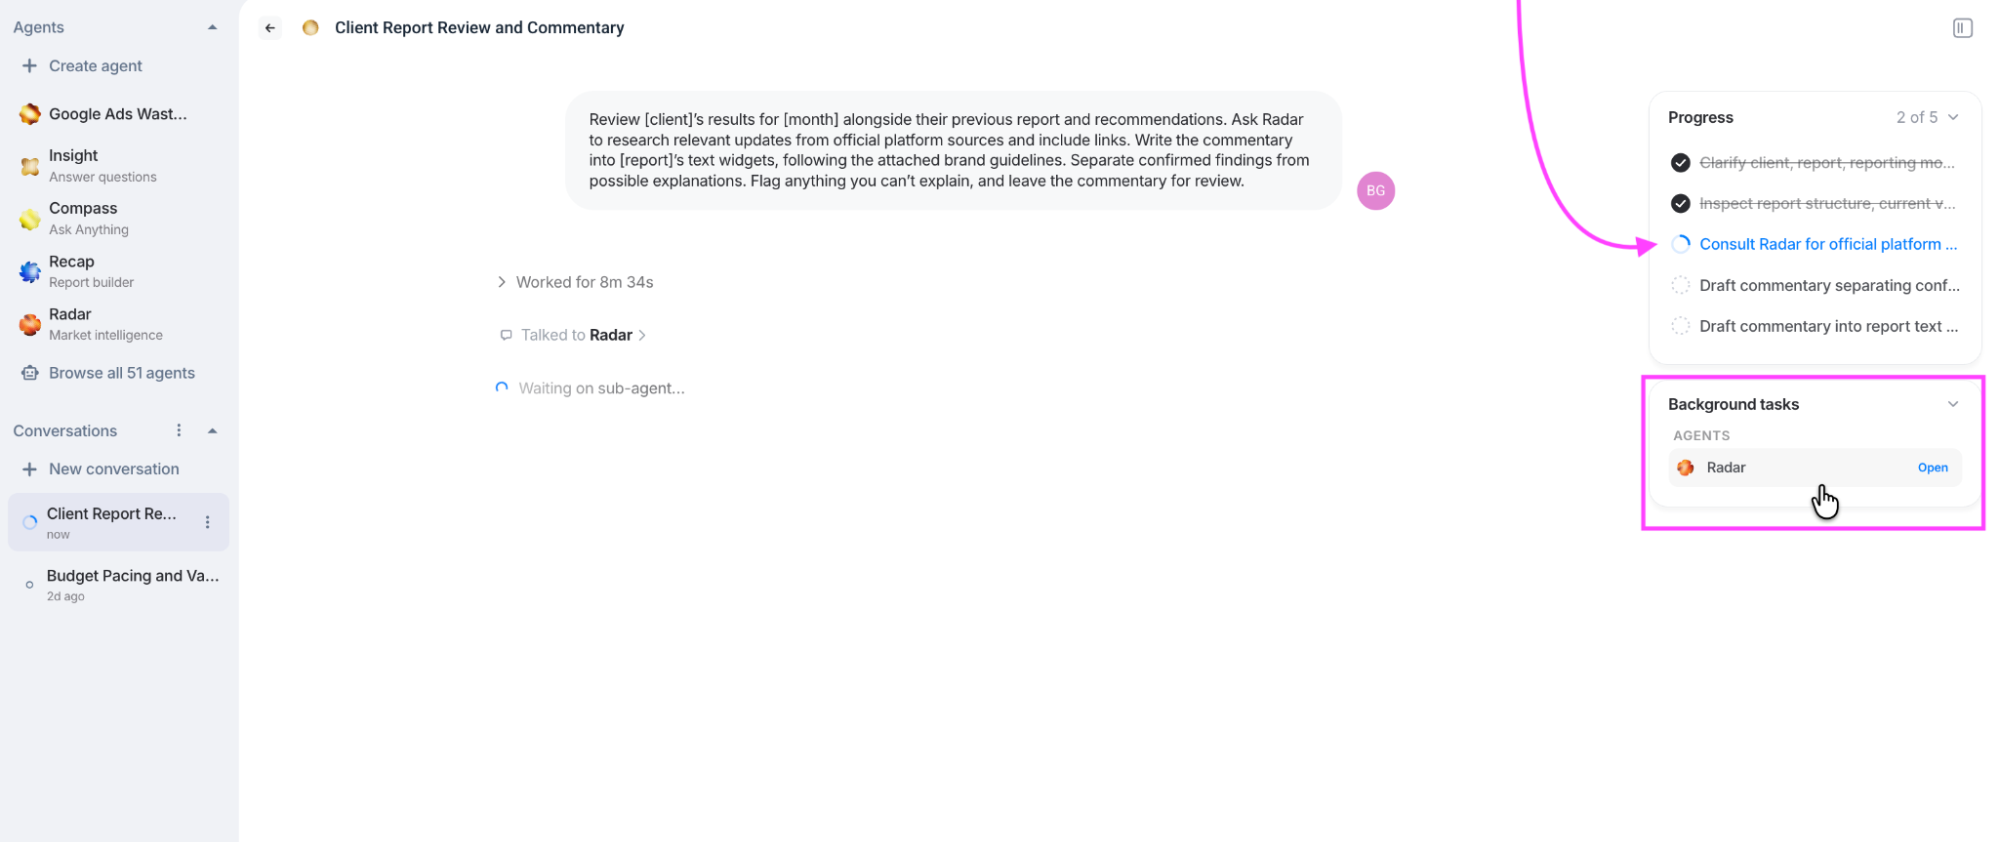
Keep report and widget changes set to Needs approval, so you can check what the agent wants to change before it acts. If you automate delivery too, require approval before the report goes to the client.
For a recurring job, duplicate Insight. Save the client’s goals and research instructions in its Instructions, and upload your writing guidelines and previous reports to its Knowledge. The agent can still ask Radar for help, and you can put it on a schedule.
At one UK agency, the Head of Search had been using Claude to analyze Whatagraph data, then copying the commentary back into reports.*
So the team built a custom IQ Agent that follows their writing guidelines, checks industry news, and reads previous recommendations before writing the next month’s commentary directly into reports. Their specialists review it and add client context before it goes out.
When the Head of Search went on holiday, the Managing Director used the agent to help deliver more than 50 reports. The reporting instructions, mercifully, hadn’t gone on holiday too.
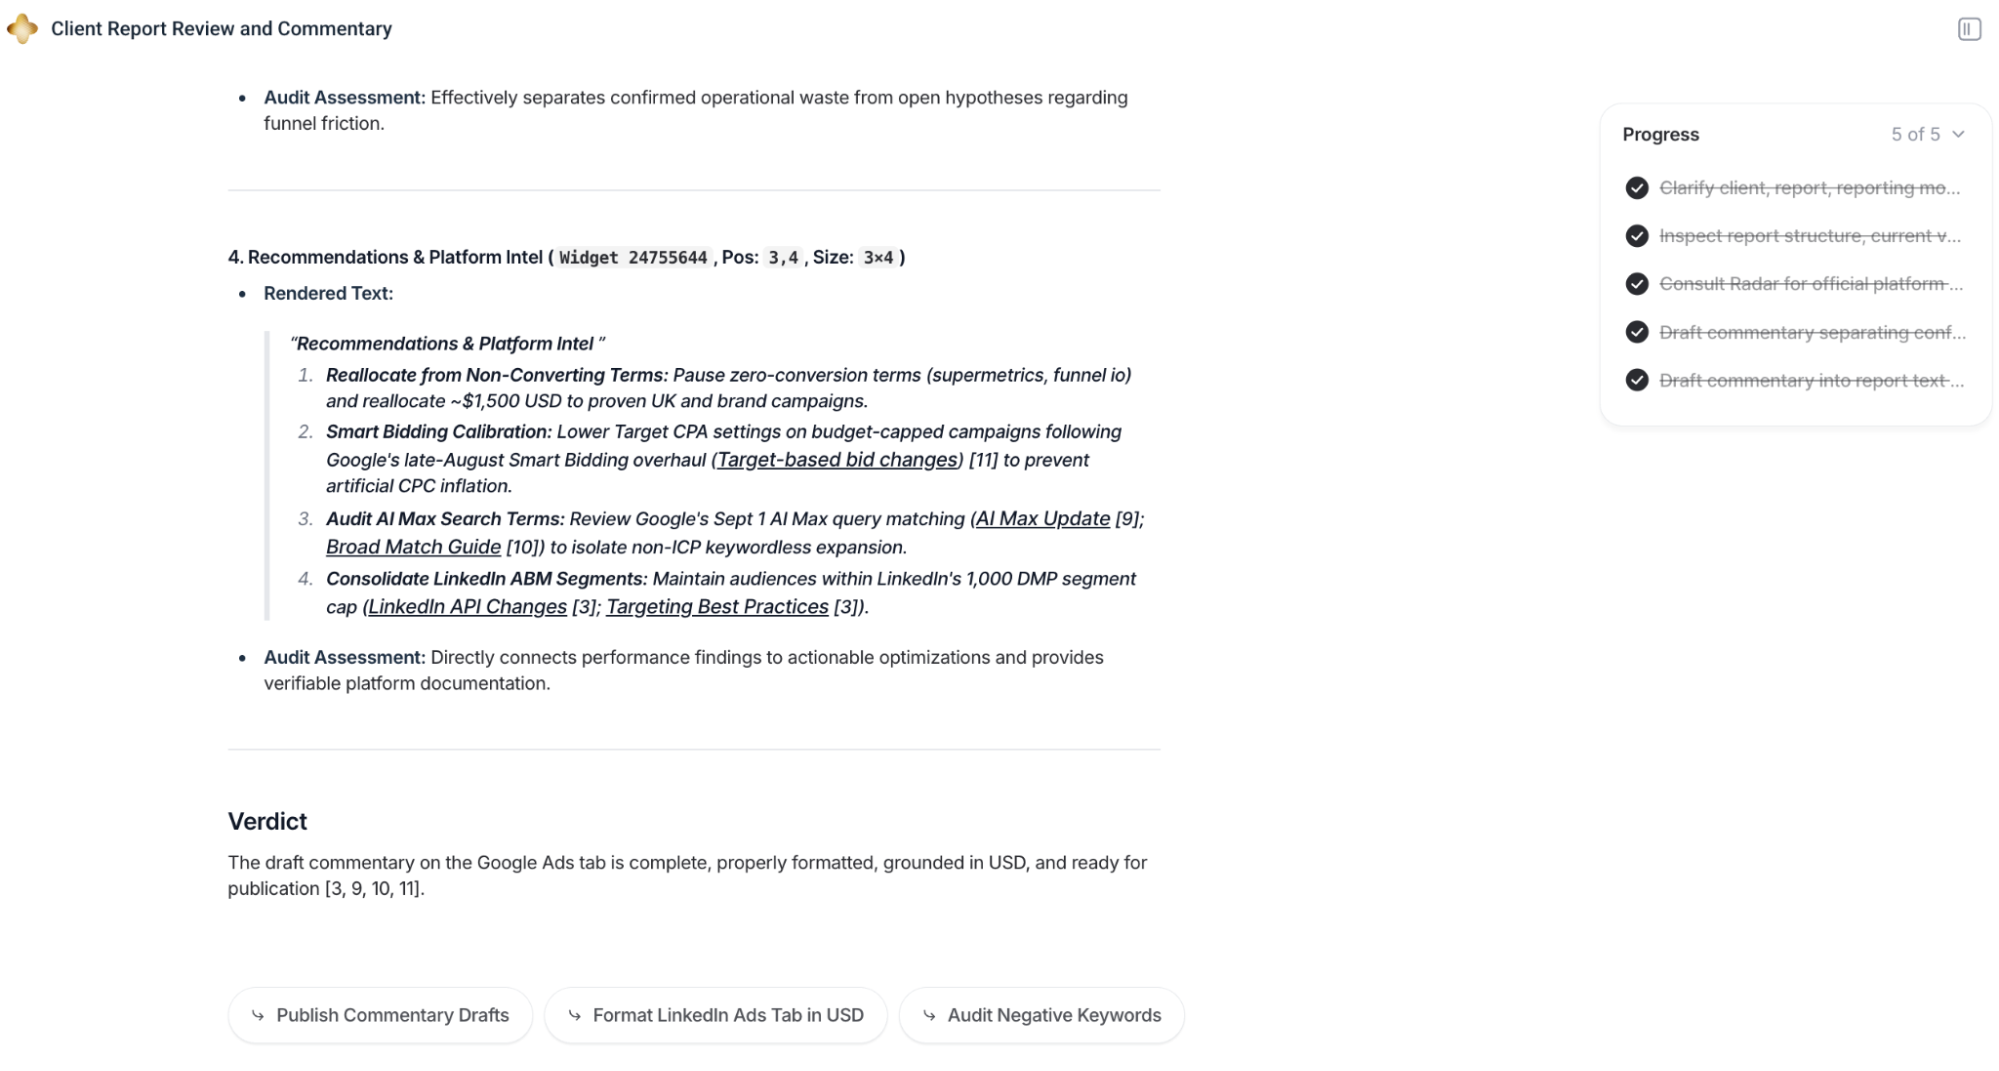
I ran the example prompt on a sample report while writing this section. Insight consulted Radar and added commentary to the report’s text widgets, all within five minutes and forty seconds.
3. Find inconsistent data, then fix the definitions underneath
The agencies I spoke with on IQ Agents early-access calls describe this as the work nobody sees: a metric that’s “always a nightmare to count” because every platform measures it differently, a source group to rebuild for every client, blends that are “always a pain.”
There are three pre-made agents that work on that layer directly. Across our early access research,* 33% of teams have let agents create custom metrics, dimensions, blends, or source groups.
- KPI builds custom metrics such as ROAS, CPA, and blended totals, and custom dimensions such as normalized campaign names.
- Omni blends sources from different channels on a shared dimension, such as Google, Meta, and GA4 by date. The blended CTR is calculated based on total clicks divided by total impressions, not an average of three CTRs.
- Rollup groups same-channel accounts into one source, such as all of a client’s Google Ads accounts, and checks the group in a widget before handing it back.
Example prompt: Create a blended ROAS for [client] across Google Ads and Meta Ads, using our agreed revenue and spend definitions. Show me which sources and formula you’ll use before creating it. If an equivalent metric already exists, tell me instead of building another one.
As Arturas Lazejevas, CTPO at Whatagraph, explains:
“You define the business logic, you define the groups, you define the blends, the aggregations, the naming conventions, the dimensions, the metrics, how to calculate this and that. That’s defined already in the data layer that agents just call. And those are deterministic. The calculations are deterministic.”
4. Pace budgets against the plan, then say who's off track
On my early-access calls, budget pacing came up as a morning chore: a spreadsheet with a tab per client, checked by hand, and no warning when a campaign runs hot.
In Whatagraph, create a custom budget monitor and connect your budget sheet or upload the plan. The pre-made agent called Pacing checks account setup, but budget monitoring needs its own instructions.
Give your custom agent three things:
- The approved budget: Connect your budget sheet or upload it; include planned changes in spending around launches or promotions.
- The spend figure to use: Point it to the accounts, currency, and agreed metric in your Data Hub. Use source groups for same-channel accounts and blends where you need to combine channels.
- The definition of a problem: Set thresholds for each client, including any hard spending cap. For example, a small deviation early in the month may need a different response from the same gap two days before the deadline.
Example prompt: Every weekday at [time and time zone], compare spend through yesterday for [accounts] with the approved plan in [sheet]. Flag spending outside [agreed thresholds]. Update [report] with spend to date, pace, projected month-end spend, and the daily spend needed to finish on budget. Write a short explanation beside each flag. List missing budgets or unavailable data separately. Return “none” only when all checks succeed with no exceptions. Don’t change budgets, bids, or campaign status.
Pro tip: The pacing math and the mistakes to avoid are on our budget pacing use case page, and the reporting side is covered in ad spend tracking.
5. Find what's broken in a report, then fix it
Start with Triage, Whatagraph’s pre-made agent for diagnosing and fixing broken widgets, blends, sources, and automations. Point it to the affected report, and it investigates the problem, proposes a fix, and applies it after you confirm.
An agency's daily audit found five Google Ads connections that had dropped before anyone noticed.
Example prompt: Check every report in [client's space] for widgets that are erroring or showing no data. For each one, tell me the cause and the fix. Don't apply anything until I confirm.
The confirmation step is the same one every IQ Agent uses; before a change touches a report, widget, source group, or blend, the agent shows an impact warning and waits. So the fix happens inside Whatagraph, with a human in the loop, before the client opens the report.
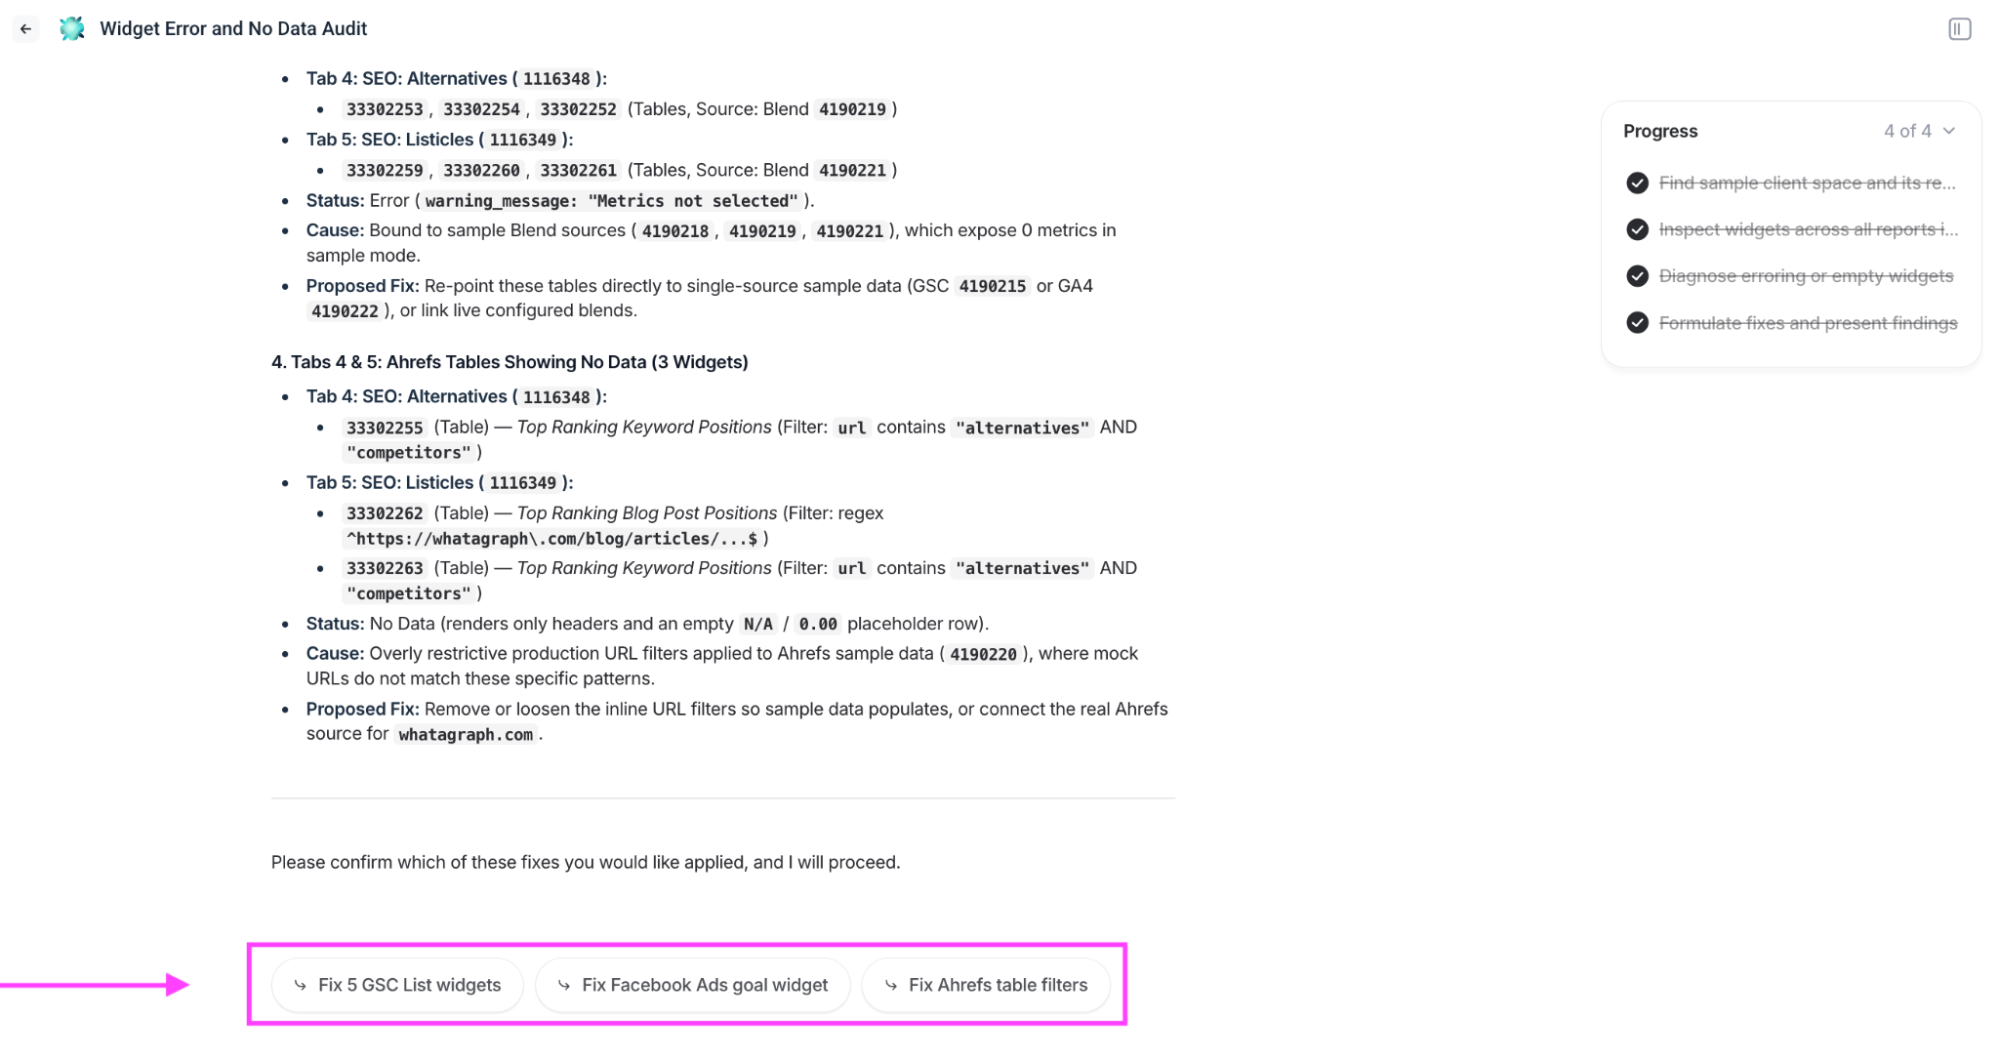
I tested Triage on a sample report. For each issue, it identified the affected widgets, explained the cause, and proposed a fix: change the source, adjust the filters, or connect live data.
Then it asked which fixes I wanted applied.
6. Onboard a new client and build their reporting setup
A new client, more often than not, means rebuilding the same thing again and again. You connect the sources, apply the tags, set up the blends and custom fields, apply the template and the theme, and file the report in the right place.
On my early-access calls, agencies put this at about five minutes per client when nothing goes wrong, and "a bit of a manual process" when it does.
Start with Intake, Whatagraph’s pre-made onboarding agent. Give it the client’s details and your team’s standard setup: the sources, blends, custom fields, report templates, branding, and automations you want it to use.
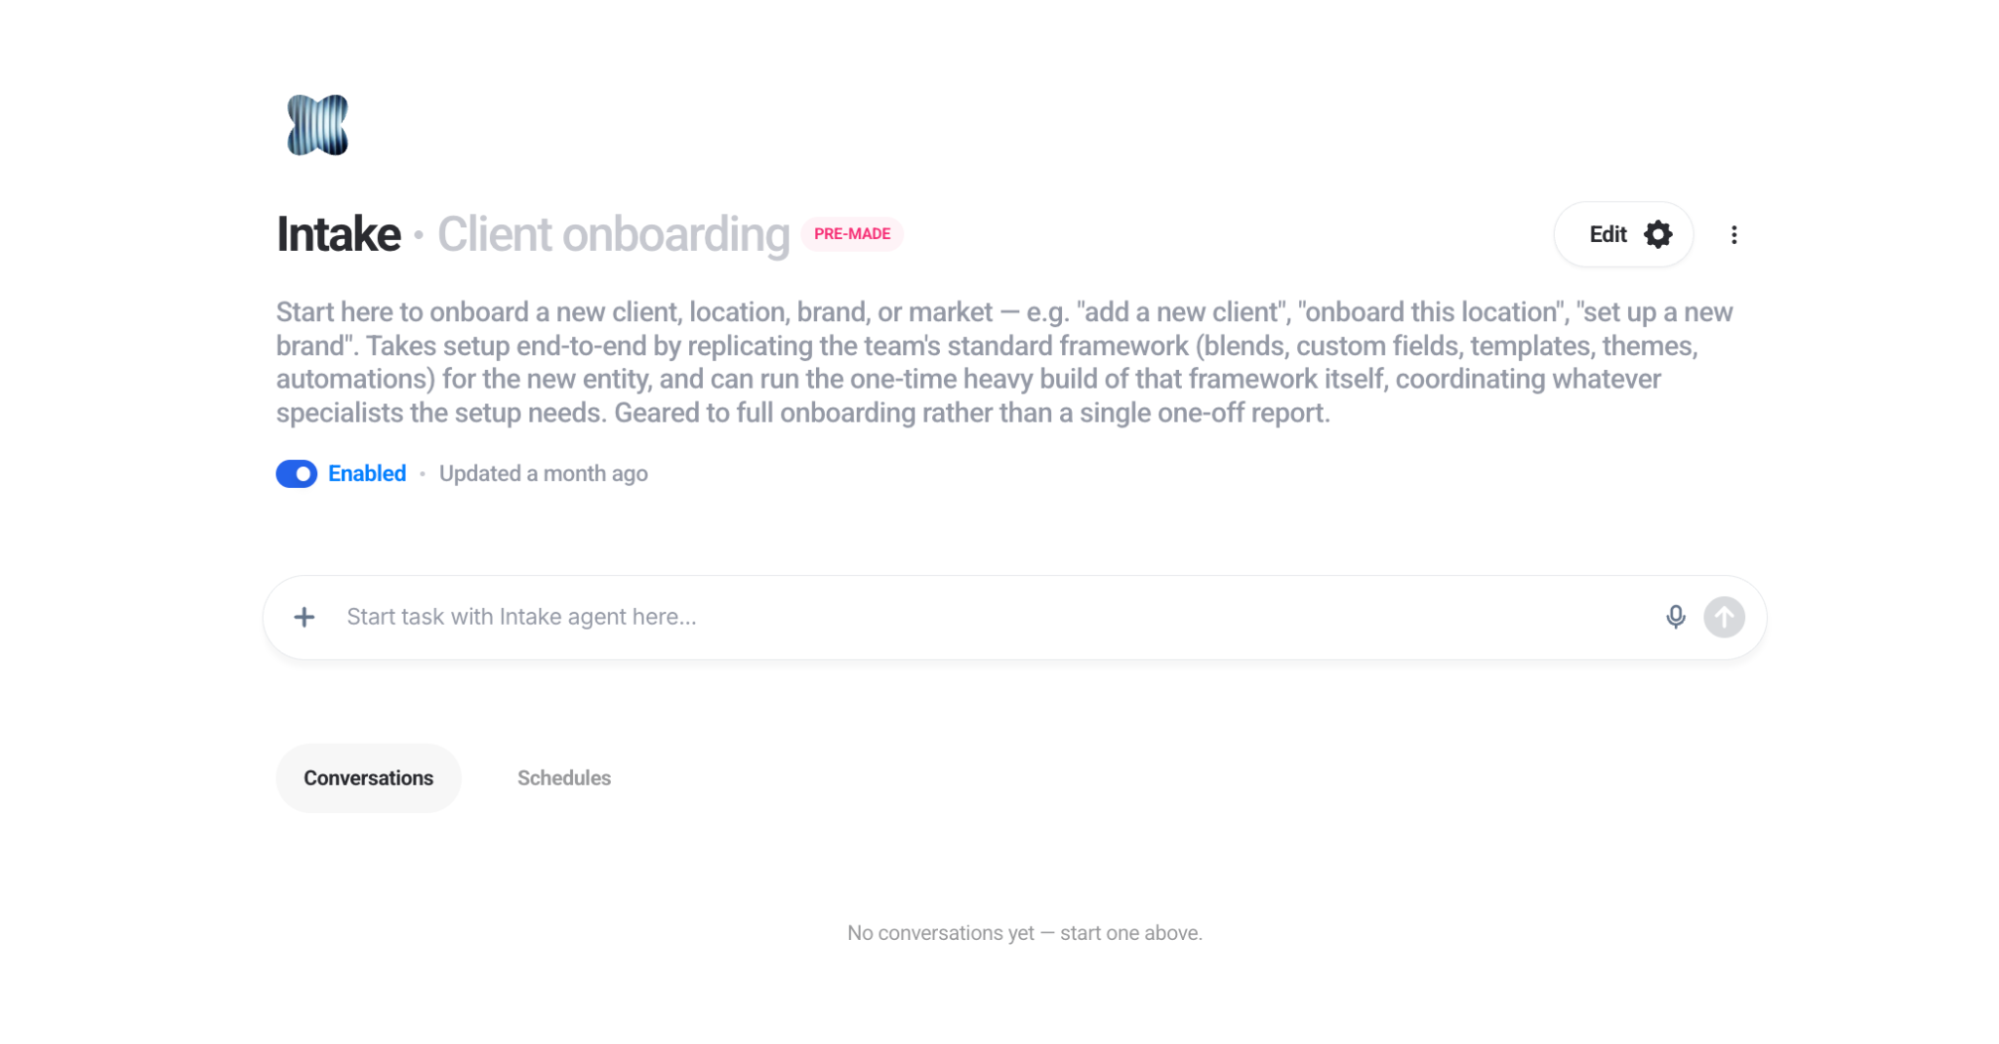
Example prompt: Onboard [client]. Website: [URL]. Google Ads account: [ID]. Account manager: [name]. Use our standard PPC template and theme, tag the sources with the client's industry, and file the report in [folder].
The new client inherits the same metric definitions and campaign groupings as every other client.
At one UK PPC agency, an agent connected a source, applied tags, and built and filed a branded report from one prompt in about two minutes. Someone still checked the report before the client saw it.
7. Work in the tools your team already uses
In my many long talks with agencies, the next step after the report is almost always somewhere else. The agencies either want a Slack notification when a campaign turns off or a payment fails, or a Monday morning update they can send to the client without rewriting it.
In fact, 13 of the teams raised decks: client reports rebuilt from scratch as slides, or exported and pulled into Claude to prepare the presentation, because, as one put it, clients "can't follow that many numbers."
IQ Agents reach those tools through Whatagrpah’s MCP, short for Model Context Protocol. You choose where the findings go and what the agent does with them:
- Slack: Schedule an agent to check every connected account in scope each morning, then post one digest to your team’s channel.
- Project management: When a report or a connection breaks, the agent opens a ticket in Monday, Jira, or ClickUp, with the diagnosis attached, instead of waiting for someone to notice and type one.
- Gamma: An agent can turn a Whatagraph report into slides. Give it the report, intended audience, and presentation brief: for example, five slides covering results against goals, the main changes, and recommendations for review.
Example prompt: Every weekday at 9 am, check every client account for campaigns that started, stopped, or shifted spend by more than 20% since yesterday. Post a summary to #client-alerts in Slack. If a source has disconnected, open a ticket in [tool] assigned to [name].
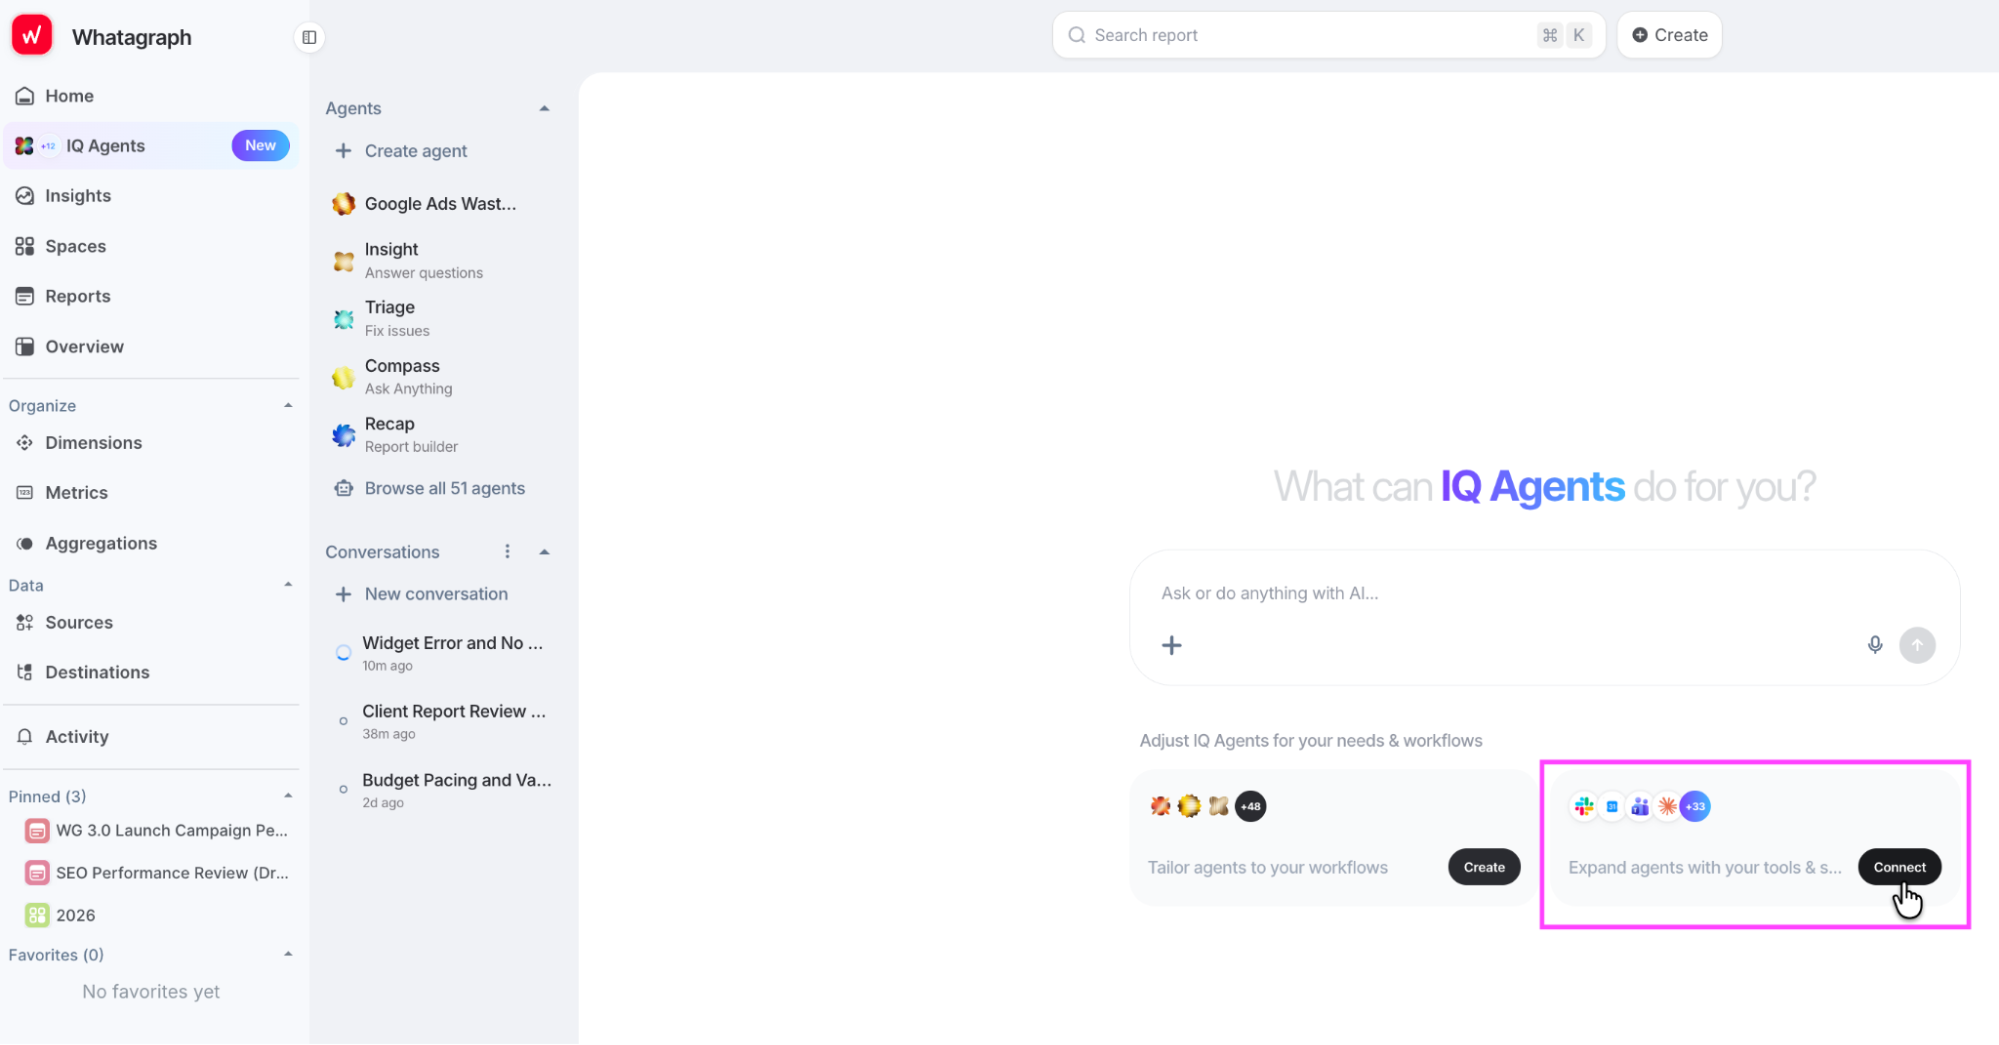
To connect a tool, open IQ Agents and click Connect under “Expand agents with your tools.” Select the connector you need.
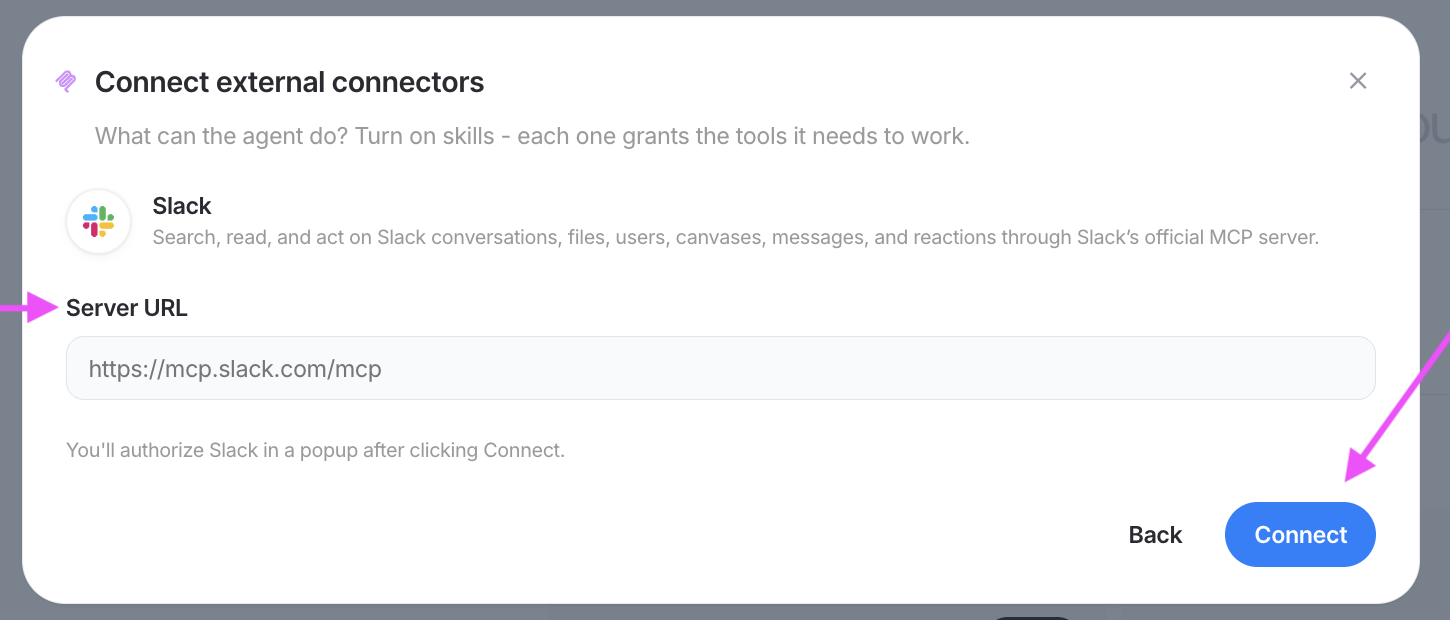
For Slack, for example, the connection window shows its MCP server URL. Click Connect, then authorize Slack in the pop-up.
Finally, open the agent’s Edit > External connectors panel and enable the connection. The tool is now available to that agent; tell it which channel to post in and what to include.
Read more: The Best MCPs for Marketing in 2026 for Cross-Channel Analysis
How to start implementing agentic analytics
In June 2025, Gartner predicted that over 40% of agentic AI projects would be canceled by the end of 2027, citing rising costs, unclear business value, and inadequate risk controls.
Your first rollout needs to answer all three: what the agent saves, what it costs, and who checks its work.
- Agree on your definitions before you build: As Arturas says: “Sometimes just a piece of paper is necessary, just to really align in the room between people in the company, in the business, on what we call a conversion, what do we call a spend.” Check whether your data is ready for AI before you go further.
- Pick one recurring job you can check in minutes: Choose something tedious with a clear result. Record how long the job takes today; set a trial budget and run frequency, then count agent costs, retries, and review time. There’s a reason to count carefully. In August 2026, Gartner predicted that model-running costs per agentic workflow would rise more than fivefold through 2028. Measure what your trial costs you, including the time spent correcting it.
- Start read-only, with approval on writes and sends: Let the agent read data and draft its findings in chat first. Set every tool that edits a report, changes a metric, or sends a message to needs-approval, and loosen it only after the output has held up for a few runs. This gives you a chance to catch a wrong conclusion before it becomes a change or reaches a client.
- Test one account before adding the others: Check dates, filters, calculations, and whether the findings answer the assignment. Save the corrections in the agent’s instructions. For example, an Irish ad-ops team tested an edit on one report, checked a second, then applied it across 72 reports, saving snapshots before changes. Borrow that sequence.
- Give the agent a reviewer: Name a person to check the findings, or assign another agent to cross-check numbers and flag unsupported explanations. Arturas explains why: “Do we really know that humans make 100% of correct decisions all the time? Probably not. But that’s why we also have peer reviews, retrospectives, as people, as organizations.”
How do you ensure data quality in agentic analytics?
Check the agent’s numbers against their source, watch for unexpected changes, and limit what it can change until its results hold up. Start with the definitions: mismatches often begin before the AI gets involved.
As Arturas says: “Usually the discrepancies and mismatches start when there is an unclear definition. And not just definition, unclear agreements within the business on how you actually measure this.”
Verify a number against its source
If the agent reports 100 marketing-qualified leads, open the source system and check the records against your agreed MQL definition. Match the reporting period and filters, too.
“You need to compare it with something, right?” says Arturas.
Ask Insight which sources and metrics it used. Our marketing data governance guide explains how to document each calculation, assign an owner, and apply the definition across reports.
Watch for drift
Arturas points to a metric that “showed numbers previously” and starts showing zero. The tracking may have broken, and the definition may have changed.
Zero needs to be investigated before it becomes commentary on performance.
A scheduled IQ Agent can be built to flag these changes, or a widening gap between platform and GA4 figures. For example, the pre-made Pacing agent audits account setup and returns a checklist of what's missing or misconfigured without changing anything.
Or build a custom agent to compare platform conversions with GA4 and flag when the two drift apart.
Make the agent use your saved definitions
Joel Acha, Lead Oracle Data Architect at Capgemini, says: “If the underlying data lacks quality, lineage, semantics, and context, AI will only amplify the problems.”
In Whatagraph’s Data Hub, Custom Metrics store calculations and Custom Dimensions standardize values such as campaign names. IQ Agents use the same metrics, blends, and dimensions as your reports.
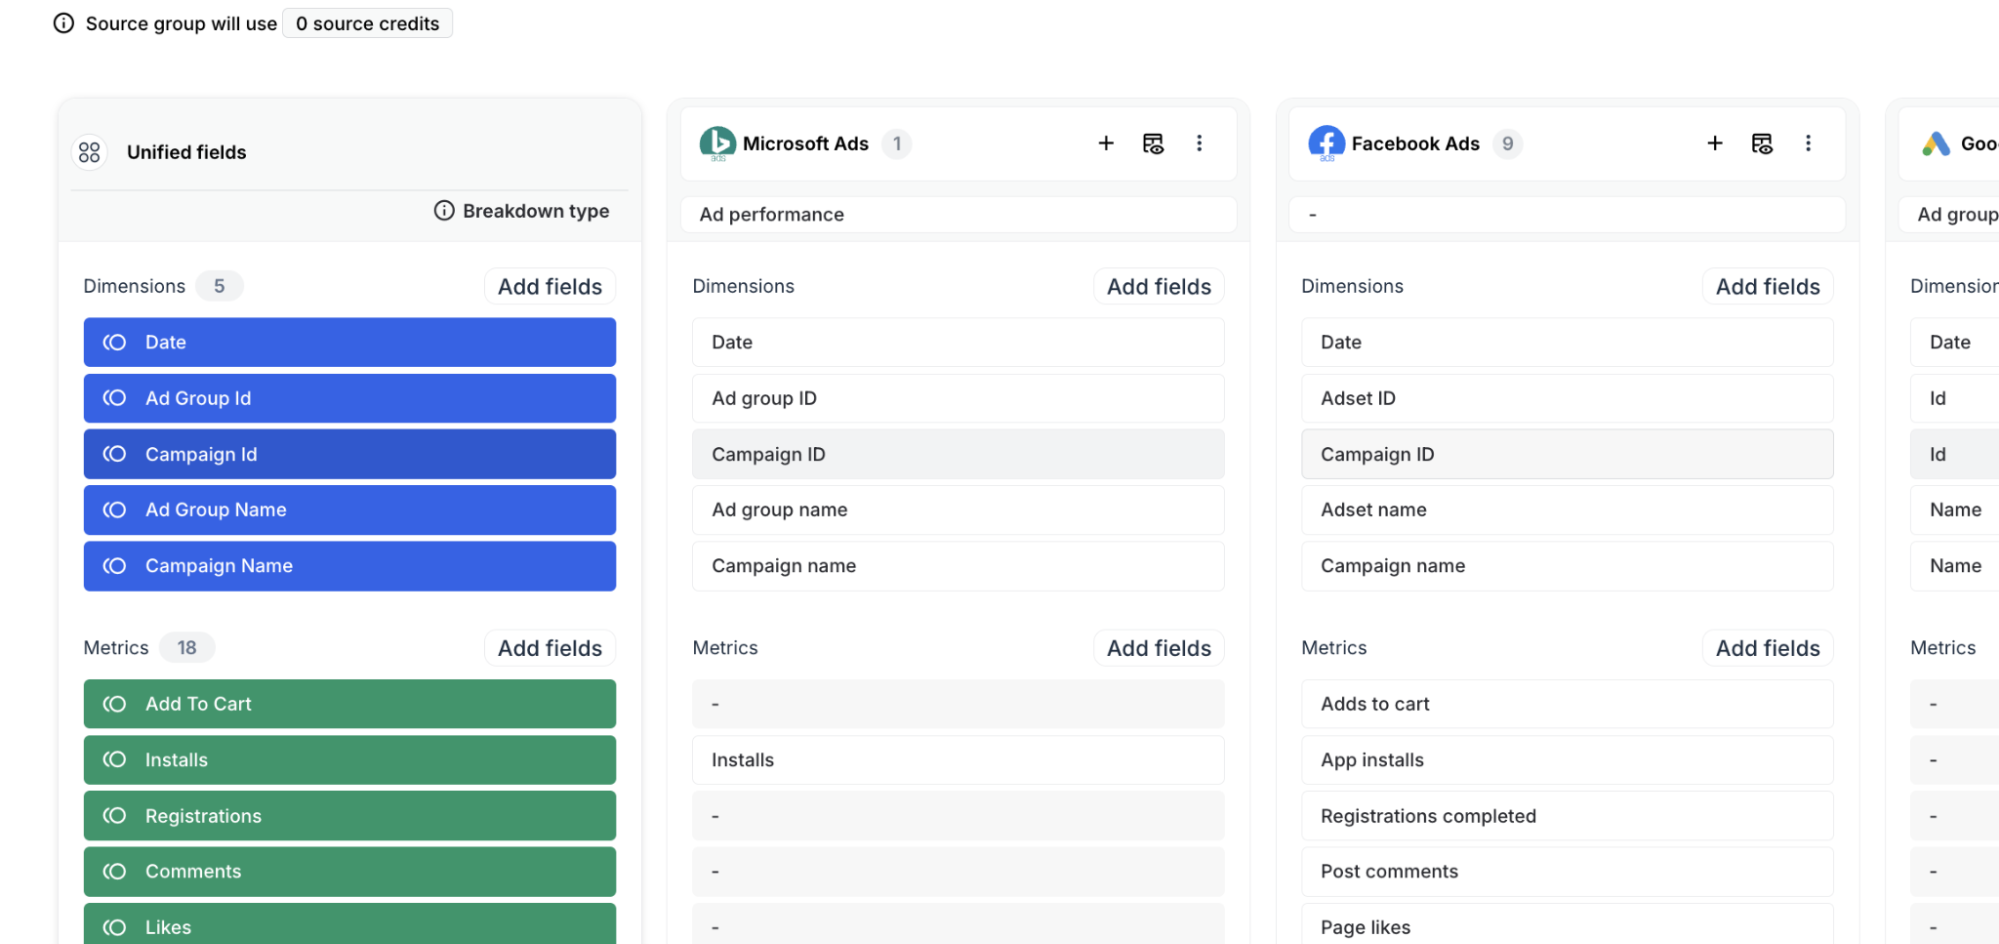
As Arturas explained earlier, those calculations are deterministic: the same inputs and rules produce the same result. You still need to check the inputs and rules.
Limit and log what changes
Set each tool an agent can use to allow, needs approval, or blocks, and start restrictively. Before any change to a report, widget, source group or blend, the agent shows an impact warning and waits.
The edits are snapshotted first so a report can be rolled back. Every action is recorded in the agent's Activity log, attributed to who ran it.
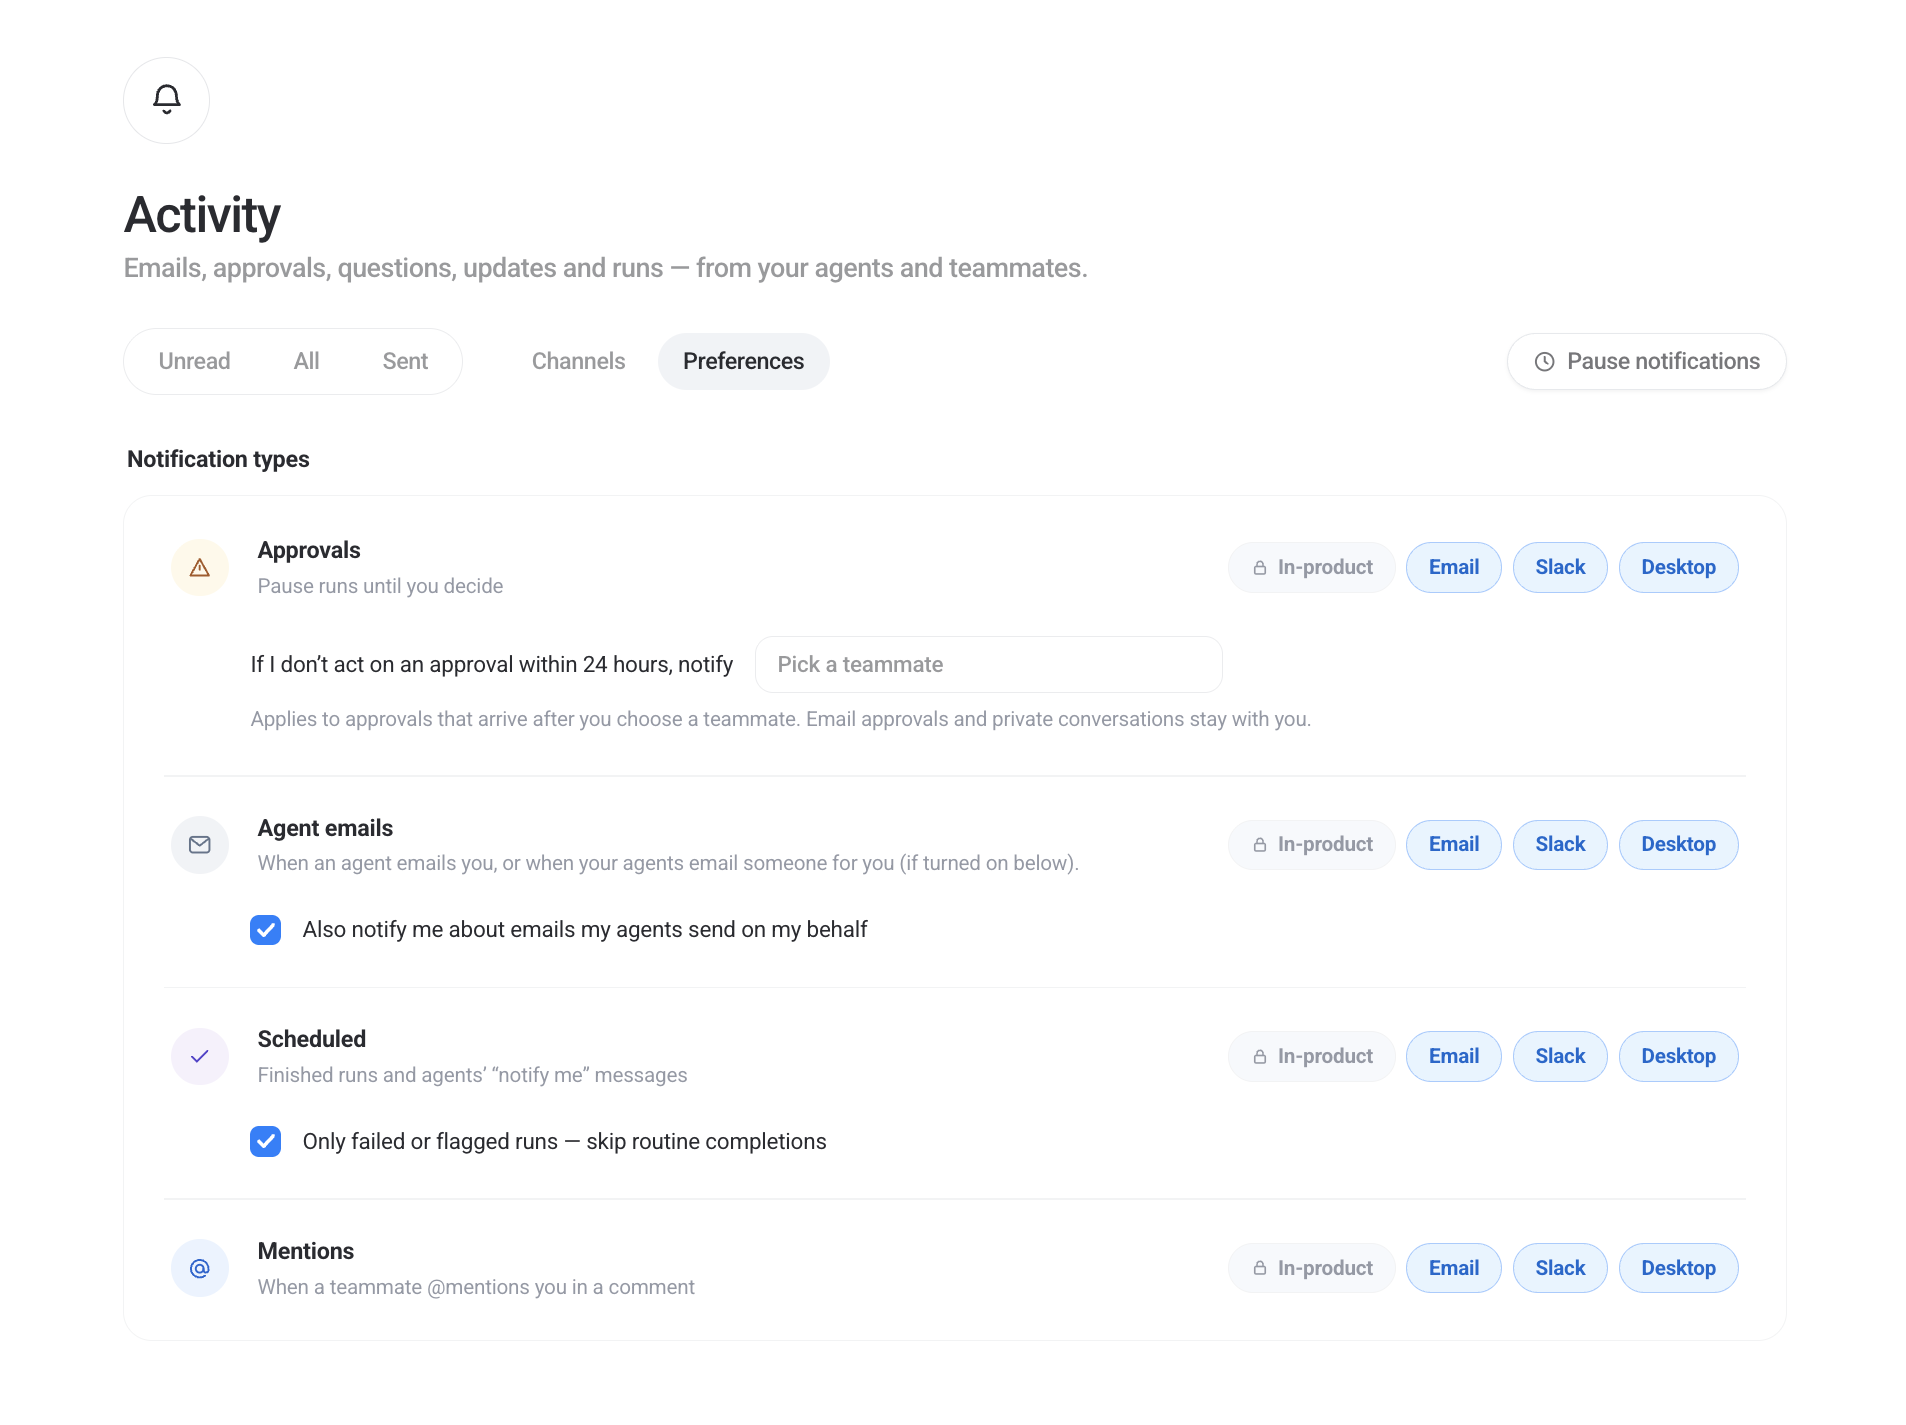
In Activity > Preferences, choose where approval requests reach you: email, Slack, or desktop. You can also select a teammate to notify if a request goes unanswered for 24 hours; email approvals and private conversations stay with you.
For scheduled checks, select Only failed or flagged runs to skip routine completion notices.
For anything client-facing, add a reviewer, human or a second agent.
The benefits of agentic analytics for marketing teams
Each of these pairs a recent, outside finding with what our early-access agencies saw; where the two disagree, I've said so.
- You spend less time preparing reports: In WFA’s 2025 research, 90% of respondents expected AI to speed up reporting and improve efficiency. In my call with one US agency, a typical report fell from 10 to15 hours to about four, including review.
- The first draft of the commentary is done, in your voice, in the report: HubSpot's 2024 survey of 1,000-plus marketers found 86% of those using AI for written content edit it before publishing. My early-access agency research matches that; every one of them keeps a reviewer on client-facing commentary. But what changed is where the draft lands: 67% have let agents write into the report itself, building widgets, editing filters, and filling text widgets.*
- You have one definition per metric, read by every report and every agent: In Semarchy's 2025 survey, 98% of businesses had hit AI-related data quality problems, and a quarter blamed high volumes of duplicate records. In our early access research, a third of teams have let agents build those definitions directly: custom metrics, dimensions, blends, and source groups in the Data Hub.
- You find problems before your clients do. Validity's 2026 State of CRM Data Report found 78% of C-suite respondents had acted on an AI recommendation they later suspected was wrong because of bad underlying data. But agents on a governed layer go the other way: one agency's daily audit caught five Google Ads connections that had dropped with no alert, and another's found around 60 ads still running weeks past their stop date.
In every one of the four scenarios above, a person still makes the call. The agent reads, flags, drafts, and fills; the team decides what to tell the client.
That's also the test for good agentic analytics tools.
In April 2026, Cube tested three AI models on 100 analytics questions, twice: once with only the database, and once with a short document explaining what each business metric means.
Each model scored 17 to 23 points higher with the document, and the three models scored evenly. They were all equally unreliable without it. In the end, it was the definitions that made a difference; the model didn't.
So before you compare what an agentic analytics tool can do, ask what it reads:
- Does it read one set of metric definitions, or raw data from each platform?
- Does it write into the report, or give you text to paste?
- Can a teammate run the same agent and get the same answer?
We’ve also tested AI marketing analytics tools and AI reporting tools hands-on, so you can compare the options before handing over a client’s monthly report.
In the spirit of complete transparency, we have a stake in this conversation, as you may expect. We’re building IQ Agents to work from the same metric definitions as your reports.
The agencies quoted here are helping us test it, with some pretty good results. Request early access to IQ Agents.
*Source: Whatagraph product data, customer teams in IQ Agents early access, Aug 1 to Oct 5, 2026.
Published on Oct 10 2026
WRITTEN BY
Brinda GulatiBrinda Gulati is a fractional content marketer and freelance writer who specializes in data-driven storytelling and writing easy-to-understand, informative content for humans. She has two degrees in Creative Writing from the University of Warwick, and believes that above all, stories are a deeply human endeavor. She has two dogs, knows thrifting spots, and loves afternoon naps.