Why Client Reporting Matters: 5 Outstanding Client Report Examples + Templates
Client reporting is not just a routine task — it's a pivotal component of successful client-agency relationships. Effective client reports provide transparency, demonstrate value, and guide strategic decisions, making them indispensable tools for marketing agencies. But what exactly makes client reporting so crucial, and how can you ensure your reports stand out?

Jun 12 2024●10 min read


In this article, we explore the significance of client reports and showcase five outstanding examples. These customizable templates can help you create reports that not only inform but also impress your clients. Discover how to elevate your reporting game and solidify your agency's reputation for excellence.
What is client reporting?
Client reporting is the process of sending clients regular reports on their marketing performance. The reports usually include a high-level summary, the performance of different marketing channels, campaign goals, and any other important information the client may need, such as next steps.
As a foundation for strategic decision-making, client reporting focuses on your clients' metrics such as website traffic, social media growth, lead generation, sales, brand recognition, market analysis, advertising spend, etc.
You pull these statistics weekly, enter them into a report, and put them in context for your clients. That’s why the client report is the basis for the discussion between you and your client. It’s a conversation that allows you to show how great you are at your job.
Besides a client report, you can also create an agency dashboard. The main difference is that dashboards are always up to date as they have live data. Whenever the client checks a dashboard, they’ll get real-time results and stats.
Why is client reporting important?
Reporting on marketing results as an executive summary of the finished work is the staple of client management. Here is why marketing agency client reporting is important.
Builds transparency and trust
Regular client reports demonstrate accountability, showing clients exactly where their money is going and achieving results. Transparent reporting helps build trust between the agency and the client, which is essential for long-term relationships.
Even drops in performance, whether they are under your control or not, should be shared with clients. This allows not only for you and clients to deal with the issue as a team, but also to show initiative in identifying and solving problems.
Quick and accurate performance measurement
Reports provide concrete data that can be analyzed to measure the success of marketing campaigns, allowing agencies to make informed decisions. Regular reports help track key performance indicators (KPIs) and other metrics, offering a clear picture of what’s working and what’s not.
Improves client retention and satisfaction
Regular, detailed reports keep clients informed and engaged, helping them understand the value the agency is providing. Reports ensure that both the agency and the client are aligned on goals, strategies, and expectations.
Fuels strategic planning
Client reports provide insights that can inform future strategies, allowing for adjustments and improvements to be made in a timely manner. Regular reporting helps track progress towards the client’s goals and objectives, ensuring that the marketing strategies are on the right track.
Helps demonstrate value
Reports help demonstrate the return on investment (ROI) of marketing activities, justifying the client’s expenditure and showcasing the agency’s effectiveness. By detailing the outcomes of various marketing efforts, agencies can show clients the benefits compared to the costs involved.
Clearly communicate project plans and timelines, ensuring clients know what to expect and when. Consistently meet deadlines and focus on tangible deliverables that showcase your progress and achievements. Regularly report on key metrics and milestones to demonstrate the value and impact of your work.
Enables early problem detection
Regular reporting can highlight issues or underperforming areas early, allowing for swift corrective actions. Communication is key to your relationship with clients. Whether you report after each campaign ends or if you send monthly reports to show the status of their campaigns, the important thing is to do it regularly. Client or customer reporting allows you to share thoughts and ideas on the data presented. That way, you’ll prevent small problems from turning into a full-blown crisis. By consistently analyzing performance data, agencies can continuously refine and improve their strategies.
Educates clients
Reports can educate clients about the intricacies of marketing efforts, helping them understand the complexities and appreciate the agency’s work. Many clients may not know the importance of each KPI (such as CTR or conversion rate) or the difference between them.
But, your client's KPI reports can help them learn about the meaning and importance of each data point. Educating your clients by sharing your knowledge will help them figure out what you do, thus allowing them to feel involved in the whole process. An informed client is better equipped to make collaborative decisions, leading to more productive partnerships.
Marketing agencies can also effectively use reports during the client onboarding process to set the stage for a productive and transparent partnership. You can include detailed reports from previous clients to demonstrate your agency’s track record.
Use client report samples to discuss and agree upon key performance indicators (KPIs) that will be tracked and reported. A client report template is a good way to show examples of how you collect, analyze and present data. This kind of transparency reassures clients that your reporting is both reliable and accurate, while the customizable report templates give clients a preview of how you will communicate their performance data to them.
Gives agencies a competitive advantage
High-quality reporting sets an agency apart from competitors, showcasing their professionalism and commitment to the success of the client’s business. Agencies known for thorough and insightful reporting can build a strong reputation, attracting more clients and fostering loyalty.
In summary, client reporting is vital to a marketing agency’s operations. It fosters transparency, trust, informed decision-making, and continuous improvement, all of which are essential for achieving and demonstrating success in marketing efforts.
Provides an additional source of revenue
Once you demonstrate value and figure out the best pricing models for different categories of clients, your clients might be encouraged by numbers to ask for more detailed or segmented reports that you can create for an additional fee. Whether you choose to include a management fee, a flat fee, or an hourly rate for reporting, a flexible agency reporting tool can give you plenty of ways to upsell your services.
Learn more about using client reports as an added source or revenue in our webinar recording:
What is a client report?
A client report is a document that brings an overview of your client’s campaign results. You can share it with clients to inform them about key updates, metrics, and any actions you have taken. It helps maintain transparency and ensures clear communication on both sides.
In essence, a client report shows your clients why you’re the right choice for their digital marketing needs.
Some types of client reports include:
- PPC report
- SEO report
- Email marketing report
- E-commerce report
- Website analytics report
- Social media report
- Cross-channel report
Depending on your work, you’ll choose a different type of report. If you’re looking for inspiration, you can take a look at some marketing report templates to get started.
But first, here’s some real-life data.
How do you write a client report?
The content and structure of your report depend on the information you want to cover. However, there are the essential elements that every report needs to include.
Give a summary at the beginning
Start a client report with a summary that highlights the key data points. This is where you give clients a big-picture overview of what happened in the previous month, week, quarter, etc. with their marketing initiatives.
If anyone wants quick marketing insights, this is where they should find them.
Here, you should add the KPI goals and the most important metrics. This is also the perfect place to offer high-level insights, comments, and recommendations for the next period.
Present detailed analytics and explain the KPIs
In the next section or sections, you should include detailed analytics for specific marketing channels. The key performance indicators that determine how close you are to reaching the client’s goals are the core of your client reports, so make sure you have agreed on those before you create your first report.
Besides KPIs, you may also want to include additional metrics that are valuable for your client but not specifically related to agreed goals.
If your client has little marketing experience, you should explain briefly in each section that translates the numbers of graphs or tables in simple language. These explanations can include:
- A comparison of what a metric means against industry benchmarks. A 5% conversion rate for a website may sound poor to a layman, but in reality, it’s an excellent result.
- An explanation of what has been done in a specific channel. Let’s say you drove 30% more organic traffic in a quarter — explain how this was achieved with your marketing process.
- Explanation of the next steps. Whether the KPIs are looking good or bad, you can elaborate on them and explain what happens next.
Pro tip: Whatagraph reports have a convenient text widget that you can fit into any report page to give additional information about the data.
End the report with expanded recommendations and next steps
The end section of the report should sum up the findings from the previous one. This is a good place to present the plan for next steps. Explain what you will do to bring the client closer to their goals and don’t avoid mentioning problems you need to resolve.
How to make client reports more engaging for readers?
In a recent survey of large marketing agencies, we discovered a significant gap in agency-client communication caused by a simple problem — clients don’t read the reports.
While it can be argued that clients are primarily interested in results, not being up to date with an agency's efforts can have negative consequences on the client relationship.
First, clients may get a false understanding that the agency is not doing enough, that its strategy is not personalized enough, or that it lacks the expertise to effectively target the client’s audience with the right messaging.
But how to avoid these misunderstandings?
By making your client reports more engaging from the very beginning.
- Tailor the report to your client's needs: Customize reports to reflect each client’s specific goals, metrics, and interests. Incorporate the client’s branding elements, such as logos and colors, to make the reports feel more personalized.
- Create a clear presentation: Use charts, graphs, and infographics to present data in a visually appealing and easily digestible format. Include executive summaries and key takeaways at the beginning to provide a quick overview of the report’s main points.
- Offer actionable insights: Provide clear, actionable recommendations based on the data presented, outlining next steps and strategies for improvement. Offer context for the data, explaining why certain metrics are important and how they impact the client’s business.
- Use interactive elements: Create interactive dashboards that clients can explore, allowing them to dive deeper into the data that interests them most. Include hyperlinks to additional resources or drill-down options within the report for more detailed information.
- Report consistently: Send reports on a regular schedule (e.g., weekly, monthly, quarterly) to keep clients informed and engaged. Provide timely updates on key metrics and campaign performance, especially for ongoing projects.
- Take a storytelling approach: Use storytelling techniques to present data in a compelling way, connecting the numbers to the client’s broader business objectives. Include relevant case studies or examples to illustrate points and make the data more relatable.
Clearly and transparently display the results from your campaigns, in addition, ensure that you include the work undertaken with commentary, and future work to be done. A bonus is to include any industry updates in reports to explain how things may impact them and how you are navigating them.
- Include client feedback: Encourage clients to provide feedback on the reports and suggest improvements or additional information they’d like to see. From Q&A sessions to building reports with clients, any opportunity to discuss report findings can give you valuable information to both tune in your strategy and present the results in the most effective way.
- Focus on ROI and value: Today’s client reporting tools return a stream of marketing data, which makes it easy to lose focus and include too much information in your report. Emphasize the return on investment (ROI) and the tangible value delivered through marketing efforts. Show how the marketing activities translate into business benefits, such as increased leads, sales, or brand awareness.
- Use available technology: Utilize automated client reporting to ensure consistency and accuracy, freeing up time to focus on analysis and insights. Provide clients with access to a dedicated portal where they can view reports, track progress, and access historical data. Whatagraph allows you to share direct access to any dashboard via a live link. This way client’s can see the latest data whenever they need, without getting you into the loop every time they need to hold a meeting.
- Keep the language simple: Use simple and clear language, avoiding technical jargon that might confuse clients. Provide definitions and explanations for any necessary technical terms or metrics.
By implementing these strategies, you can make marketing agency client reports more engaging, informative, and valuable to their clients, fostering a stronger and more collaborative relationship.
Why 42% of businesses are not happy with their client reports
We did some research and found out what businesses generally think about the reports they get from their marketing agencies. Surprisingly enough, 42% of clients are not happy with the reports that agencies send them.
Here are the most common reasons:
- Lack of performance breakdown by marketing channel
- No clear overview of top-level KPIs
- Not enough insights on market segmentation
- Not enough comparison against industry benchmarks
- Not enough recommendations and next steps
- Not enough explanations for non-marketers
So, if you want to improve your agency-client relationship, create better reports, and improve your bottom line, these are some of the things you should pay attention to. Let’s see what that looks like in practice.
5 essential client report examples
By now, you must be thinking that dotting all the I’s and crossing all the T’s to get client reports right is too overwhelming, even for a team of marketers. Luckily, there are Whatagraph report templates you can use right off the shelf. Let’s take a closer look at the ins and outs of the most valuable client report samples.
1. Monthly client marketing report
A monthly marketing report is the most effective way of reporting for most clients. The monthly data span is big enough to give accurate projections while your clients can see trends and changes in context.
For example, a multi-channel report can help you present the impact of your marketing initiatives and long-term projects, such as search engine optimization, PR, and content marketing campaigns.
What insights can your clients get from a monthly report?
- Overall website analytics
- A reminder of goals to pursue
- The client’s goals completed
- Overview of campaign performance
These metrics help you demonstrate SEO ROI via dashboard reports that connect organic performance to actual business results.
Where to find this data?
- Google Analytics 4 dashboard (in a monthly time frame)
- Social media analytics
- Ads platforms
- An SEO tool
OR you can simply pick Whatagraph’s Monthly Marketing Report Template, connect the client’s sources, and voila — there you have a one-stop client report for presenting your results from SEO to email, to social to PPC with engaging data visualization.
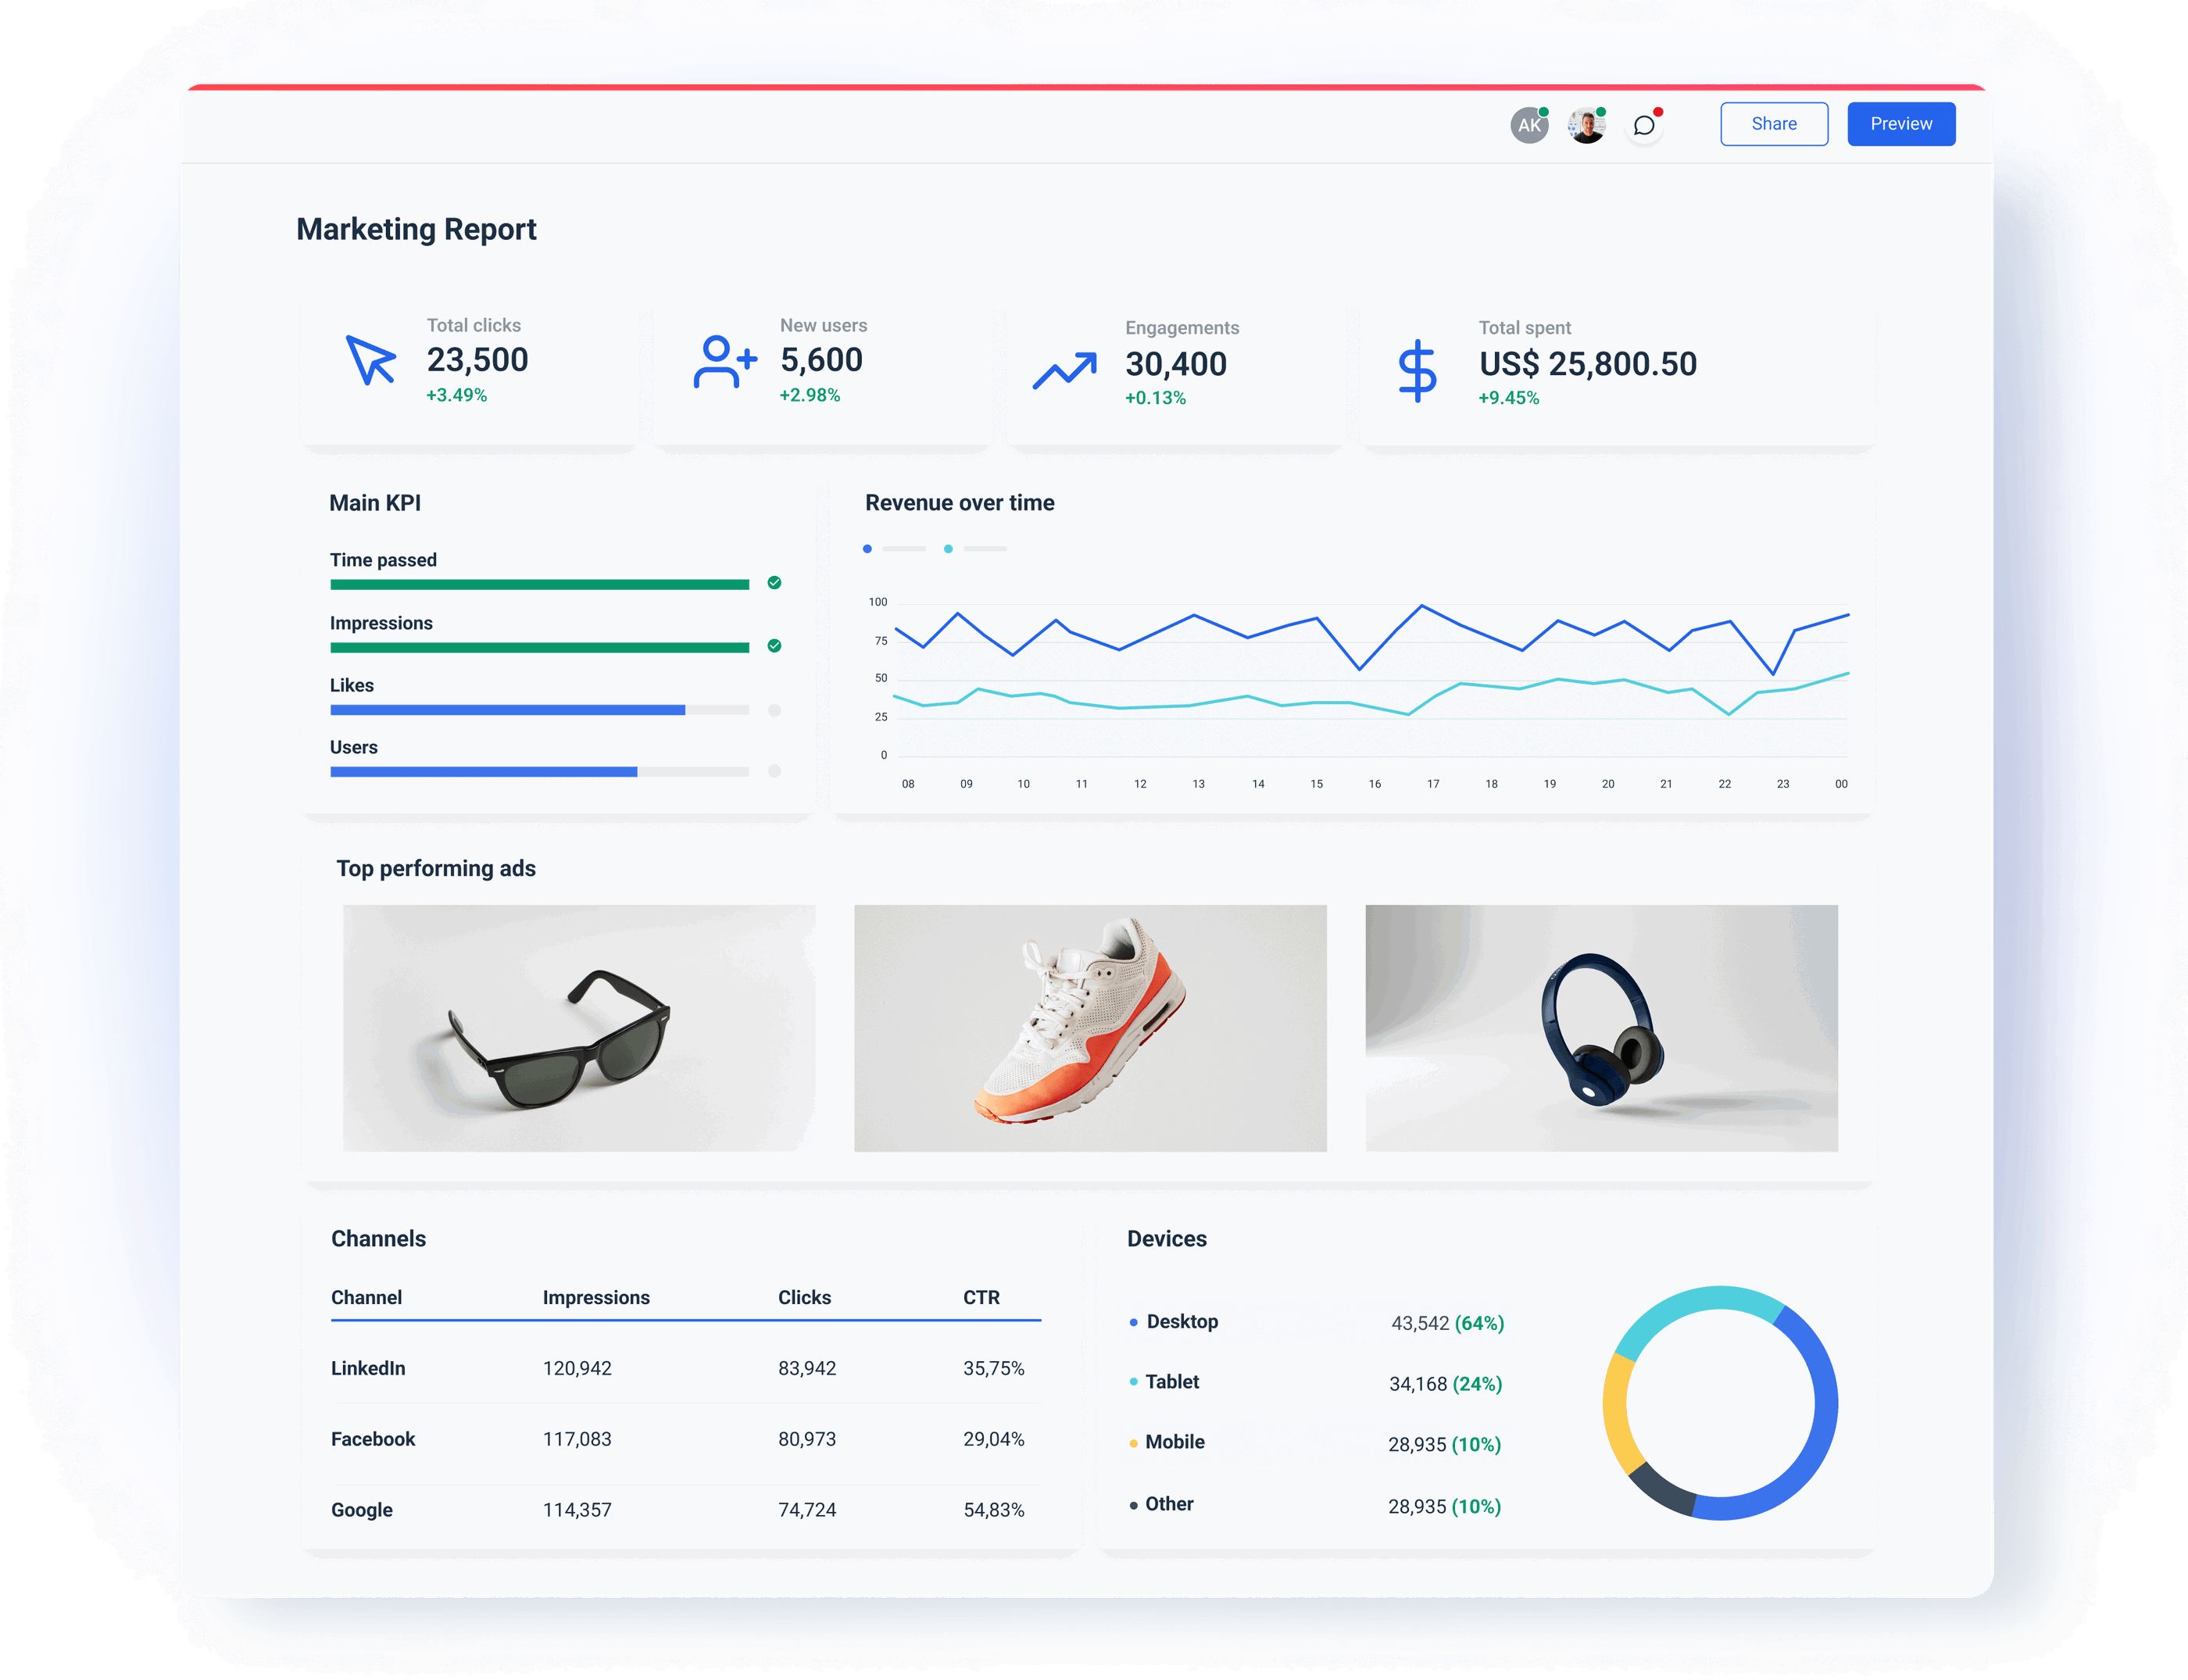
By default, our cross-channel marketing report has seven sections:
- Performance overview: Progress bar chart with time passed, goal completions, as well as widgets for media spend, conversions, and cost per conversion.
- Acquisition overview: Top channels conversions vs. users (direct, organic, paid, referral).
- Website overview: A new users vs. user graphs, gauges for bounce rate, average session duration, and page performance.
- Audience overview: Users per device, demographics, and interests as in-market segments.
- Google Ads overview: Time passed, impressions, clicks, conversions, and cost.
- Organic traffic overview: Time passed, users, new users, average rank, goal completions, and conversion rate.
- Facebook Ads overview: Time passed, impressions, link clicks, pixel leads, conversions, cost per conversion, and total spend.
As you can see, Whatagraph’s client reporting template allows agencies to overview and optimize the performance of individual clients’ channels without digging deep into each channel individually.
Instead, you can quickly present your clients with the most important key performance indicators and give an accurate report on your progress.
2. SEO client report
An SEO report is where you can show your clients how their website is performing in terms of SEO metrics, such as organic traffic, backlinks, technical SEO, etc.
The most often used is an overall SEO report that summarizes every aspect of your efforts.
What insights can your clients get from a monthly report?
- Changes in website traffic
- The difference between organic traffic and other sources
- The ratio of branded vs. non-branded traffic
- Keywords that are driving most visits
- Status of organic rankings
- Overall backlink profile
- Any technical SEO issues
Where to find this data?
- Google Analytics for traffic-related data
- Google Search Console
- Site Audit for SERP features and site health
However, stitching SEO metrics from different tools in Excel can be challenging even for experts. Luckily, everyone in your agency can connect Whatagraph’s SEO Report to your client accounts and start reporting right away.
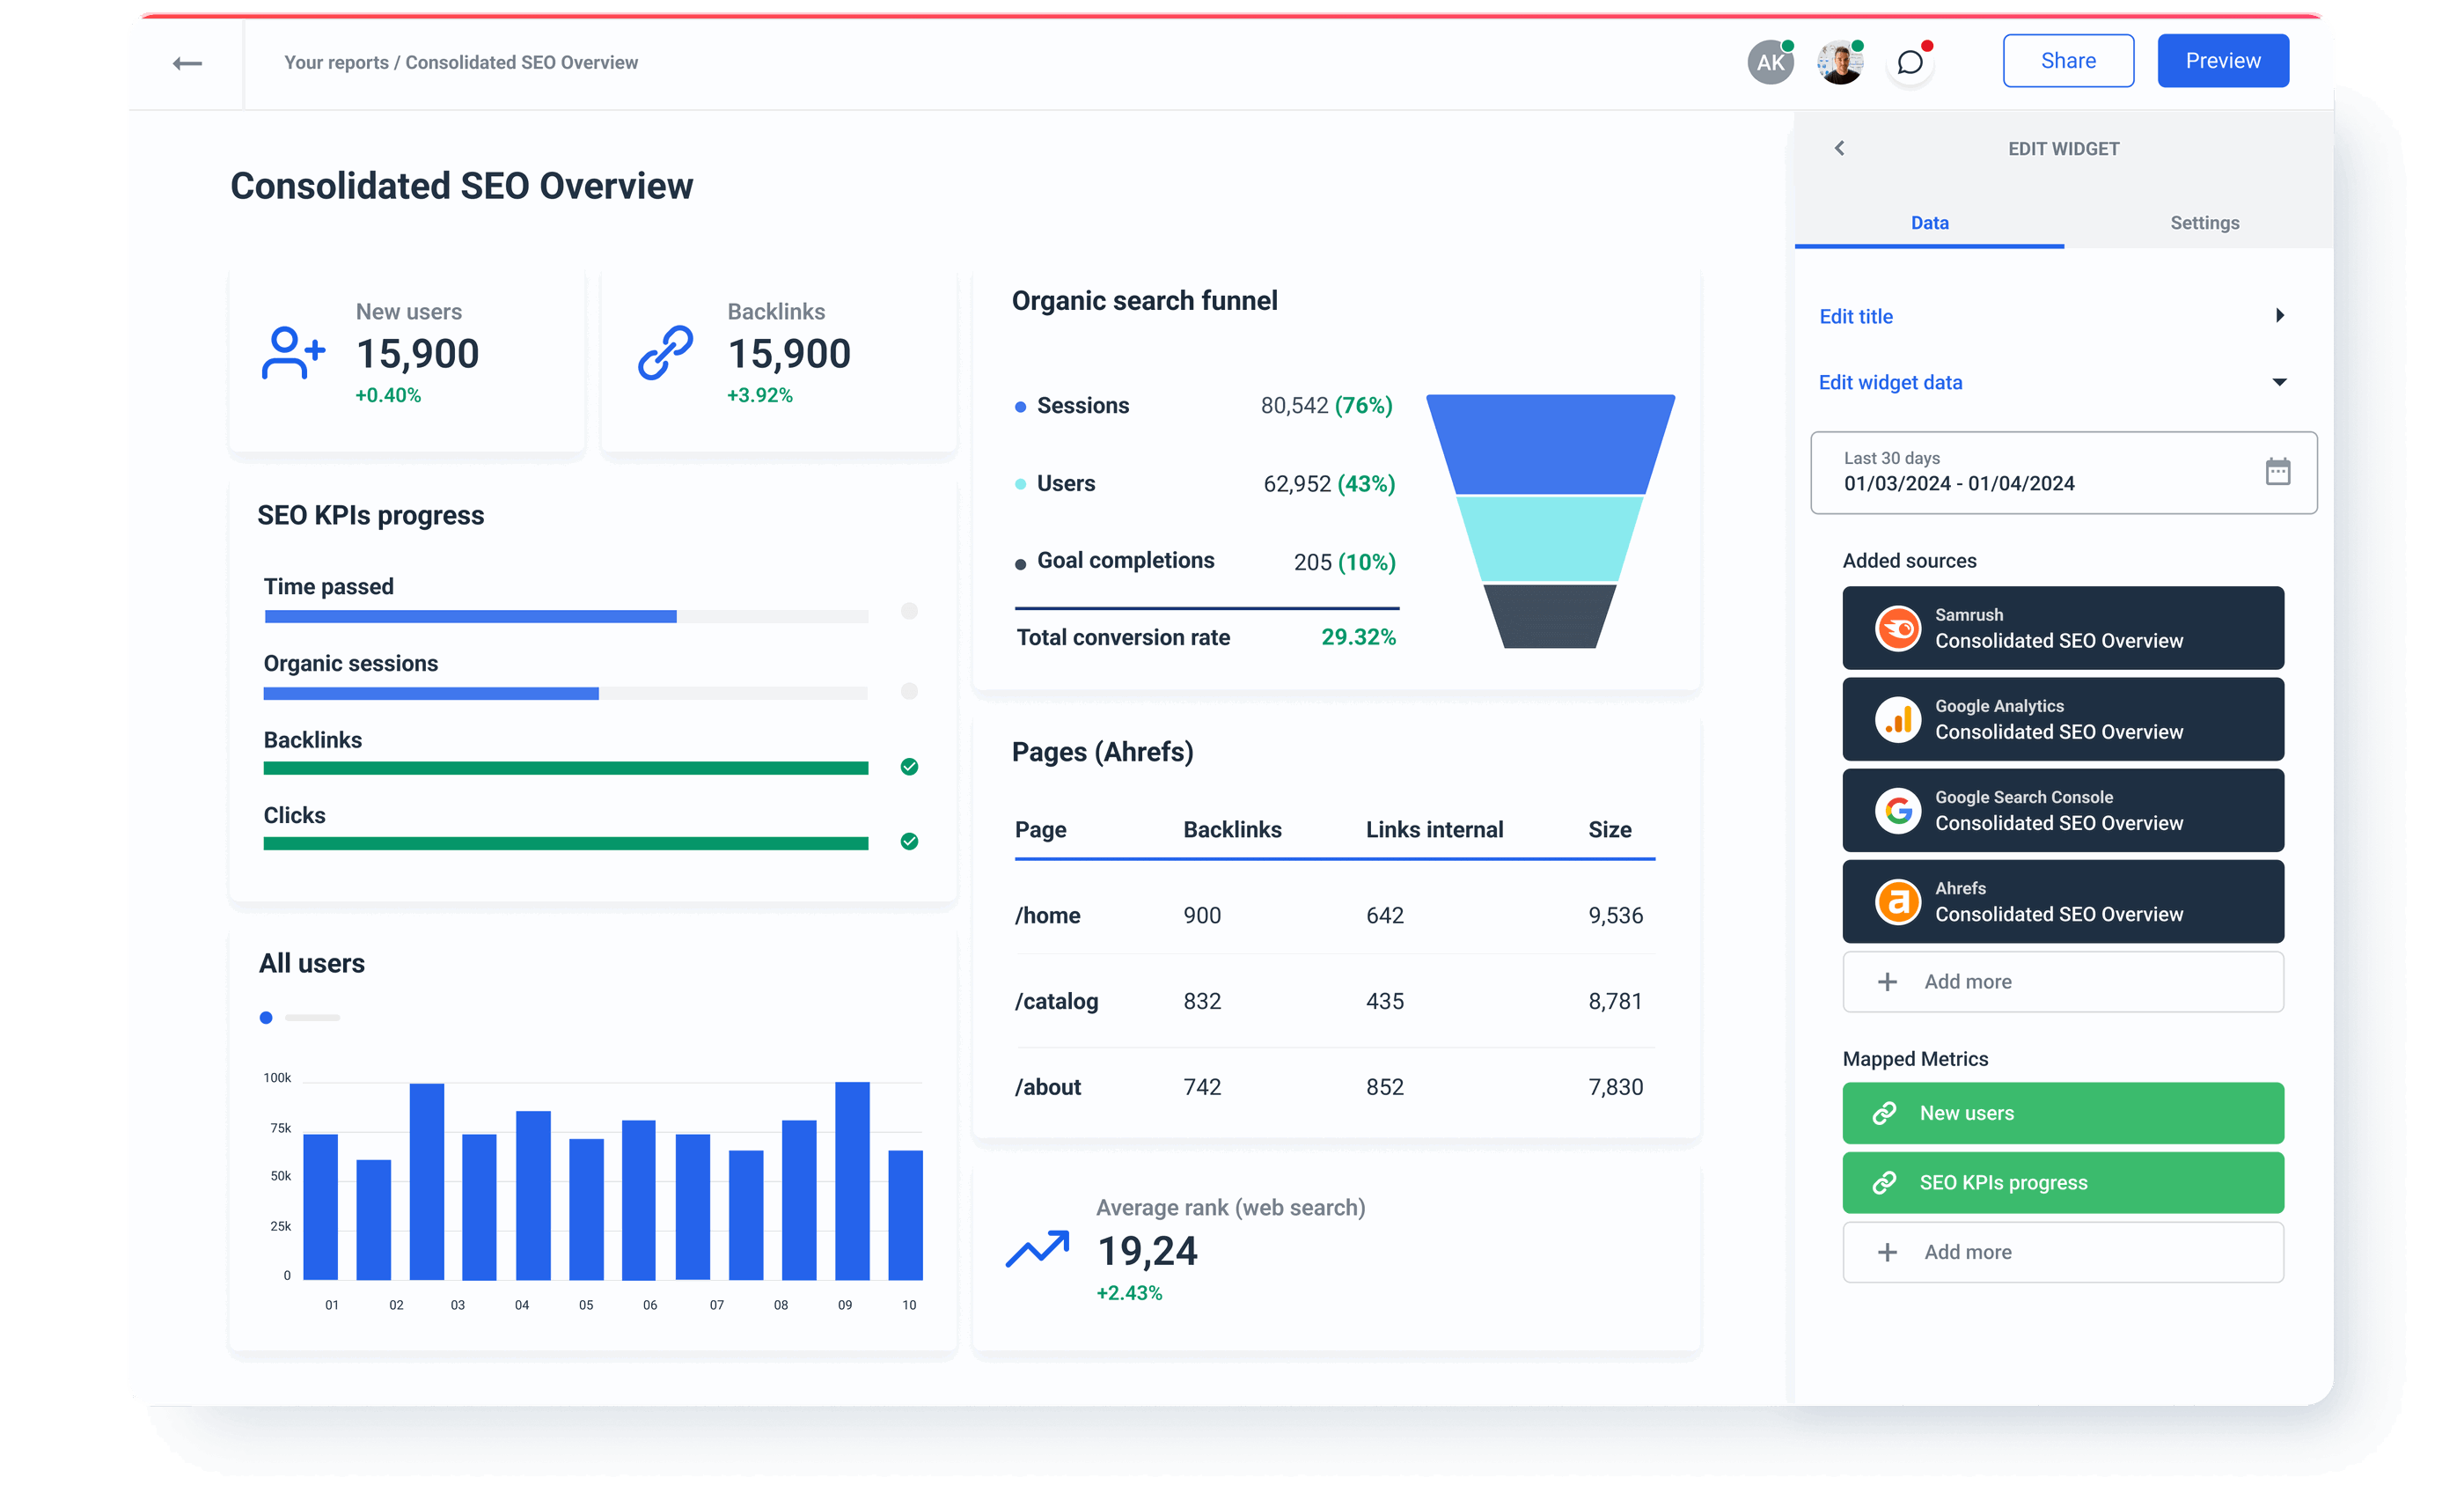
Off the shelf, our template comes pre-loaded with sections like SEO overview, keyword ranking, and backlinks data.
Keep an eye on your client’s SEO and organic performance, changes in keyword rankings, organic CTR, branded and non-branded search terms, and many more.
3. Social media performance client report
A social media performance report is the best way to keep your clients in the loop as to:
- What is happening with their follower base?
- How active is their brand on social media in a given period?
- Which posts generated the most engagement (why)?
- How do they stack against main competitors?
- How many conversions do they get from each social media channel?
Where to find this data?
- Google Analytics for referral traffic
- Social Media Tracker for full analysis and data-driven recommendations
In the case of social media performance reports, it’s important to organize the data by channel, which is challenging without a dedicated data platform that can integrate data for joint insights and provide separate performance for each channel.
Whatagraph’s Social Media Report helps marketing agencies handle social media analytics and evaluate the campaign effectiveness for every client.
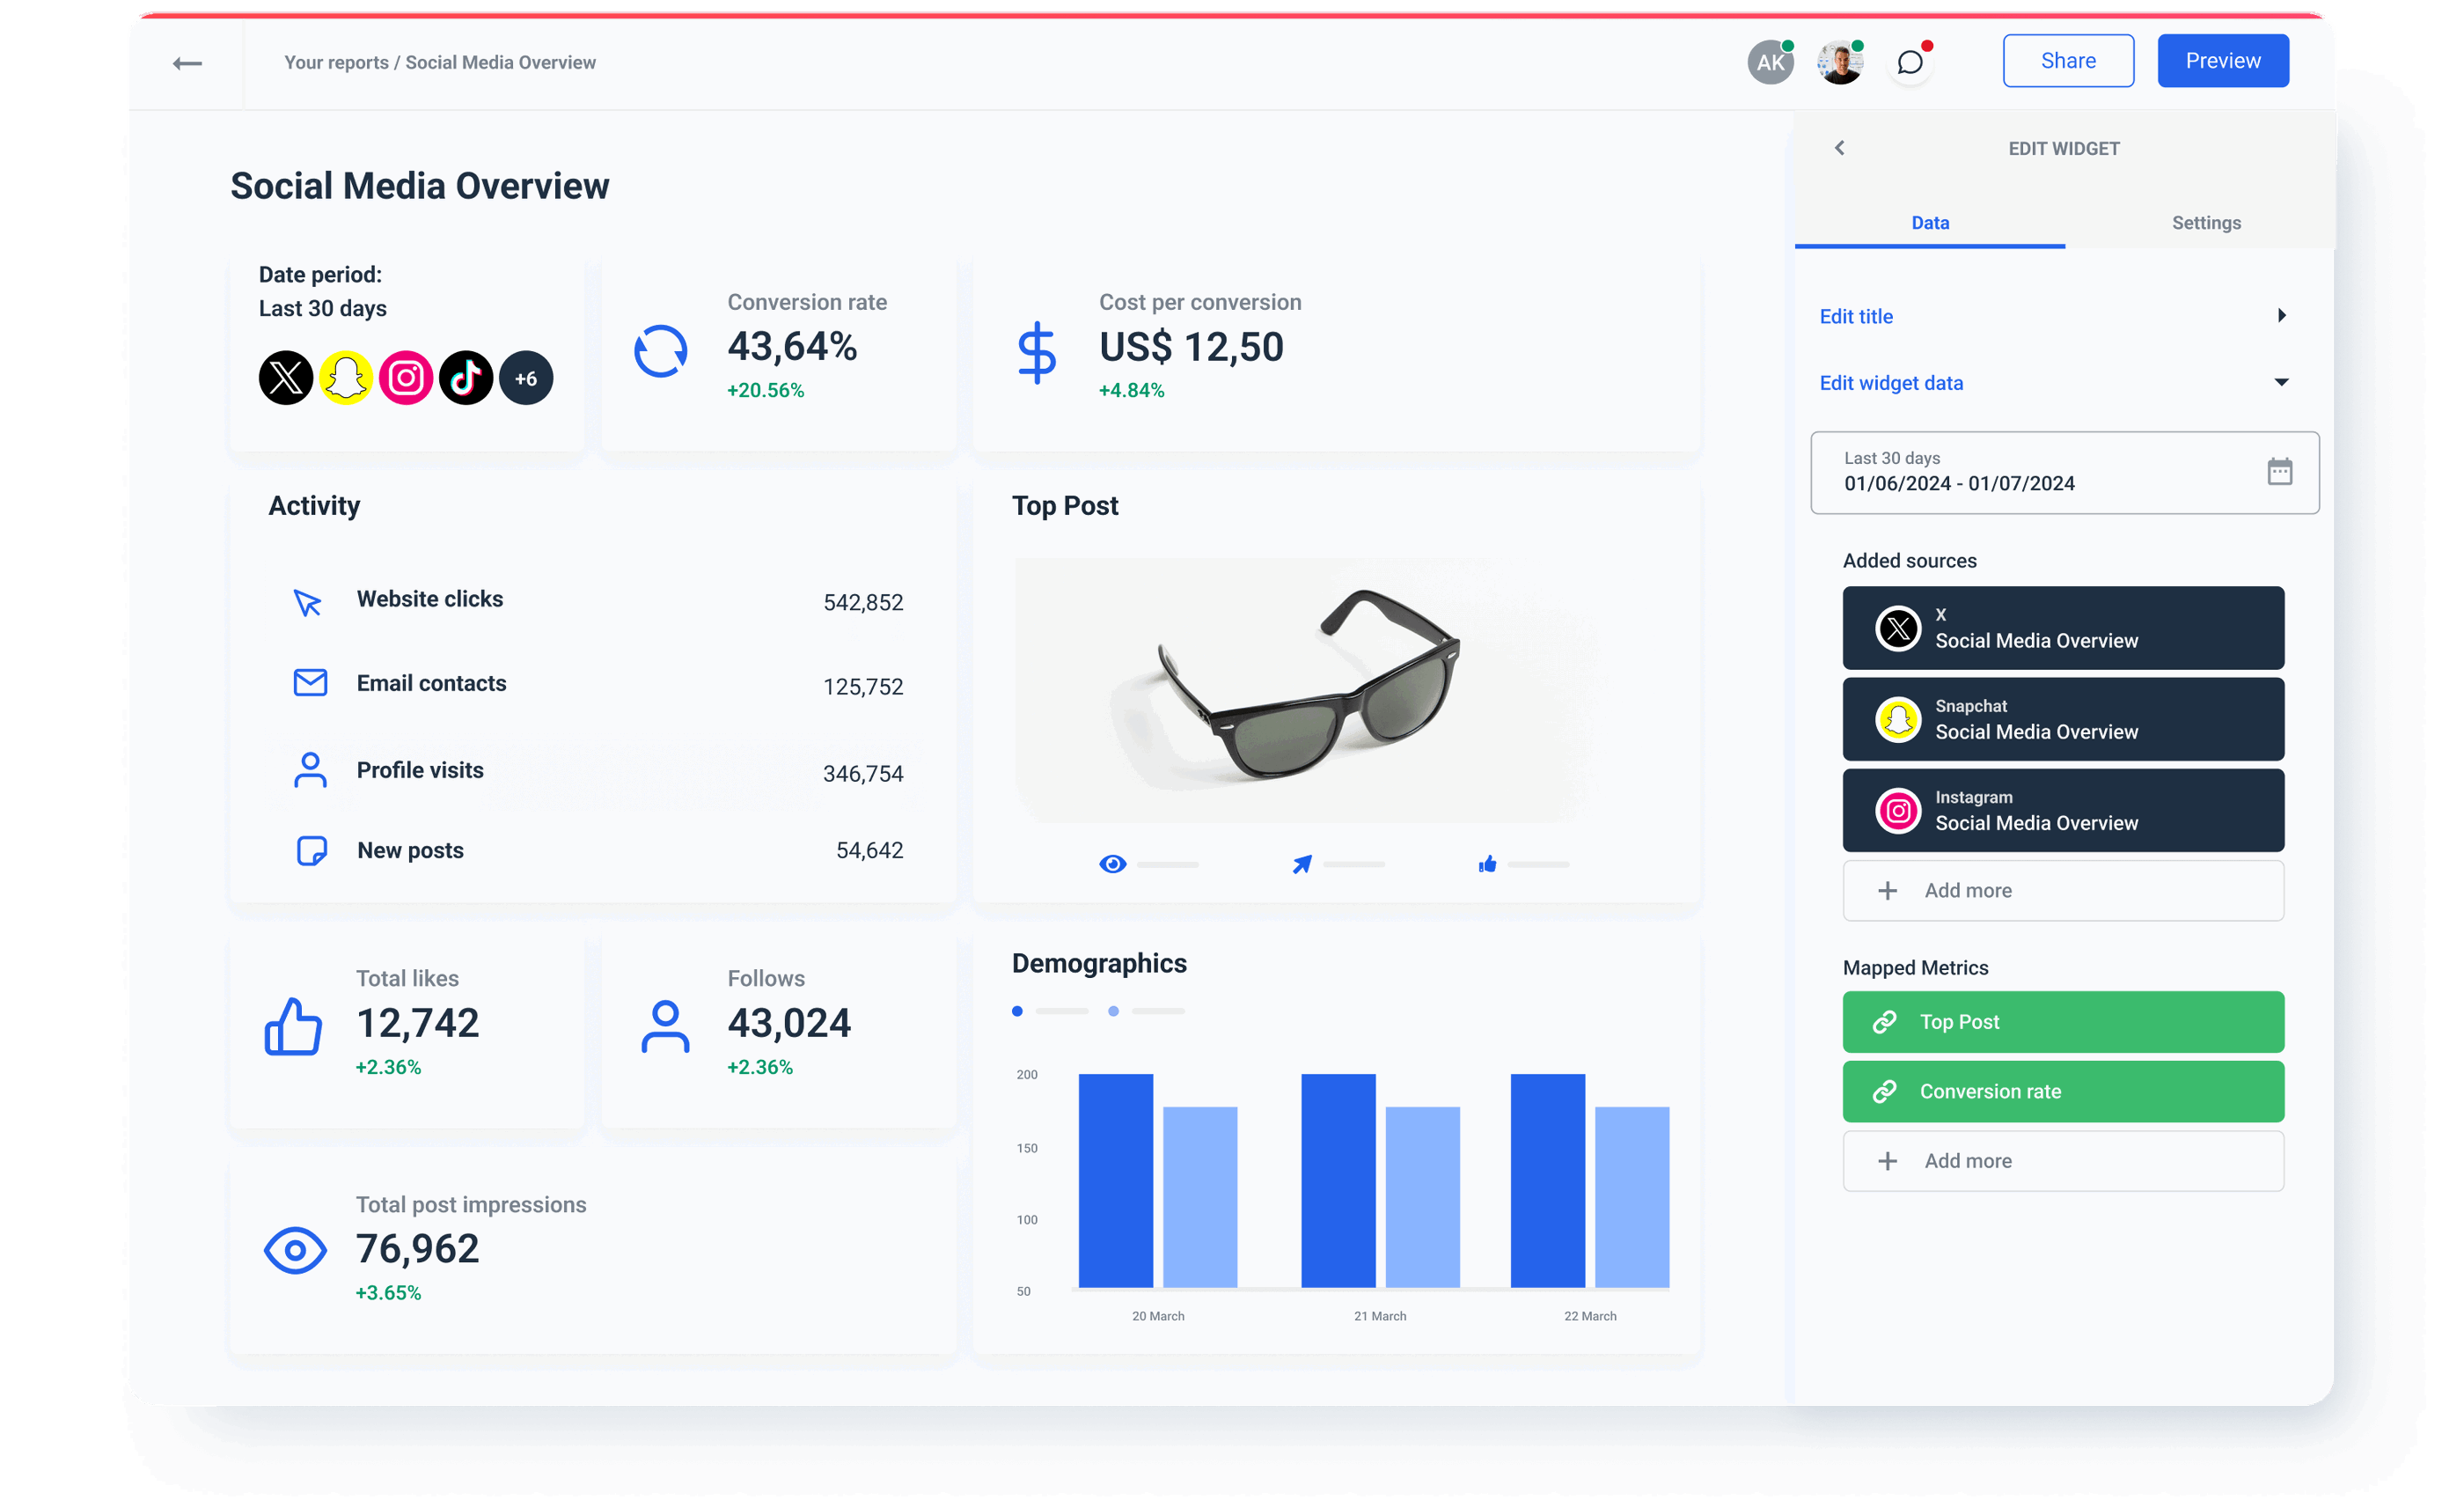
By default, our social media report template has the following sections:
- Executive summary: Consolidated social media overview of all followers across social media and insights and key takeaways of what worked and what did not. The best content performer this month by impressions and reach.
- Channel’s performance at a glance: Organic and paid performance per channel.
- Facebook page overview: Progress bar chart with key monthly KPIs, top-performing posts, and follower distribution by gender.
- Facebook page content breakdown: Top performing content by organic impressions, engaged users, negative reactions, and comments.
- Facebook Ads performance: Monthly impressions, leads, and conversions, total spend, cost per click, and click-through rate. Your client’s social media funnel chart.
- Instagram page insights: Monthly reach, impressions, and engagement, followers and engagement rate, as well as audience gender & age distribution.
- Conclusion and next steps: Your insights and recommendations for the next month.
Of course, if your client reporting process demands, you can easily create similar sections for other social media channels your clients might be using, such as TikTok and YouTube.
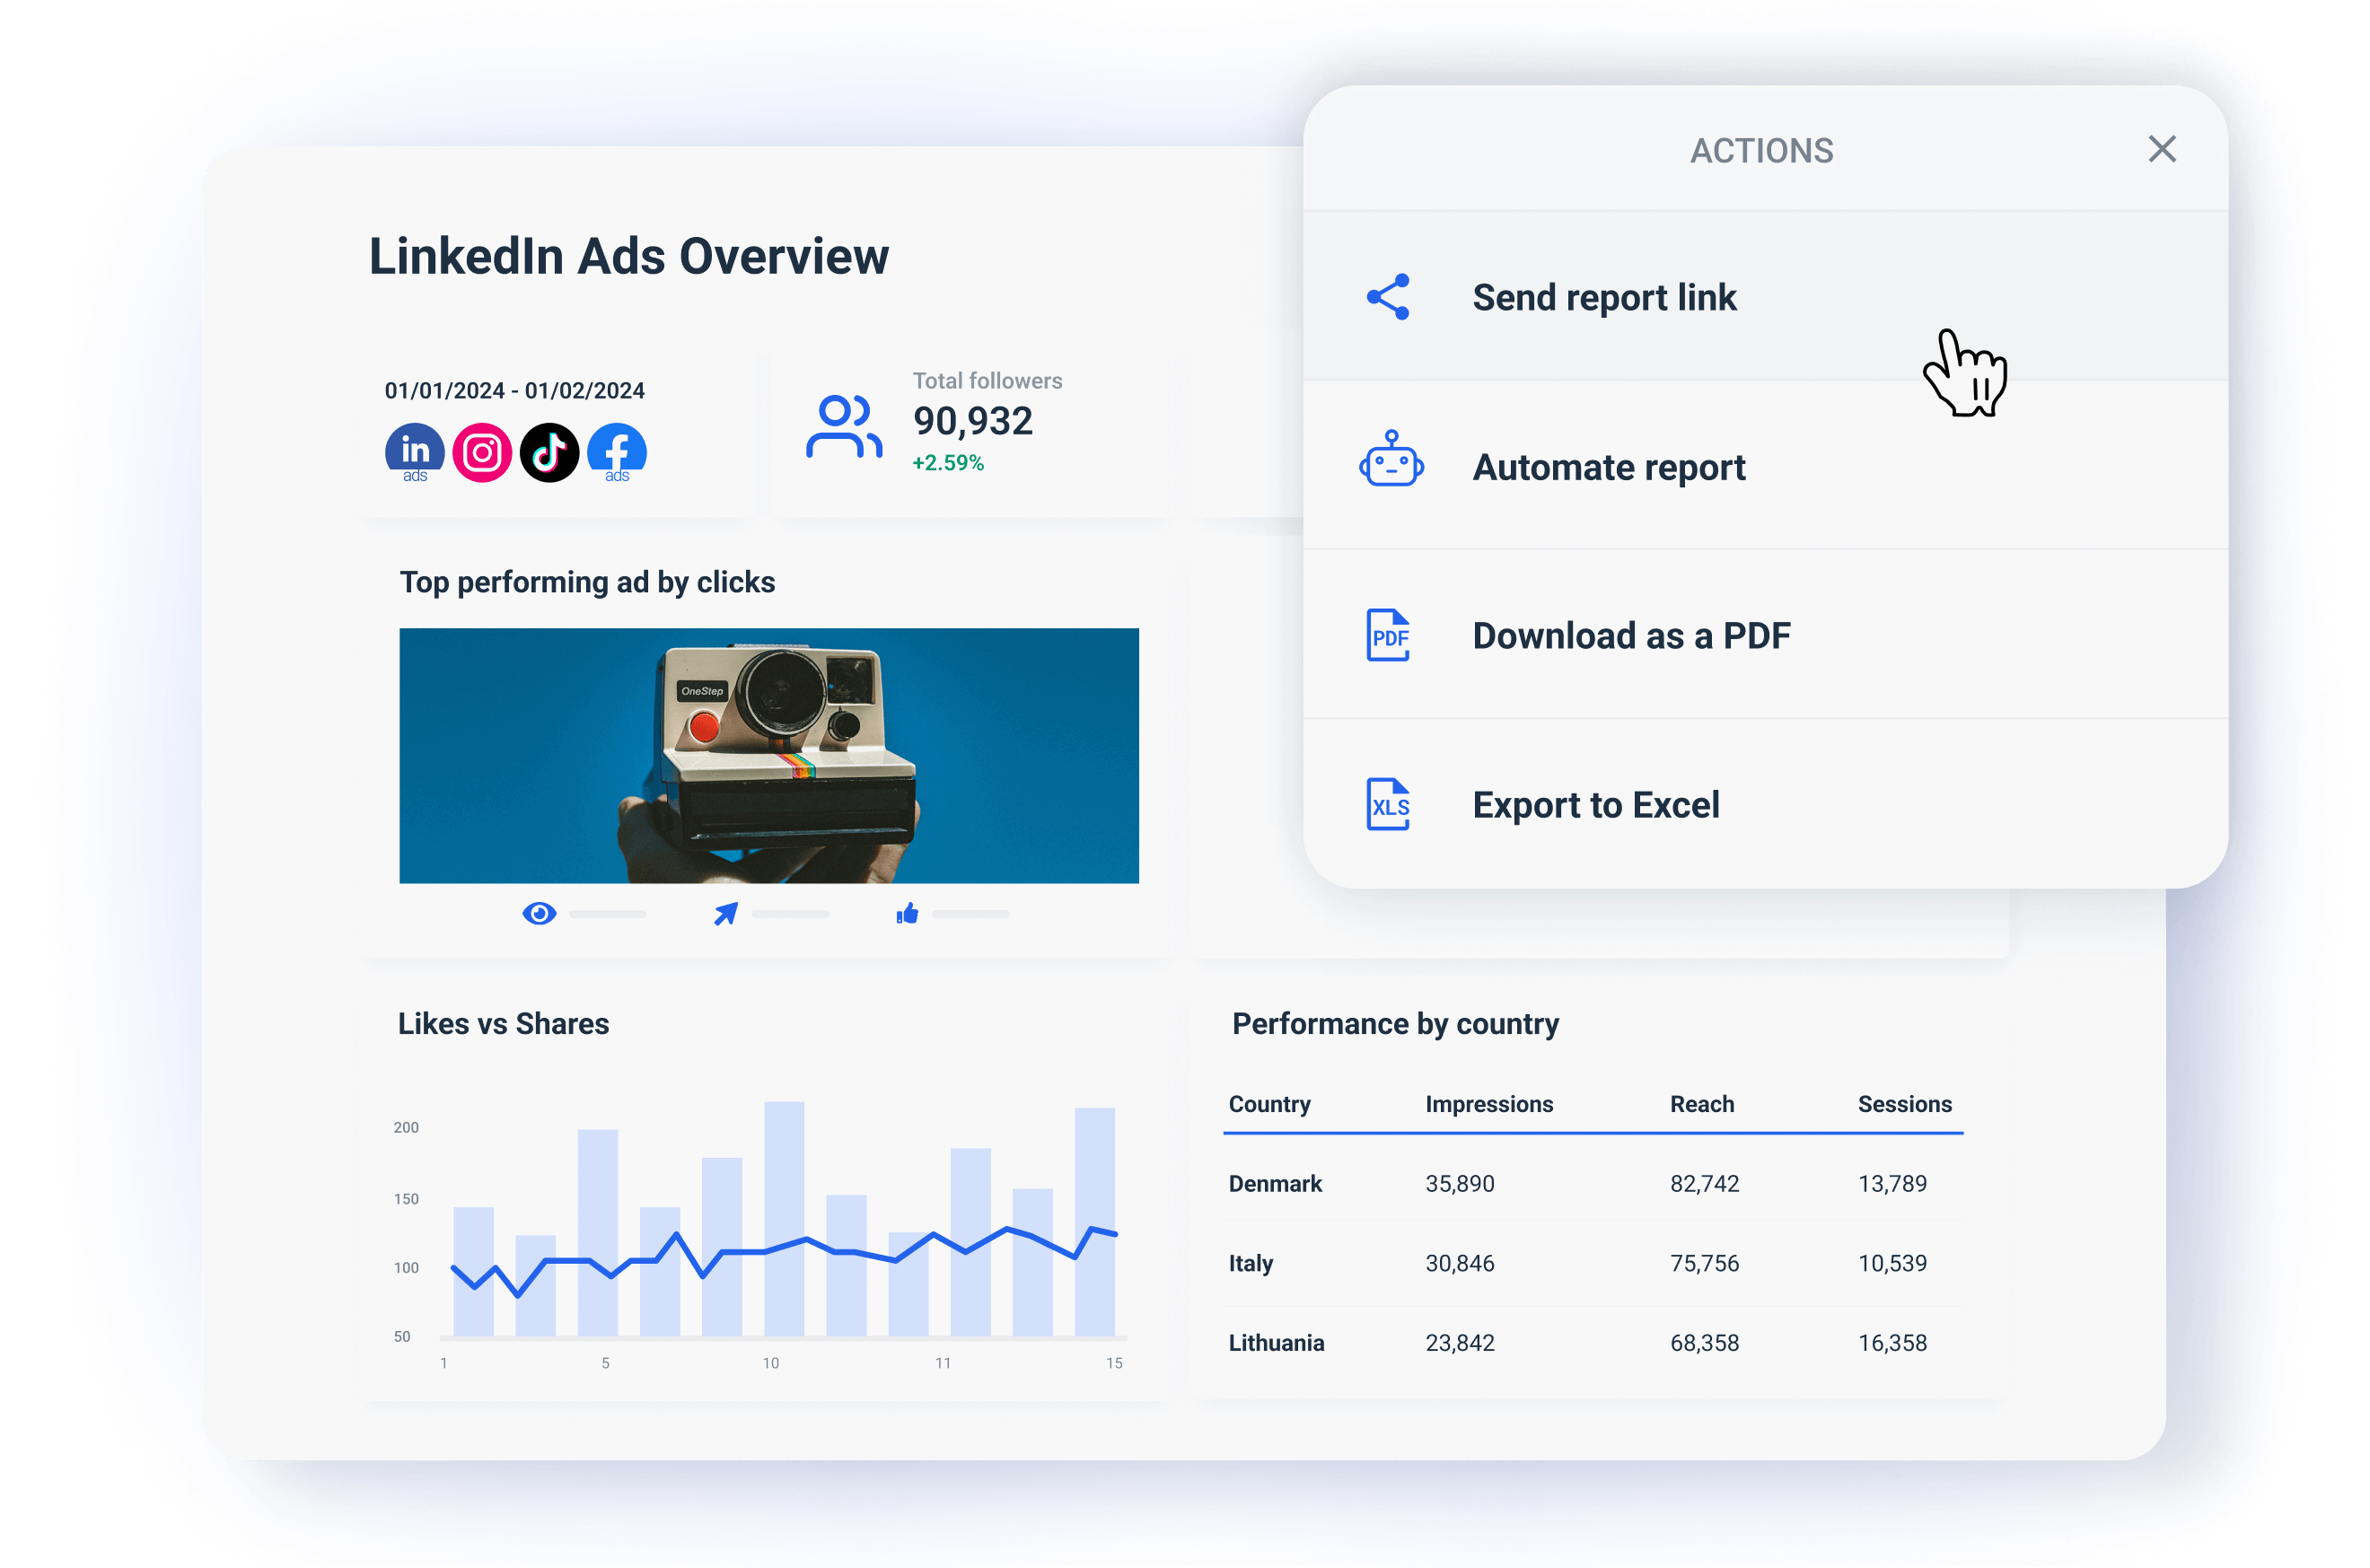
4. PPC client report
You should use a PPC report to organize your clients’ paid ads data by tracking and monitoring important KPIs such as:
- Clicks
- Cost
- Impressions
- Click-through rate (CTR)
- Conversion rates
- Cost-per conversion
As well as optimize their paid media campaigns by:
- Removing keywords that aren’t performing
- Leaving out keywords that aren’t generating traffic
- Replacing keywords that haven’t got any impressions
- Stopping using seasonal keywords and those with a low-quality score
Where to find this data?
- Facebook Ads
- Google Ads
- LinkedIn Ads
- Tiktok Ads
- etc.
PPC is one of the favorite marketing strategies for many agencies, mainly because the ROI is so easy to track.
And no, by tracking, we don't mean tracking all the client data sources separately and combining the metrics manually.
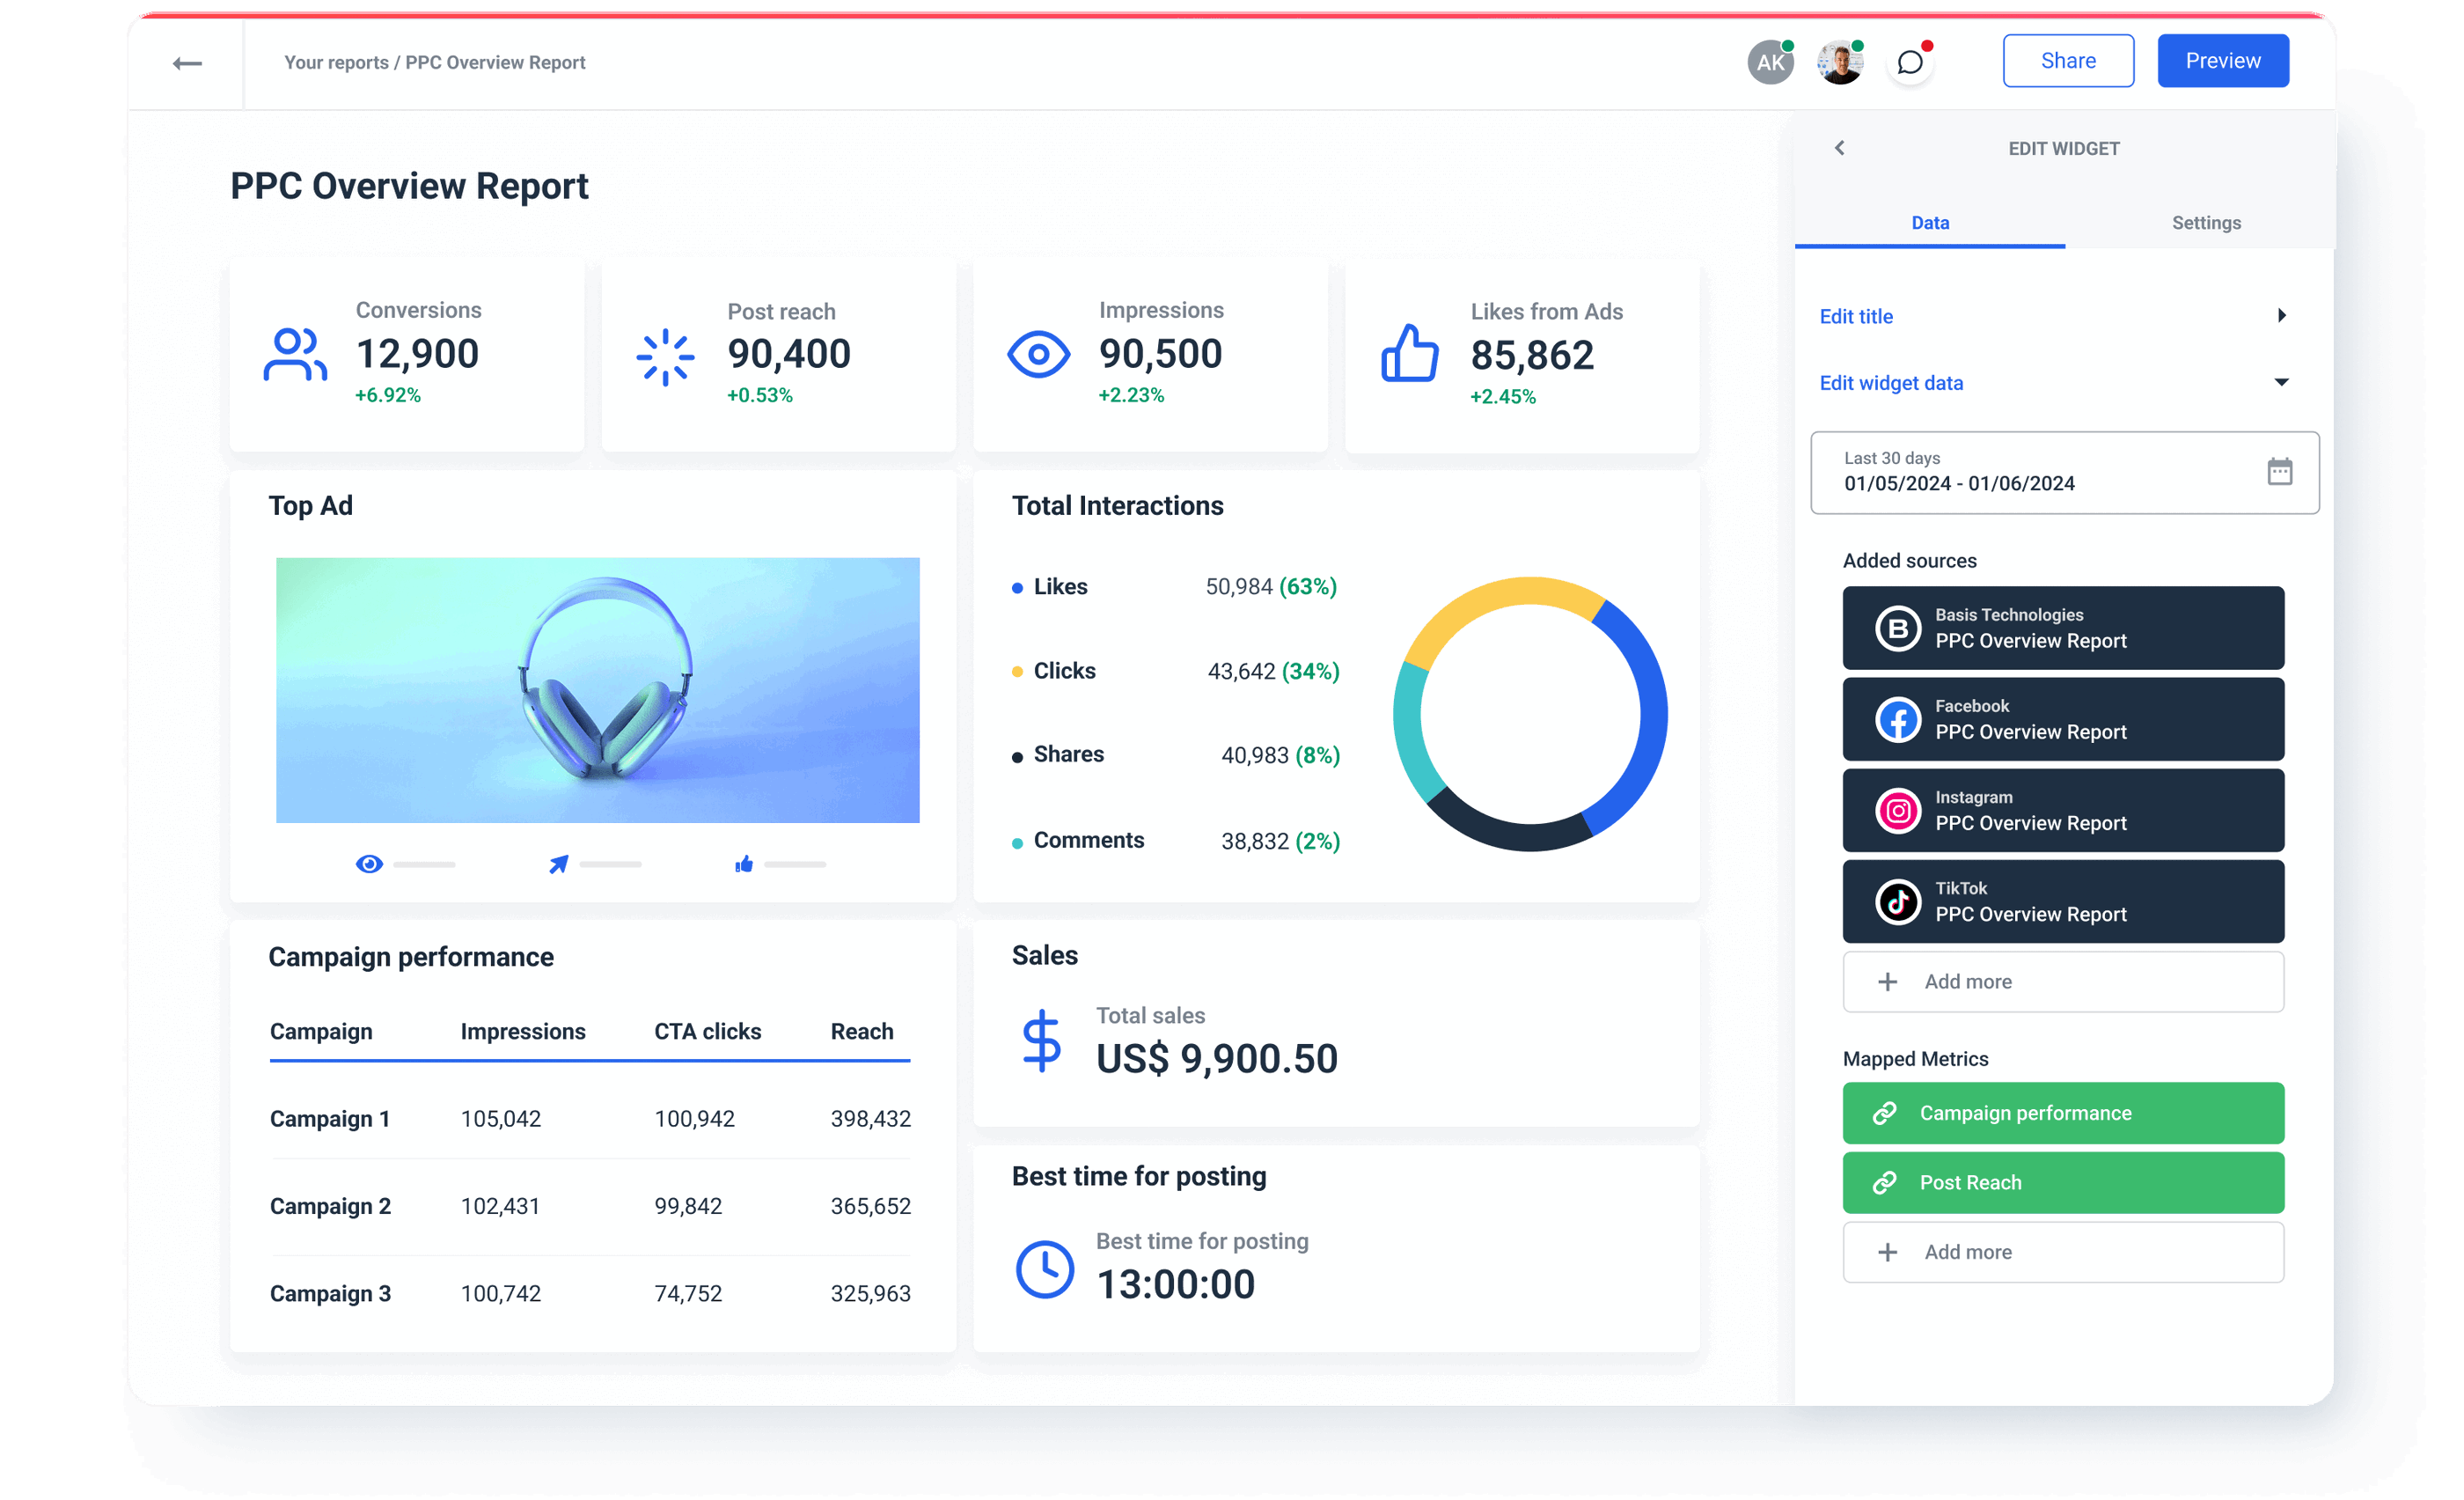
Whatagraph’s PPC Report Template allows you to collect key metrics from different Ads platforms and consolidate the results into four sections:
- Main KPIs: Monthly status of conversions, clicks, impressions, and cost.
- Insights: A text box where you can comment on the results or offer clarification to clients.
- Further actions: An empty field where you can suggest the next steps or recommendations.
- Channel split: Traffic, conversions, and cost per conversion per all client’s paid media channels.
Agencies can use our PPC report template to create captivating paid media reports for clients in minutes and set up automated delivery.
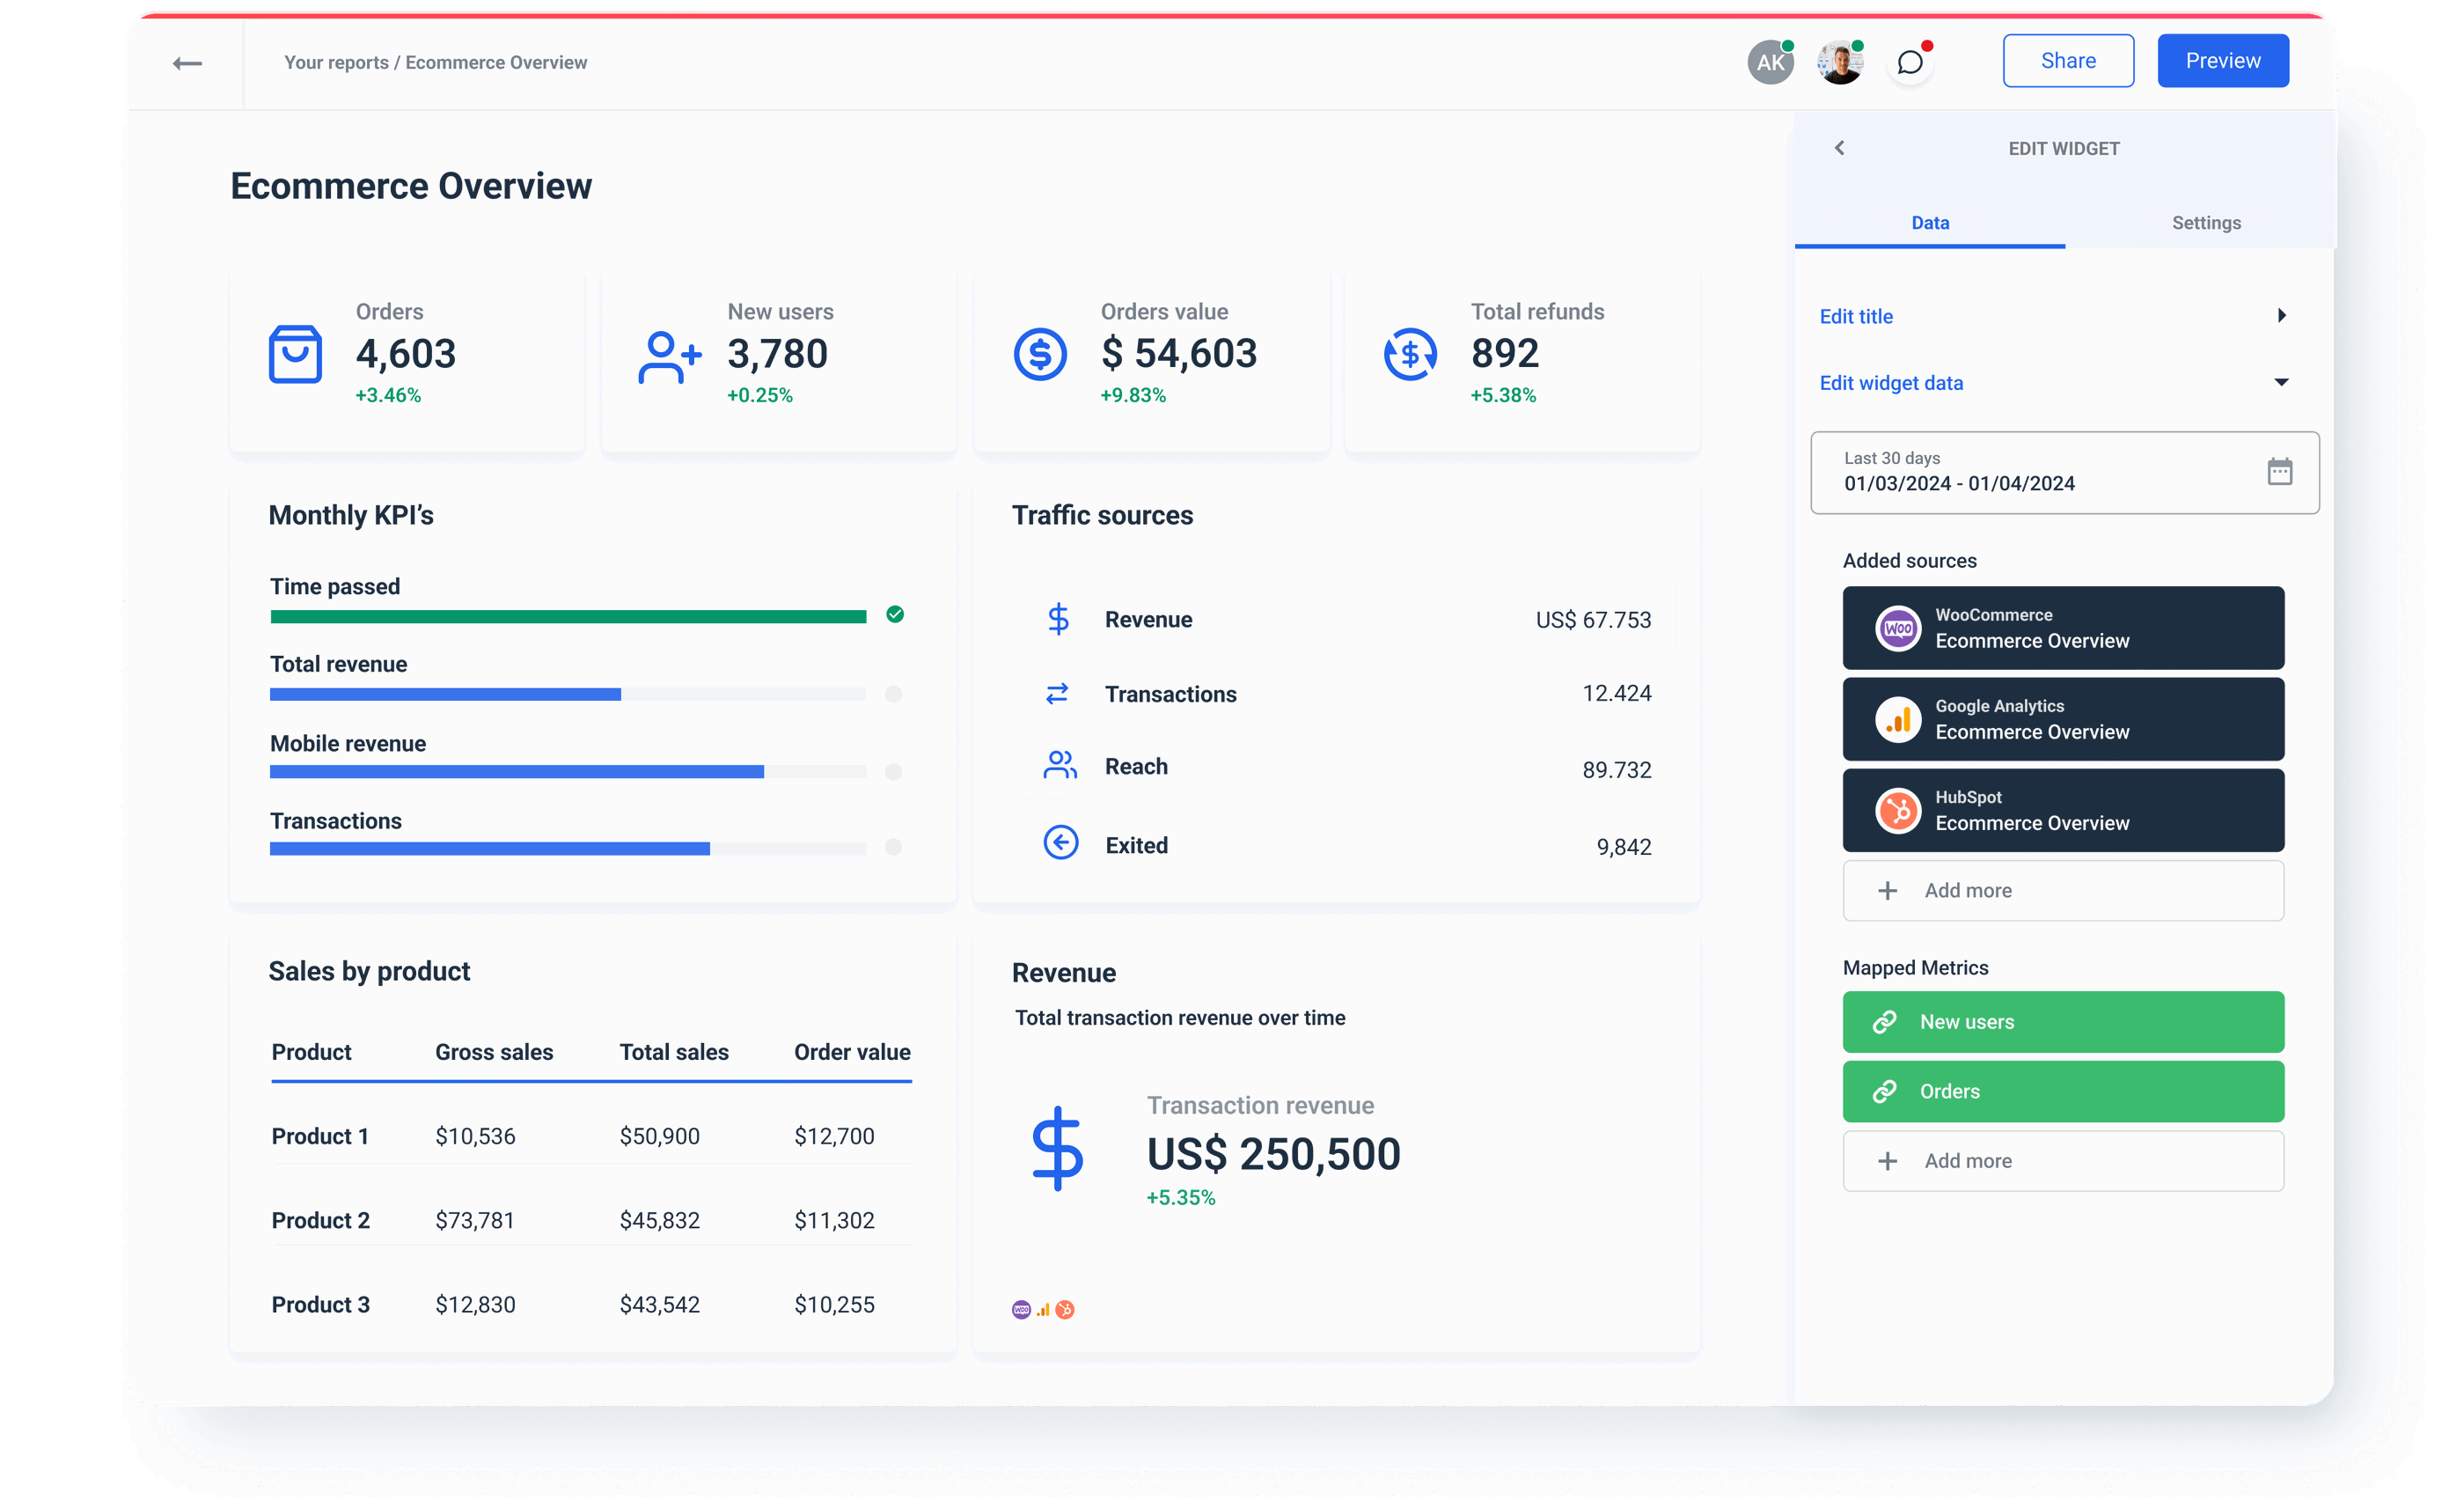
5. E-commerce client report
Through an e-commerce report, you can help your clients launch effective customer loyalty programs and create tailored marketing campaigns based on customer history. Aside from constantly trying to acquire new leads, e-commerce reporting helps clients tap into the existing customer base.
Insights your clients can get from an eCommerce report:
- Total revenue
- Conversion rate
- Total number of transactions
- Bounce rate
- Pages per sessions
- Customer lifetime value
Where to find this data?
- Google Analytics 4
- Google Ads
- Social media channels
- Shopify, BigCommerce, or any other e-store platform you use
The good news is that you don’t have to manually extract, pair, and combine metrics from all those platforms individually.
Instead, you can fast forward directly to Whatagraph’s E-Commerce Report. Just connect the account, and the metrics from your client’s revenue sources update automatically every hour.
Sourcing data directly from your client’s Shopify account, this report helps agencies track vital client e-commerce metrics and present data in a visually engaging way that is easy to understand and act on.
Talking of visual engagement, Whatagraph’s E-commerce Report Template begins with a cover image you can upload to grasp attention right away, followed by 5 sections:
- Executive summary: Progress bars with monthly KPIs and table with sales data by product.
- Online store traffic overview: Number of new clients and sessions, demographic activity, website conversion funnel, and traffic sources pie chart.
- Sales Insights: Total sales, shipping, and tax, as well as sales performance by product type and top-performing products by product ID.
- Customer Insights: Orders in total and average units per transaction. Insights for different customer groups.
- Conclusions, monthly results, next steps: Your insights and client recommendations for the next month.
Client reporting case studies
Whatagraph is an easy-to-use platform to monitor and report on marketing performance — packed with useful features that make it easier for marketing agencies to collect, manage, and report client data.
Case study 1: Market Solutions uses Whatagraph to report to 150+ clients and save 30% time with only 15 staff?
Market Solutions is a marketing agency from Sweden that offers a wide range of services. In the past, the agency used PowerPoint presentations to report on their results. This way of reporting was far from practical. According to Karl-Viktor Jorkby, the Head of Digital Media Planning, it took them an average 5-10 hours to create a single report, which stood in the way of scaling and signing on new clients.
Whatagraph solved Marketing Solutions’ problems with flying colors. Thanks to a large number of native integrations, the intuitive UI of the report builder, and seamless report sharing, Marketing Solutions was able to save from 3 to 7 hours on each report and successfully scale their operations to serving 150+ clients with a team of 15.
By automating our data collection and reporting, we have not only made our own operations more efficient, but above all improved our customers' access to information. They can now benefit in real time from deeper insights presented in a clear and user-friendly way. We can now together make faster and even better decisions!
Case study 2: Media Maven simplified reporting to 70+ clients by replacing multiple reporting tools with Whatagraph
Media Maven is a marketing agency from Israel that, like many agencies, uses a combination of different tools to create client reports. They used Supermetrics to connect their client’s numerous data sources and Looker Studio to create visualizations.
Their team was skilled to use two tools, however the data connectors kept breaking off, resulting in inaccurate data in reports. So whenever a client asked for campaign results, an account manager had to involve other team members to create a report and check data manually multiple times.
Whatagraph helped Media Maven solve the problem with automated reporting dashboards. Instead of using multiple tools, they use Whatagraph to connect, visualize, and share their client’s data, while each client receives a link to a Whatagraph report which they can access from anywhere and at any time.
Tips & tricks to improve your client reporting
Here are some client-reporting best practices that will help you streamline the process and scale your productivity without sacrificing additional work hours.
1. Automate client reporting process
Whatagraph provides a feature that allows marketing agencies to streamline the process and automate report delivery to clients and stakeholders at the required time frequencies.
Instead of sending each report manually, you can set up automated client reporting and have the report sent out without your interference. Still, you can add a review step to check all the details and add your notes and suggestions based on the current numbers.
You can send reports regularly: weekly, bi-weekly, monthly, quarterly, or yearly, without ever looking at spreadsheets or Excel again. Regular reporting will help you retain the existing clients and build rapport with new ones.
Not only that, but automated client reporting will save time, improve your client onboarding, help hit the milestones, and amaze your clients.
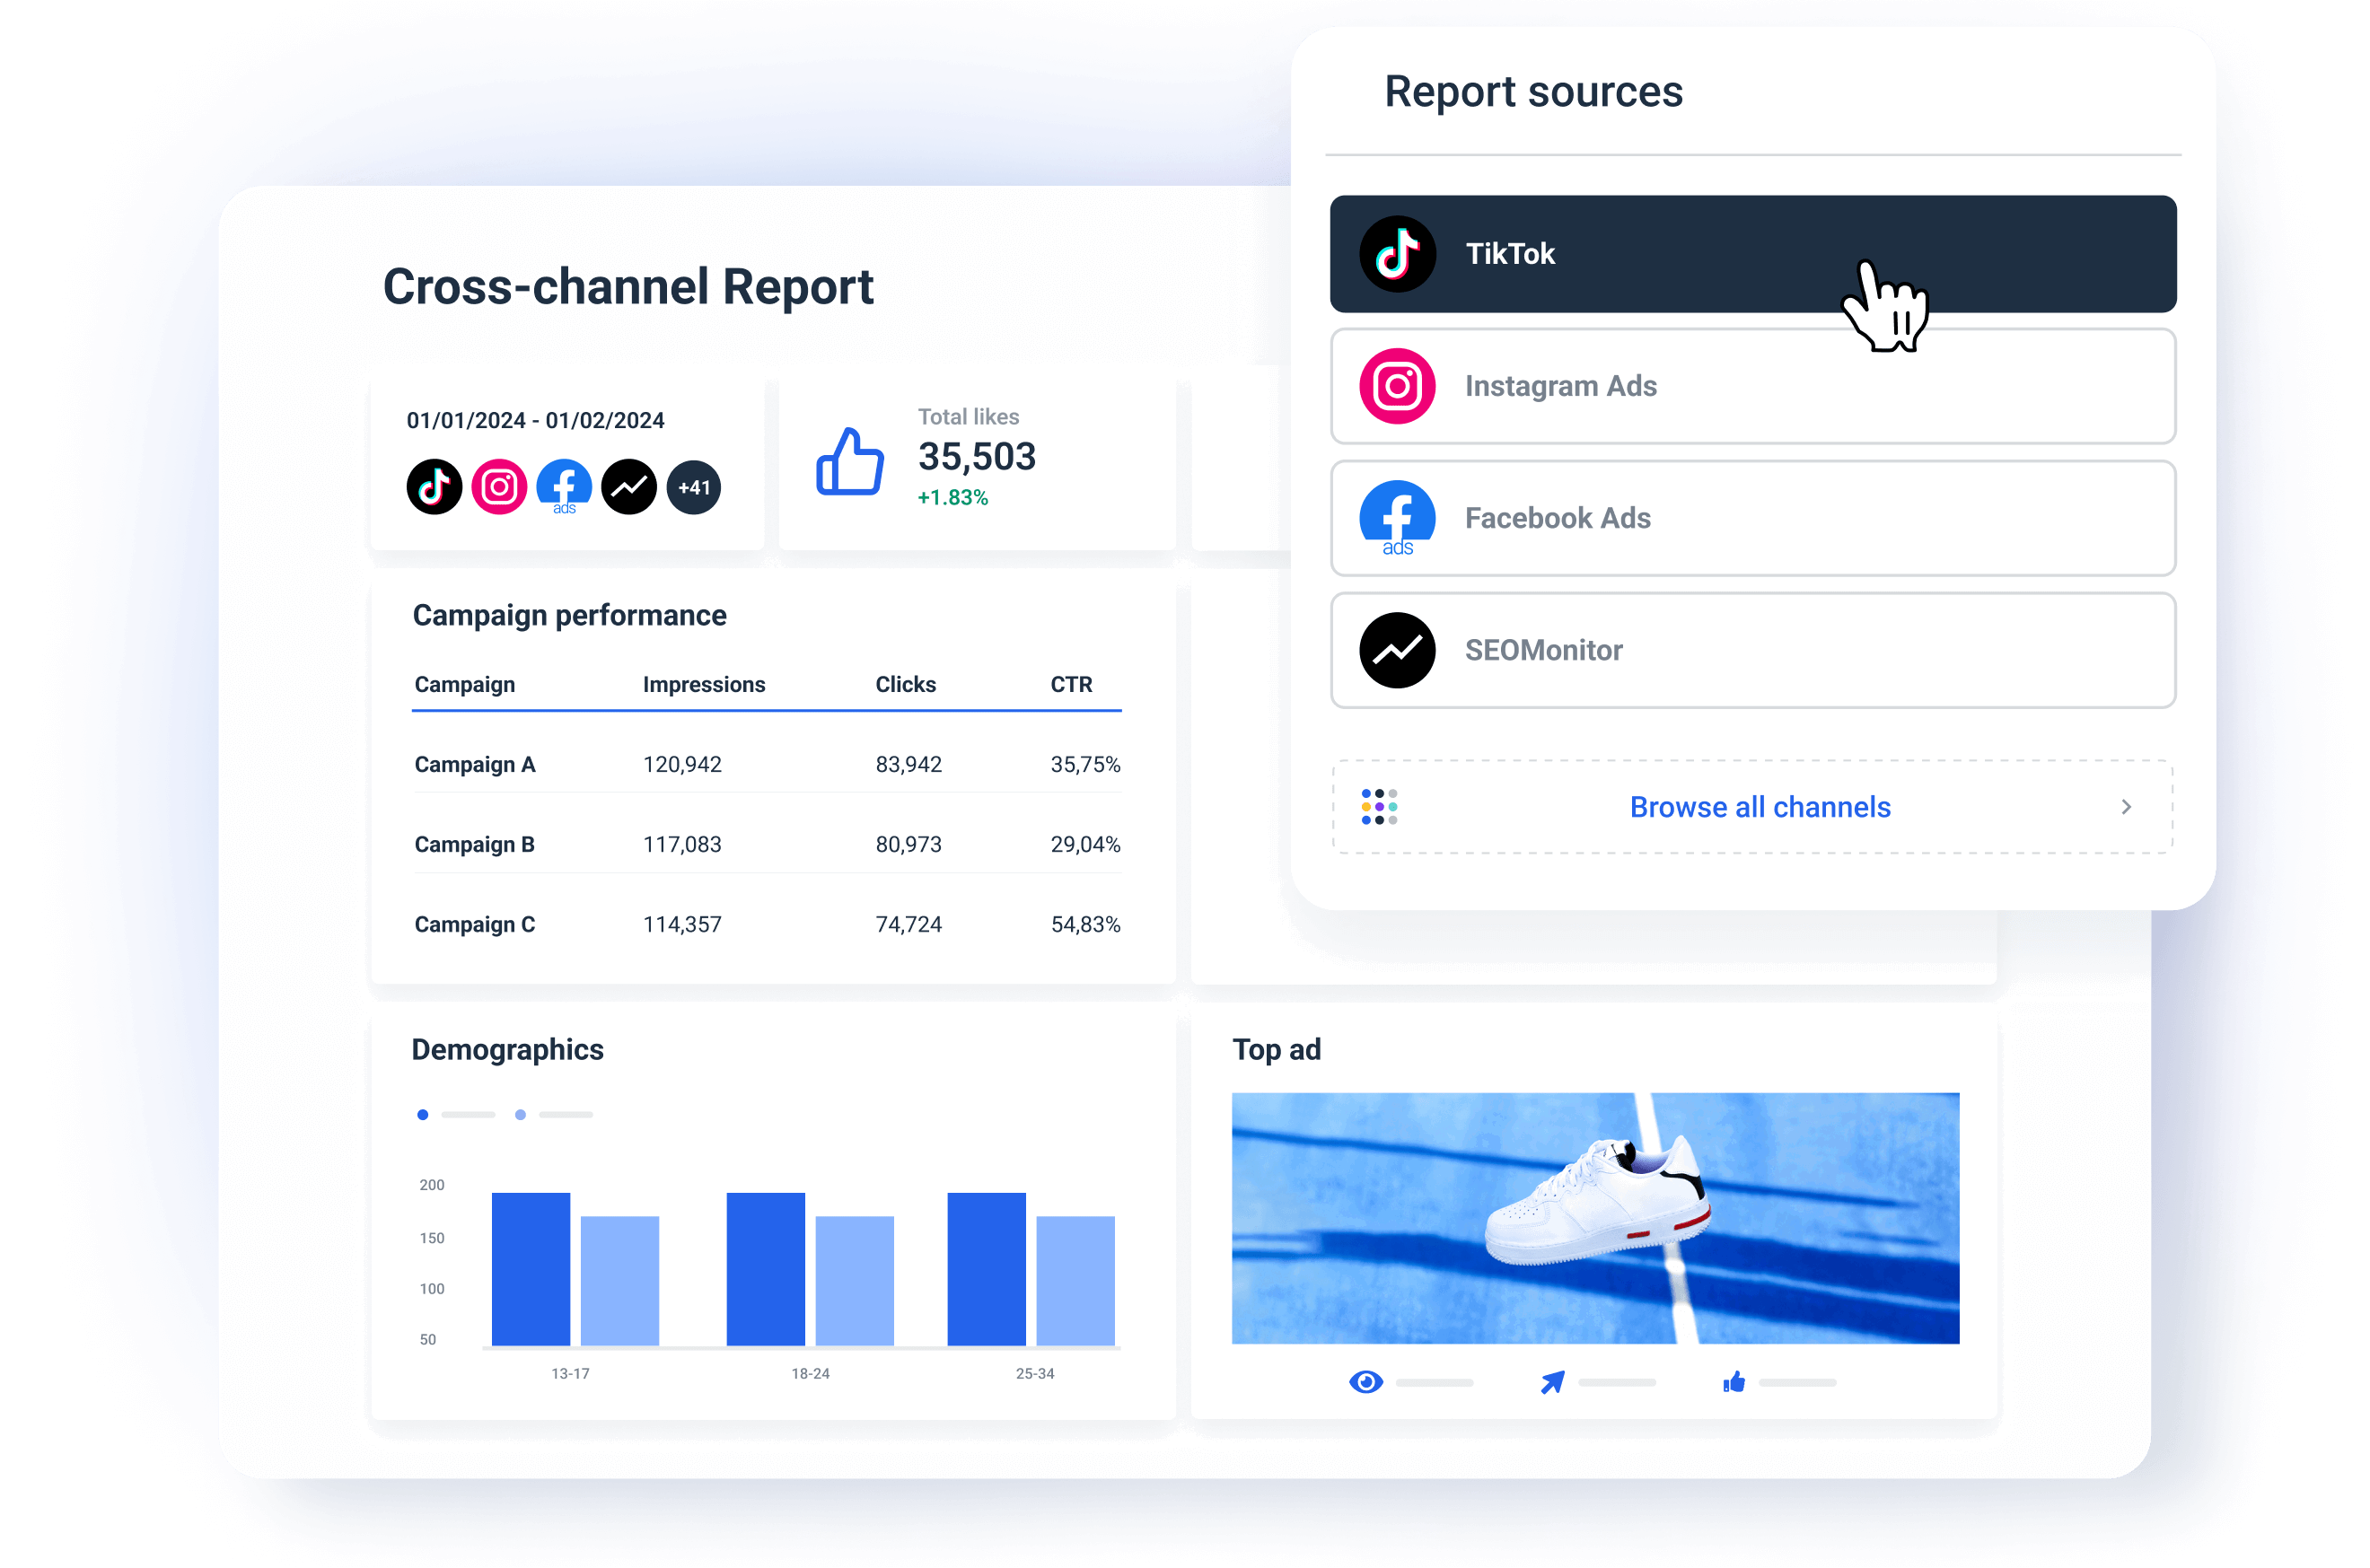
2. Create cross-channel reports.
Depending on the client’s goals, you may run different marketing campaigns (SEO and PPC).
We want to offer you a perfect cross-channel marketing report that connects multiple data sources, such as Google Analytics 4, Facebook Ads, and Shopify. The best benefit is that you can easily highlight and compare how different key performance indicators and your marketing efforts are performing.
3. White-label client reports.
Improve your client communication by creating a custom report with real-time performance metrics your client will want to look at.
Change the feel of the report by altering colors, widgets, themes, graphs, and, most importantly, the domain and logo of the report. This way, you’ll create a more credible and professional look for your agency’s brand.
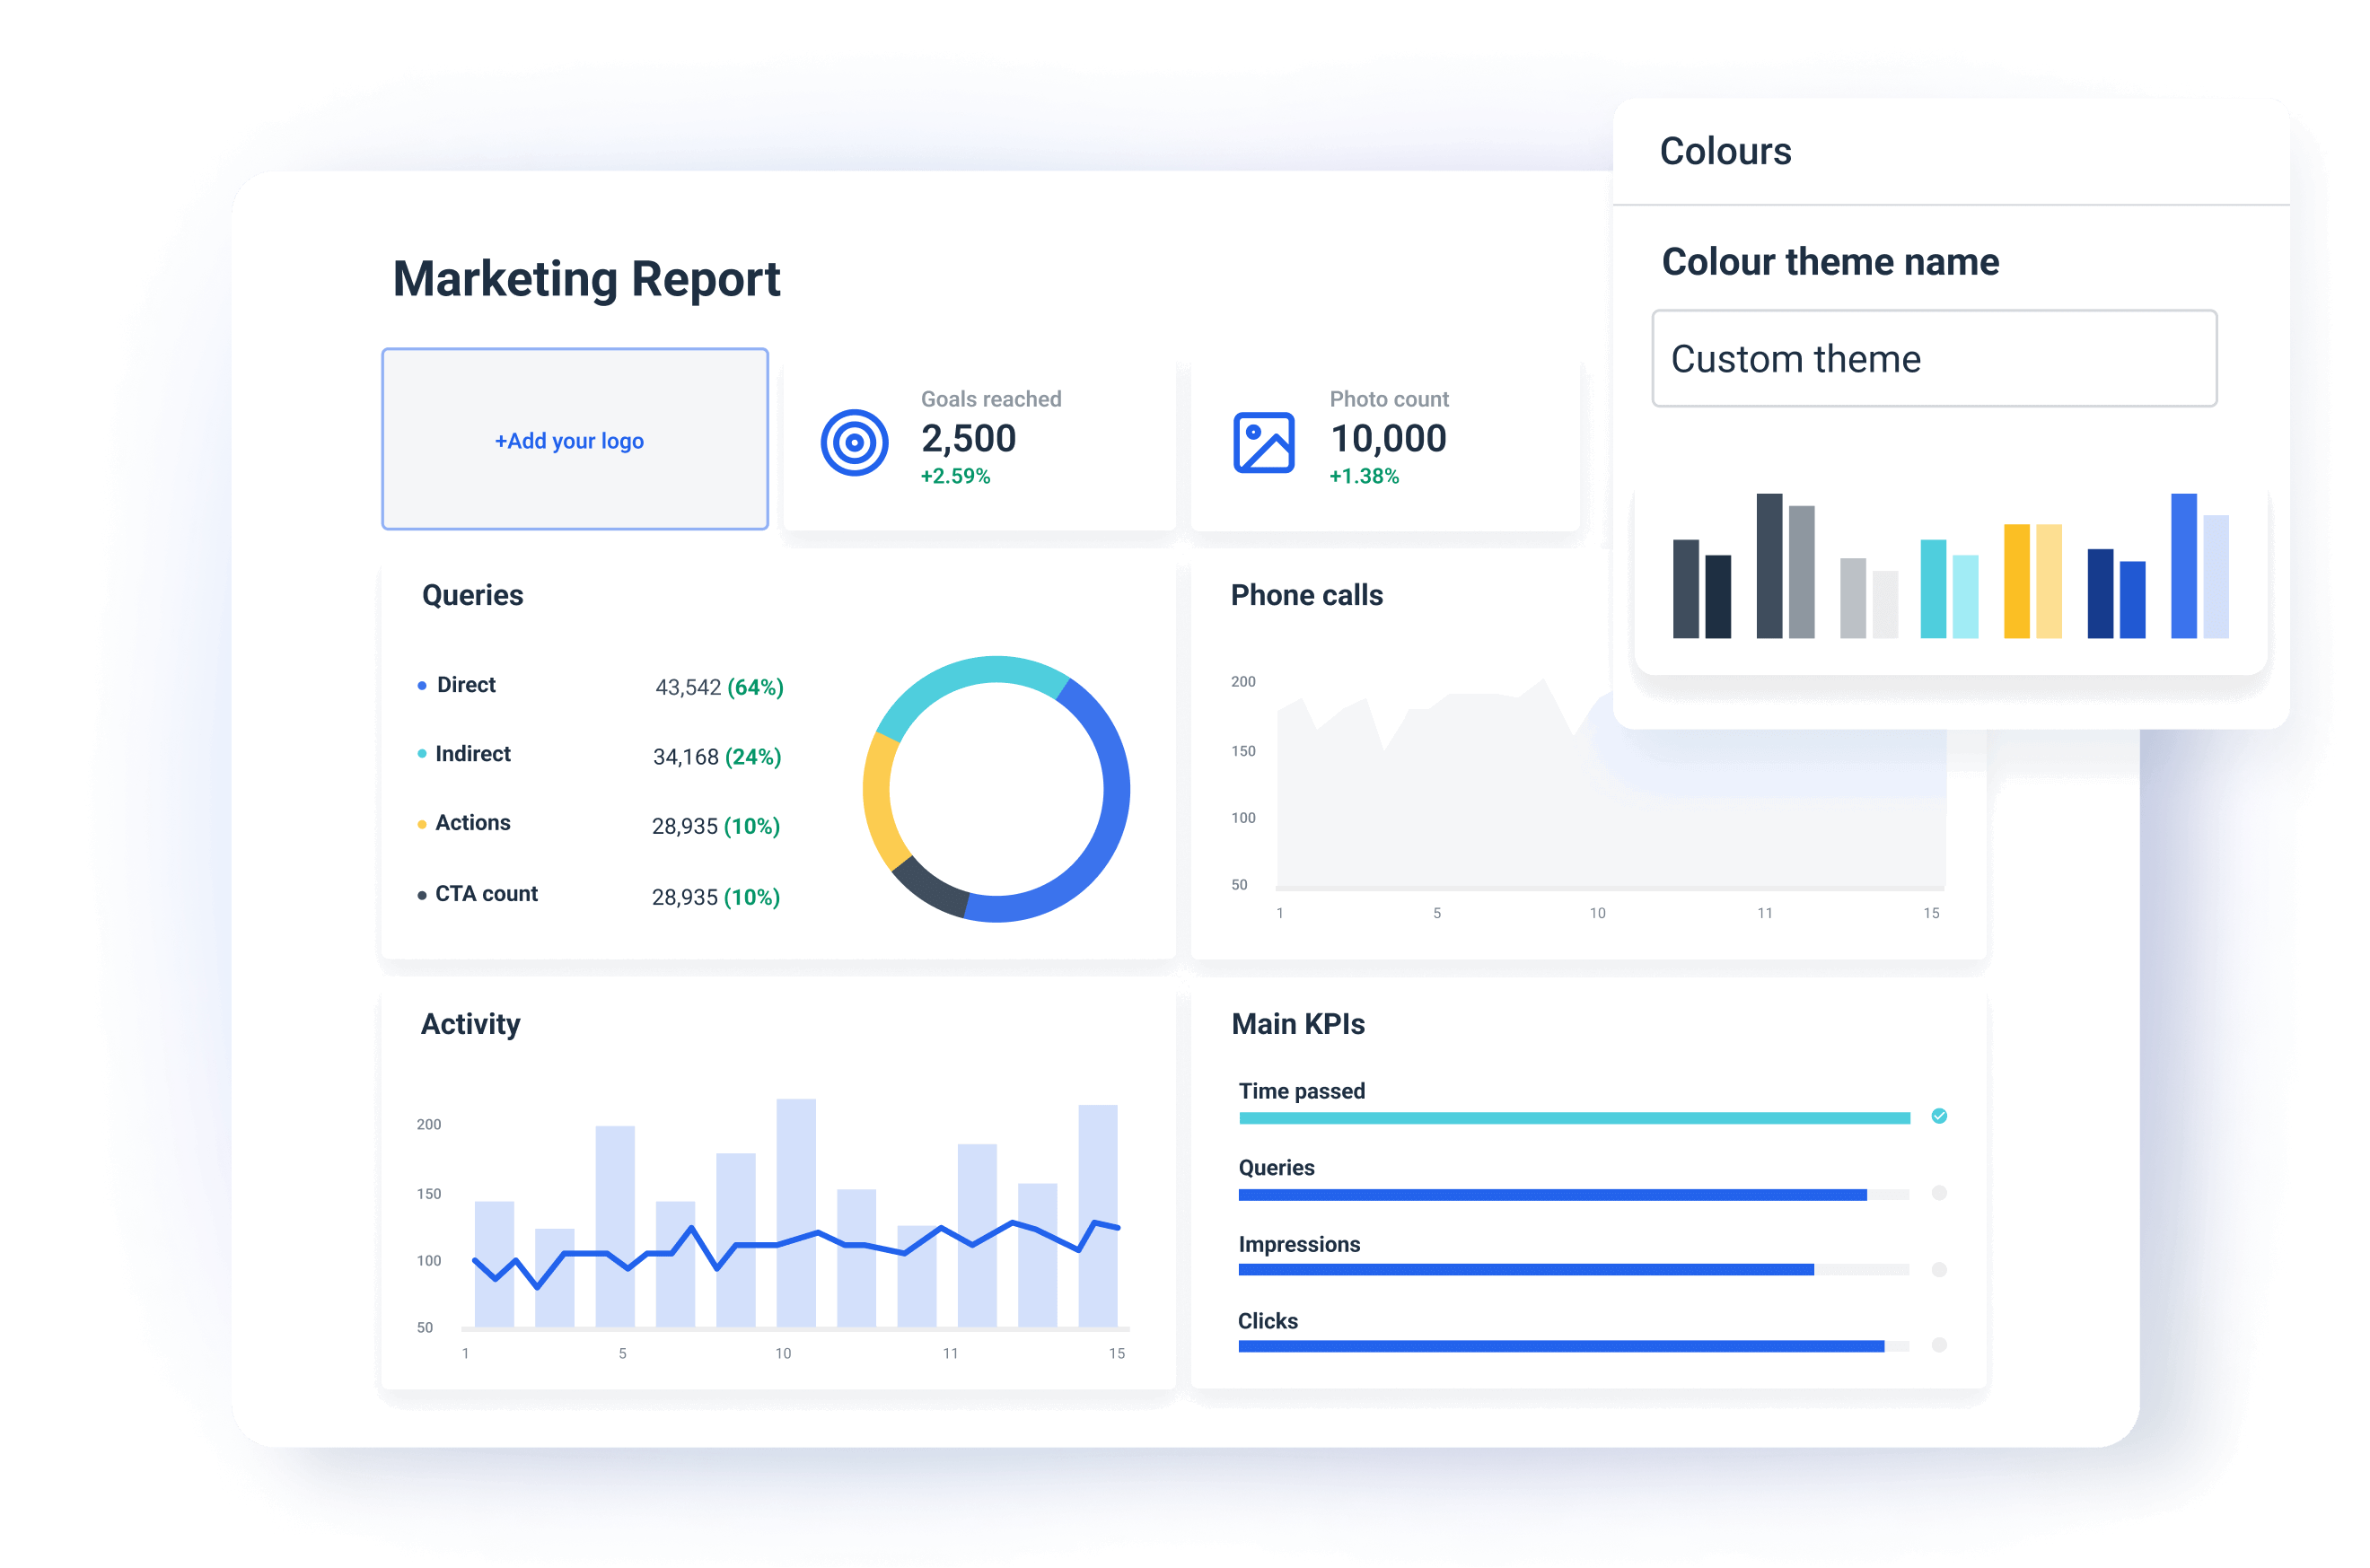
Whatagraph offers the white-label feature for all client reports and dashboards you create. .
Wrapping up
Creating amazing client reports is not rocket science. If you’re already using a client reporting tool, all it takes is a little bit of effort to make your custom reports stand out from the rest of the boring and bland agencies out there.
Wondering how to get started? Sign up for Whatagraph and embrace the power of report automation. With 50+ integrations and data points, this reporting software allows you to report on any marketing segment with ease.
Say goodbye to spreadsheets, save time with an effective client report template for every occasion, and see what it’s like to be loved by your clients. Sign up for a free trial today to get started!
Published on Jul 07 2022
WRITTEN BY
Nikola GemesNikola is a content marketer at Whatagraph with extensive writing experience in SaaS and tech niches. With a background in content management apps and composable architectures, it's his job to educate readers about the latest developments in the world of marketing data, data warehousing, headless architectures, and federated content platforms.