9 Management Dashboard Types and Uses
A management dashboard is a decision-making document that gives managers a bird’s eye view of an organization’s performance, which can be zoomed down into detail. It helps understand and remove performance bottlenecks, develop remedial actions, and even predict future performance.

Jul 26 2023●5 min read


What is a management dashboard?
The management dashboard is an umbrella term for a range of data-connecting, visualization, and sharing tools that report on all important business key performance indicators (KPIs) in one place. Management dashboards that are shared with company executives up to the C-level have an easy-to-read format so that everyone involved can understand the goals, metrics, KPIs, and action items that are presented.
These dashboards can include graphs, images, tables, numeric fields, data from case studies, or any combination of these elements.
Using a management dashboard, teams or managers can gauge performance and efficiency that highlight the key areas of the company’s activity, such as administration, development, marketing, sales, purchase, production, and others.
Unlike performance reviews that tend to happen less frequently, a management dashboard can help managers identify performance issues as they occur. This gives managers virtually a real-time reaction capability for getting quickly to the root of the problems and providing guidance to team members who are struggling.
Conversely, management dashboards help management make data-driven decisions on future business goals.
9 management dashboard types
Let’s introduce the nine essential management dashboard examples and explain how each can help you optimize management reporting and automate your workflow.
1. Project dashboard
A project dashboard highlights the important KPIs and the progress that your team makes. It’s a powerful project management tool you can use to visualize and share key metrics, statistics, and insights deriving from a particular project.
Project management dashboard allows you to segment those KPIs by an individual or team to monitor task status based on particular individuals or departments. Connect your favorite sales and marketing tools with Whatagraph to track the project status and progress in real-time from one place.
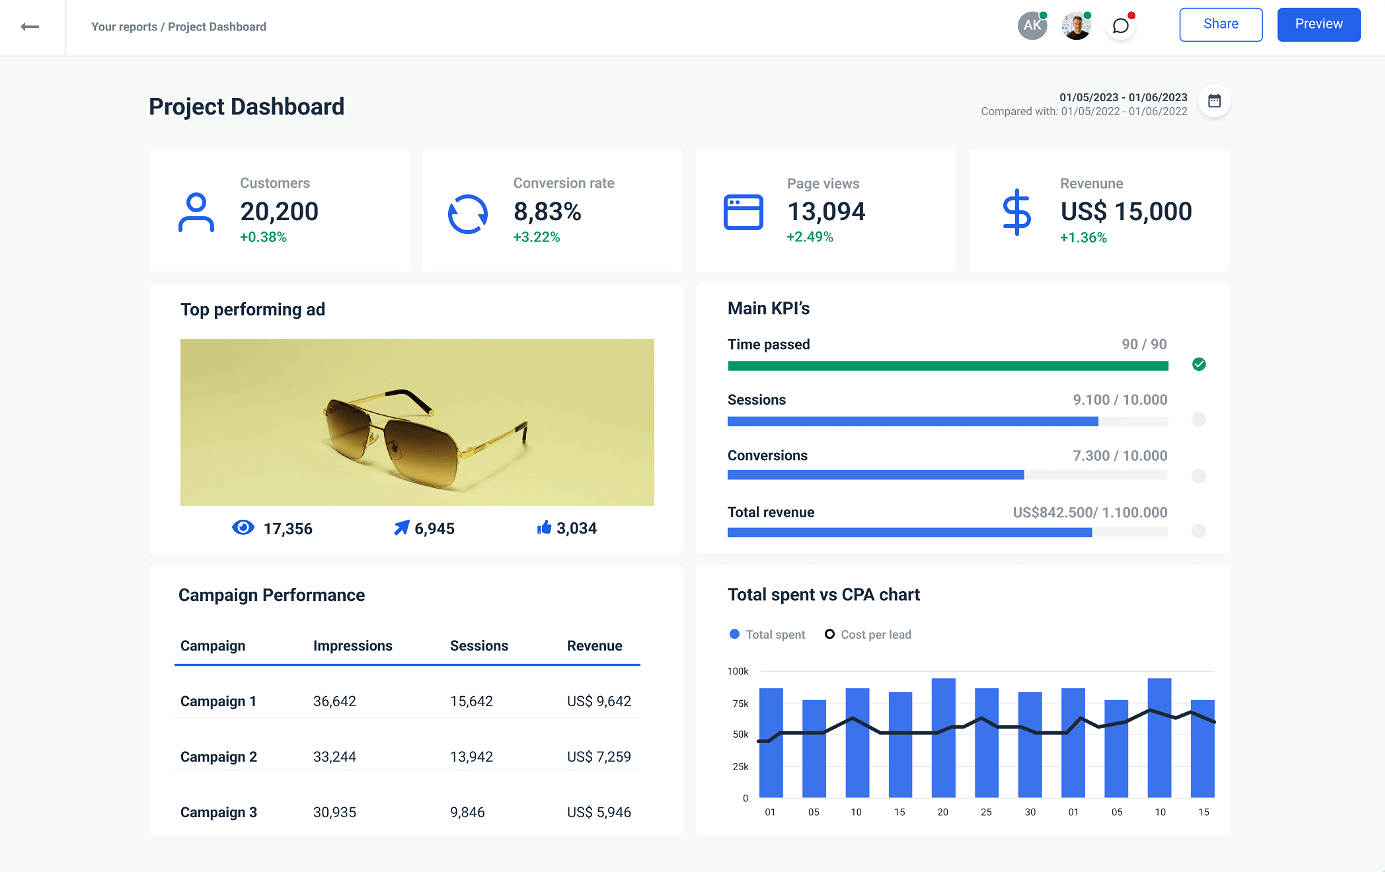
You can further customize our project dashboard so it contains only the essential progress metrics.
However, companies aside, Whatagraph’s project dashboard software is often used by marketing agencies to monitor the performance of multiple marketing campaigns they run for their clients. This way, they can create comprehensive project reports.
2. CMO dashboard
Digital marketing relies on multiple platforms — social media, SEO, paid ads, email automation, and others. As a CMO, you need to know at any time whether the digital marketing efforts are paying off and generating a positive return on marketing investment (ROMI).
Whatagraph’s CMO dashboard can help you connect data from multiple marketing platforms and visualize the vital marketing KPIs.
No need to rely on unwieldy Excel spreadsheets to stay in the loop with all the marketing performance. A one-stop-shop CMO marketing reports dashboard will improve and speed up your decision-making.
If you like to customize your CMO reports, you’ve come to the right place. Upload your logo, use your own color scheme, add pre-made widgets and drag-and-drop metrics you want to see.
Any dashboard you create, you can share with other stakeholders in your company by forwarding a live link.
3. Business dashboard
A business dashboard lets you make informed business decisions quickly by aggregating data from multiple marketing channels and visualizing it in real-time.
You can monitor the number of sales, revenue, profit margins, and profit that your business generates as tables, graphs, or charts. Such a visual approach to business data gives you excellent visibility into your business KPIs and performance metrics.
Whatagraph’s business dashboard gives you an instant view of your customer retention rates, budgeting, and customer satisfaction based on real-time data.
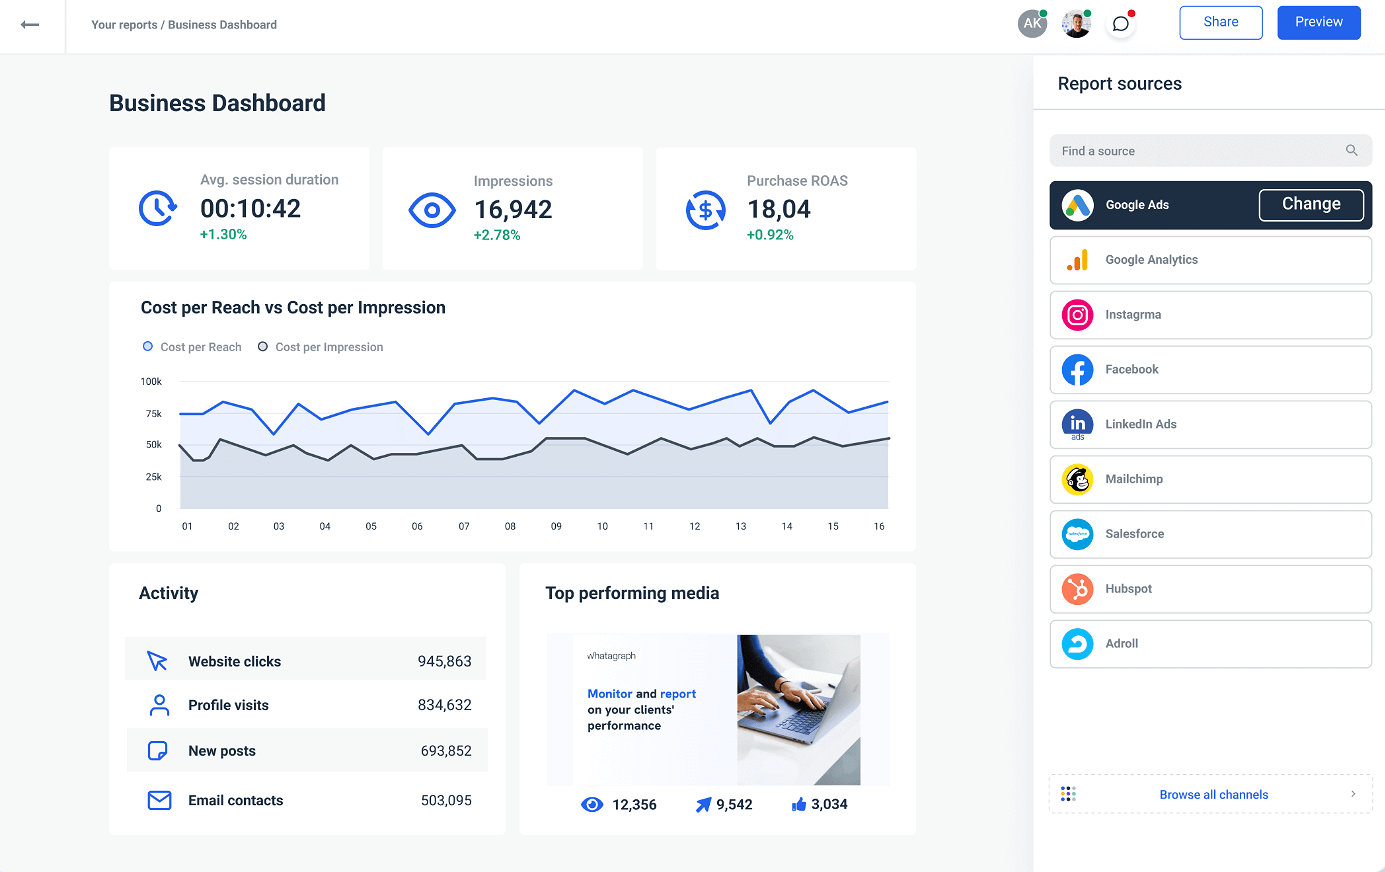
Keep the board of investors and other stakeholders informed by sharing a live link to your business dashboard instead of manually sending a report each week, month, etc.
4. SaaS dashboard
A SaaS dashboard is an essential business tool for founders to analyze their SaaS business ideas because it consolidates and visualizes the most critical SaaS metrics like monthly recurring revenue (MRR), customer acquisition cost (CAC), loan to value (LTV), customer lifetime value (CLV), and target revenue (TR) and all the other metrics you need to watch out for.
Whatagraph is capable of connecting and pulling data from any of your marketing, web analytics, PPC, and CRM platforms and transforming it into actionable SaaS dashboards.
If you need to know how each individual marketing channel is reporting, launch a Whatagraph dashboard and see which channels are better at driving new customers, where your CAC is going, what’s causing churn, and where to focus on improving the overall performance.
5. Startup dashboard
A startup dashboard can dramatically impact the performance of your venture right from the very start by enabling accurate data tracking and improving collaboration within your organization.
When you can blend data from any of over 45+ different marketing tools, you’re getting an early big-picture view of what channels are pulling your startup forward.
With Whatagraph’s startup dashboard, you can easily collect the most recent metrics from the platforms your business is associated with and have them delivered as visualizations and tables in real time. Add a couple of goal-tracking widgets, and you have an instant way to assess your progress.
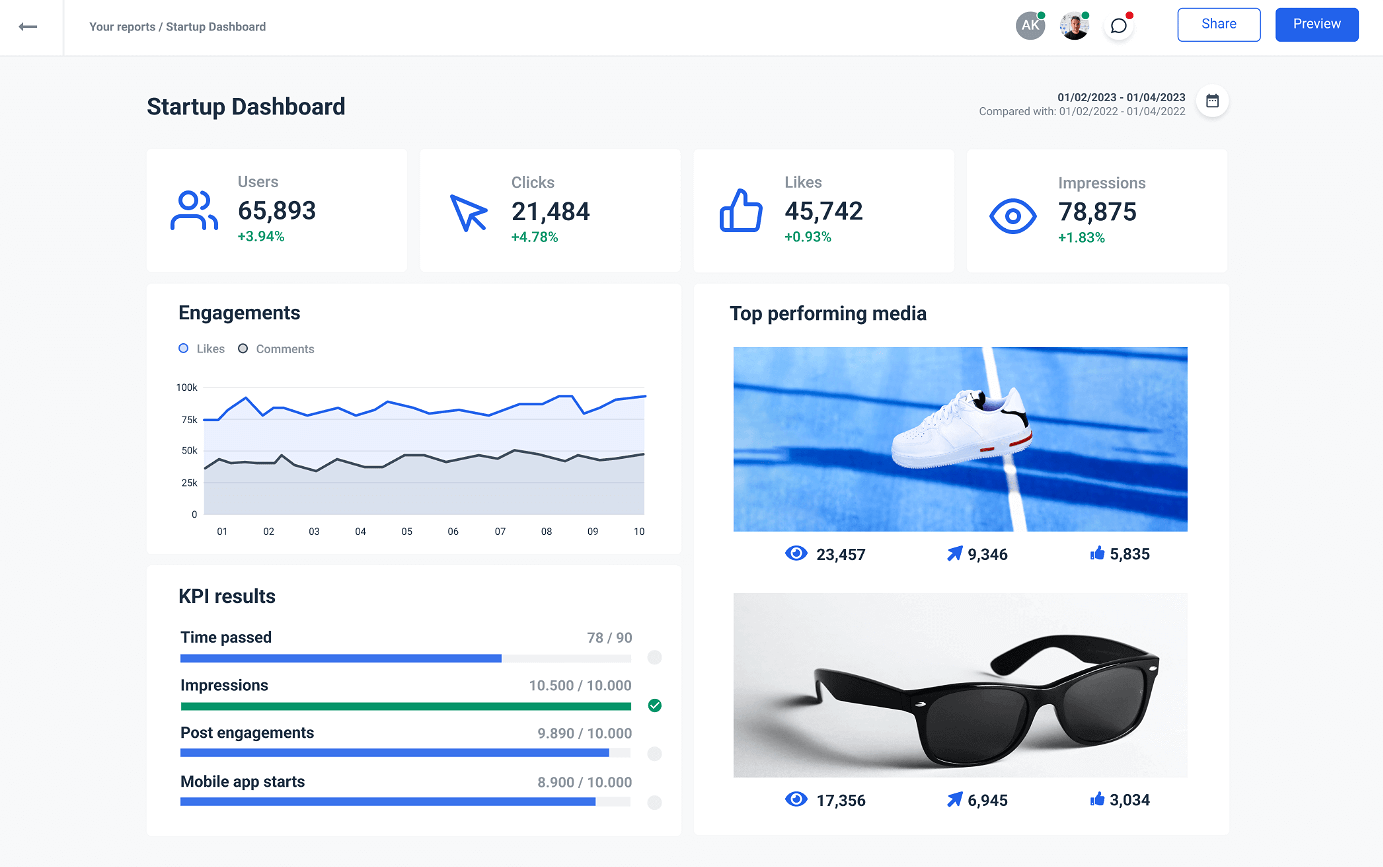
Explore our dashboard template and choose from a variety of pre-made widgets for different use cases, bar graphs, tables, pie charts, timelines, funnels, and pipelines.
6. CEO dashboard
Whatever marketing strategy your business uses — paid ads, social media, or SEO — a CEO needs to know if the campaigns are paying off. A CEO dashboard will help you understand what impacts your ROMI, as well as track vital KPIs and metrics in real time from one place.
For you as a CEO, it means a lot of you can see the relevant data from one location, as it speeds up the decision making and shortens the information transfer channel.
Whatagraph can help you tie all those critical data points in a single CEO dashboard so your executive team can view and share the latest performance reports more effectively.
7. Sales performance dashboard
A sales performance dashboard is an invaluable tool for minimizing and even eliminating roadblocks that stand between your business and growth. With this type of dashboard up and running, your sales performance metrics.
Whatagraph’s sales performance dashboard easily sends time-consuming spreadsheets into early retirement.
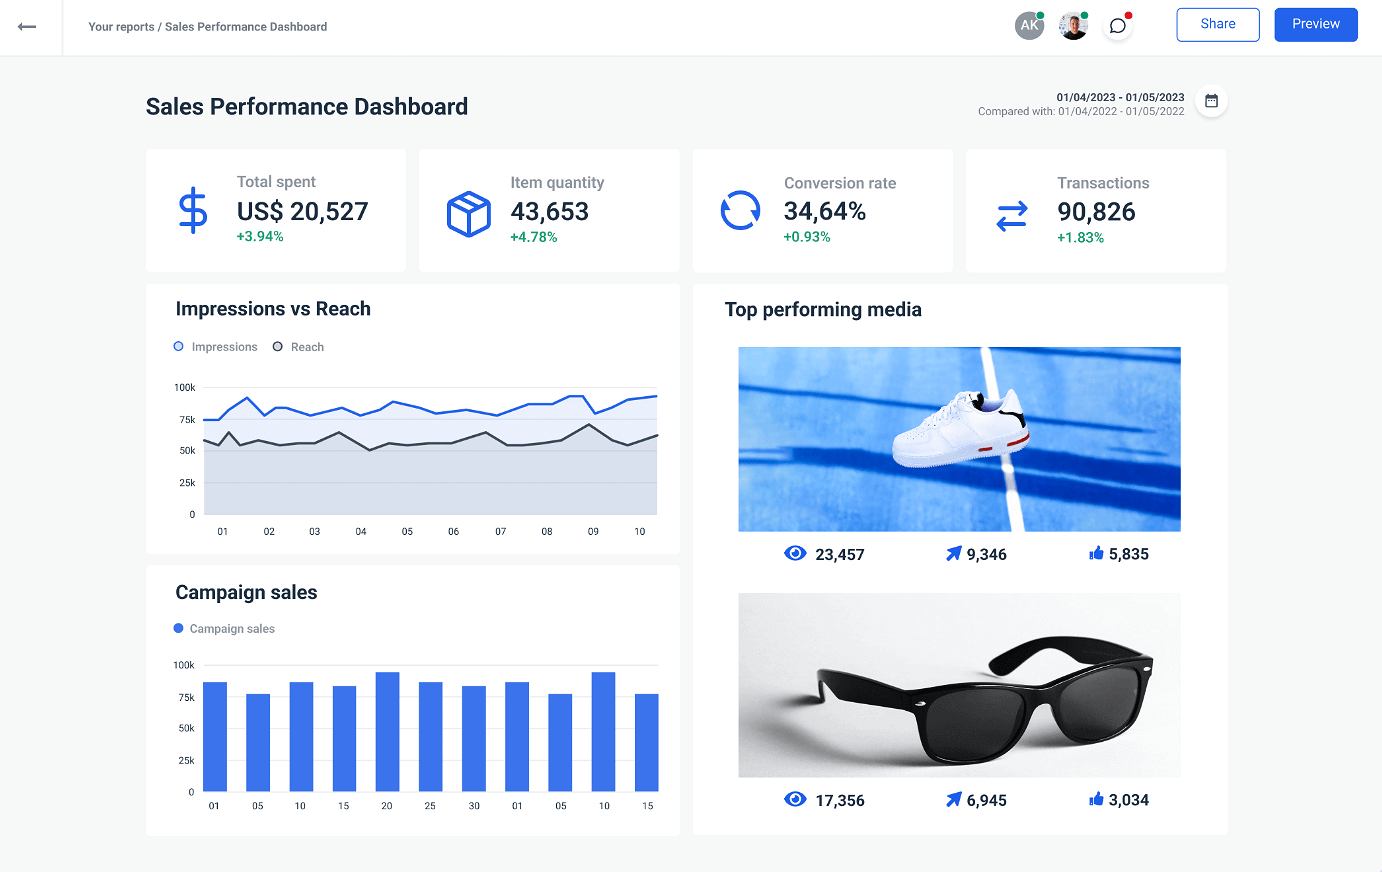
With native integration to Google Analytics, Google Search Console, Facebook Ads, HubSpot, Salesforce, and over 40 other platforms, it allows you to track and analyze sales metrics and identify the top-performing marketing channels.
Once you connect the desired data sources, use a pre-made sales performance dashboard template or use our drag-and-drop dashboard builder to create one from scratch yourself.
8. Small business dashboard
A small business dashboard can significantly increase your “line of sight” and positively impact your venture by establishing accurate data tracking and effective collaboration within an organization.
When you have a single place to report from on all your essential business analytics, it’s easy to keep everyone on the same page but also dig into more granular data for individual teams.
And Whatagraph’s small business dashboard does just that — shows you what marketing campaigns are performing the best, how the product sales are going, and what is the budget expenditure — all in one location.
When you have an all-in-one marketing data platform handling your marketing data, you can spend more time focusing on your business. The relevant metrics are automatically pulled from the business tools to give you a comprehensive overview of your business performance.
9. Financial dashboard
When you work in finance or are in charge of a company’s financial assets, you likely have large amounts of important data to review and report on.
And whoever’s done it knows how overwhelming it can get to keep track of revenue, income, assets, working capital, and other financial KPIs.
Whatagraph’s financial dashboard can make these tasks not just bearable but also enjoyable, especially if you use Whatagraph’s visualization feature.
Whatagraph is a simple but powerful platform to connect, visualize, and share data that can improve decision making of your financial department.
By blending information from multiple business systems such as Shopify, Simplifi, Klaviyo, HubSpot, and WooCommerce with analytics platforms and social media into one financial KPI dashboard, Whatagraph can deliver a big-picture view into the financial health of your company.
FAQs
What is dashboard management?
Dashboard management is the process of identifying, monitoring, and prioritizing important business KPIs using a digital dashboard. Management dashboards are visual software tools that connect and display scattered KPIs, so you don’t need to identify, measure, and report them individually.
How many charts should a dashboard have?
You should create your dashboards with two chart types at least. According to user experience feedback, the dashboard with three charts is the second most popular type.
Wrapping up
Fresh and accurate data is at the core of decision making across the departments in any organization looking to keep moving forwards.
This is why managers, stakeholders, and decision-makers need a single place to gauge performance, analyze trends, remove roadblocks, and, no less importantly, plan future steps.
A detailed management dashboard is a tool for the job — especially if it’s easy to use and share, like Whatagraph.
Whatagraph allows you to set up a management dashboard and start collecting data from all your business platforms and visualize it through pre-made or custom widgets.
You can either select one from our library of templates or create one from scratch using our intuitive drag-and-drop dashboard builder.
And if one of your business tools is not among our integrations yet, you can always use a custom API or export the data to Google Sheets or BigQuery and visualize it from there.
Finally, you can share your dashboard just as easily, by sending a live link so all the decision-makers involved can be on the same page all the time.
So if you’re looking for a one-stop-shop management dashboard, sign up for a free trial and pick a management dashboard that can really help you grow your business.
Published on Jul 26 2023
WRITTEN BY
Nikola GemesNikola is a content marketer at Whatagraph with extensive writing experience in SaaS and tech niches. With a background in content management apps and composable architectures, it's his job to educate readers about the latest developments in the world of marketing data, data warehousing, headless architectures, and federated content platforms.