Big Changes Have Arrived — The New Whatagraph Features
Whatagraph is rolling out new features and updates to make routine data gathering, aggregating and reporting tasks even easier. See what’s new!

Aug 23 2021●5 min read

The all-new Overview
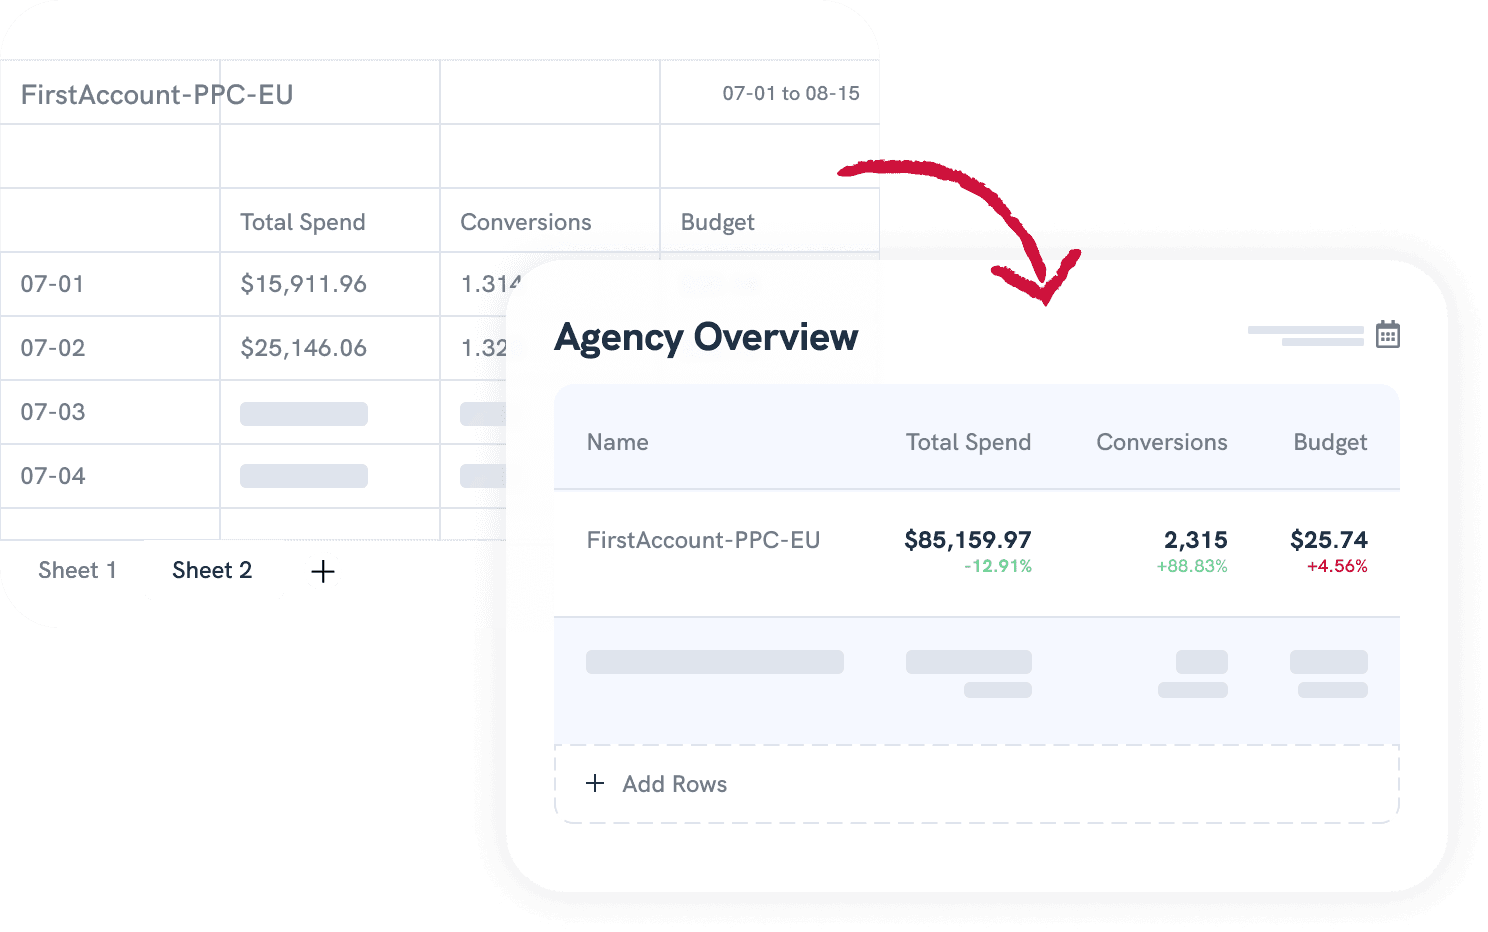
This new feature allows Whatagraph users to track all their clients and KPIs in one place. Overview enables users to create a unified KPIs dashboard, where the whole team can monitor their clients and marketing channels’ performance.
Multiple Overview feature allows team members to:
- Monitor different clients and KPIs in a single place.
- Split the responsibilities between account managers and track their clients’ performance using Overview.
- Spot the dramatic performance changes faster than ever.
Ultimate time-saver — Smart Builder
A beautiful report with a click of a button? It’s possible with the Smart Builder. Eliminate routine data tasks off your schedule. Connect marketing channels to Whatagraph and Smart Builder will automatically create a report from your marketing performance data. It’s truly an ultimate time-saver!
Custom data and API
Don’t put yourself in integrations boundaries. Pull data out of nearly every source — whether it’s the public or in-house source, custom data and Public API got you covered. Fuel up your reports with even more data and make better insights!
New integrations!
Over 30 integrations are waiting to be implemented into the visual reports. Here are a few new joiners:
Google Analytics 4
While the classic Google Analytics will be phased out slowly, Whatagraph is ready for the changes and the integration for GA4 is available to be connected. Track all of the key performance metrics, including unique sessions, engagement & conversion rates. Build a visual report using pre-built Google Analytics 4 template and widgets or use the Smart Builder feature for effortless performance reporting.
Woocommerce
The most popular WordPress eCommerce plugin Woocommerce is now integrated with Whatagraph.
Power up your eCommerce with data-driven insights by connecting Woocommerce and Google Analytics data in one easy-to-understand report.
Klaviyo
Marketing automation platform Klaviyo has over 70 000 paid users around the world. To ease the routine email and SMS marketing data aggregation and visualization, Whatagraph has gained Klaviyo integration!
Marketing professionals can track the most important metrics, such as users’ demographics — age, gender, location and OS type. Marketers can also gather performance insights by reviewing click and open rates, bounced emails and more.
ActiveCampaign
With Active Campaign integration, marketing professionals can track their most important CRM, email marketing and sales data.
Use pre-built templates and widgets or build a cross-channel, easy-to-understand report effortlessly. Gain deep insights into your customer’s preferences across different marketing channels and monitor the performance of email and SMS marketing campaigns.
CallTrackingMetrics
Convert potential customer calls into the leads easier with a Call Tracking Software. Monitor various metrics, such as calls lengths, tracking sources, average ring and talk time and more in one visual report and real-time dashboard thanks to fully managed integration.
Marketing professionals can also group calls by ad placements, callers’ countries, agents and other attributes.
Something you might’ve missed…
Two out of three marketing professionals state data-driven decisions to be more effective than gut instincts. Marketers need to see the importance of data monitoring and reporting. And to cut the time marketers spend on routine data tasks such as collection, aggregation and visualization, Whatagraph is the number one choice. Here are a few features that our users and we love:
Report automation
Always catch the attention of your clients with a visual, easy-to-understand report. Here’s what makes the report automation great:
- No more manual reports sending. The automation feature allows cutting time on manual data tasks, including client reporting. Data analysts can rest while the reporting tool does all the work. With just a few clicks, send reports straight to your client’s email inbox at the selected frequency — daily, weekly, bi-weekly or monthly.
- Always up-to-date data in every report. Start working smart, not hard and leave complexity behind. The report automation feature automatically updates the data from different sources and sends out the hottest performance reports.
- A quick summary of the report — so you can always preview the key data changes and stay in line with the client.
Custom branding
Build a report that sparkles your client’s energy! Keep your clients up to date and provide branded reports as a premium service. Custom Branding includes a handful of report customization features:
- Client’s company logo and color scheme — to show that you took an extra push with performance reporting.
- Branded email templates — add a personal message, short performance summary, logo and colors.
- Custom domain — replace the standard web report URL with the one branded with the company’s name to create an even more personalized report experience.
Make better data-backed decisions
At Whatagraph, we believe that everyone can be a data scientist. Forget time-consuming data extraction, complex Excel sheets and formulas and hard-to-understand visualizations.
Try Whatagraph yourself — get 7 days free trial and unleash the full power of your marketing data.

WRITTEN BY
Benediktas KazlauskasBenediktas is a detail-oriented writer with a passion for marketing and technology. Using his vast experience in Business Management and Sales, he approaches every blog with the same idea: How to make readers come back for more?
