7 Best Google Analytics Dashboards
A lot of marketers find the process of creating Google Analytics dashboards confusing. Google has created a solution for Analytics experts to share prebuilt dashboard templates for other marketers to use.

Jan 06 2026●8 min read
What is a Google Analytics dashboard?
The Google Analytics dashboard is a document that gives an update of your (or your clients’) most recent and important metrics and KPIs. It is a free-to-use service that offers basic analytical tools and statistics for search engine optimization and marketing purposes, among other things.
Moreover, you can learn about your visitors and how they behave on your website, where they come from, which actions they take, etc.
What to include in a Google Analytics dashboard?
Depending on the type of Google Analytics dashboard you need, there are different elements that you want to include to keep the dashboard useful.
- Real-time data
Real-time data is key in dashboards as its purpose is to provide immediate insights. Google Analytics dashboards with real-time data provide up-to-date information that may be used to improve and optimize current Google ad campaigns, for example.
- Metrics and KPIs
Despite the goals and objectives, any report should have its own set of important metrics and KPIs. Therefore, think about what your client would need to see the most.
Is your client’s goal to increase their general online presence? They might want to track acquisition, behavior, website traffic, unique visitors, or their goal conversion rate.
Or does your client want to create a more specific dashboard and learn about the demographics and their target audience? For that purpose, they would use metrics such as sessions, sessions by channel, or visits by location.
Why not try Whatagraph instead? Our Google Analytics 4 dashboard and metrics can be customized to present the current progress of your client’s marketing campaigns.
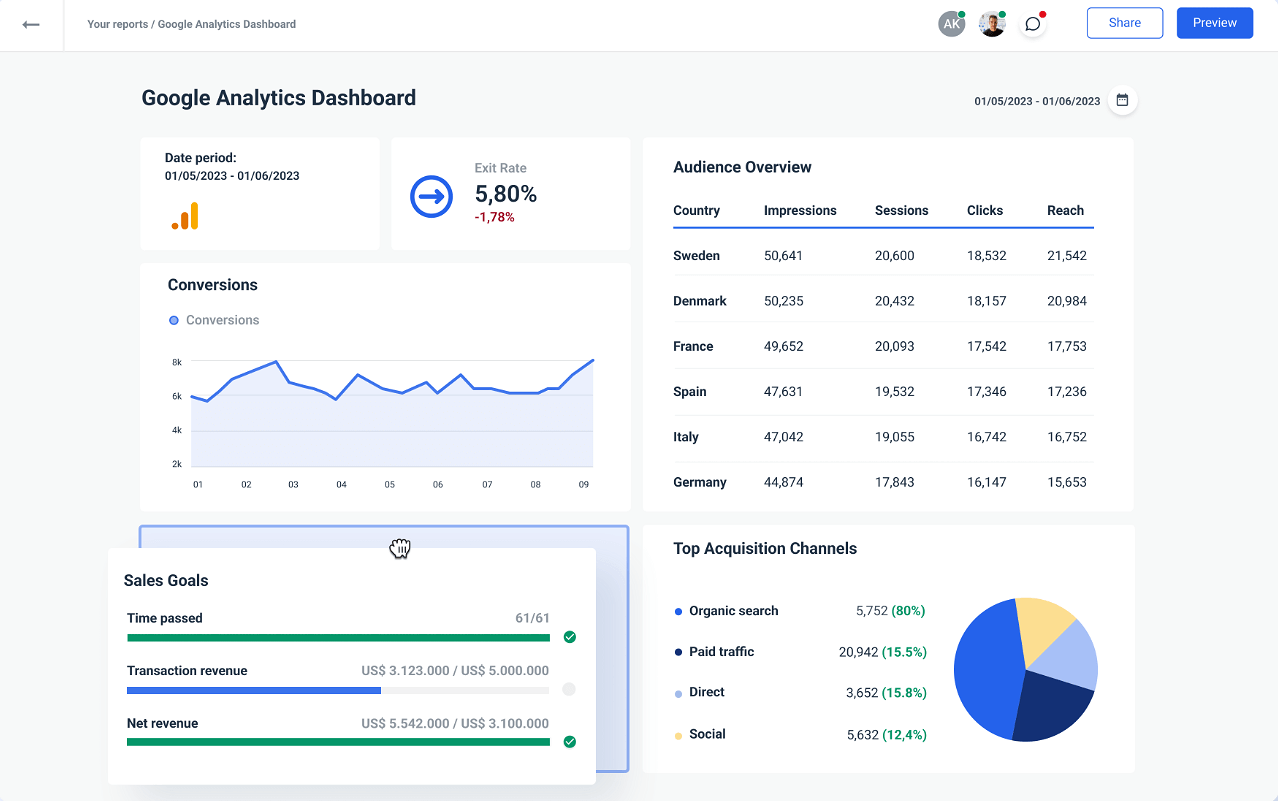
You can remove and add widgets and create your own custom cross-channel dashboards with blended data from multiple sources.
Create a new dashboard with Whatagraph from a blank canvas, or pick one from our library of pre-made templates.
Whatagraph offers a great user experience, and even new users can quickly create their own dashboards without a tutorial.
- Analytics
Google Analytics dashboards provide an overview of your client’s most recent data. With data visualization functionality, raw data will be aggregated to provide a high-level representation. This implies that any dashboard you develop should provide more than just data. Rather, they must convey a story and illustrate patterns and trends using pie charts, line graphs, and bar charts.
How to share a dashboard in Google Analytics?
It’s super easy to do.
First, go to your Google Analytics account and open the dashboard you want to share with your team members or clients.
Second, click on Share. Now you’ll have the options to:
- Send a dashboard via email;
- Schedule a dashboard email
- Share dashboard in the Google Analytics solutions gallery;
- Export your dashboard to PDF.
Depending on how you communicate with your clients or what kind of report you need to send to your boss, one of the options above may meet your needs. However, there are other options, too - but we’ll cover that in a minute.
Let us now cover some examples of great GA dashboards you can use to get inspiration.
Top 6 Google Analytics dashboards and report templates
1. Basic dashboard
This Google Analytics dashboard is all about tracking the fundamentals of your client’s website. This includes the type of visitors the website attracts and how they interact with your client’s website.
This dashboard focuses on sessions and bounce rates. The Google Analytics data provides great insights, allowing you to optimize PPC campaigns, among other things, and improve your overall website performance.
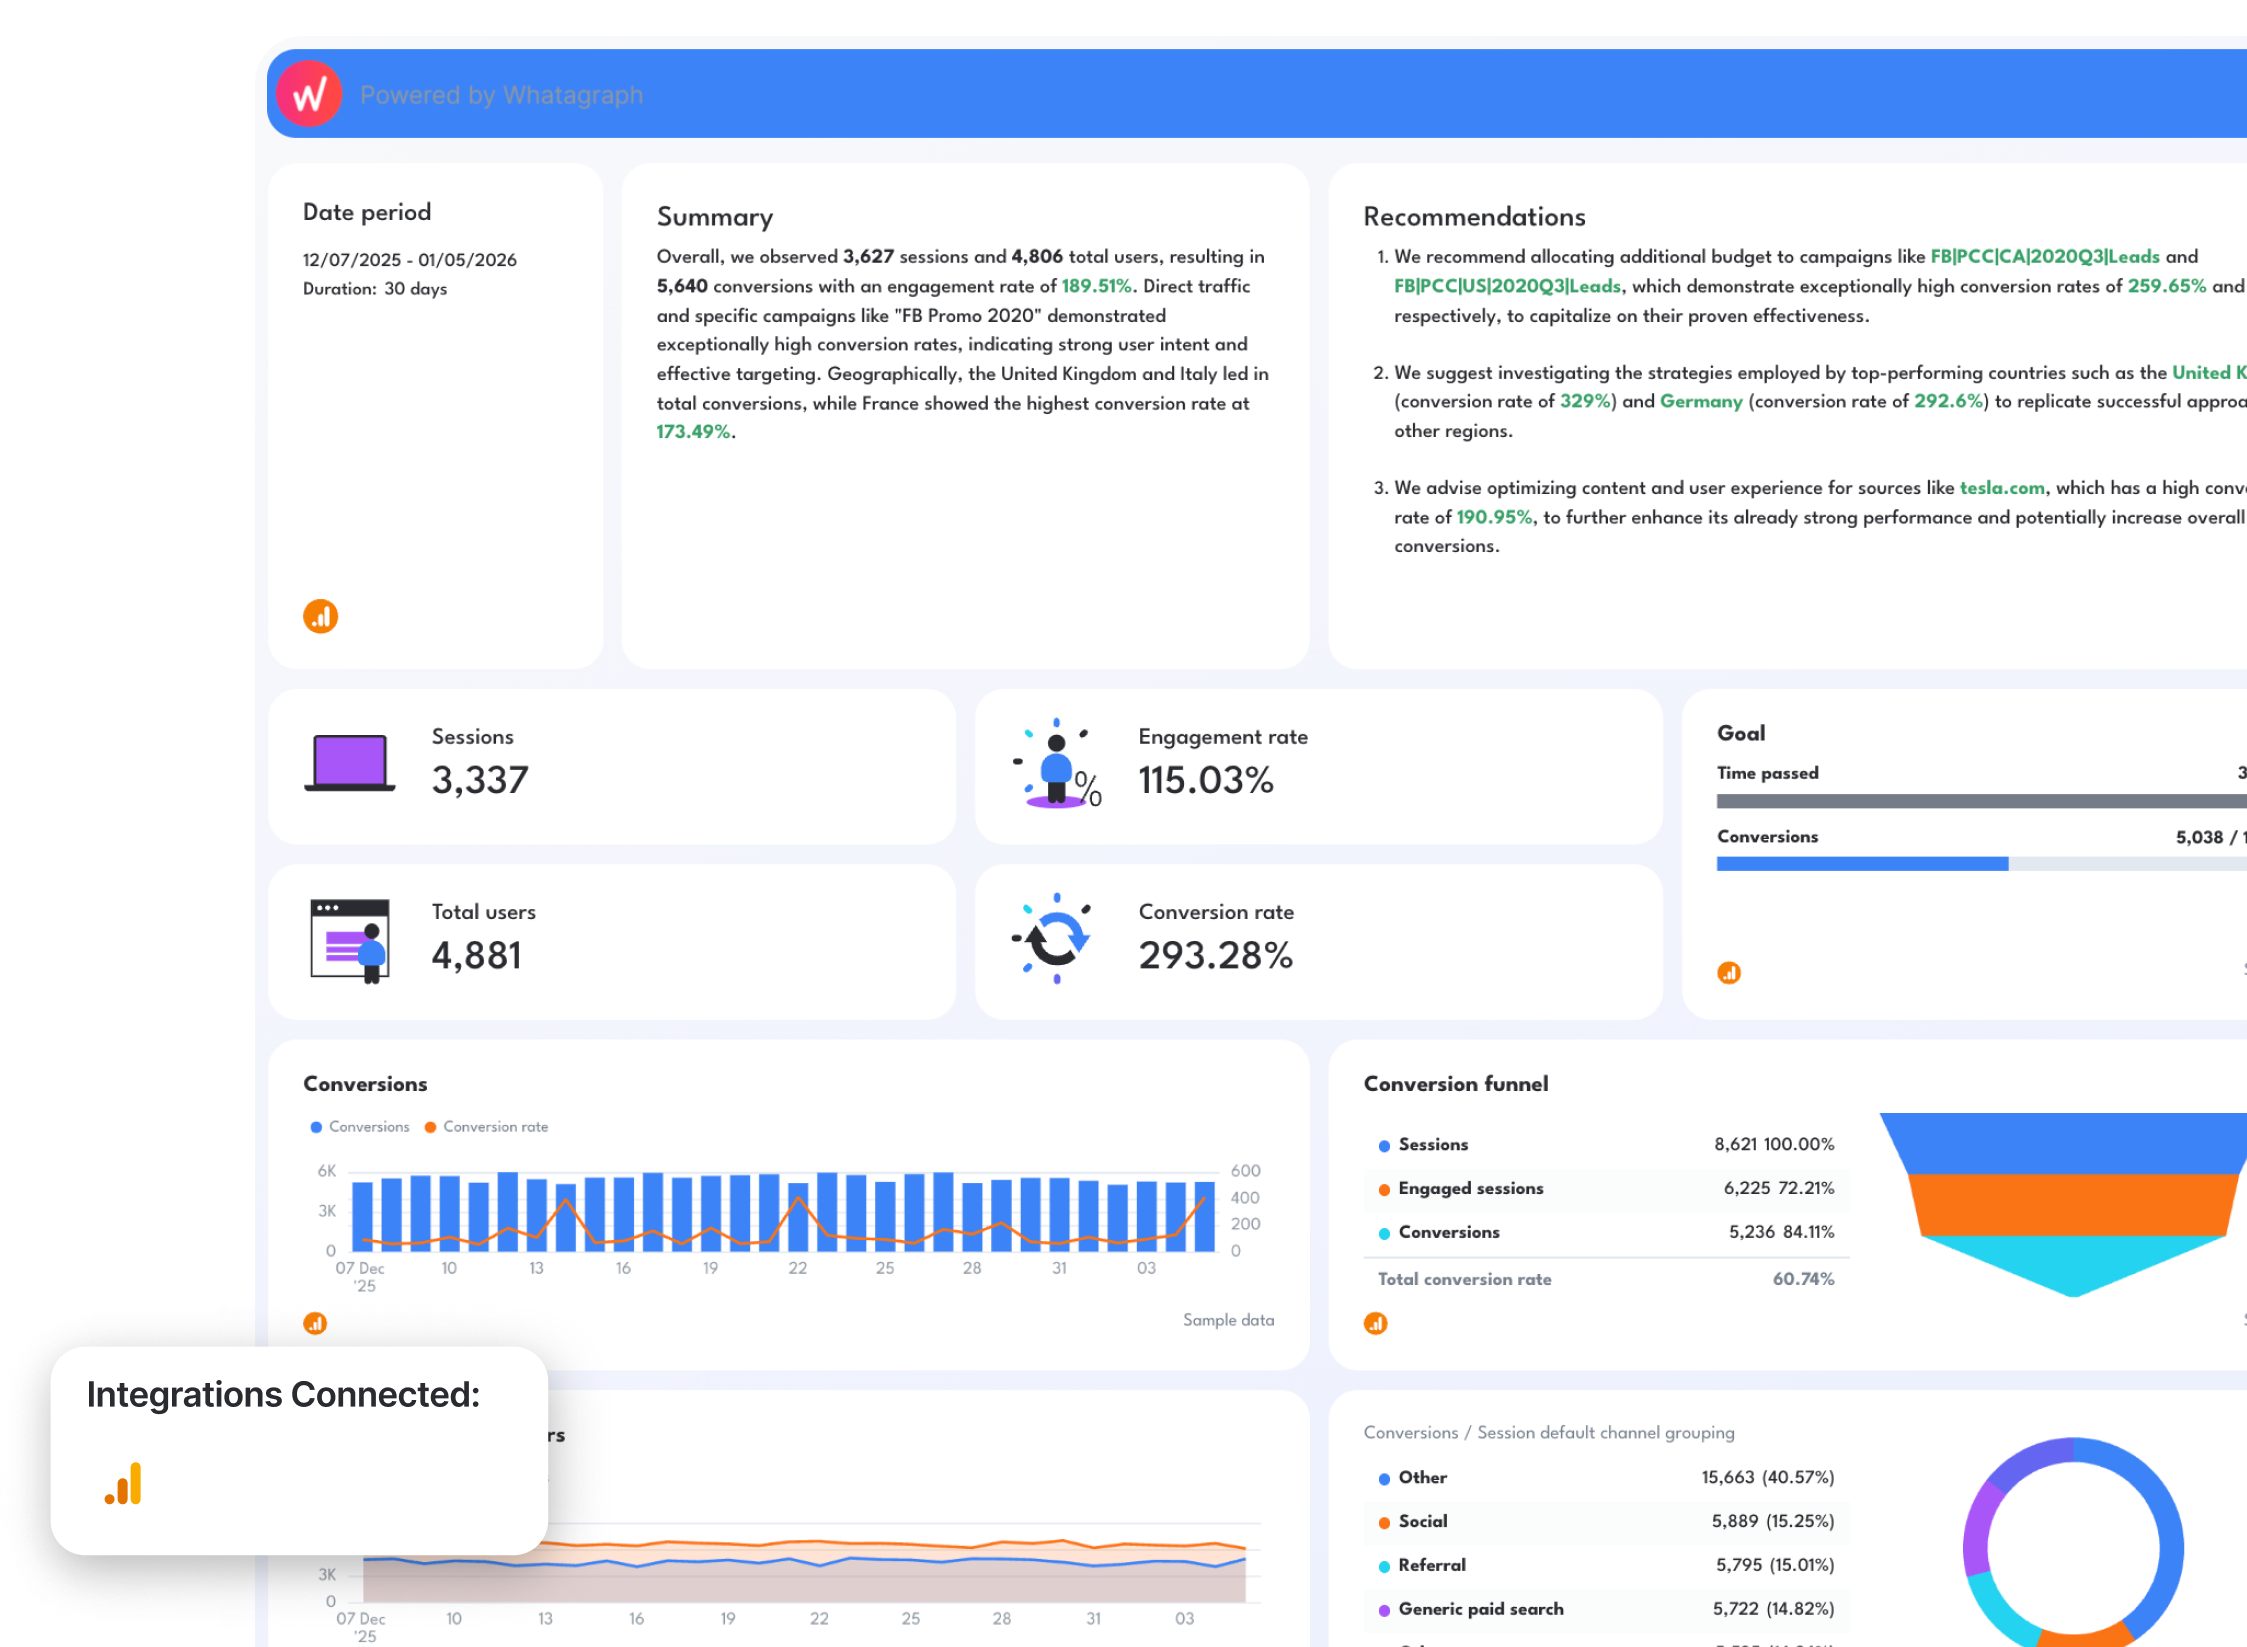
The basic custom dashboard with Whatagraph can be altered and personalized with the help of widgets. Drag and drop the elements you need and design a dashboard to answer some of these key questions:
- Are mobile viewers staying on the website?
- Where are the visitors coming from?
- Which website redirects the most traffic to your URL?
- Which of the social media channels generate quality visitors?
Bonus tip: keep the basic dashboard as basic as possible. Don’t display too much data or utilize too many categories. Remove any unnecessary data. Leave enough white space for the client to understand the data structure.
2. Marketing dashboard
The white-label marketing report template provides you with all the most important marketing data you need from your clients’ websites. From pageviews to devices being used, all the way to the gender and age of the page visitors, everything is in one place for an easy overview.
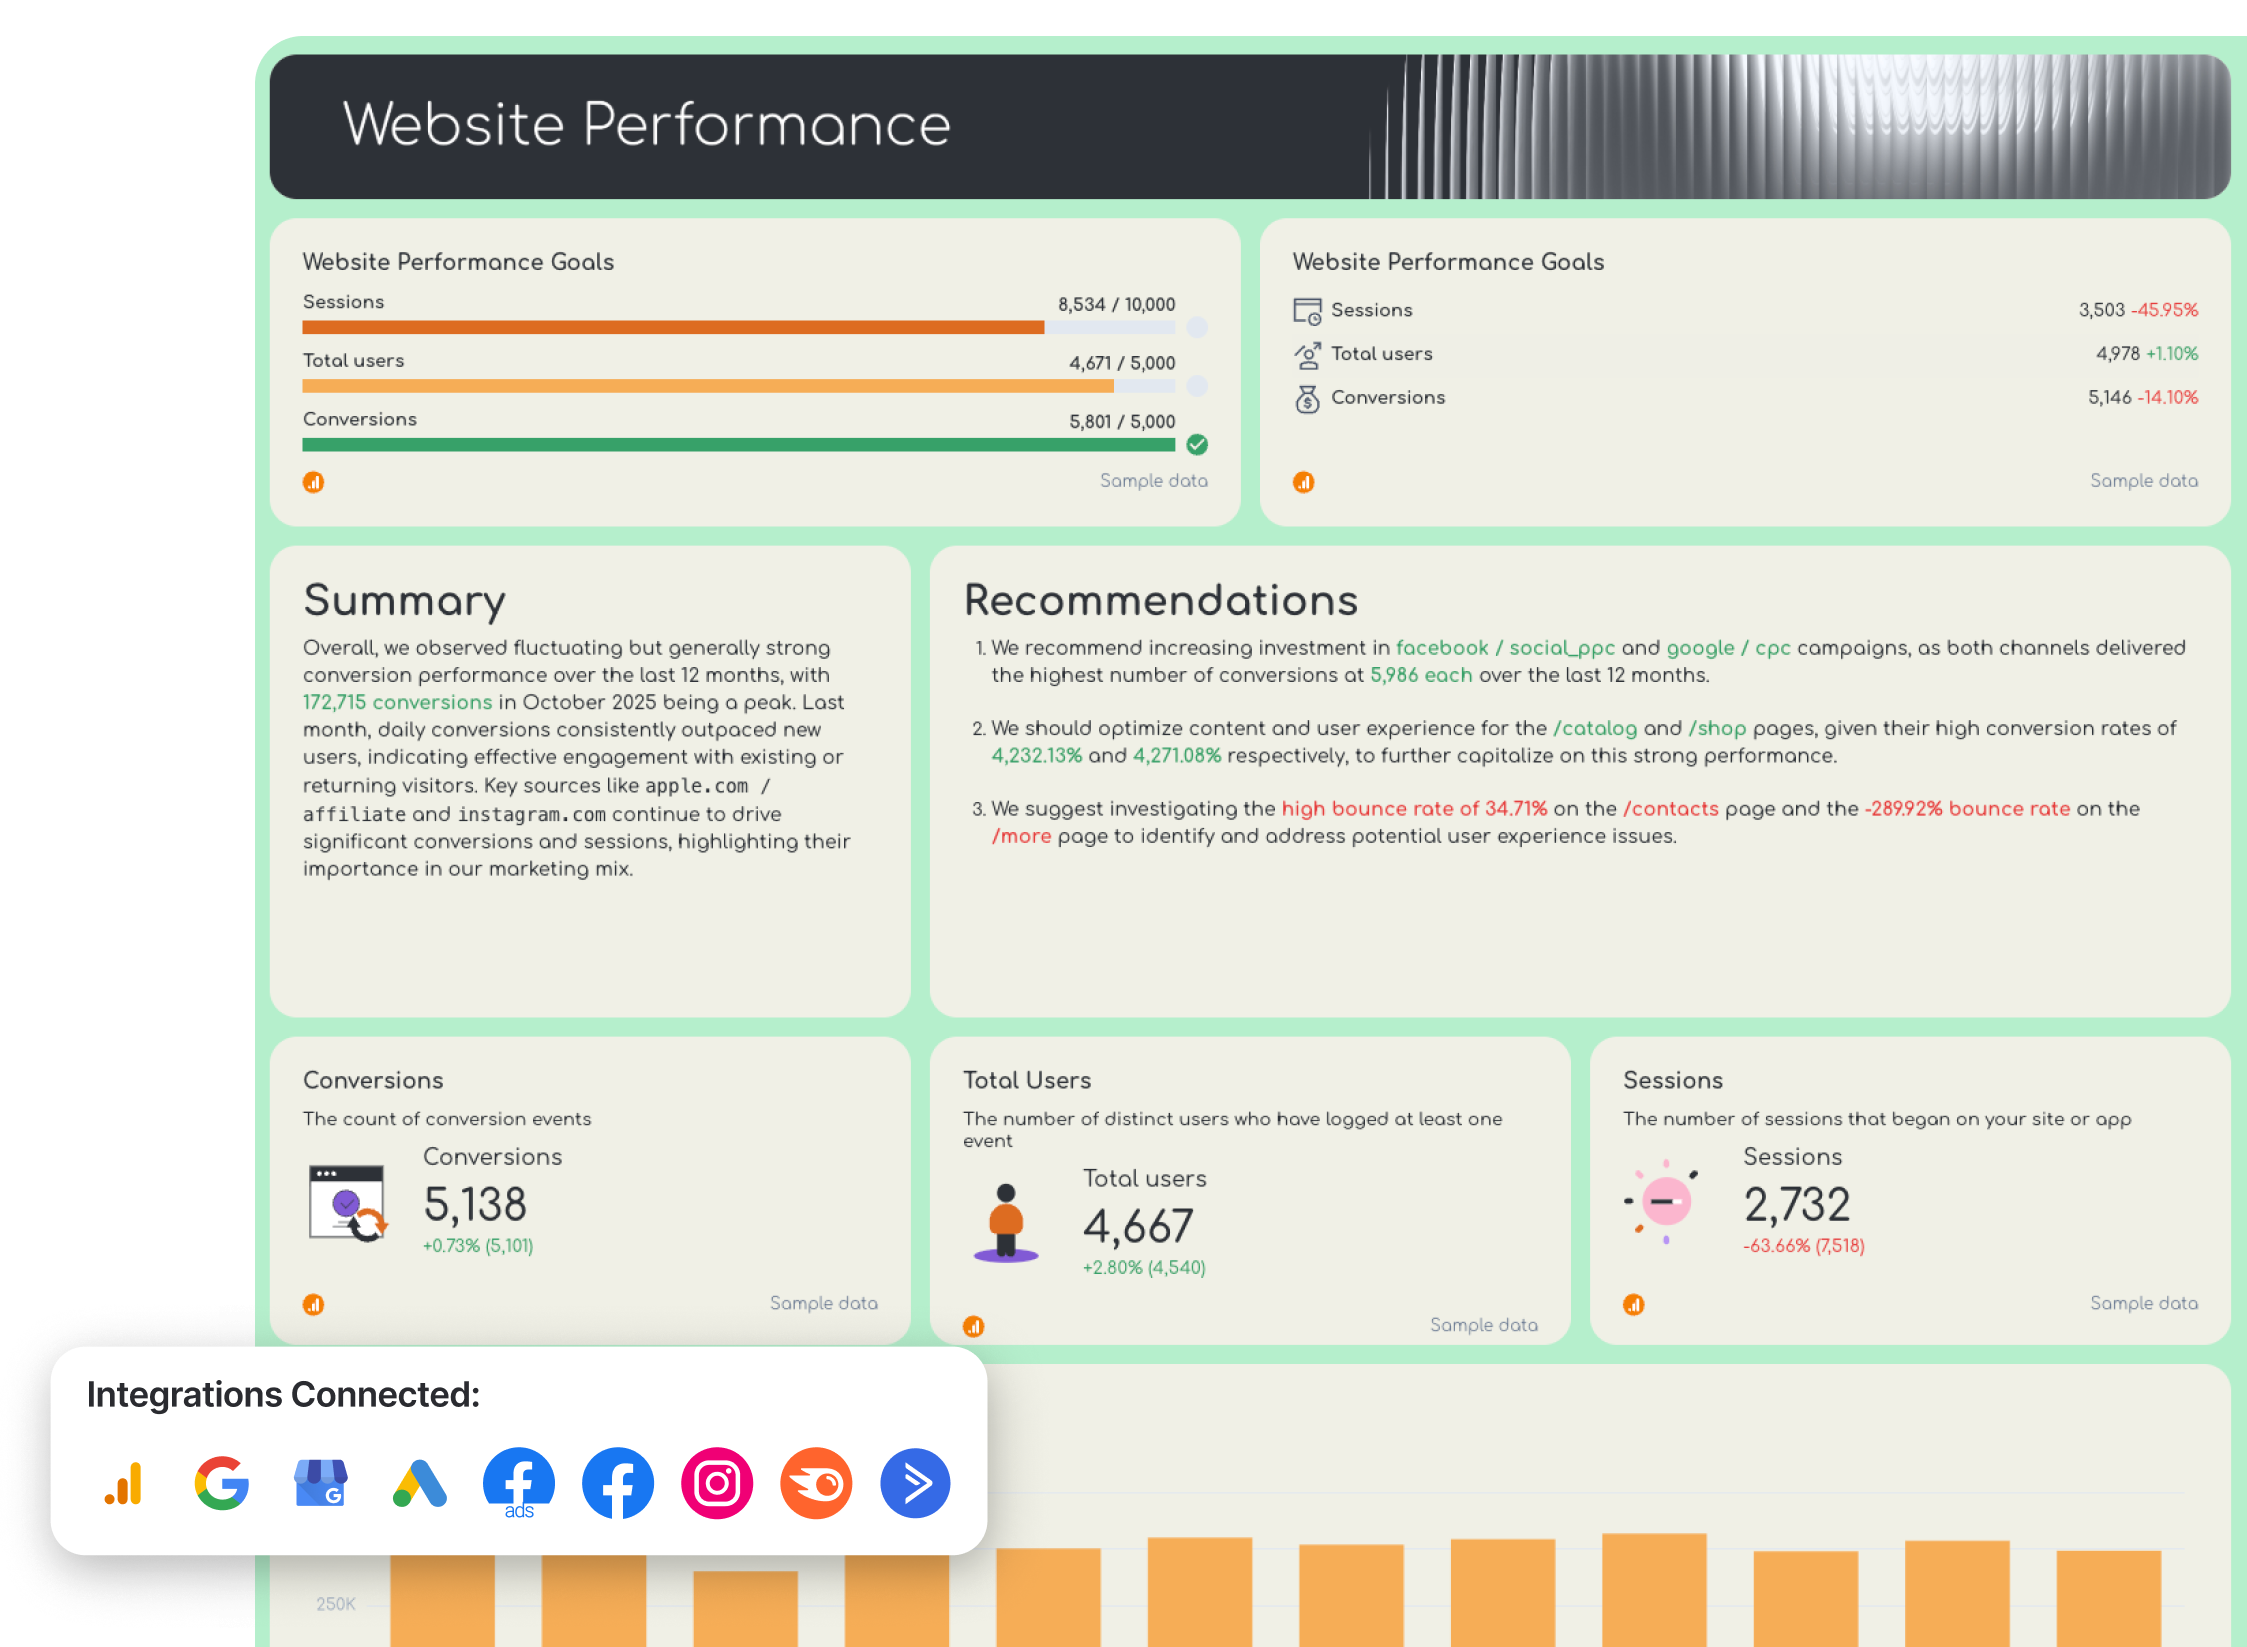 Questions answered by the dashboard:
- What are the demographics of users going to your website?
- What mobile devices do your visitors love to use?
- How long do they stay on your website?
- How many users return for multiple sessions?
- How many new users are you converting?
To create the best digital marketing dashboard, determine your client’s objectives and decide on the KPIs to showcase. Then, determine the data sources and channels you will be using. Based on the selected KPIs, you can decide where the data will be coming from.
For example, Whatagraph’s digital marketing dashboard for agencies allows you to combine data from many sources into a single client report. Improve your marketing reports by using dashboards with cross-channel data instead of pulling just one data source from Google Analytics.
3. Content marketing dashboard
The content marketing report template analyzes the performance of your website content and displays the entire funnel, from attracting visitors to converting them into paying customers.
An effective dashboard will provide valuable insights and help your agency answer questions regarding the overall content contributions to a client’s revenue.
Moreover, the content marketing dashboard will help you create better content in the future by giving you data on what your audience prefers the most.
It reveals:
- Which of the web pages is getting the most views;
- Which pages are driving the best goal conversions;
- Which of them records the highest bounce rates.
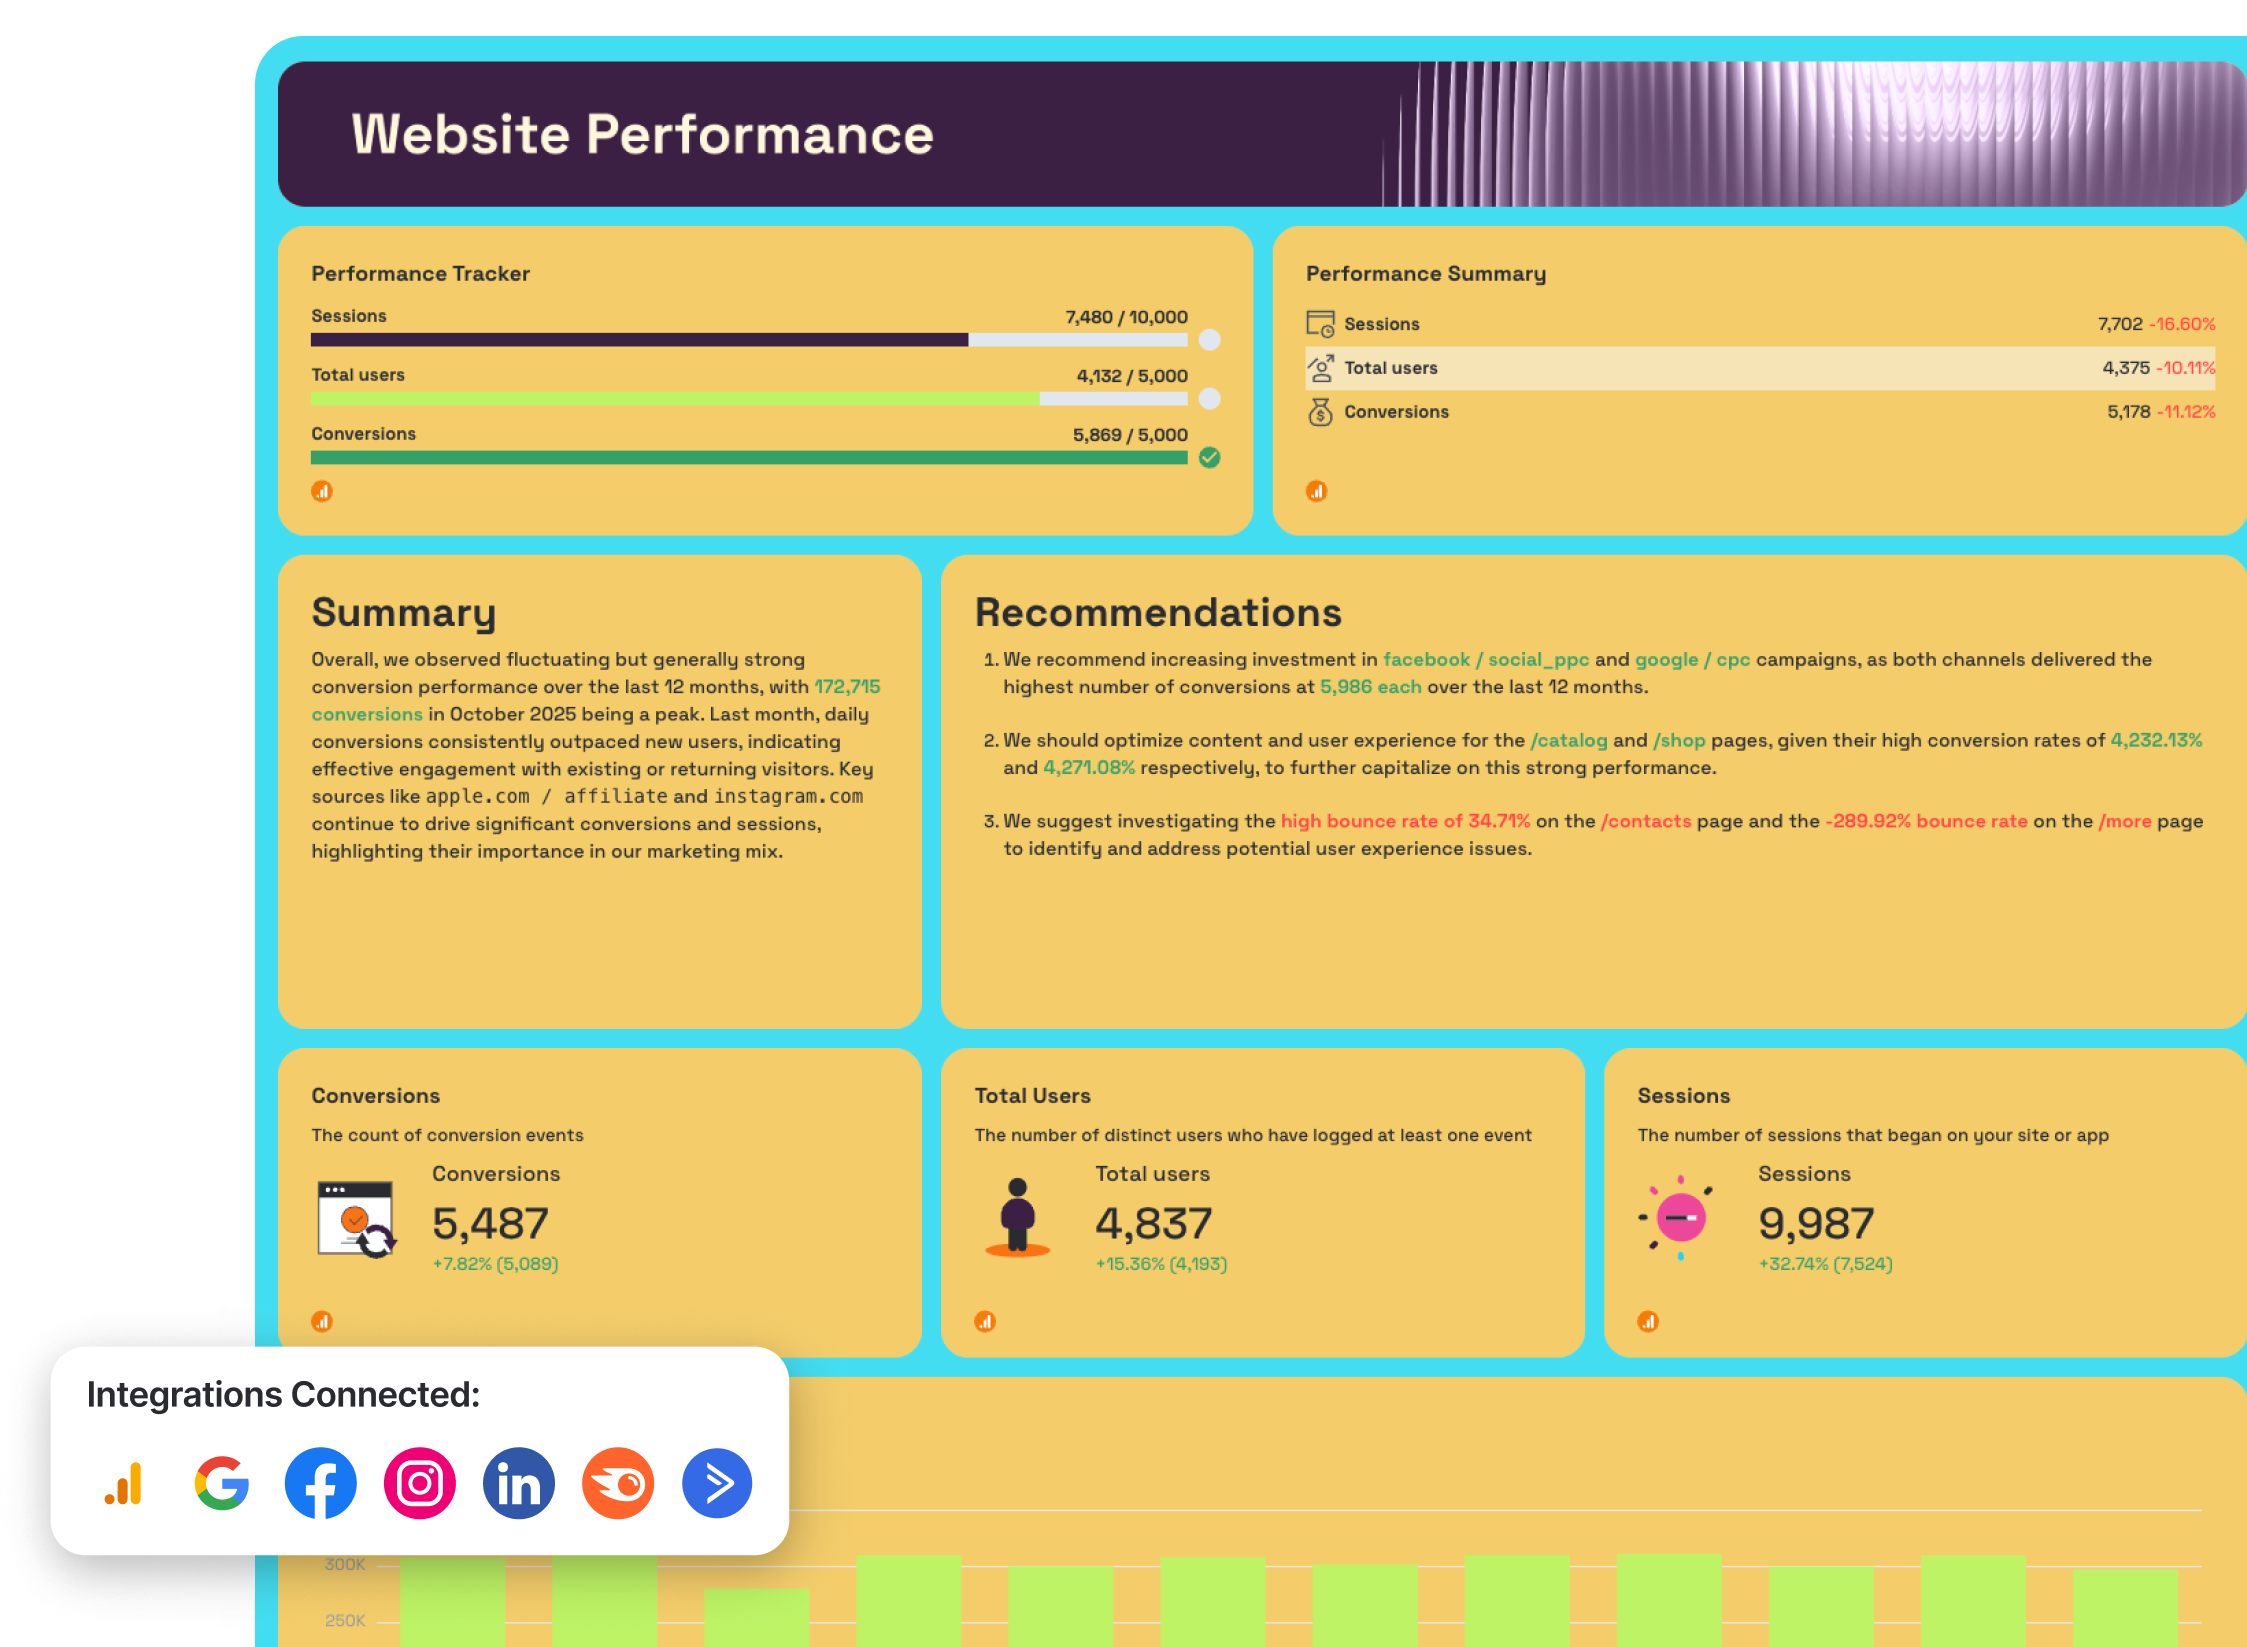
Questions answered by the dashboard:
- What are the most popular pages on your client’s sites?
- Which of the pages finish with goal completions?
- Which web pages are new visitors hitting first?
- What are the geographical locations of your visitors?
- What is the last set of pages visited by your users before they exit your website?
4. SEO dashboard
You need to know the pages generating quality visits if you intend to prioritize your SEO activities. The SEO report template walks you through the whole process - search query, page, and completion of a goal. It informs you of the exact organic search keywords that are driving quality traffic to your website and provides a complete overview of all your pages.
It is also beneficial to tell you which sites are beneficial to your client and which ones need more improvement.
Moreover, the SEO dashboard displays the pages that impact your website’s organic traffic and domain authority. This, in the end, will be used to determine the conversion rate.
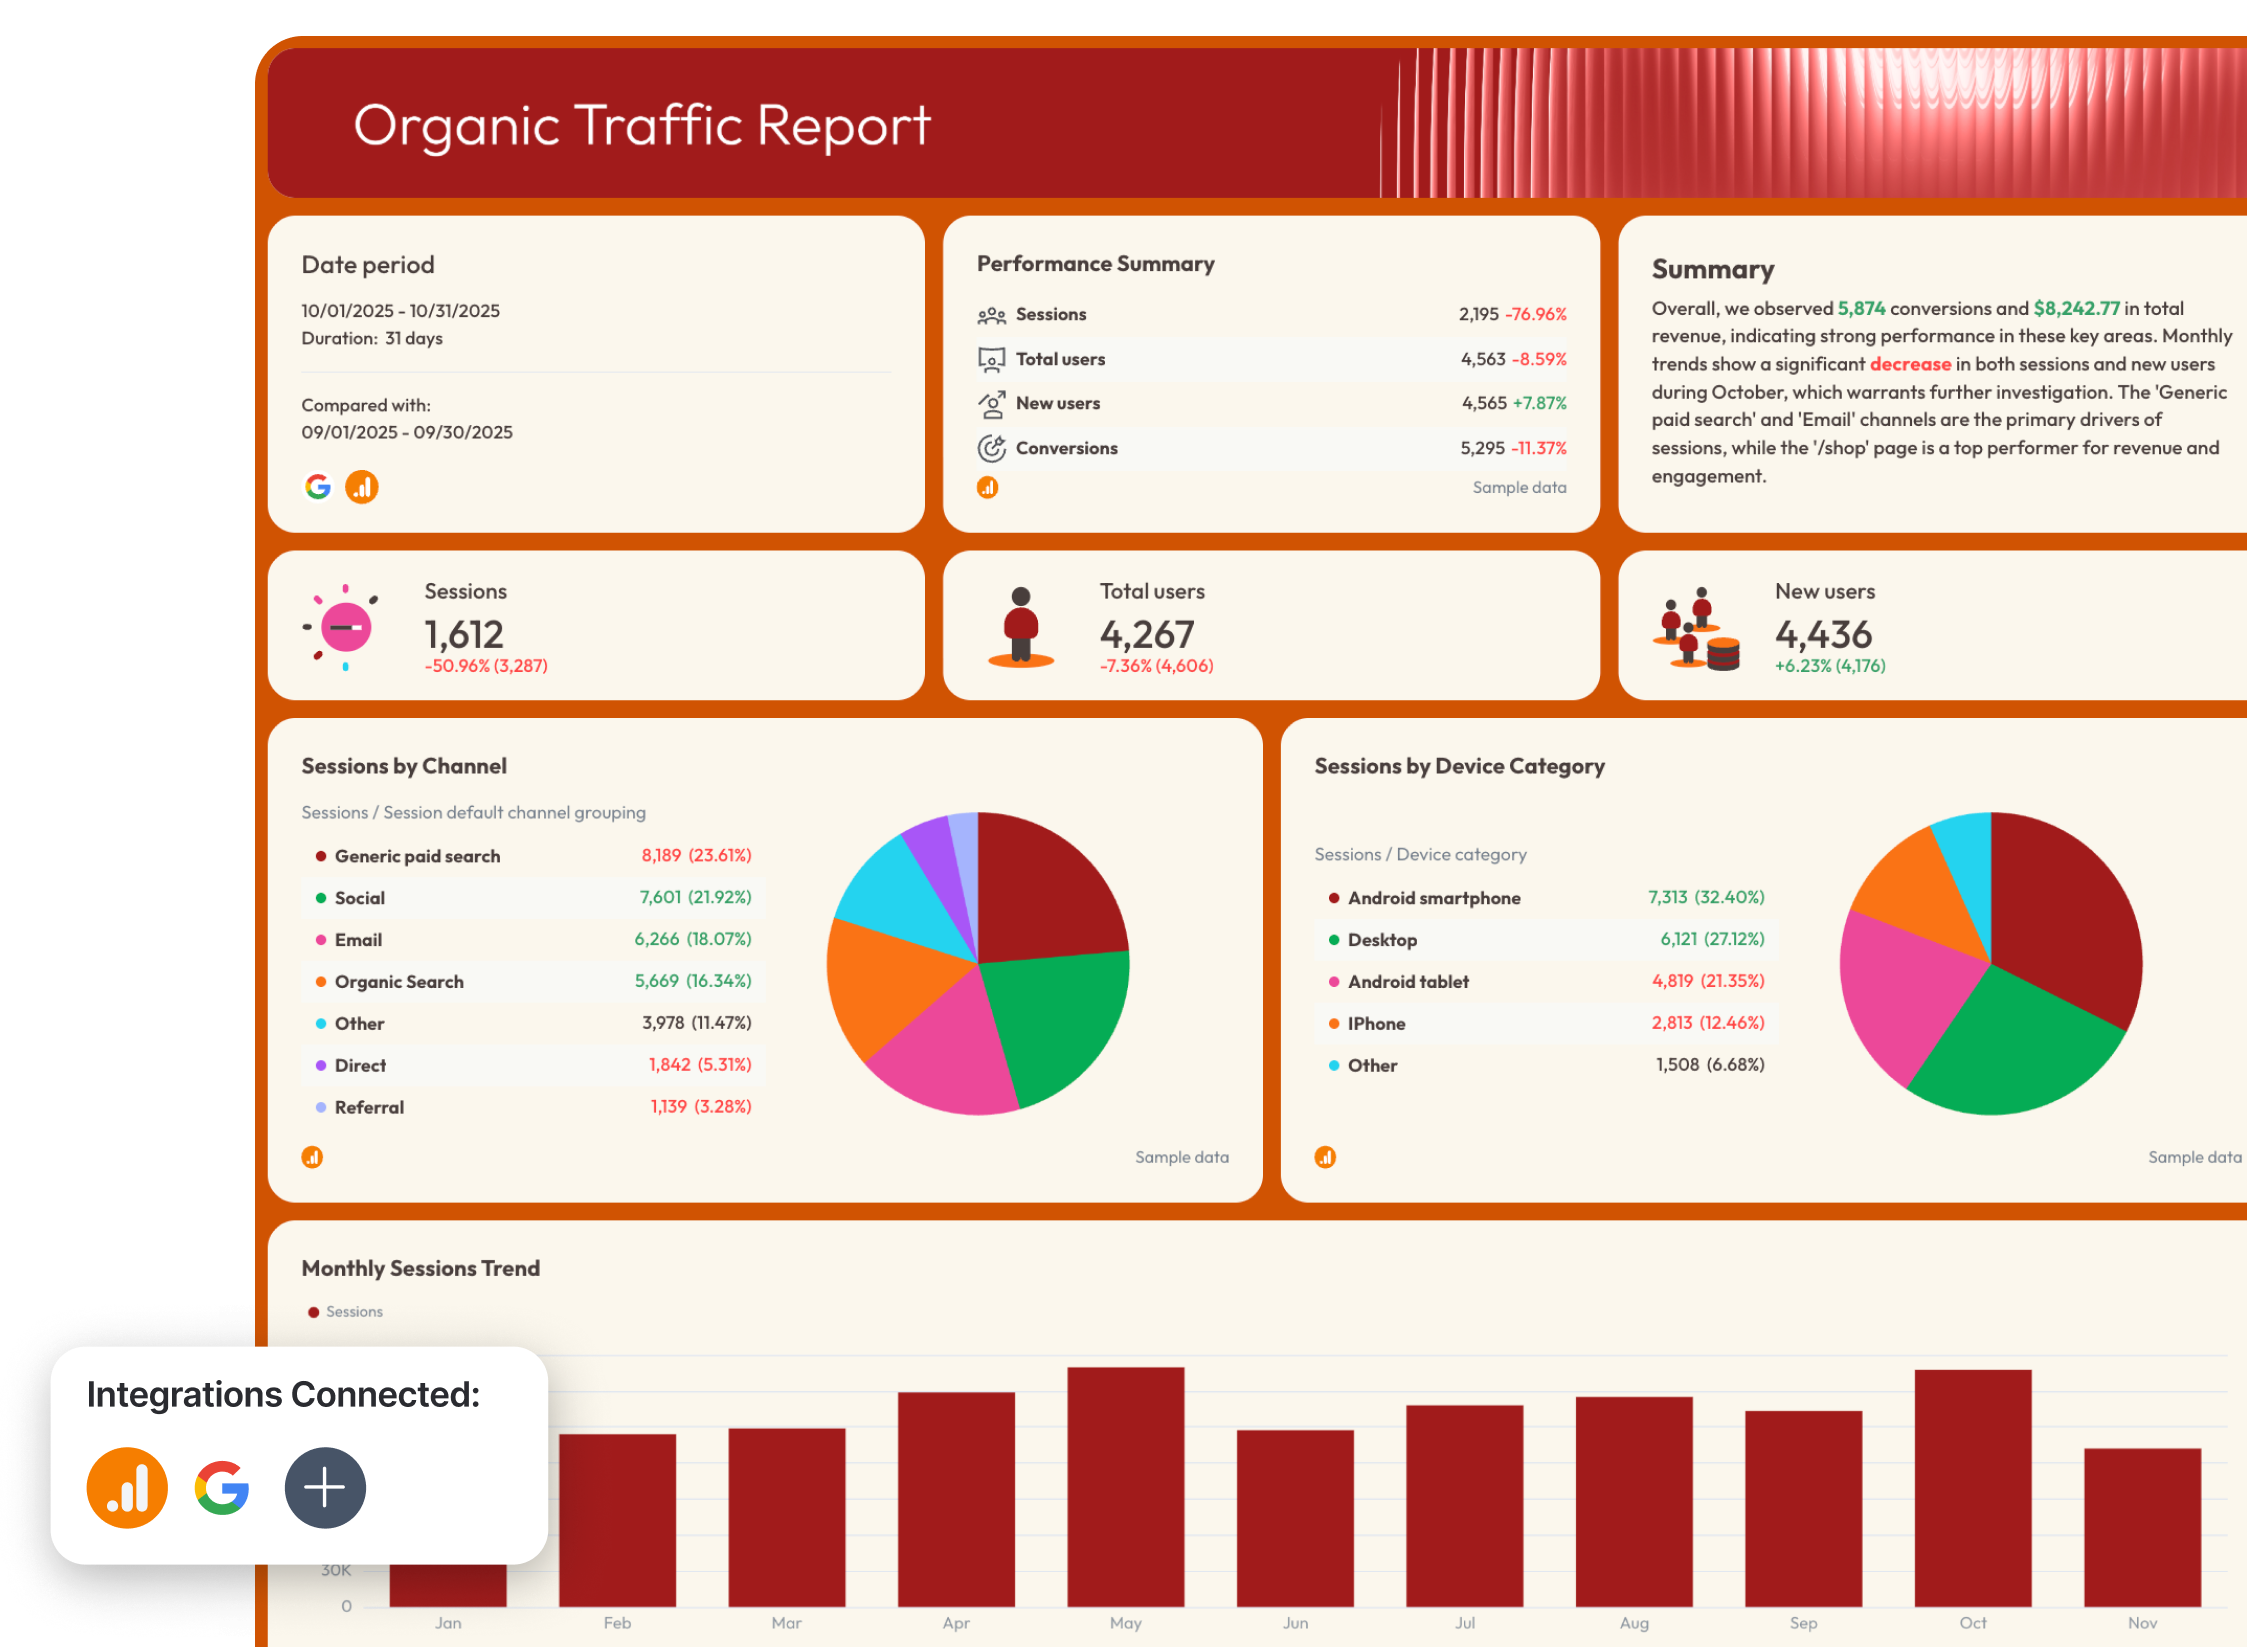 Questions answered by the dashboard:
- Which of your landing pages are generating organic views?
- Which keywords are driving visitors to the website?
- What pages are the most popular in organic search?
- Which of your landing pages have high bounce rates?
Whatagraph’s SEO dashboard allows you to combine data from multiple SEO platforms such as Google Search Console, Ahrefs, Semrush, and SEOMonitor.
5. Social media dashboard
The social media dashboard examines on-site and off-site social activities. You can simply learn which of the social channels is generating quality traffic with no bounces.

Questions answered by the dashboard:
- What proportion of the total visitors comes from social networks?
- Which of the social channels lead to users who complete goals?
- Which social channels drive people that spend more time on your website?
- Which devices get you quality views from social media?
Whatagraph’s social media report template gets updated in real time, so every time your client clicks on the link, they get the most recent data for the selected time frame.
6. eCommerce Dashboard
The eCommerce report template focuses on customer acquisition for online stores or eCommerce. It looks at the purchasing habits of customers through various referral sources. You can learn the touchpoints that are necessary to examine revenue by product.
The most essential thing is to gather data in one place and examine it all at once. You can also compare data at various time intervals and examine how customers interact with your website. Last but not least, assess your efforts in external marketing.
However, when you combine it all into a single Whatagraph dashboard like this, you get a clearer picture:
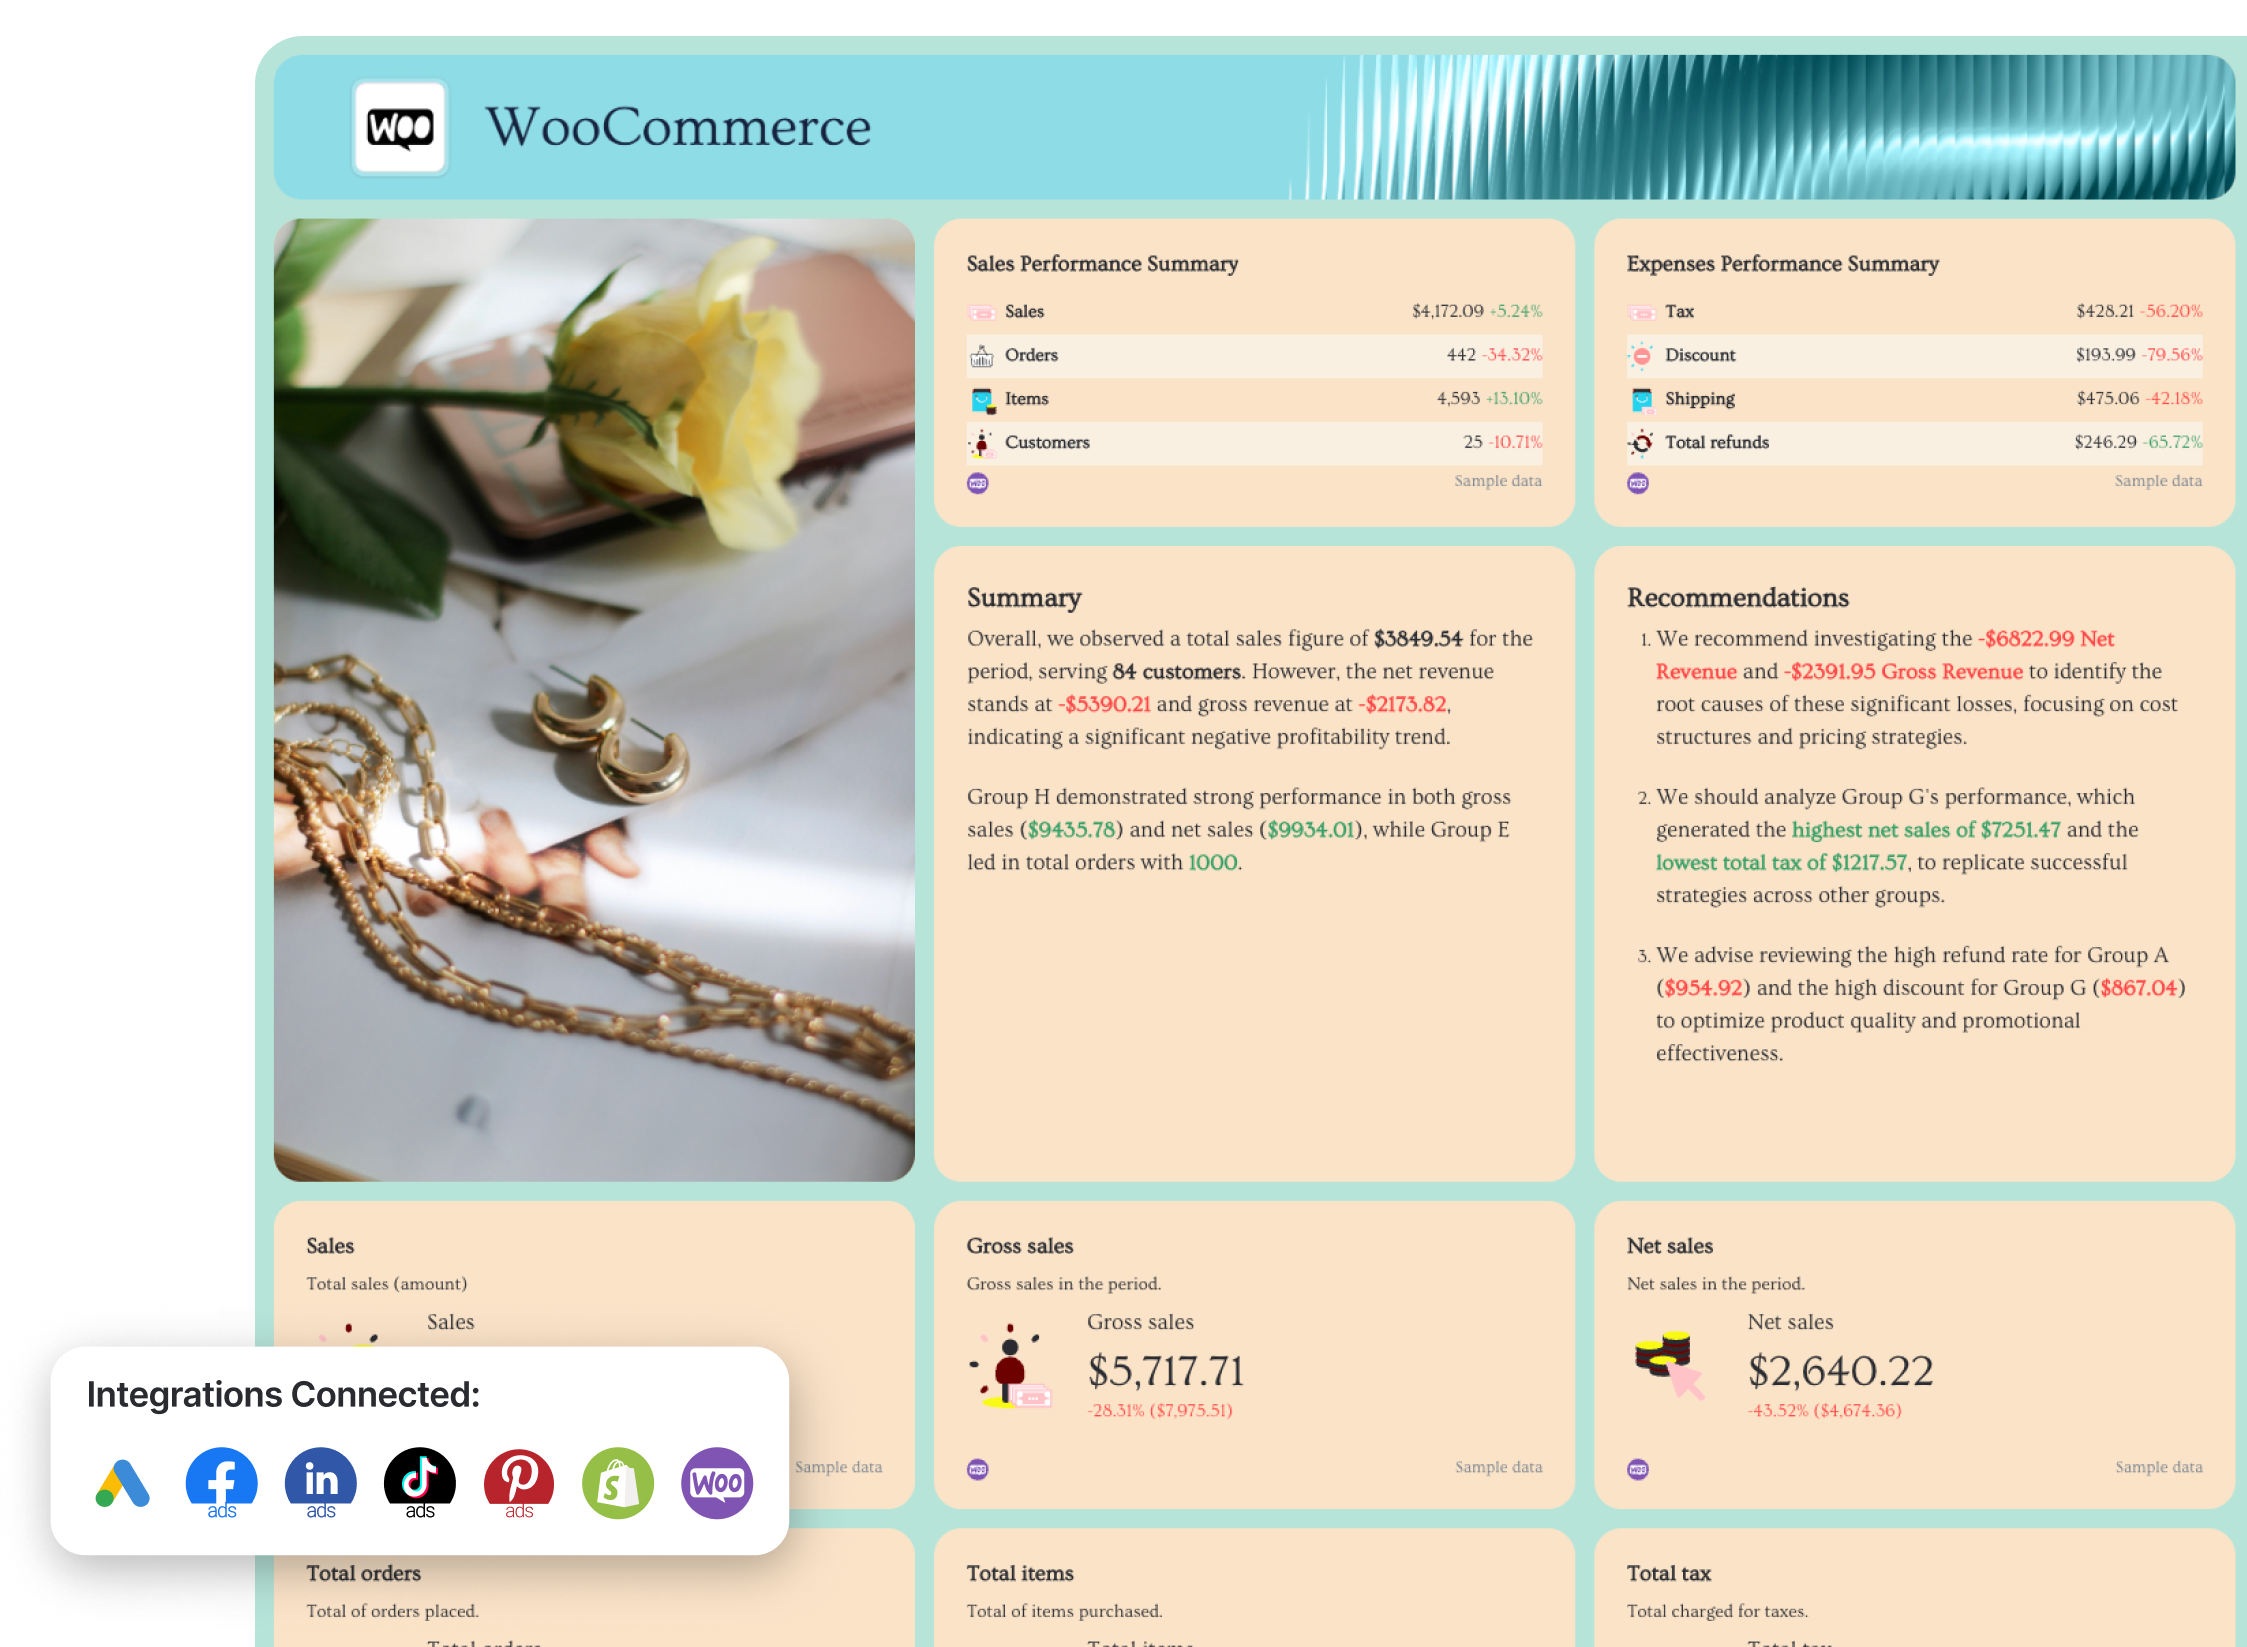 Attempt to consolidate as much information as possible into a single spot. Then, for each KPI, set benchmarks and check which ones you can hit.
That is the definition of analysis. Setting goals to achieve over a period of time is the next step. That's when you start monitoring, which you can accomplish by using the same metrics as you did with goal progression.
Questions answered by this dashboard:
- Which mobile devices do customers use to purchase?
- Which referrals end up in purchases?
- What's the total number of products bought by visitors and what is the total value?
- How can you maximize each visit for profitability?
Final remarks
Keep in mind the following practices when generating dashboards:
- Select a design and background color scheme that is pleasing to the eye.
- Use your dashboard on a regular basis and improve it to get greater outcomes.
- Keep it simple and to the point: present accurate results rather than vanity metrics;
- To look for trends and possibilities, collect as much historical data as possible;
Your dashboard of key performance indicators is designed to assist you in tracking your daily progress. Make it your go-to resource for success!
If you’re looking for a way to create beautiful dashboards with far more features than Google Analytics offers, sign up for a free trial at Whatagraph. You can combine your GA data with multiple sources to create reports your clients love.

WRITTEN BY
Gintaras BaltusevičiusGintaras is an experienced marketing professional who is always eager to explore the most up-to-date issues in data marketing. Having worked as an SEO manager at several companies, he's a valuable addition to the Whatagraph writers' pool.