


What is an Instagram reporting tool?
An Instagram reporting tool helps you pull performance data from ads and organic Instagram posts and present it in a visually pleasing way.
Without one, you need to manually log in to Instagram Insights and piece marketing data together into a slide deck or spreadsheet. While possible, it's extremely ineffective.
For agencies, reporting time adds up fast. The more clients you have, the more hours disappear into pulling screenshots, formatting slides, and writing commentary that should take minutes, not hours.
With an automated Instagram ads reporting tool, you get those hours back. Maatwerk Online, one of the most prestigious agencies in the Netherlands, saved 100 hours a month on reporting after switching to Whatagraph - and put that time back into marketing strategy and client work.
A good Instagram report tool does the heavy lifting for you:
✅ Connects directly to Instagram, both ads and organic, without broken connectors
✅ Standardizes metrics so you're comparing post performance on equal footing
✅ Visualizes data in a way clients actually understand, not just a wall of numbers
✅ Let's you white-label and customize every report, with the KPIs that matter
With Whatagraph IQ, you can take this even further. Instead of manually dragging widgets one by one, you can:
- Ask AI to generate a full Instagram report instantly
- Use IQ Themes to automatically brand reports
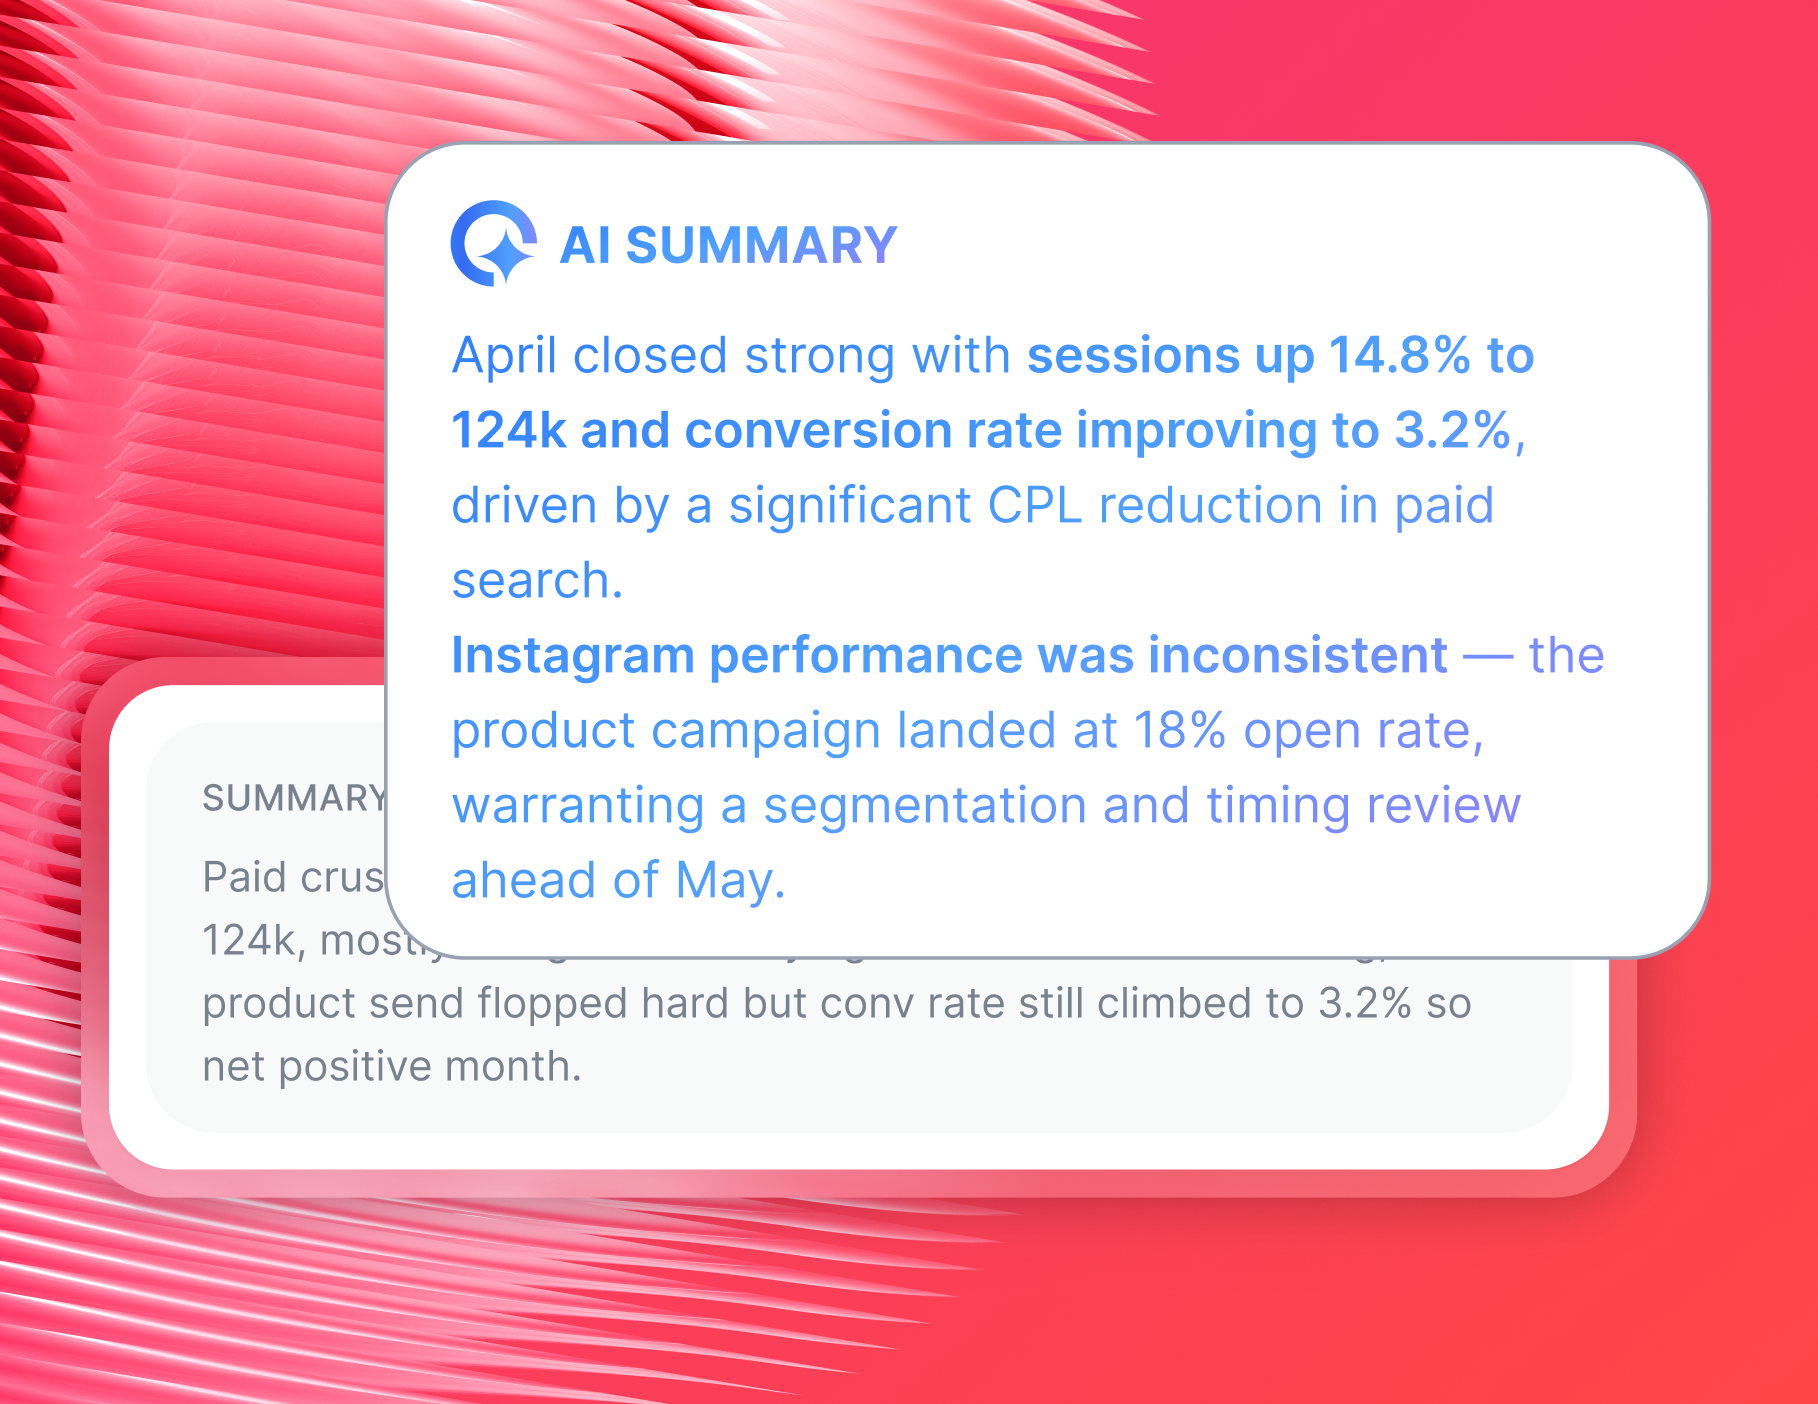
- Get plain-language performance summaries
- Chat directly with IQ to get instant answers about any Instagram campaign
Whatagraph has also launched an MCP that lets you connect your data to Claude or ChatGPT and analyze your data there.
What features should I look for in an Instagram reporting tool?
Not all Instagram reporting tools are built for the same use case. Here are the features you should look out for:
1. Native, stable integrations
If you select an Instagram reporting tool that relies on third-party connectors, you’re setting yourself up for broken dashboards.
Look for a tool with fully managed, native integrations. The data should refresh automatically and always match what you see on Instagram.
At Whatagraph, integrations are fully managed and extremely stable. Instagram data refreshes every 30 minutes, and our uptime has averaged 99.95% over the past 6 months.
No messy third-party connectors. The setup can be done in a few minutes, and your campaign data starts flowing instantly.
2. Ease of use, especially for building and branding reports
You shouldn’t have to be a data engineer to build Instagram reports. The best tools let you build a full, client-ready Instagram performance report in seconds, without touching a single line of code.
Look for:
- AI-powered report generation: Describe what you want, get a finished report
- White-labeling: Your logo, your colors, your domain. Not the tool's branding
- Templates: Ones you can reuse and duplicate across clients
- Simple customization: that doesn't require a designer
With Whatagraph IQ, you don’t need to spend hours building Instagram reports. Just ask our AI to build entire reports from plain text or a screenshot.
3. Cross-channel reporting
Instagram rarely lives in isolation. Your clients are running Facebook Ads, Google Ads, TikTok - and they want to see Instagram in context, not siloed in its own report.
A strong Instagram report tool lets you blend Instagram data with other channels into one unified view, so you can answer the question clients actually ask: "Is Instagram pulling its weight compared to everything else we're running?"
4. AI-powered insights and summaries
Charts are good at explaining what happened. But insights explain what it means. With the best tools, you can use AI to generate performance summaries that give every number the context it needs.
As Janet Mesh, CEO & Co-Founder at Aimtal, puts it:
One of the biggest mistakes that marketers make when creating reports is just adding screenshots of performance charts without any context or analysis.
With Whatagraph IQ, you can ask questions about your Instagram campaign performance directly and get instant answers.
Or, you can auto-generate summaries that are ready to send to clients with minimal editing.
5. Responsive customer support
No matter how good the tool is, you'll eventually need help — especially when migrating from another platform or onboarding a new client. Make sure the tool you choose comes with real support, not just a knowledge base.
Whatagraph includes live chat support and a dedicated Customer Success Manager on all pricing plans. You’ll get help with everything from connecting data sources to building your first Instagram report template.
What are the best tools for generating Instagram performance reports?
Not all Instagram reporting tools are created equal. Here are the three best-rated options right now.
1. Whatagraph
Here's what makes Whatagraph stand out for Instagram reporting:
- Generate full reports from a prompt: Tell what you need, and IQ builds the entire report - widgets, metrics, layouts, and all in seconds
- Auto-brand for every client: Upload a logo or brandbook screenshot, and IQ applies matching colors, fonts, and icons automatically
- Native Instagram integration: Pulls both ads and organic data reliably, with 30-minute refresh intervals and no third-party connectors
- AI summaries and IQ Chat: Ask questions about Instagram performance, and get instant answers. Copy these answers directly into your Instagram reports.
- Cross-channel reporting: Combine Instagram data with Facebook Ads, Google Ads, TikTok, and 60+ other integrations in one unified report
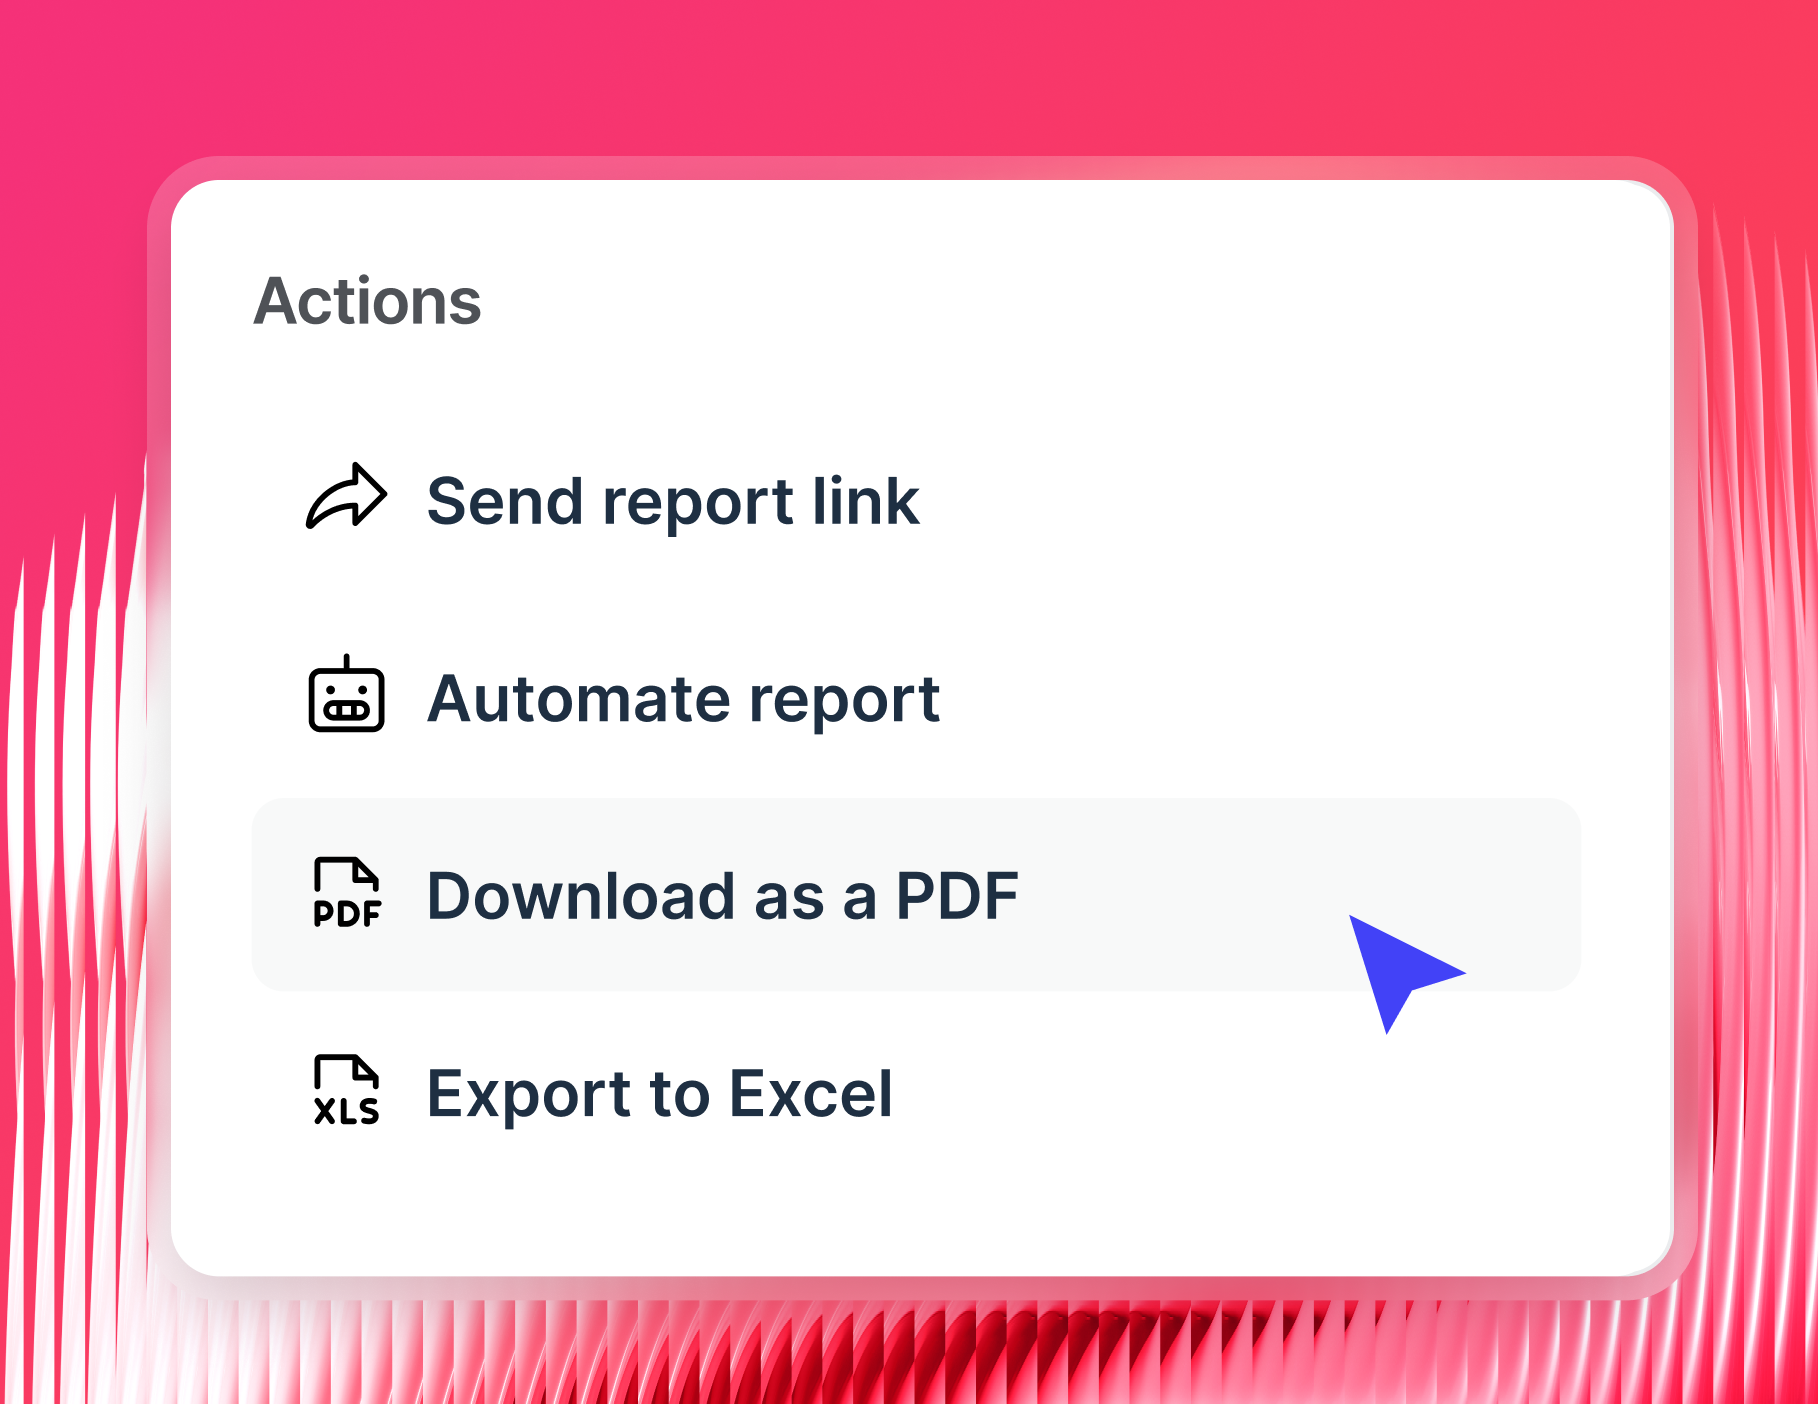
- Flexible delivery: Automated emails, Slack notifications, live links, PDF/CSV exports, BigQuery, and Looker Studio
Agencies using Whatagraph don't just save time on Instagram reporting - they get time back to do the work that actually grows their clients' businesses.
Peak Seven, a Florida-based agency managing 25 clients across 100+ ad campaigns, cut their report build time from 4 hours to 1.5 hours per report - and saved $9,450 per month in reporting costs. Read the full case study here.
Whatagraph is now our Bible, both for our clients and internal teams. With Looker Studio, everything was muddled. But Whatagraph has opened up transparency and communication. - Kim Strickland, Digital Marketing Specialist at Peak Seven
Start free trial with Whatagraph today.
2. AgencyAnalytics
AgencyAnalytics is a client reporting and analytics tool commonly used by marketing agencies to create white-label reports.
It can be suitable if you’re part of a small business and need a simple tool to get started with automated reporting.
With AgencyAnalytics, you can:
- Connect Instagram alongside other social and paid channels
- White-label across dashboards, reports, and mobile app
- Add custom metrics and goals on higher-tier plans
But you should know: Users say the platform can be unstable with sources disconnecting. Plus, it doesn’t come with advanced data calculations, and its AI features are limited.
3. Databox
Databox is suitable if you need to visualize Instagram metrics and track basic KPIs. Alongside Instagram, it connects to 120+ other platforms for cross-channel insights.
Databox lets you:
- Build Instagram reporting dashboards using drag-and-drop widgets
- Monitor metrics like reach, engagement rate, and follower growth
- Use pre-built Instagram dashboard templates to get up and running quickly
- Set goals and track progress against targets
As a drawback, some users report that the dashboards won’t refresh at a fast pace from time to time.
Meanwhile, Databox alternatives, like Whatagraph, refresh Instagram data every 30 minutes automatically — with no manual intervention needed.
Here's proof from a happy customer:
Whatagraph is very, very quick when loading the data. Even when I change a source in the report, it's super quick, and I barely ever have to wait. - Tanja Keglić, Performance Marketing Manager at Achtzehn Grad
3 success stories of agencies using Whatagraph's Instagram reporting tool
If you're wondering what it actually looks like to move your Instagram reporting to Whatagraph — here are three agencies that did it, and what they got out of it.
1. Peak Seven: 63 hours saved per month on reporting
Challenges
Peak Seven was using Looker Studio with Funnel and Supermetrics to report on 25 clients across 100+ ad campaigns. Data frequently failed to pull through correctly, and Kim spent more time triple-checking numbers against source platforms than actually analyzing performance. Building a single report from scratch took 40 hours.
"Looker Studio was slow and always breaking. The data wouldn't pull through, or it would pull through incorrectly. It was frustrating, time-consuming, and a constant guessing game," said Kim Strickland, Digital Marketing Specialist at Peak Seven.
Solution
Kim moved the entire agency to Whatagraph in a matter of hours. She built a master template for franchise clients that could be cloned and updated with new data sources instead of being rebuilt from scratch each time.
Results
- 63 hours saved per month on reporting
- $9,450 saved per month for clients on reporting costs
- Report build time dropped from 4 hours to 1.5 hours
- Stronger client relationships and improved retention
2. Swash Labs: Reporting time cut from 40 hours to 4 hours per month
Challenges
Before Whatagraph, Swash Labs was pulling data from multiple sources into spreadsheets, a process that was tedious and eating up time that should have been spent on strategy.
The Art department had to spend additional hours polishing each report just to make it presentable, with reports taking up to 2-3 hours to complete. Disconnected data sources and a fragmented tech stack made everything harder than it needed to be.
"We're now able to spend more time analyzing rather than cleaning data thanks to the connected sources," said Stephanie Delk, Director of Media & Planning at Swash Labs.
Solution
Swash Labs switched to Whatagraph and replaced spreadsheets and Google Data Studio with a single, unified platform.
Direct source connections eliminated manual data pulling entirely, while customizable templates and a user-friendly report builder cut reporting time dramatically. Creating a new report went from a full-day ordeal to under an hour.
Results
- Reporting time cut from 40 hours to 4 hours per month
- 36 hours saved per month across the team
- Improved client reporting with visuals that made performance easy to understand
- Monthly Co-Lab sessions with clients became sharper and more productive
3. Maatwerk Online: 100 hours saved per month on reporting
The challenge
Maatwerk Online was running Supermetrics and Looker Studio to report on 100+ clients. Dashboards took forever to load, connectors broke without warning, and reports were bloated with metrics nobody actually looked at.
"Looker Studio was really slow. We used Supermetrics to connect our channels, but sometimes they would just break. Tables didn't load when you tried to refresh the dashboard. It was really annoying." - Lars Maat, Co-Founder at Maatwerk Online
The solution
The team switched to Whatagraph and built four pillar reporting templates, covering:
- eCommerce
- Leadgen
- Branding
- B2B
Each client gets a fully branded live dashboard with goal bars showing targets and current performance.
The results
- 100 hours saved per month on reporting
- €4,000 saved per year by eliminating Supermetrics
- 100% of the reporting tool cost recovered through client licensing fees
Whatagraph saves time and energy, and the hours we're saving are just pure profit. We now have the time to focus on more strategic things that help both our agency and our clients grow. - Lars Maat, Co-Founder at Maatwerk Online
How to automate Instagram reporting using Whatagraph's Instagram report generator
Automating your Instagram reporting doesn't have to mean jumping between platforms, screenshotting data, or manually updating a deck before every client call.
With Whatagraph's Instagram report generator, you can go from data connection to client-ready report in under 30 minutes. Here's how:
1. Connect your Instagram data sources
Start by connecting Instagram through Whatagraph's native integration. From your workspace, authenticate your Instagram Business account, and you're done. No complex APIs, no developer help, no third-party connectors.
Want to report on Instagram ads and organic in the same place? Both are supported.
You can also pull data from 60+ other platforms:
- Social media (Meta Ads, Instagram, TikTok, Facebook, LinkedIn, YouTube)
- SEO & analytics (Google Analytics 4, Semrush, Ahrefs, Google Search Console)
- E-commerce (Shopify, WooCommerce, BigCommerce, Magento)
- Email (Mailchimp, Klaviyo, ActiveCampaign, Constant Contact)
- CRM (HubSpot, Salesforce)
With cross-platform reporting, your clients get a full picture alongside their Instagram performance.
Whatagraph's integrations are fully managed - uptime has averaged 99.95% over the past six months. If something goes wrong, our engineers are on it immediately.
2. Blend and organize your data
Once your data is connected, it’s time to clean it up.
Standardize campaign names across clients, unify metrics across channels, and align naming conventions so everything makes sense in one report.
With Whatagraph IQ Dimensions, you don't need formulas or coding to do this. You can ask it to:
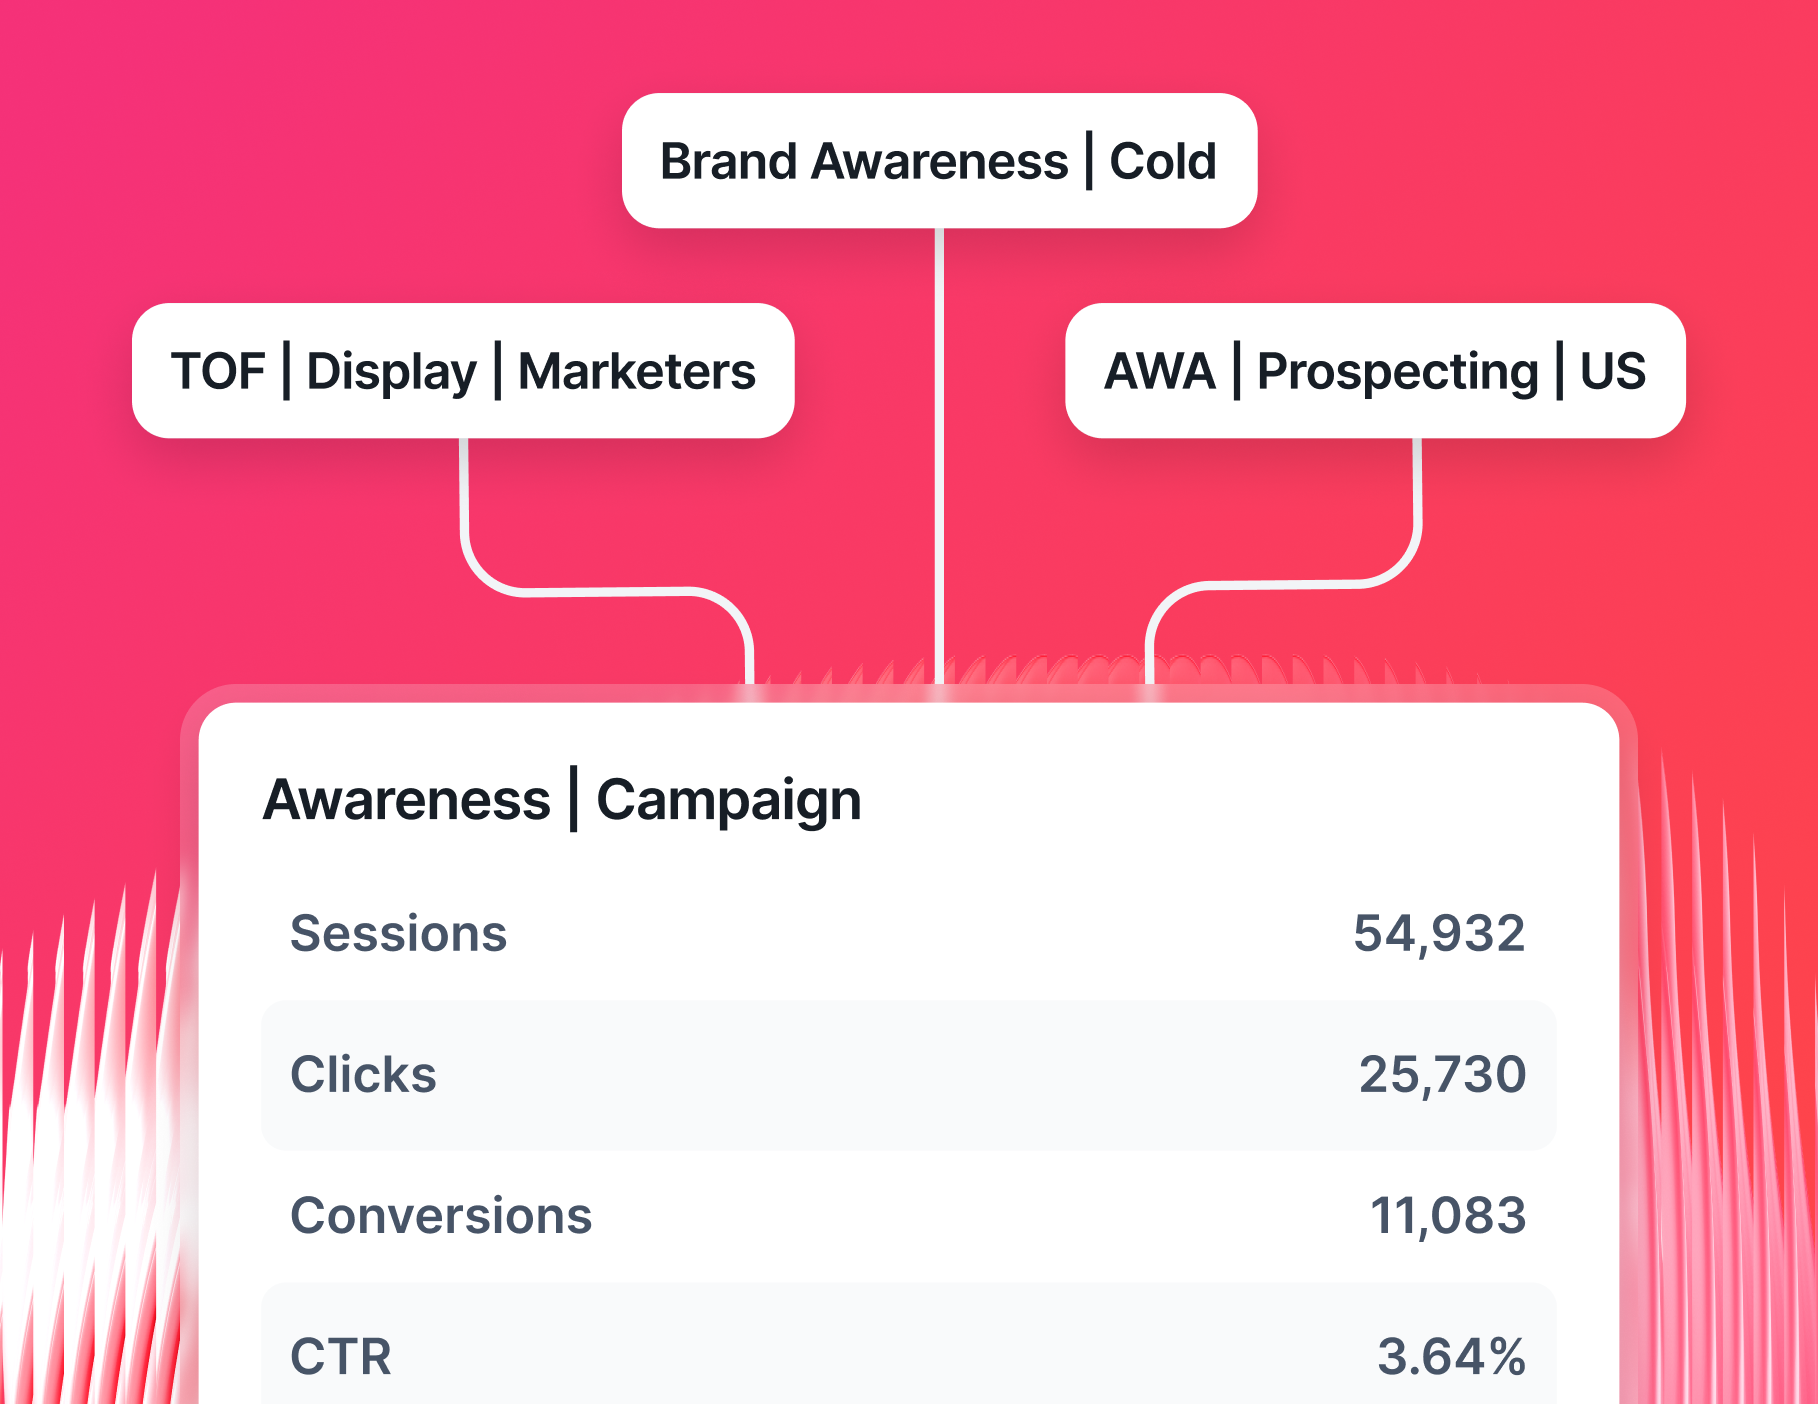
- Create custom blends: Just describe what you need - like "group all Instagram campaigns by campaign type" - and IQ creates the dimension for you.
- Standardize messy naming: Turn "IG_US_SpringSale_23" and "Instagram_Spring23_US" into one clean, consistent label
- Build custom metrics on the fly: Like total cross-channel spend or blended ROAS - without touching a formula
The goal isn't to show every data point you have - it's to show the ones that actually matter to each client.
You can also:
- Blend Instagram data with paid ads, SEO, or email metrics in one unified view
- Filter by client, account manager, region, or campaign type
- Apply tags and folders to keep everything organized at scale
3. Build and brand Instagram reports with AI
This is where Whatagraph IQ does the heavy lifting. Instead of dragging and dropping widgets one by one, just type what you need.
"Create an Instagram monthly report template for a client," or “Create an Instagram report for clients X and Y,” and IQ assembles the full report: Instagram performance metrics, charts, tabs, and layout included.
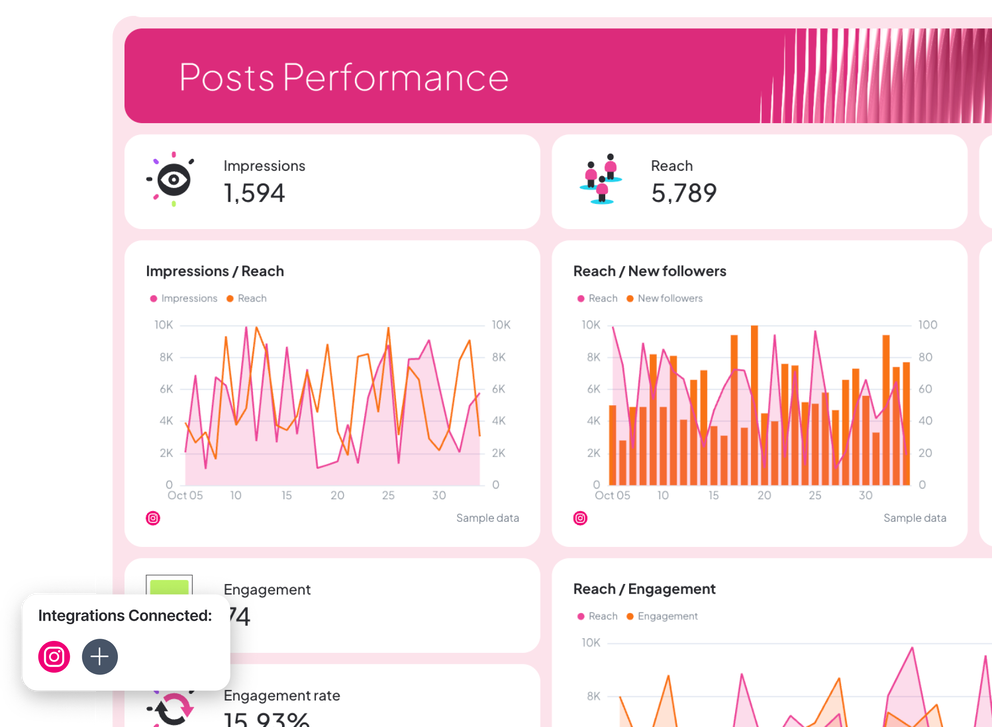
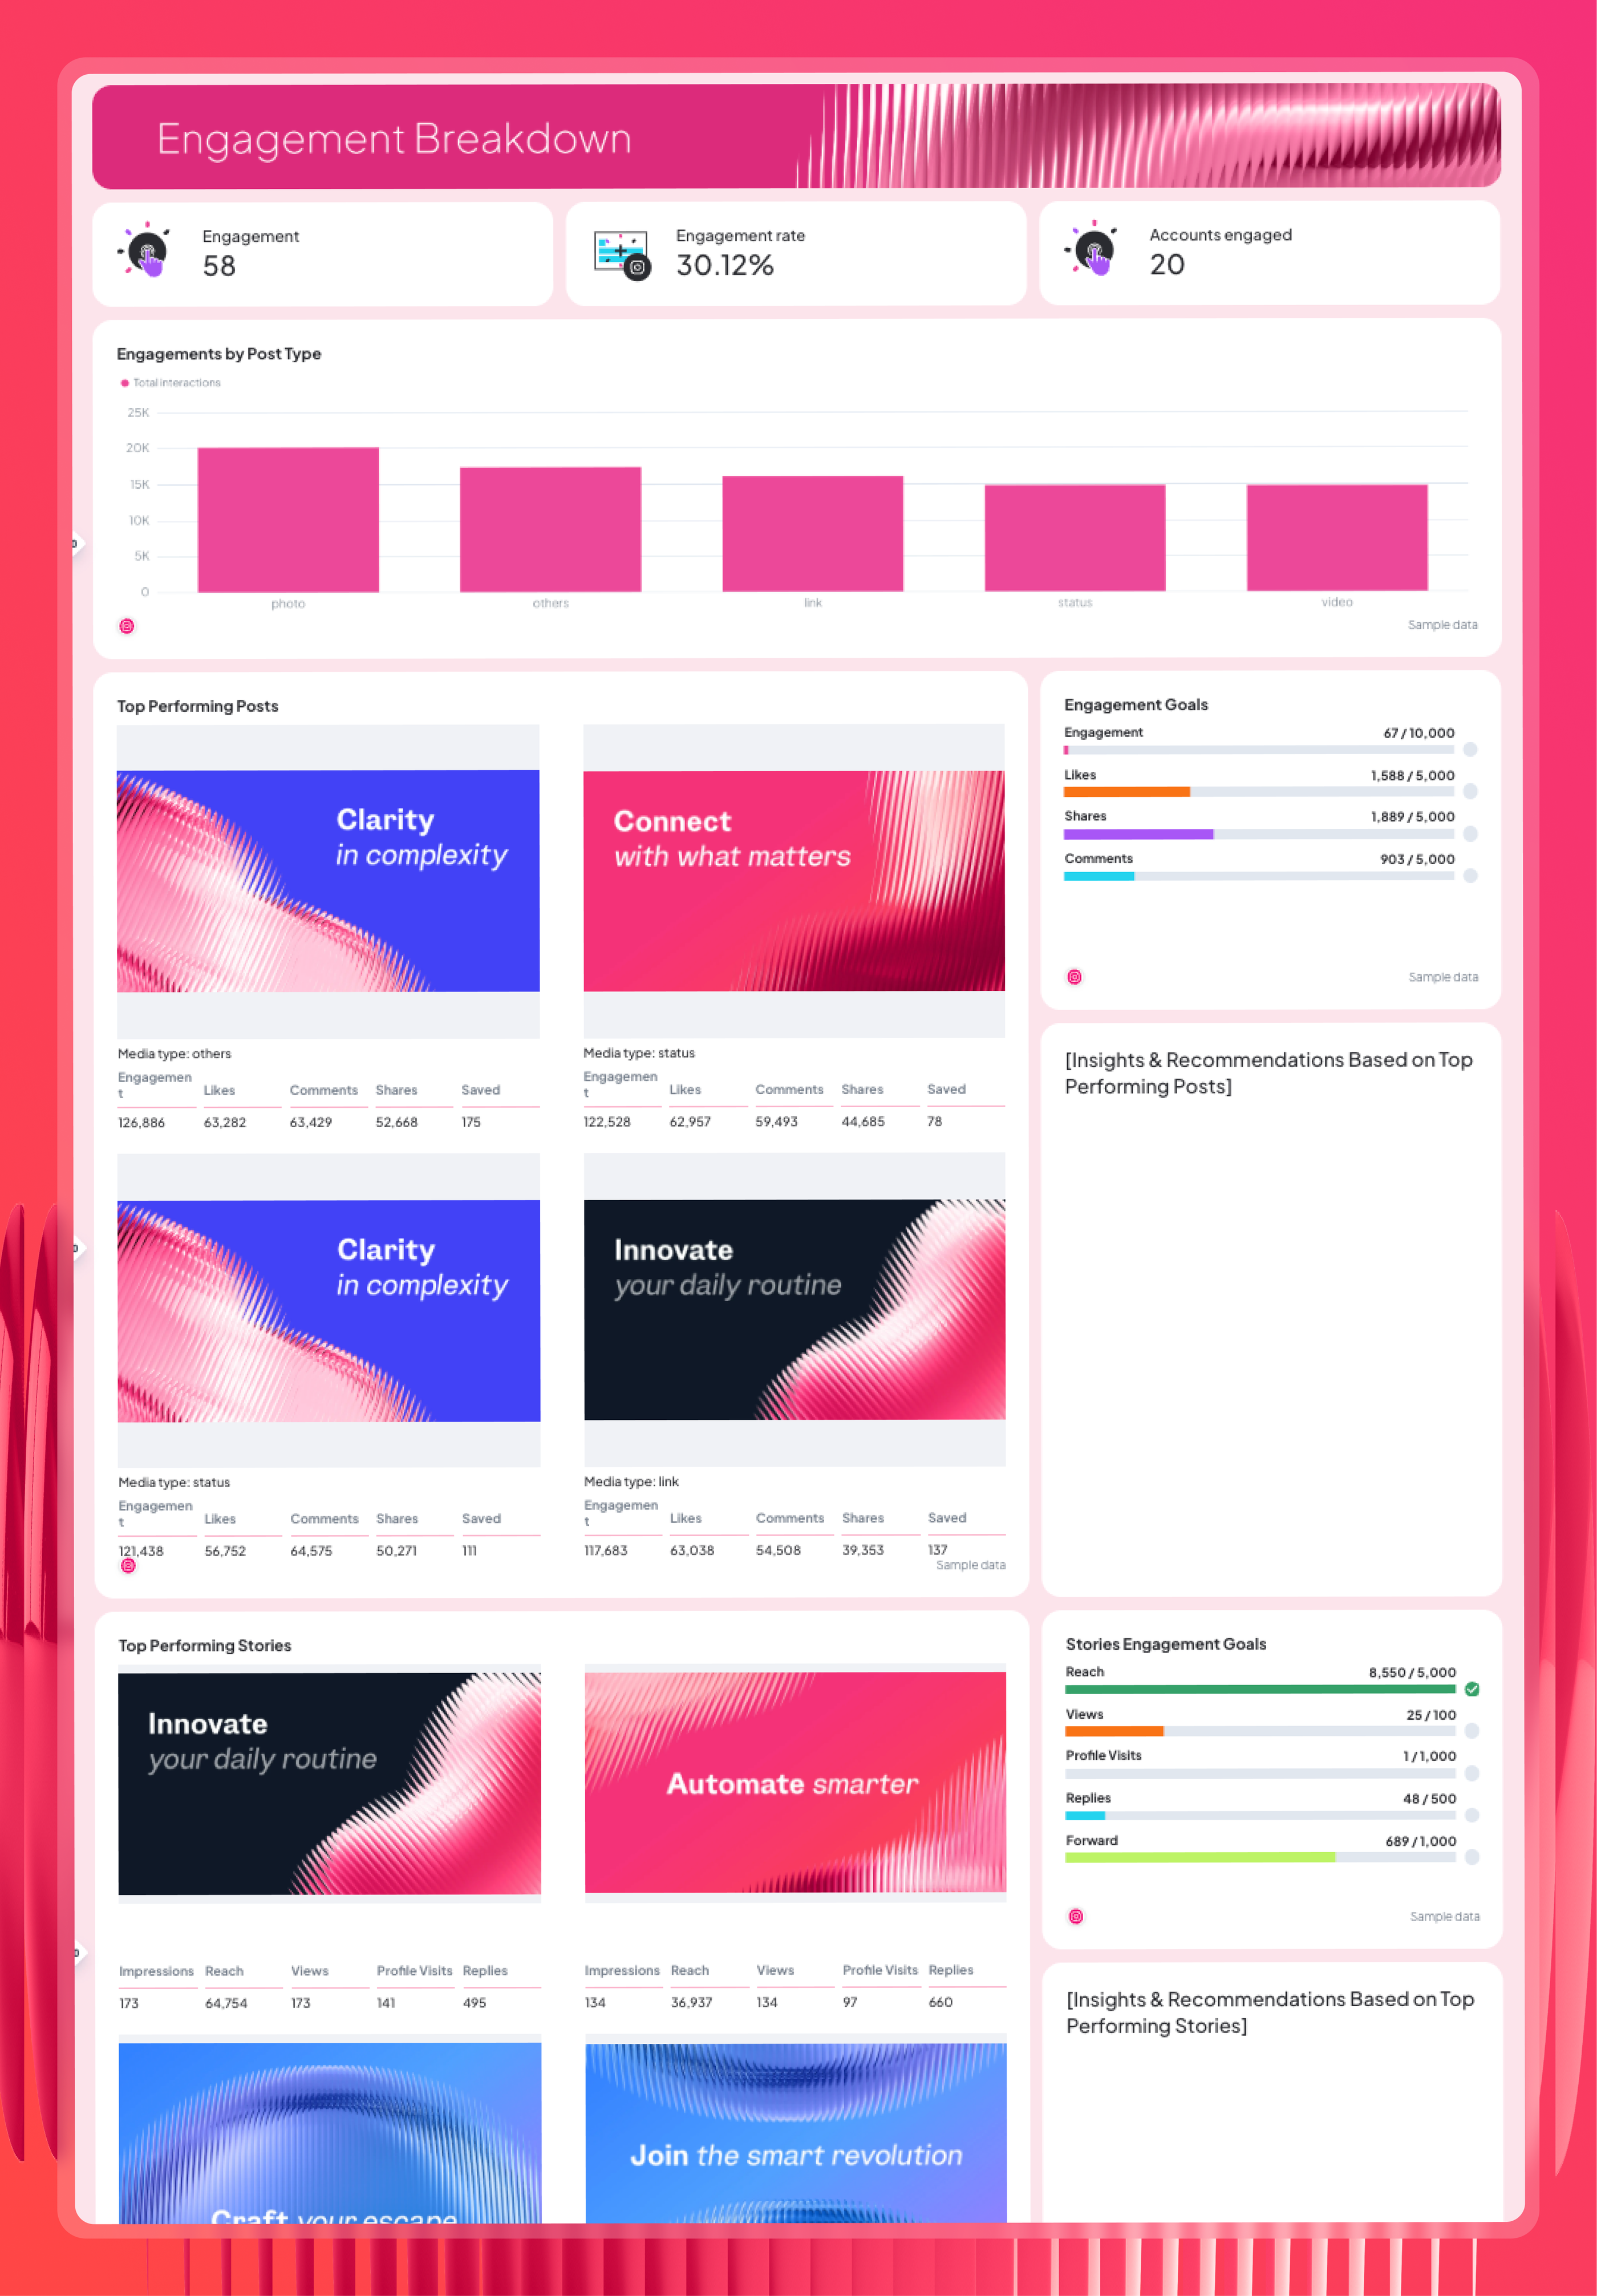
Here’s an example of an Instagram analytics report template created on Whatagraph:
You can also ask Whatagraph IQ to:
- Explain results: IQ reads the data on your report and writes a plain-language performance summary (wins, issues, and recommendations included).
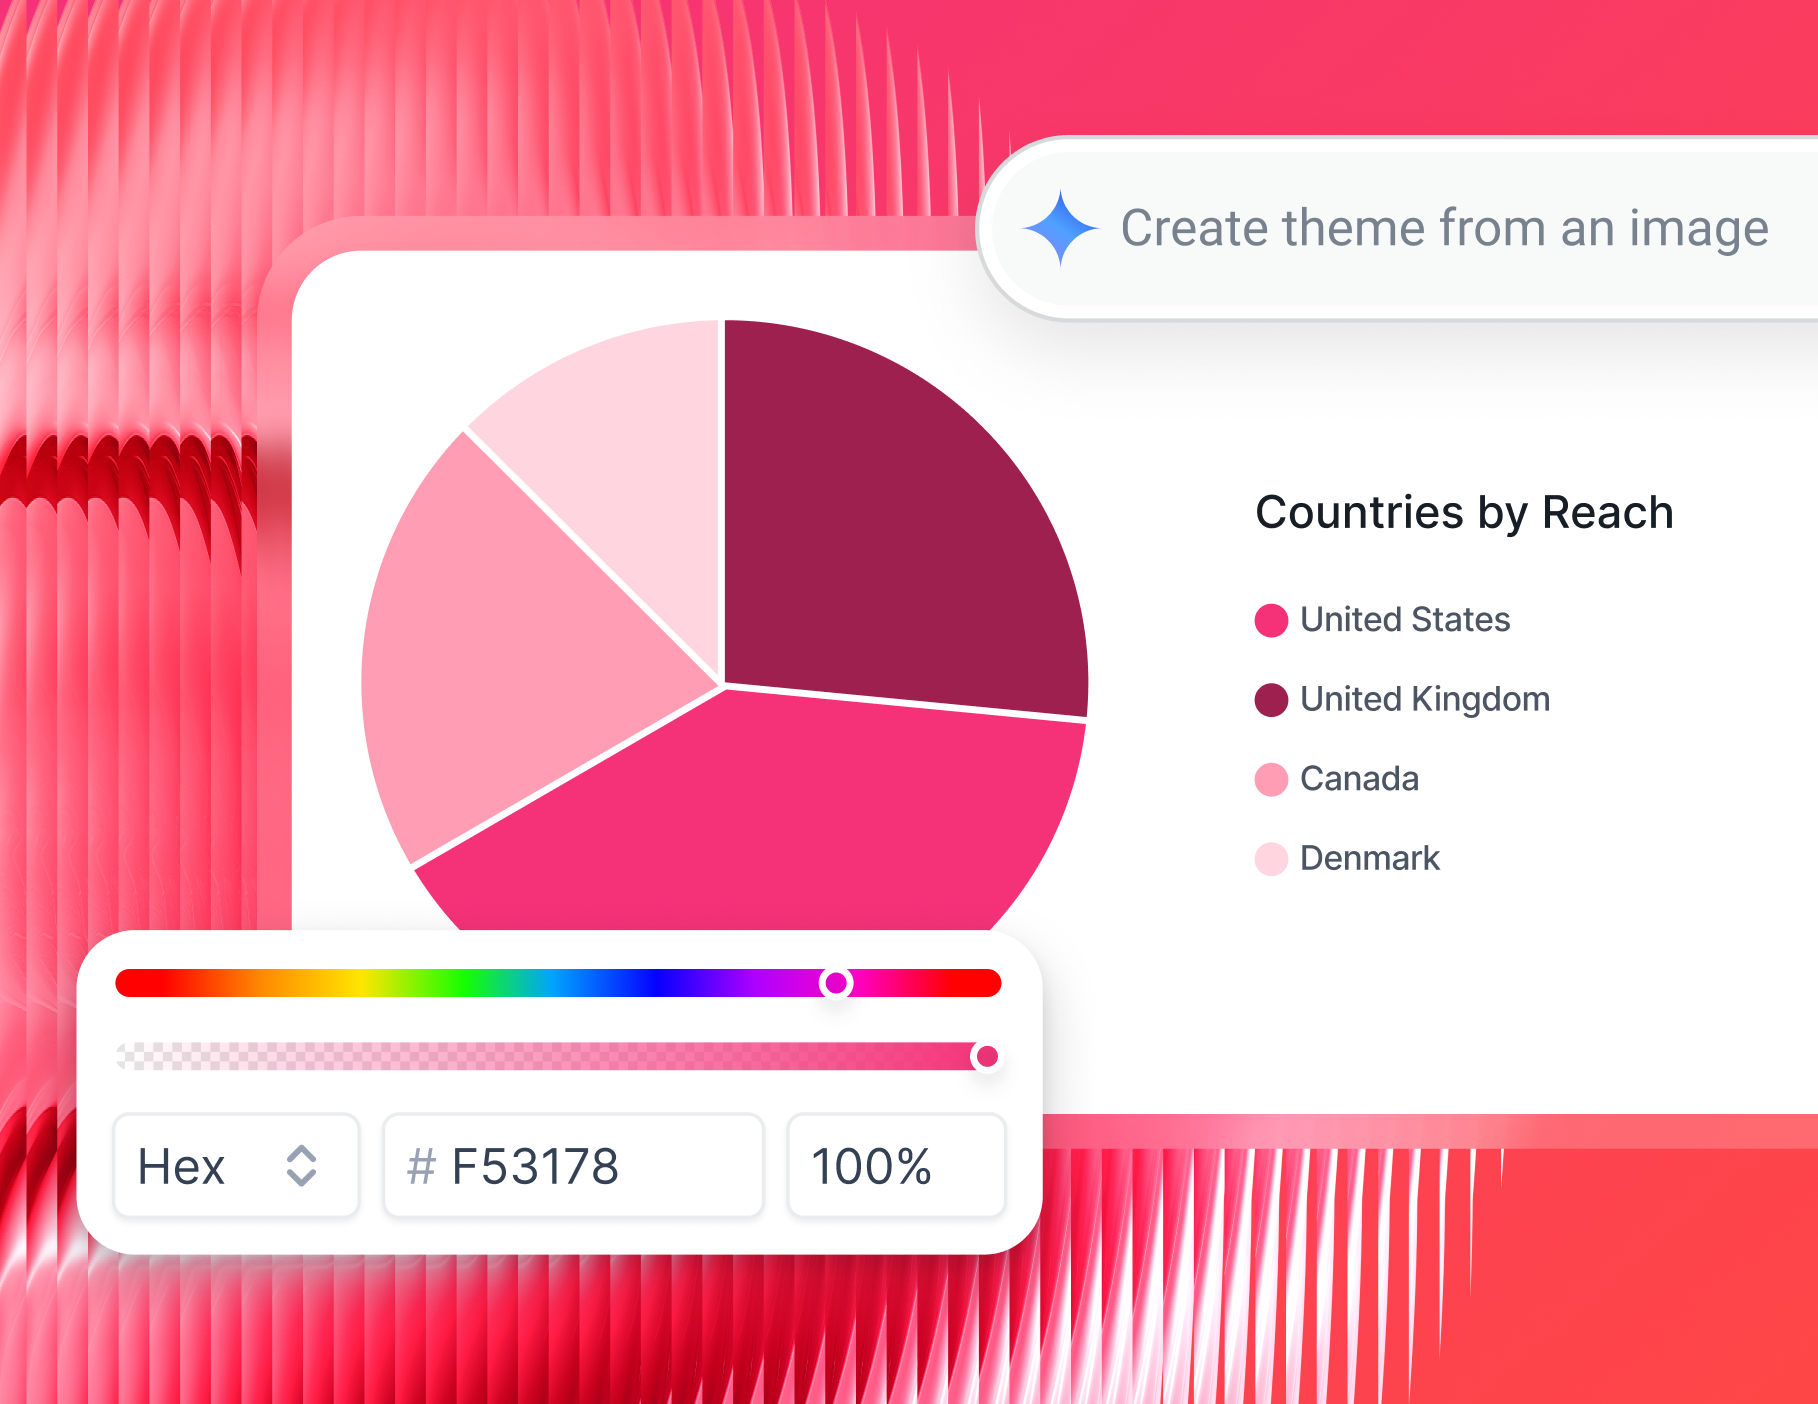
- Style it automatically: Upload a client logo or image, and IQ automatically generates a matching visual style: fonts, colors, and icons.
A clean, well-branded report builds credibility before the client reads a single number.
I recommend making your reports pretty. Use consistent colors that match your brand. Add white space. Make your fonts readable. Design matters because decision-makers will judge your data by its cover before they ever consider its content. - Michael Keenan, Principal at Peak
Need full control? Start from a blank canvas and build it yourself with drag-and-drop widgets.
With every widget, you can adjust labels, apply custom formulas, set reporting periods, and match color schemes to each client's branding.
Pro tip: Save reports as linked Instagram ads report templates. Edit the master once, and every client report tied to it updates automatically — no manual changes across 20 reports.
4. Monitor performance with internal dashboards
Client reports tell the story. Internal dashboards help your team stay on top of it in real time.
Use Whatagraph Overviews to track Instagram KPIs across all your client Instagram accounts in one place.
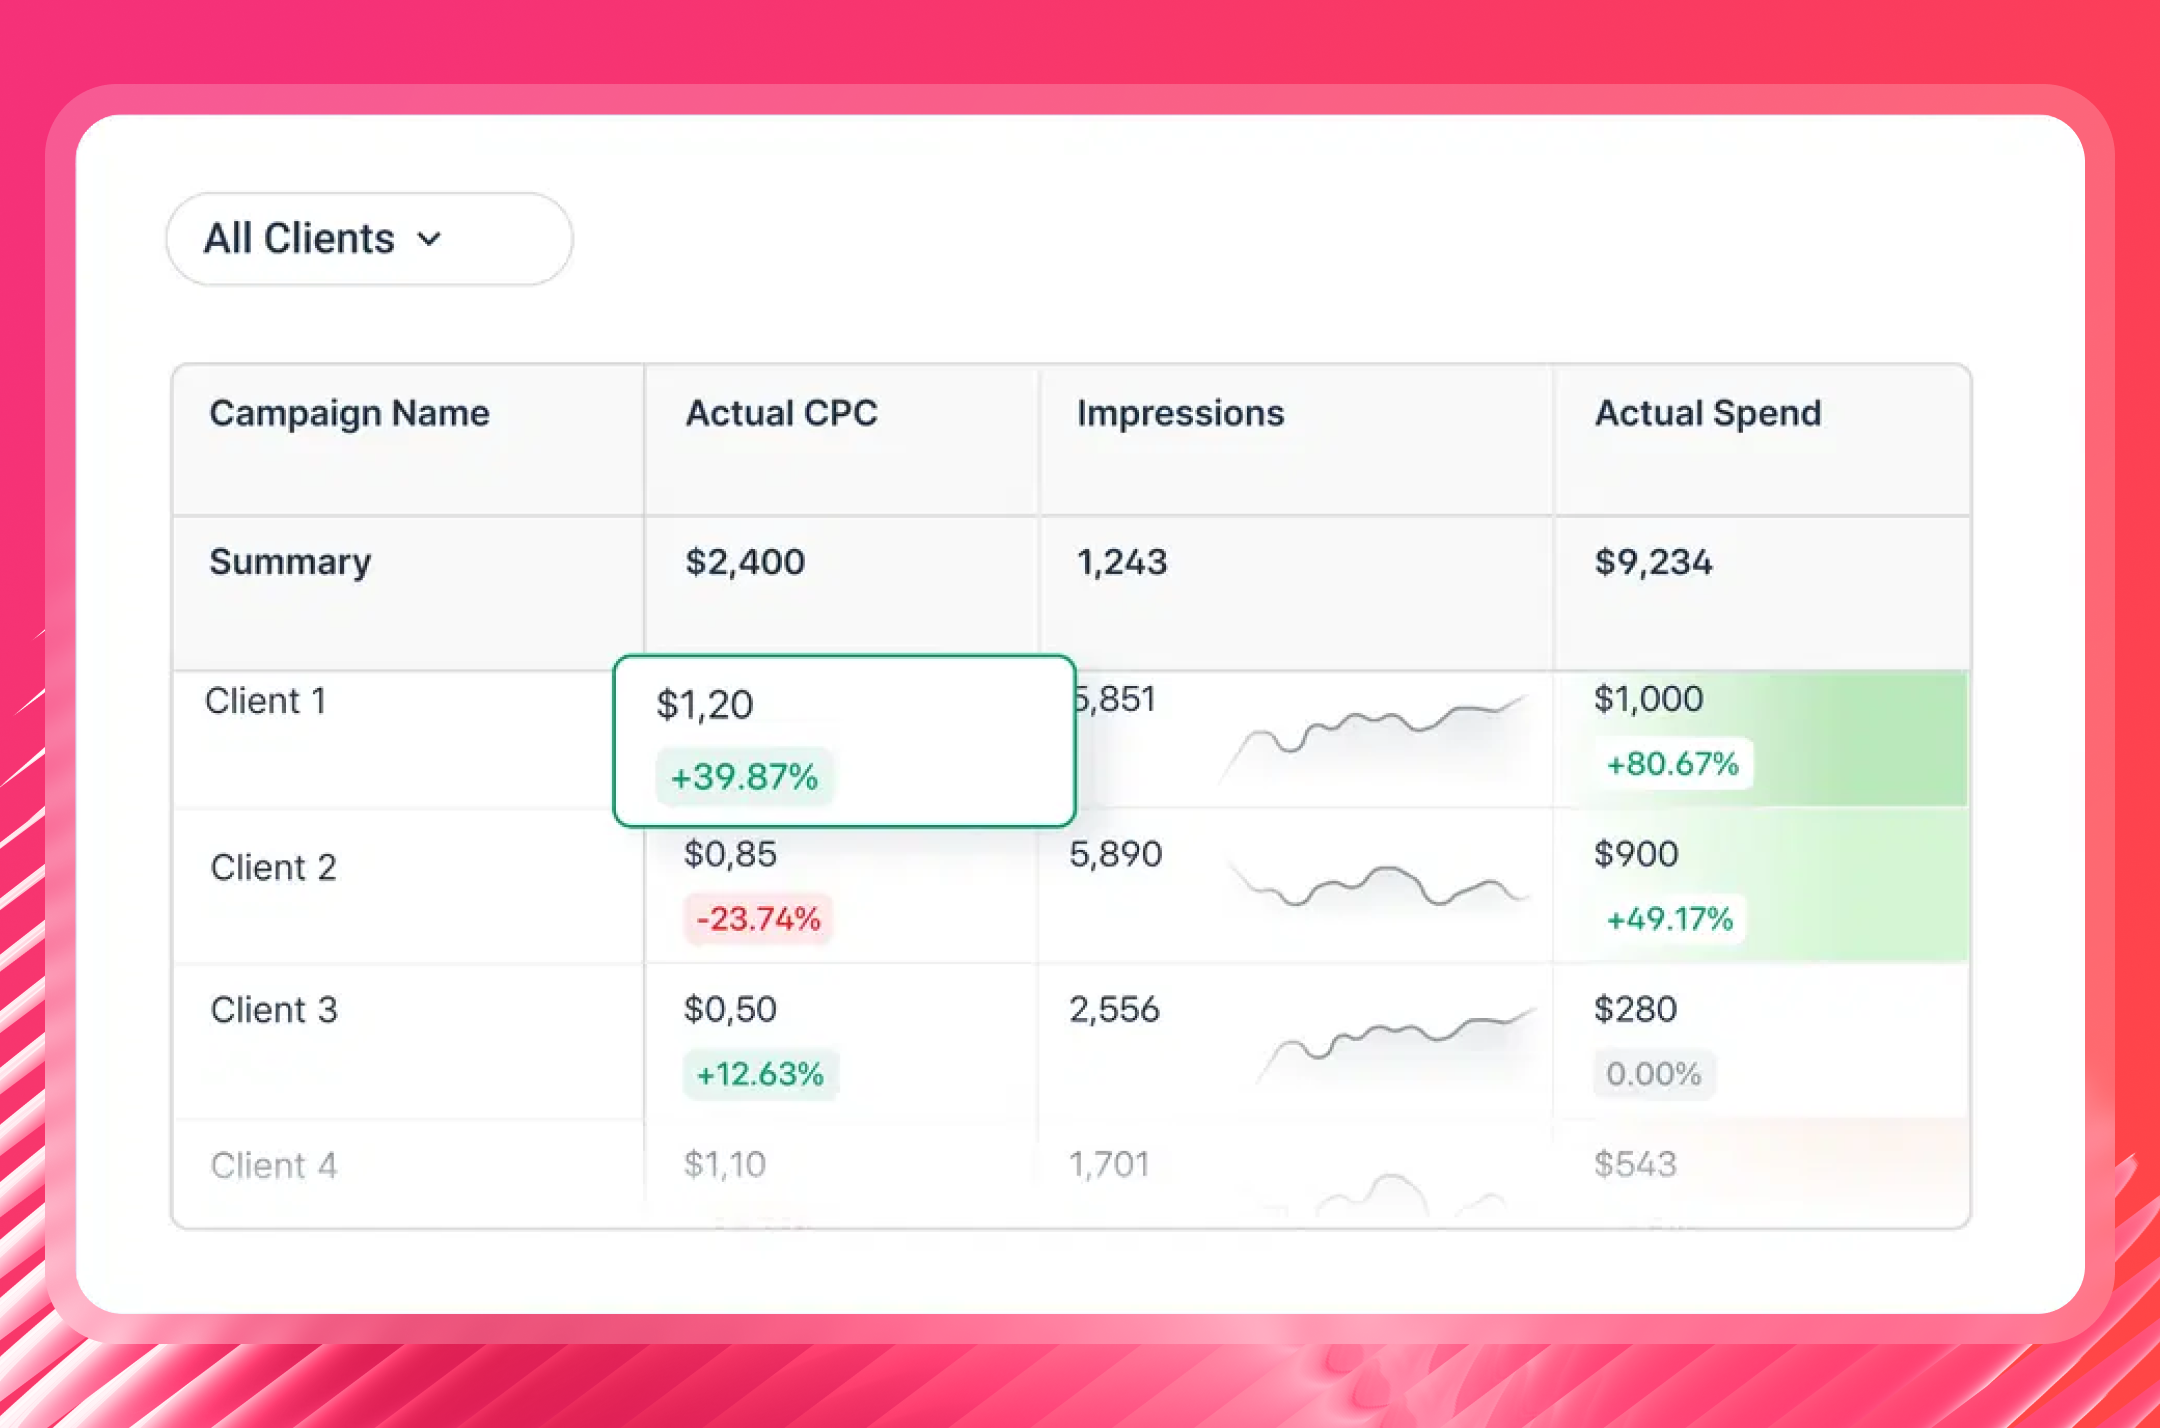
Whatagraph’s Overviews help to:
- Monitor account manager workloads
- See best-performing campaigns & flag underperforming ones
- Set goals and spend caps so nothing slips through the cracks.
Slice by client, channel, region, or manager — whatever fits how your agency operates.
5. Summarize Instagram campaign performance for a client meeting
Before a client call, your account managers shouldn't be spending an hour writing performance commentary from scratch.
With Whatagraph IQ Summaries, you get plain-language performance summaries—based on the actual Instagram analytics data.
You get the freedom to:
- Tweak the tone
- Choose short or long format
- Add your own context for that human touch.
A good Instagram report doesn't just show numbers — it moves people to act. Ryan Anderson, President at Markiserv, recommends structuring every report around these steps:
I like to keep my reports simple. Most leaders will go into the details if they need to, but make sure you're also highlighting the key insights, actions, and recommendations. - Ryan Anderson, President at Markiserv
Your team can also use IQ Chat to ask questions directly: "How did our Instagram Reels perform last month compared to Stories?" and get instant answers without digging through charts.
6. Share reports your way
Once the report is ready, you have full control over how it goes out:
- Automated emails: Schedule recurring delivery on a specific day— weekly, monthly, or custom
- Live links: Give clients access to reports through a link, without needing a login
- PDF or CSV exports: Clean downloads for offline access or internal archives
- BigQuery and Looker Studio: Push your Instagram data for further analysis or additional visualization