


What is a LinkedIn Ads reporting tool?
A LinkedIn Ads reporting tool pulls your campaign data out of Campaign Manager and turns it into something you can actually act on - a clear, organized view of what's working, what's not, and where your clients' budget is going.
Instead of logging into Campaign Manager, exporting a CSV, cleaning up the columns, and pasting it into a slide deck, you get a single report that tells the full story. LinkedIn Ads data alongside Google Ads, Meta, and every other channel your clients run - all in one place.
For B2B agencies, this matters more than it does on any other platform. LinkedIn's ROAS has grown to 121% in 2026, outperforming both Google Search and Meta by a significant margin. The challenge isn't whether LinkedIn Ads work. The challenge is proving it clearly enough that clients keep investing.
That's exactly where LinkedIn reporting comes in. A good LinkedIn Ads reporting tool helps to:
- Connect directly to LinkedIn Ads and pulls data automatically - no manual exports
- Blend LinkedIn campaign data with other paid channels so you can compare performance across your full media mix
- Track LinkedIn ads metrics that actually matter to B2B clients: cost per lead, lead gen form completions, conversion rate, and ROAS
- Presents everything in branded, client-ready reports that your clients can read without a data analyst in the room
With Whatagraph IQ, LinkedIn ads reporting goes further. Rather than building reports piece by piece, your team can:
- Type a prompt and get a full LinkedIn Ads report built instantly - with widgets, metrics, and layout
- Apply client branding automatically using IQ Themes, without touching a single color setting
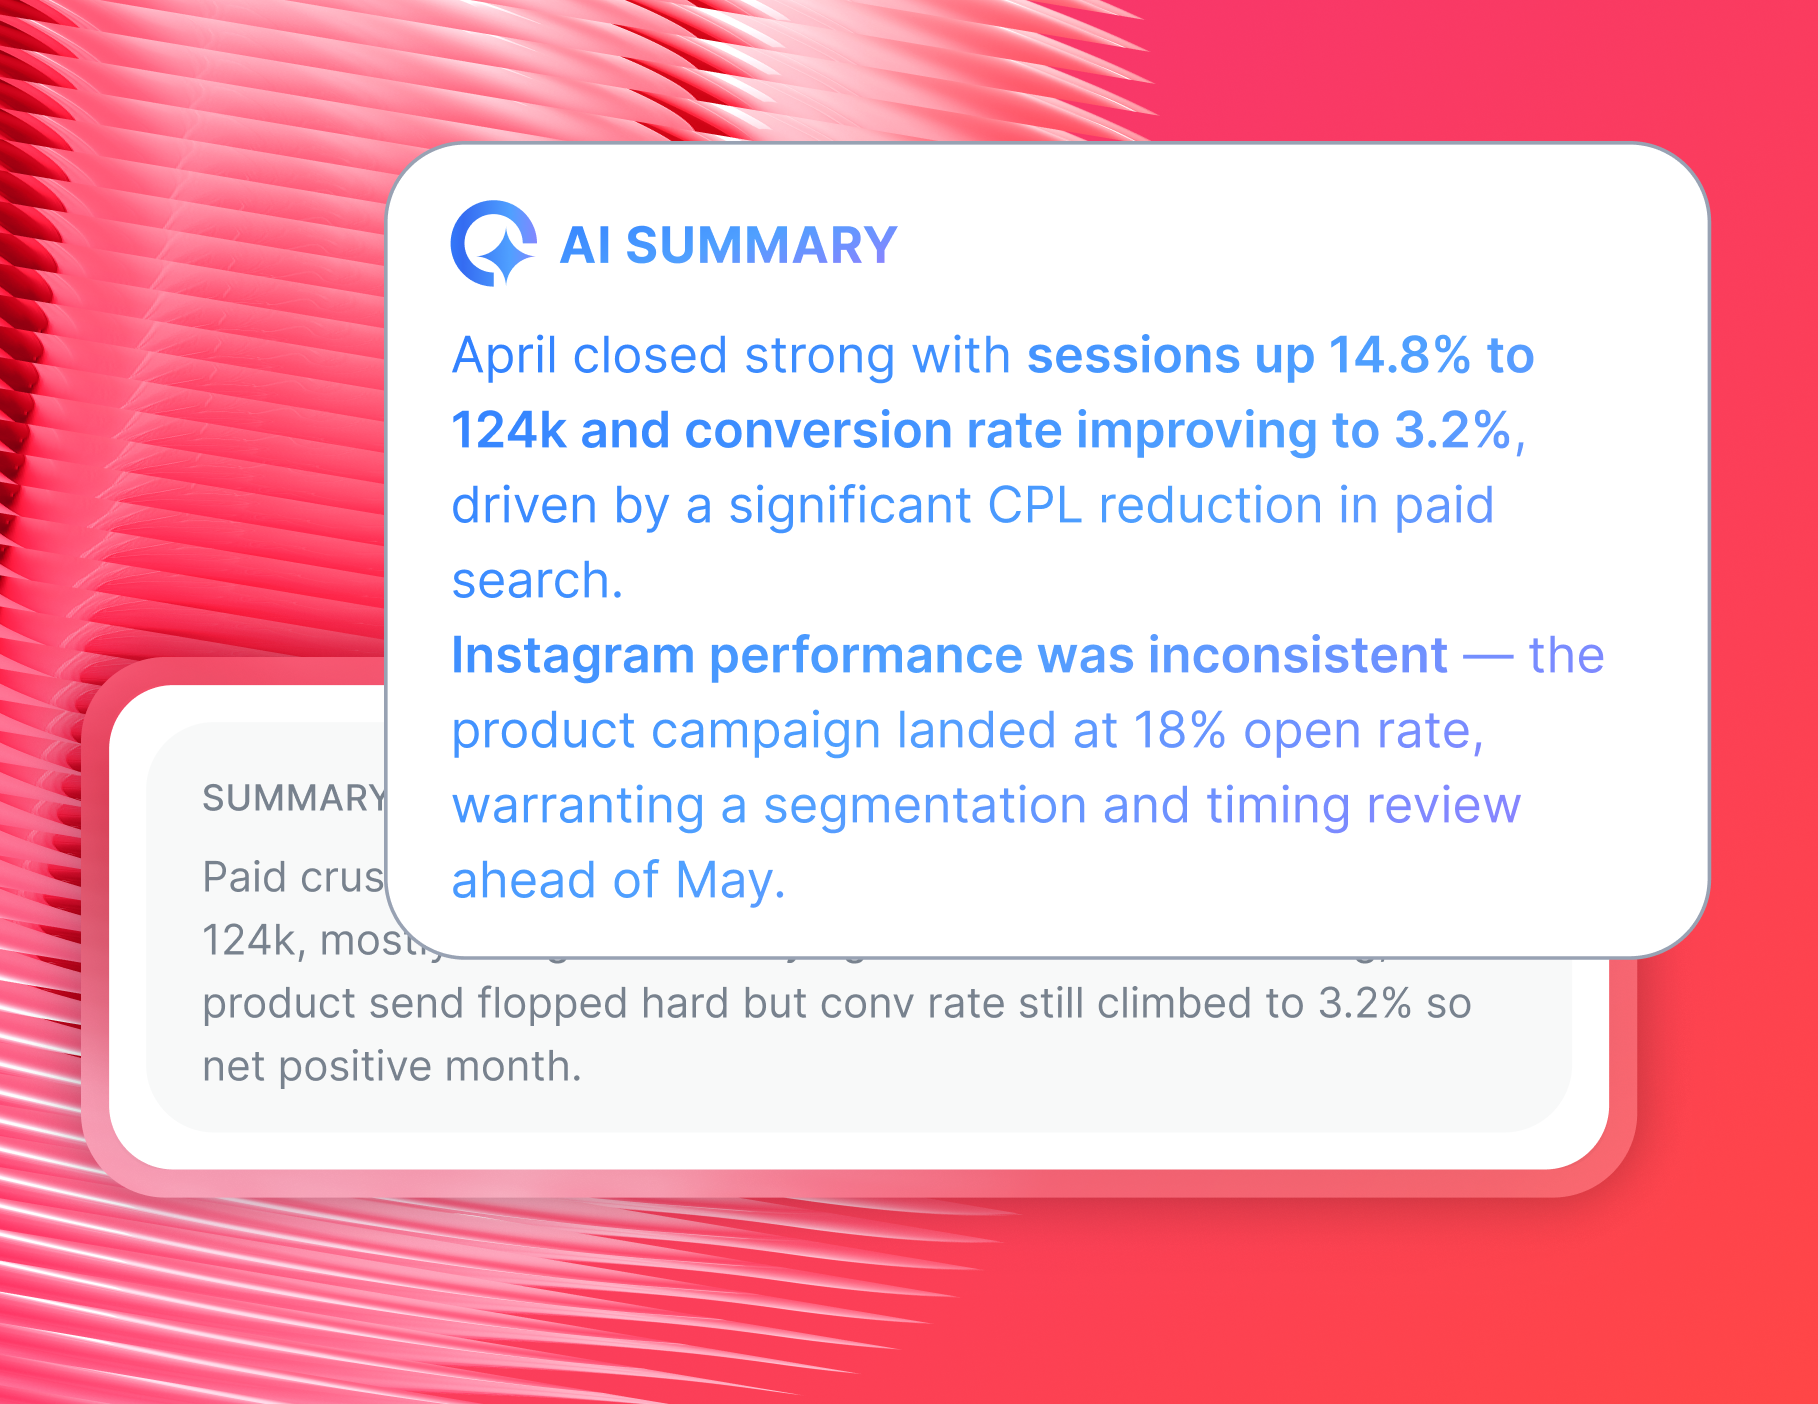
- Use IQ Summaries to write performance recaps directly in the report - so clients understand what happened and what comes next
- Ask IQ Chat questions about live campaign data and get plain-language answers on the spot
Whatagraph has also launched an MCP that lets you connect your data to Claude or ChatGPT and do your analysis there.
The results speak for themselves - just ask Maatwerk Online, a full-service digital agency based in Rotterdam.
After switching to Whatagraph, they saved over 100 hours a month on reporting across their 100+ client accounts. That's more than 100 hours redirected toward strategy, optimization, and client relationships - not spreadsheet cleanup.
Whatagraph’s AI saves time and energy for marketing specialists. The hours we're saving are just pure profit. We now have time to focus on more strategic things that actually help both our agency and our clients grow. - Lars Maat, Co-Founder at Maatwerk Online
What is the best LinkedIn Ads reporting tool?
Many tools claim to handle LinkedIn Ads reporting - but most are built for simple dashboards, not for agencies managing multiple B2B clients who need to prove ROI.
If you need a tool that goes beyond basic exports and actually makes LinkedIn reporting easier, here are four worth knowing:
1. Whatagraph - Best LinkedIn Ads reporting tool for agencies
Whatagraph is built for the people doing the actual reporting work - account managers, performance specialists, and agency ops leads - not for data engineers.
Here's what makes Whatagraph stand out for LinkedIn Ads reporting specifically:
- 60+ native integrations with paid, SEO, CRM, social media, and analytics platforms - LinkedIn Ads (and organic), Google Ads, Meta, GA4, HubSpot, and more
- Cross-channel data blending so LinkedIn performance sits alongside every other channel your client runs - in one unified LinkedIn ads reporting dashboard
- Whatagraph IQ - a full suite of AI features to build, brand, and analyze reports in seconds
- Custom LinkedIn ads metrics and dimensions - build the KPIs that matter to your client without formulas or code
- Automated report delivery via email, Slack, live link, PDF, or CSV
- Whatagraph MCP to connect your data to Claude or ChatGPT
Kim Strickland, Digital Marketing Specialist at Peak Seven, put it plainly after switching to Whatagraph and saving 63 hours per month on reporting:
Whatagraph has helped everyone on our team get on the same page about clients, what’s important, and how to talk to them. Our relationships with clients have been amazing, and we’ve even been able to retain them longer. Whatagraph is now our Bible—both for our clients and internal teams.
Start free with Whatagraph today.
2. DashThis - Best for small teams that want simple, fast dashboards
DashThis is a straightforward reporting tool that lets you pull data from multiple channels - including LinkedIn Ads - and present it in a clean dashboard. It's easy to get started with and works well for teams whose reporting needs are relatively simple.
With DashThis, you can:
- Connect LinkedIn Ads alongside Google Ads, Meta, and 35+ other integrations
- Use pre-built templates to get reports running quickly
- Schedule automated report delivery to clients via email
However, DashThis doesn't support data blending or advanced data transformation, which makes it a difficult fit for agencies with clients running complex multi-channel campaigns.
3. Databox - Best for teams that want visual KPI tracking across departments
Databox is a reporting and performance tracking tool with a highly visual interface and a large library of integrations. It's popular with teams that want a quick way to pull LinkedIn Ads performance into a shared dashboard alongside other metrics.
With Databox, you can:
- Connect LinkedIn Ads with 70+ direct integrations and 2,000+ third-party sources
- Track KPIs visually with a drag-and-drop builder
- Set goals and monitor LinkedIn ads performance against targets
- View dashboards across desktop, mobile, and TV displays
Keep in mind, longer-term agency users report that Databox’s widgets stop pulling data - sometimes for weeks - making it difficult to maintain reliable, reusable templates across clients.
4. Reporting Ninja - Best for agencies that want straightforward LinkedIn Ads automation
Reporting Ninja connects to LinkedIn Ads alongside Google Ads, Facebook Ads, and other major PPC platforms, and lets you build templated reports you can reuse across clients.
With Reporting Ninja, you can:
- Connect LinkedIn Ads and pull campaign-level performance data
- Build reusable report templates to speed up client onboarding
- Filter results by campaign, ad group, or custom conditions
- Include agency margin and markup in PPC reports for client transparency
- Schedule automated report delivery to clients
How do I automate LinkedIn Ads reports for clients?
Automating campaign reporting for LinkedIn doesn't have to mean stitching together a Looker Studio connector or a Google Sheet that your team manually updates every month.
With Whatagraph, you can go from a fresh LinkedIn Ads connection to a branded, automated report landing in your client's inbox - in under 30 minutes. Here's how it works:
1. Connect your LinkedIn Ads account
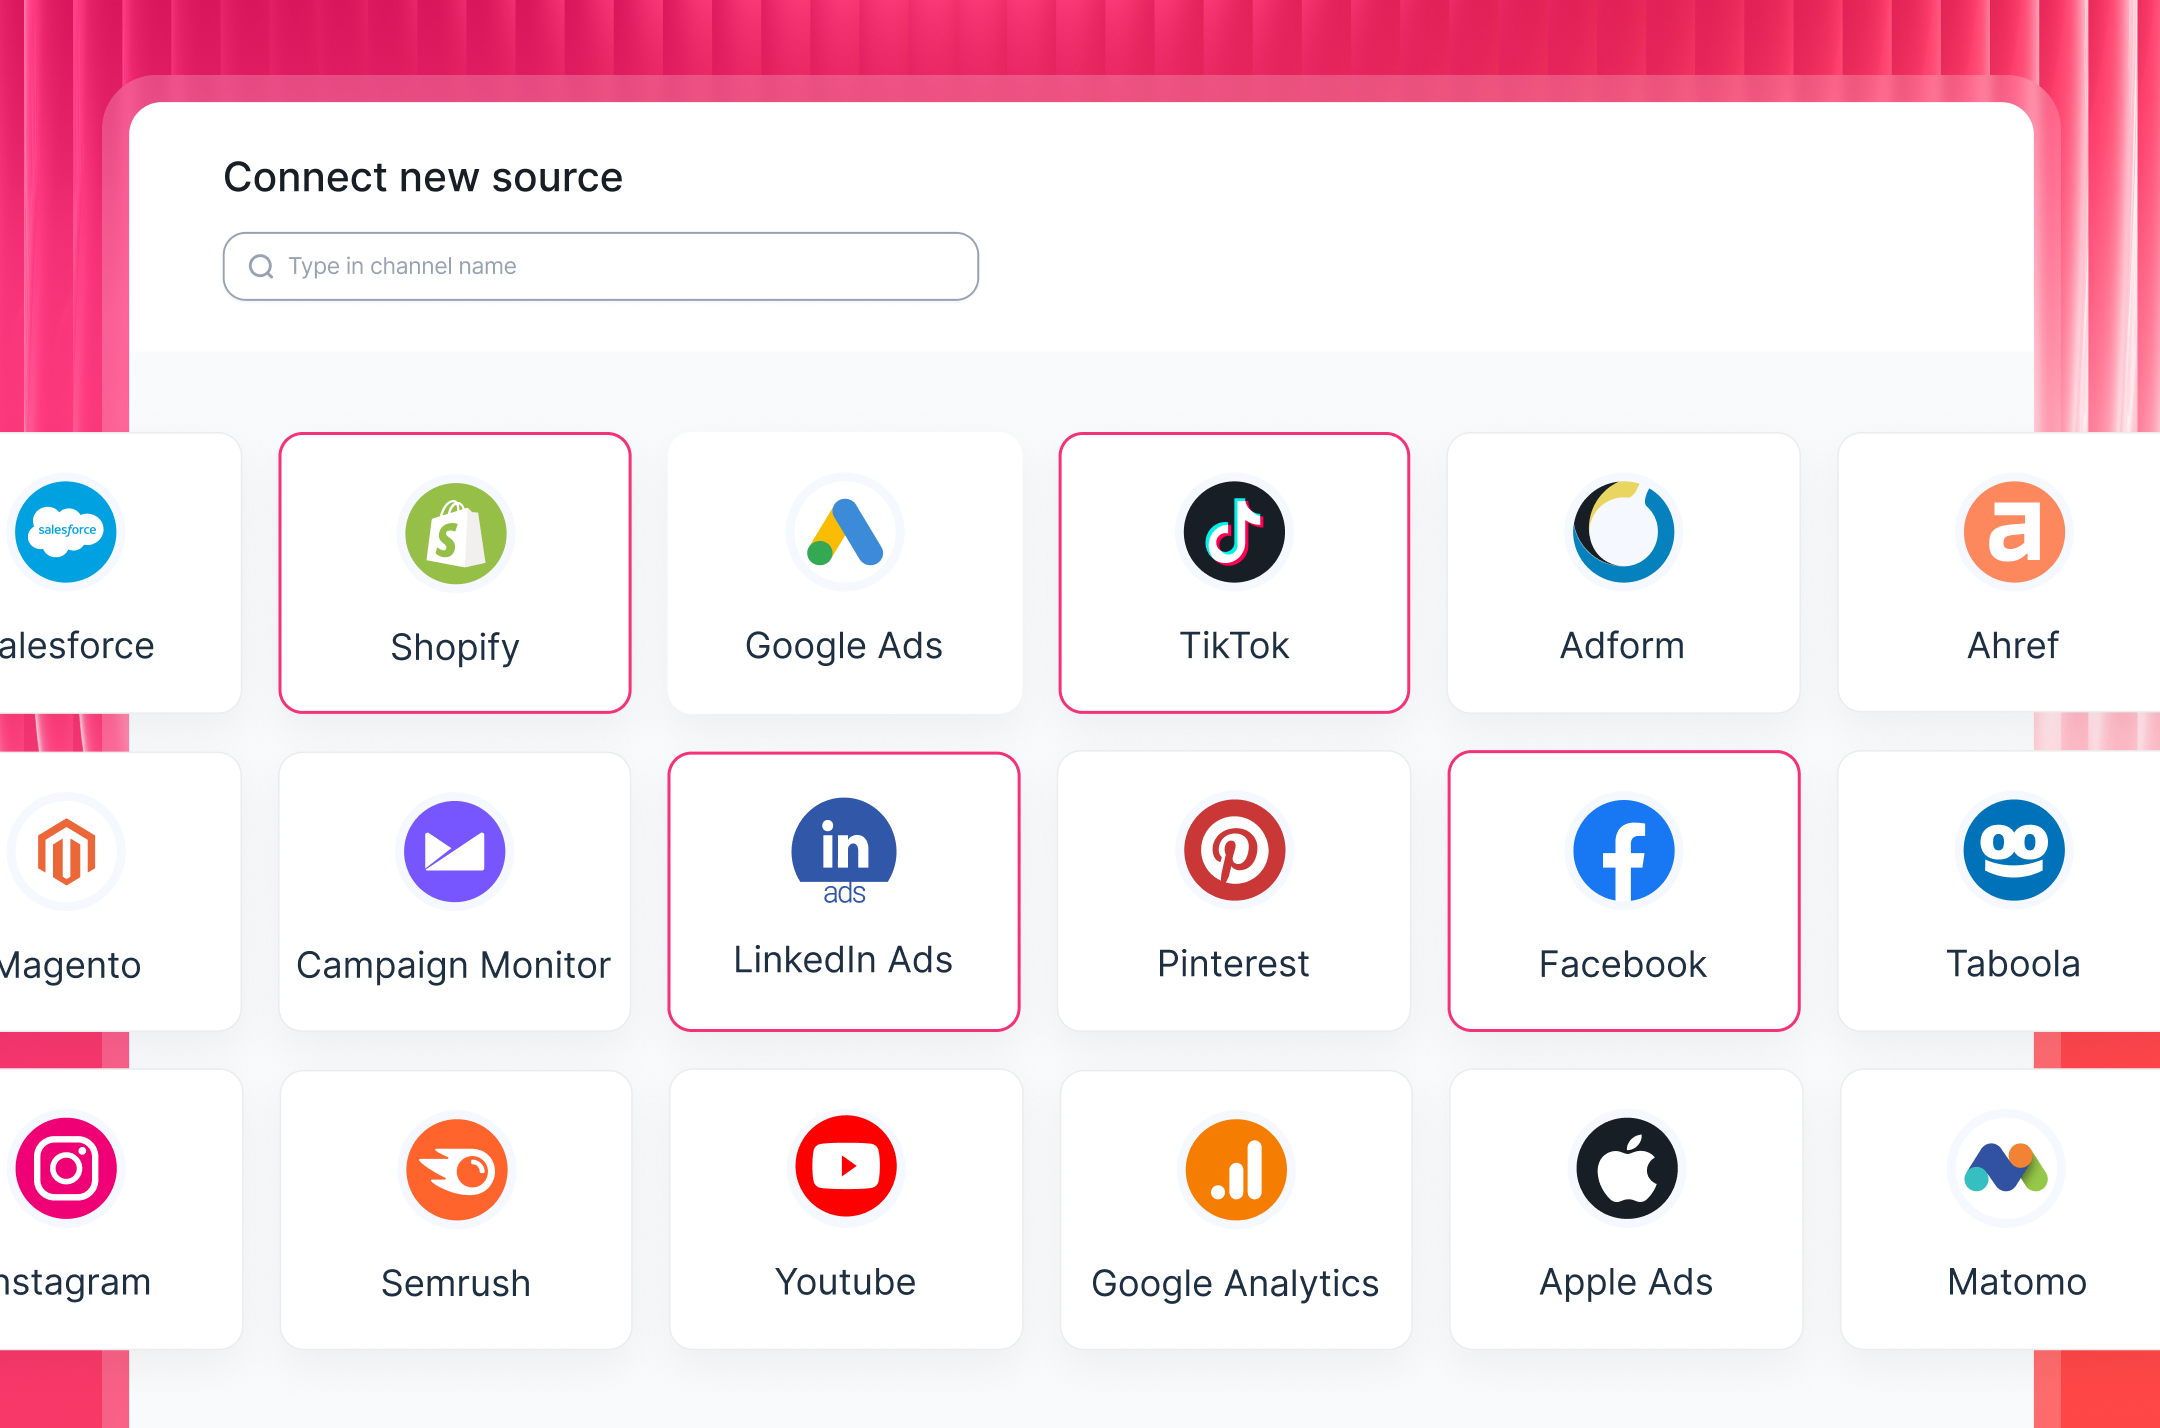
Start by connecting LinkedIn Ads directly from your Whatagraph workspace.
Choose LinkedIn Ads from the integrations menu, authenticate with your login, and your campaign data starts flowing in immediately. No API setup, no third-party connectors, no dev work. The whole thing takes a few minutes.
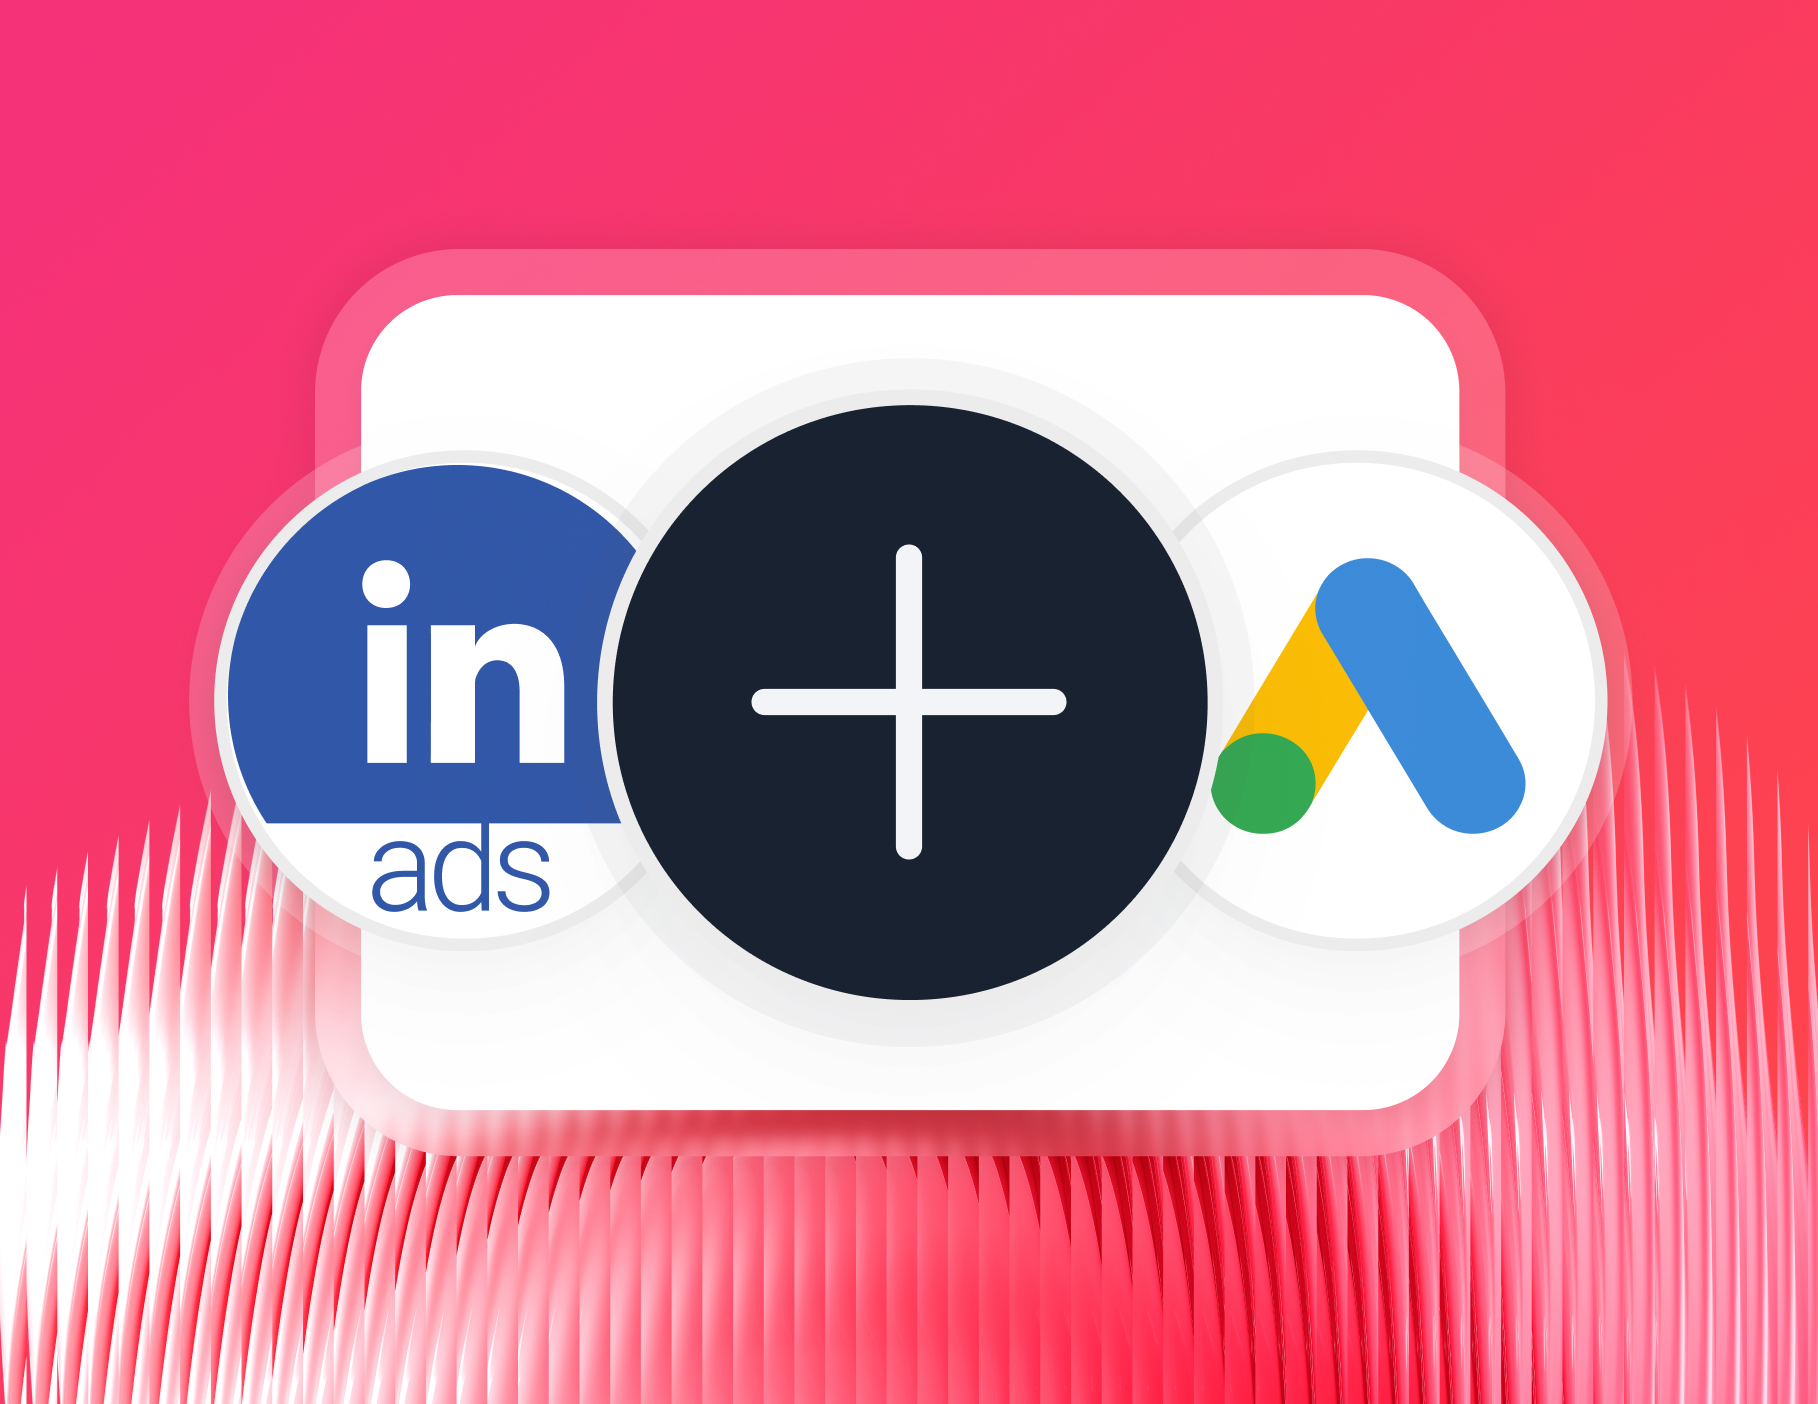
Already running other paid channels for your client? Pull those in at the same time. Whatagraph connects to 60+ platforms, including:
- Paid: Google Ads, Meta Ads, LinkedIn Ads, TikTok Ads, Pinterest Ads
- Analytics: Google Analytics 4, HubSpot, Matomo
- SEO: Semrush, Ahrefs, Google Search Console
- E-commerce: Shopify, BigCommerce, WooCommerce
- Email: Mailchimp, Klaviyo, ActiveCampaign
Every integration is direct and fully managed.
Whatagraph's connector uptime has averaged 99.95% over the past six months - so your LinkedIn Ads data is always there when your client expects the report.
2. Organize and clean your LinkedIn Ads data
Raw LinkedIn Ads data straight from Campaign Manager isn't always report-ready. Campaign names are inconsistent, performance metrics aren't standardized across channels, and clients don't need to see every column in a CSV export.
Before creating your LinkedIn Ads report, tidy things up. With Whatagraph, you can:
- Blend LinkedIn Ads data with Google Ads, Meta, or any other paid channel into one unified view
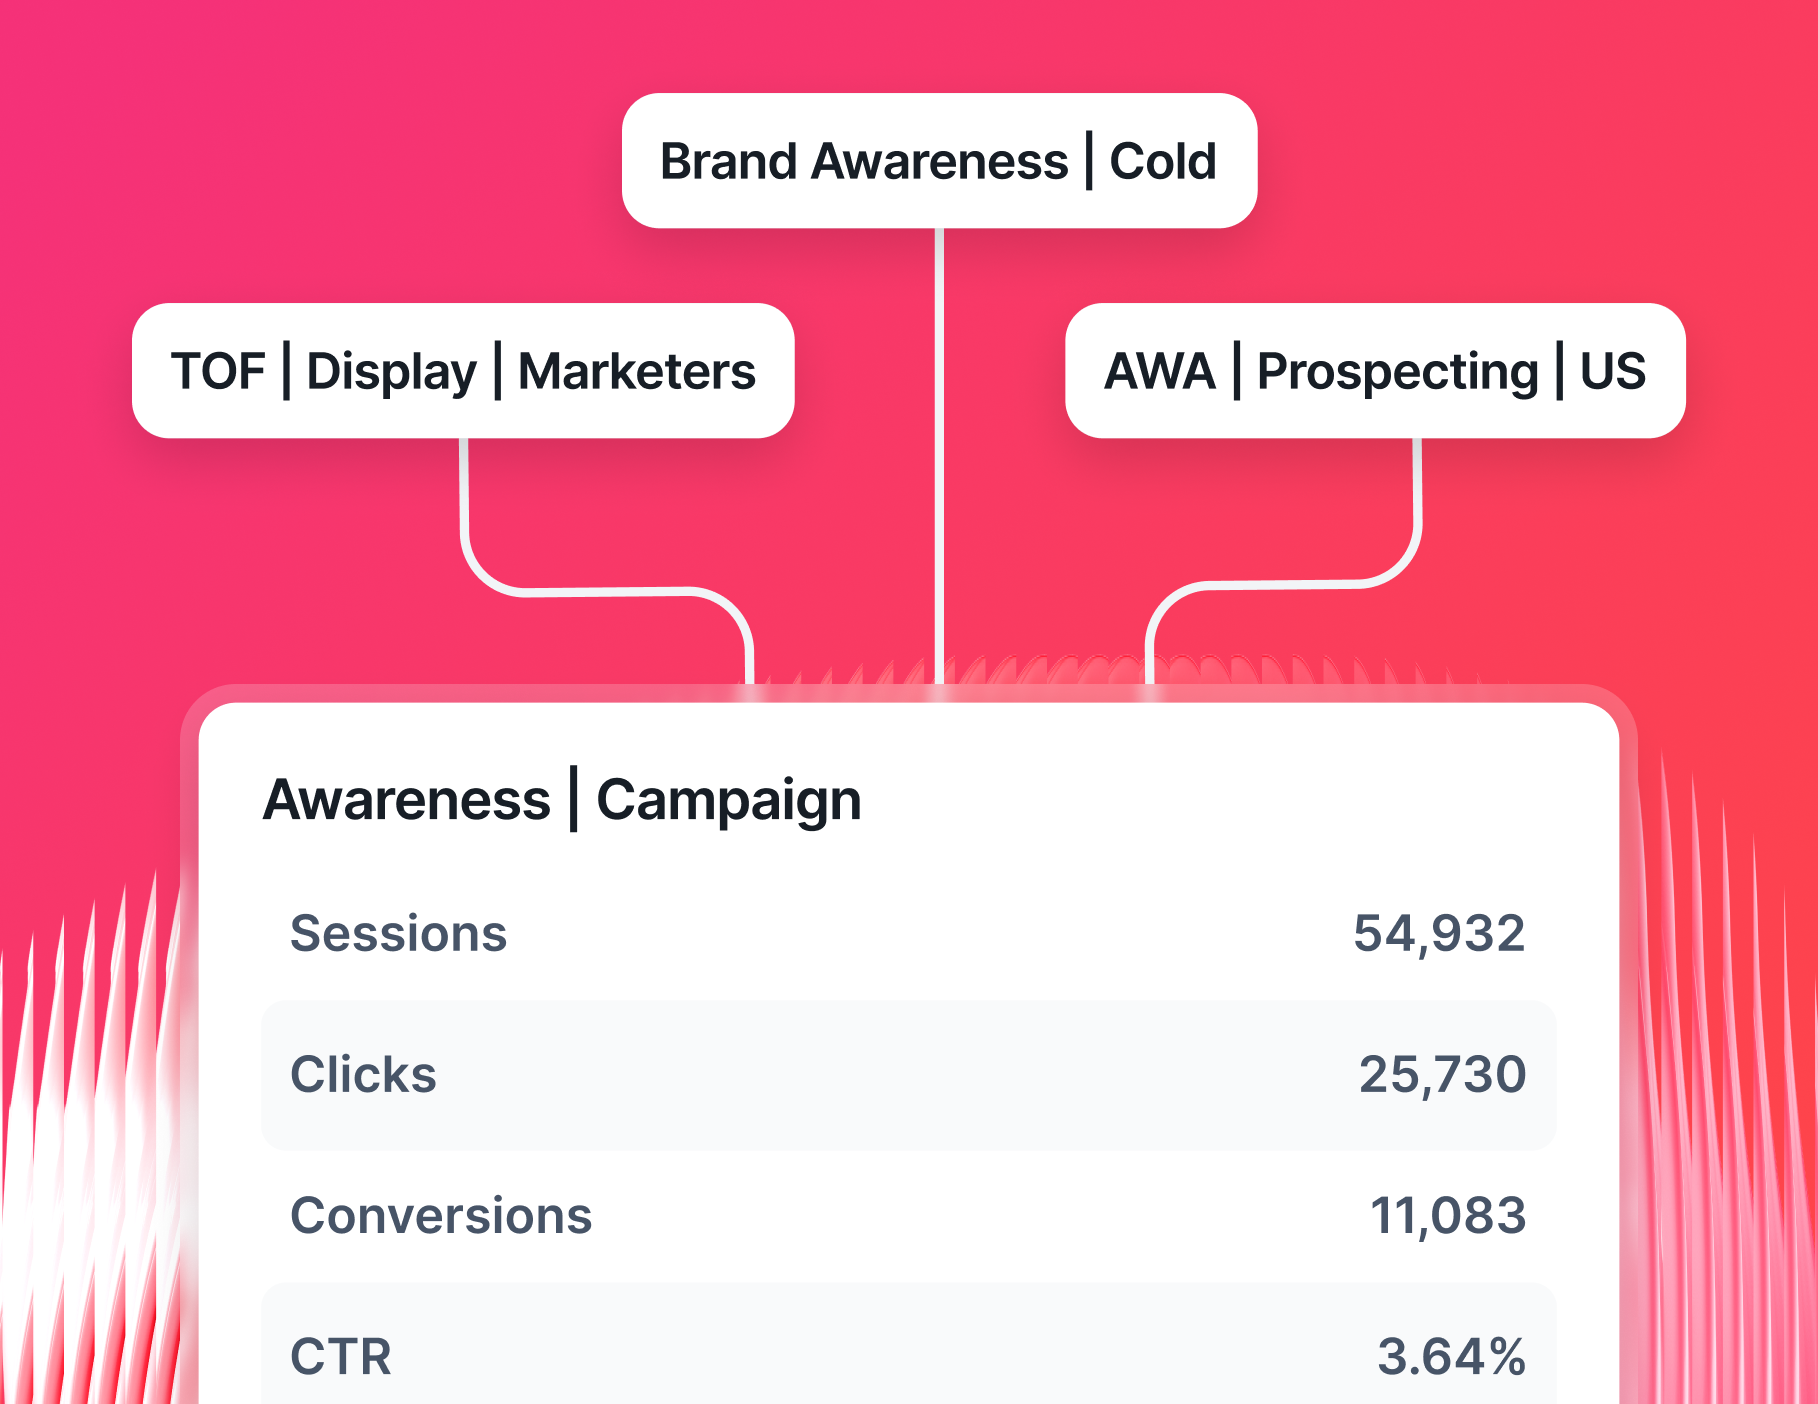
- Standardize campaign naming conventions across accounts and clients
- Group campaigns by objective, audience, or funnel stage
- Filter by date range, campaign type, or custom segments
- Organize by client, account manager, or region using tags and folders
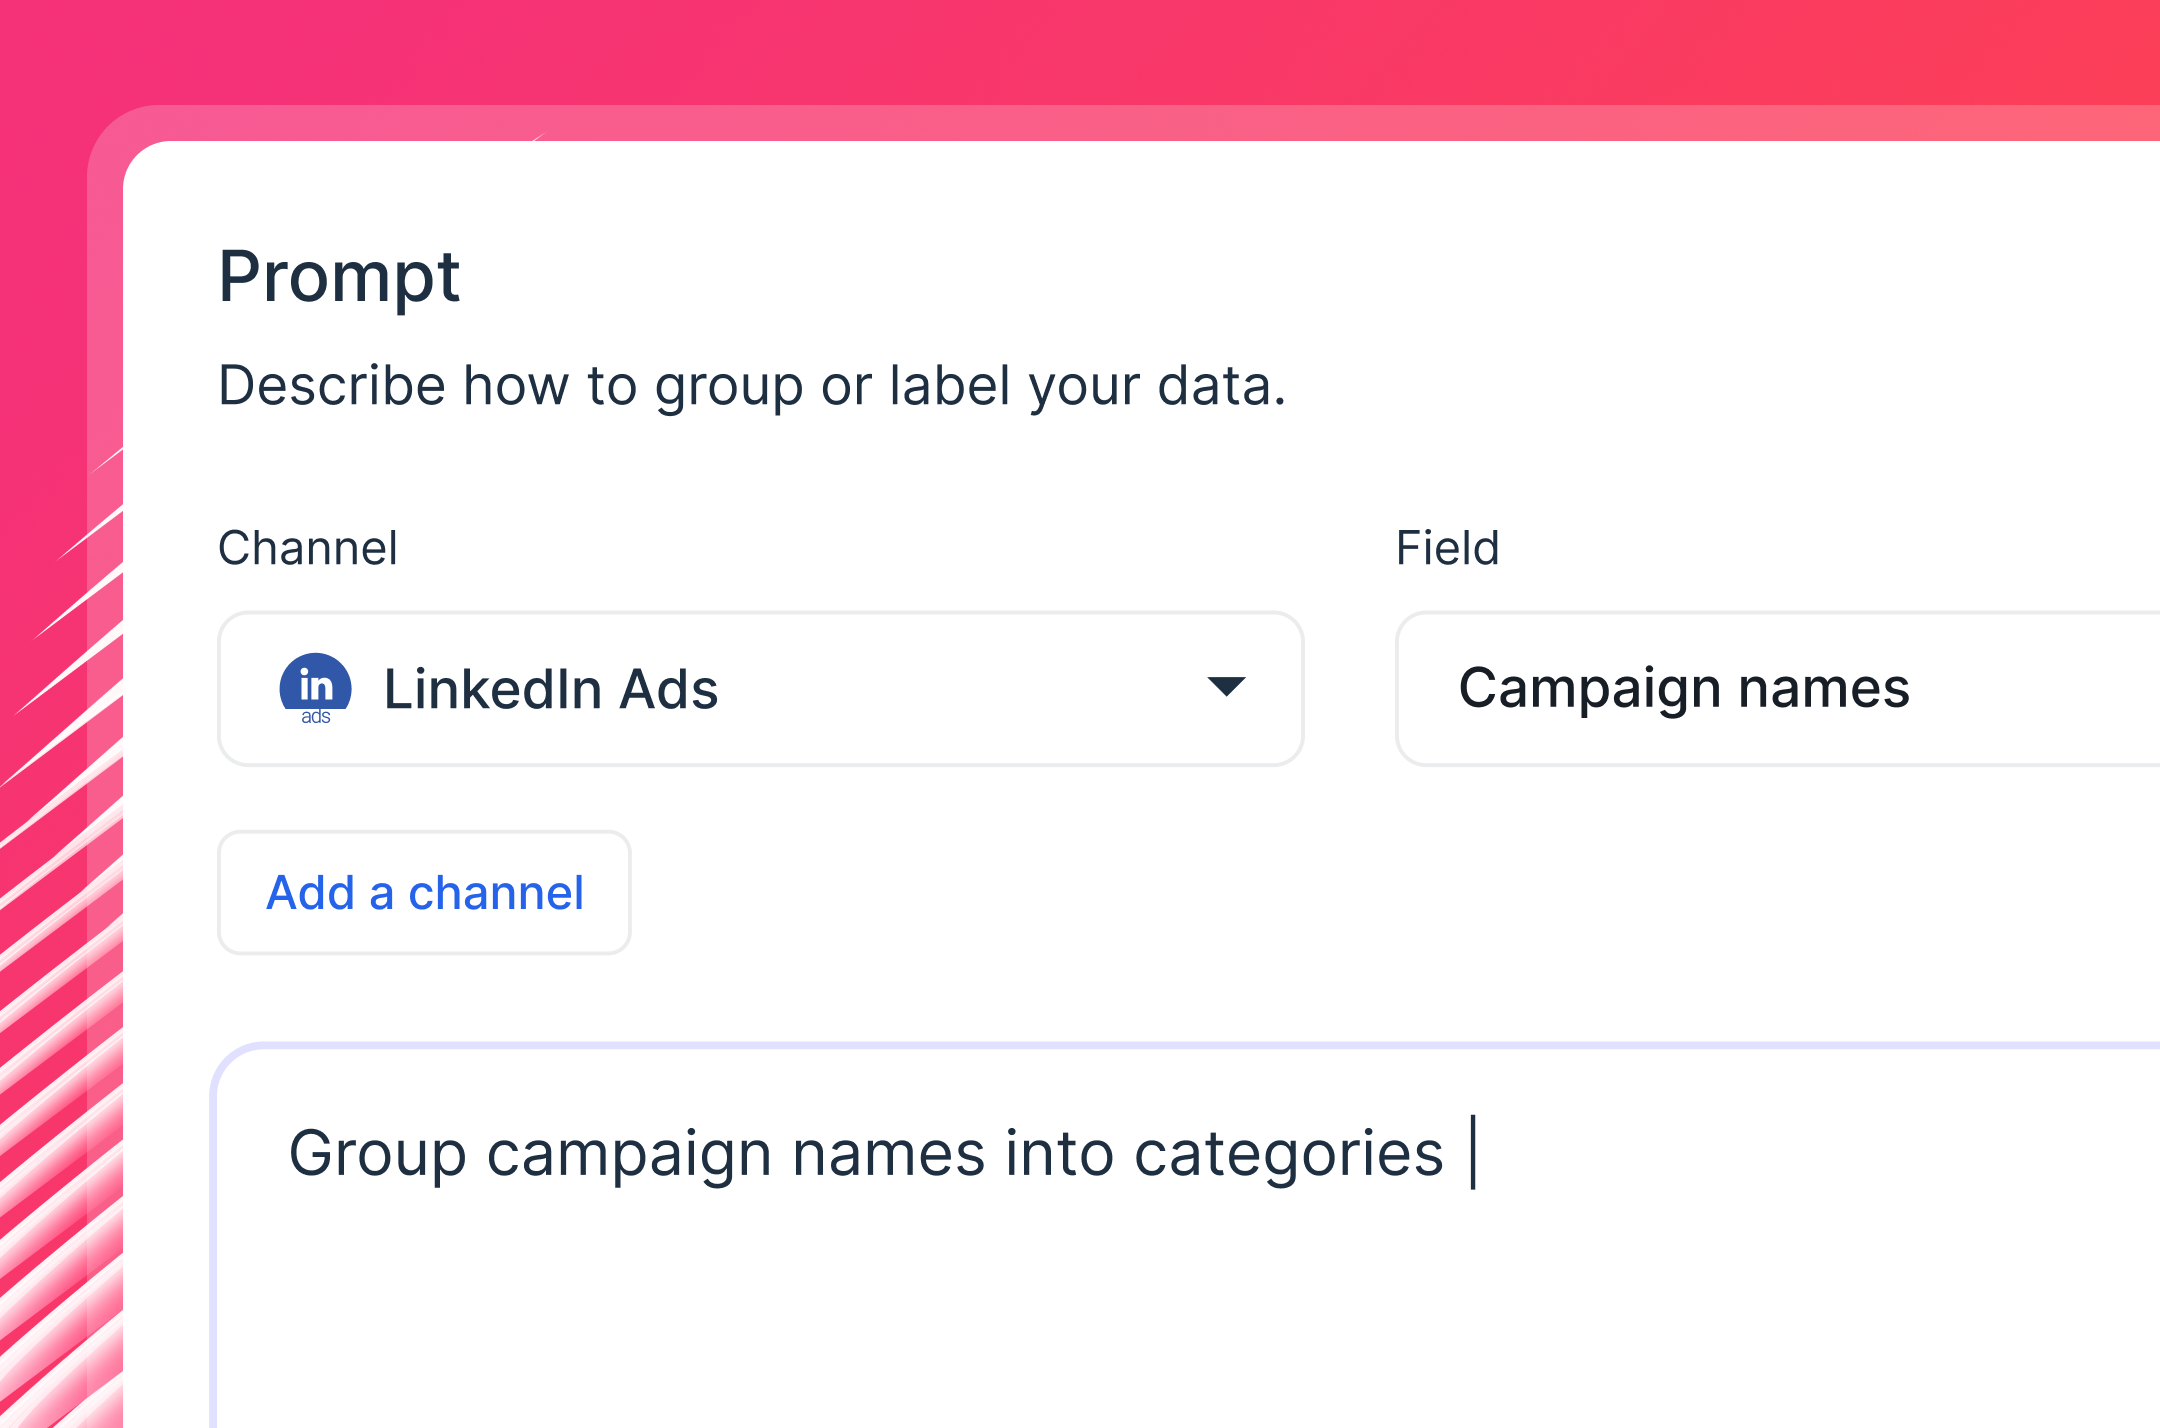
With Whatagraph IQ Dimensions, you don't need to write a single formula. Just tell AI what you need:
- Merge spend across channels automatically. Describe the blend - "combine LinkedIn ad spend and Google Ads spend into one total Paid Media cost" - and IQ creates it for you
- Build LinkedIn-specific custom metrics on the fly. Want cost per qualified lead, or a blended ROAS across your full paid media mix? IQ generates those metrics instantly
- Clean up messy campaign names. If your LinkedIn campaigns follow naming conventions like "LI_Q1_LeadGen_EN" and "LinkedInUK_Q1_2025," tell IQ how to group them, and it creates a reusable dimension that works across every report
3. Build a branded LinkedIn Ads report for clients
This is where most agencies spend the most time - and where Whatagraph cuts it the most dramatically.
With Whatagraph IQ, you don't drag and drop widgets one by one. You describe the report you need, and IQ builds the whole thing: tabs, charts, KPI widgets, and layout. A full LinkedIn Ads client report, ready in seconds.
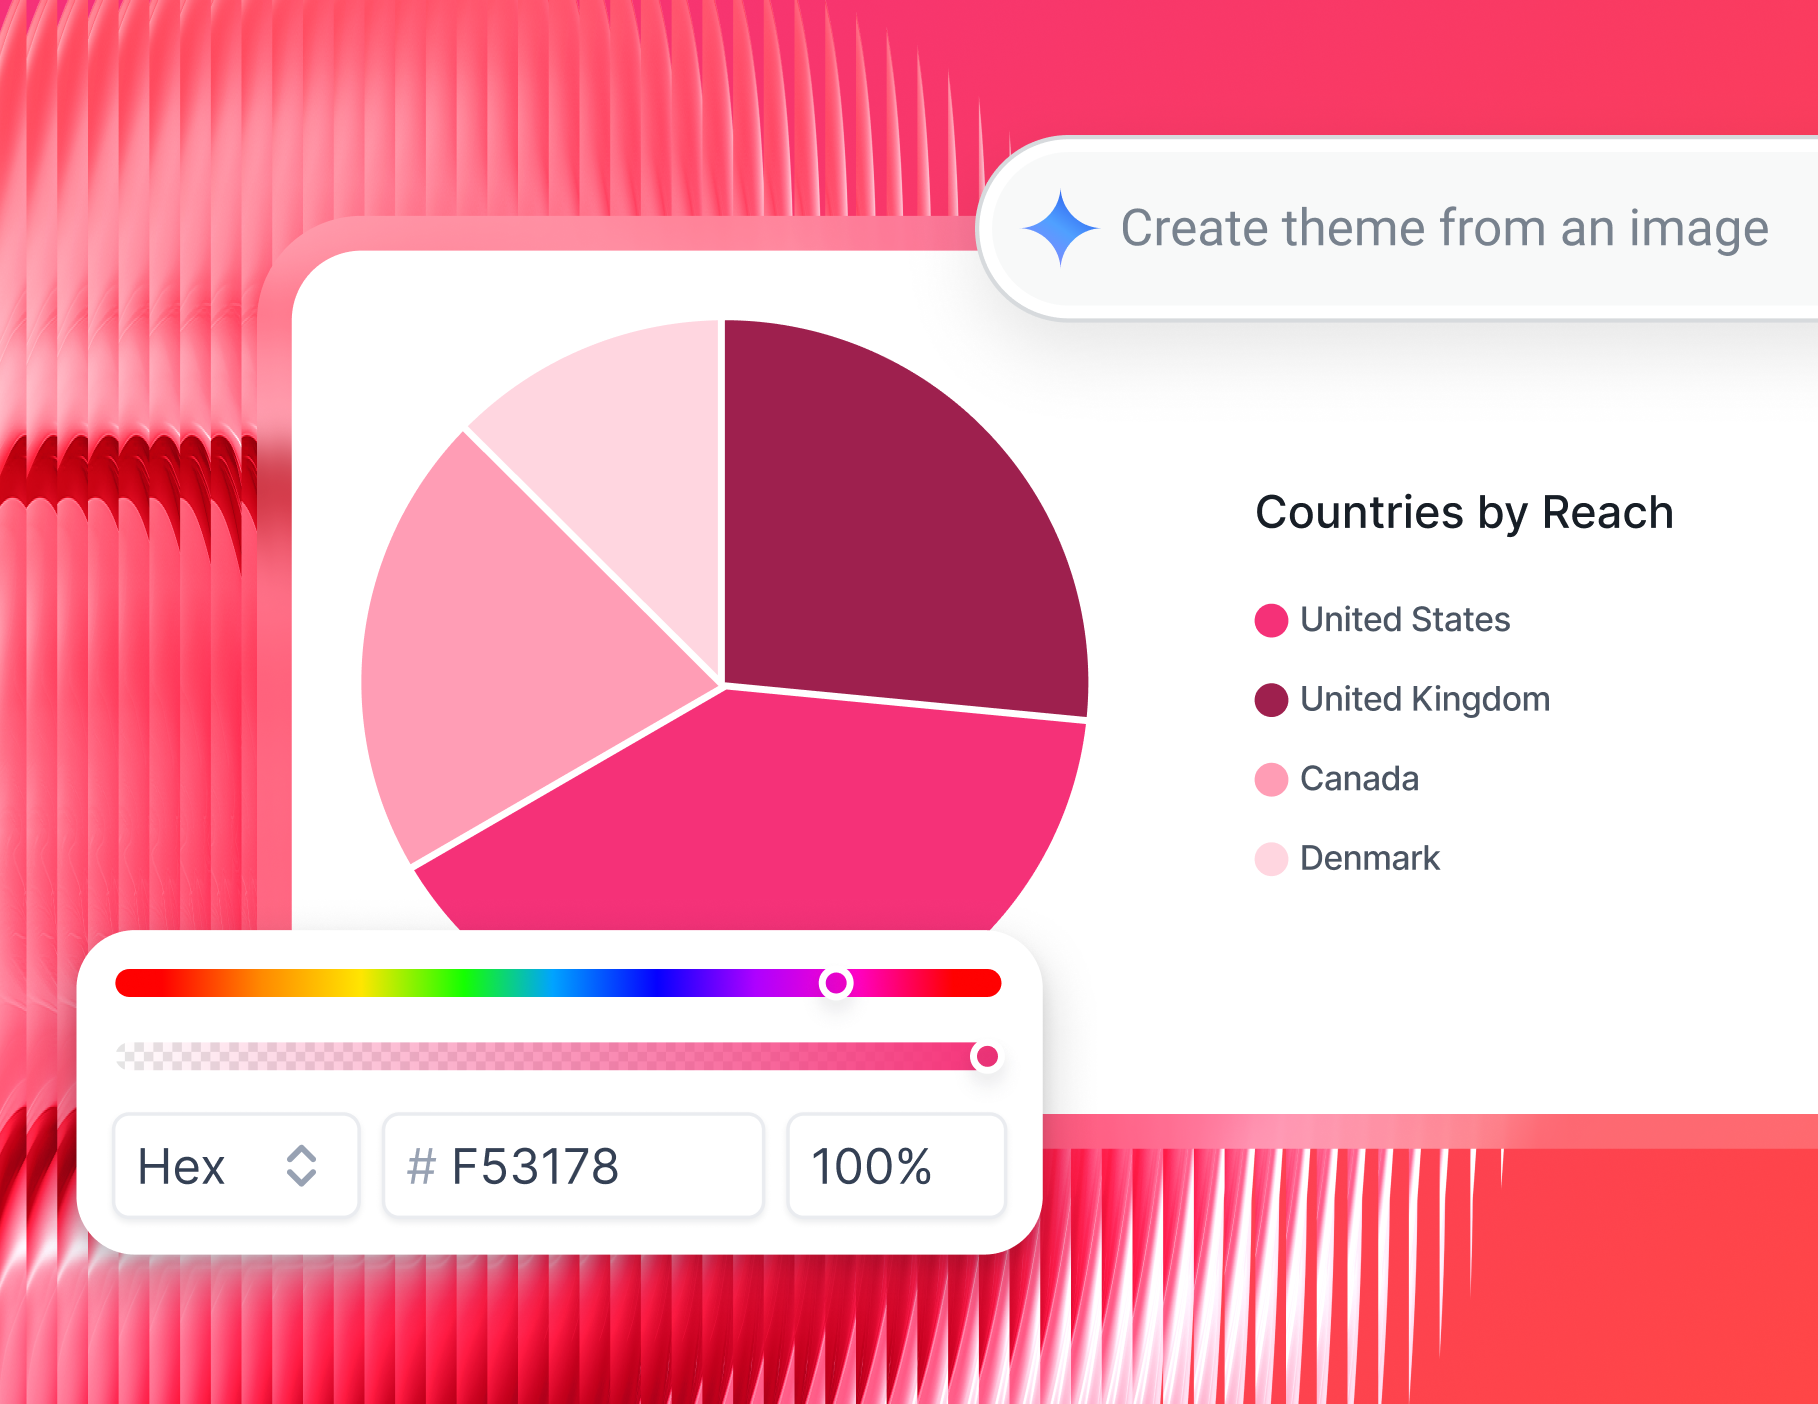
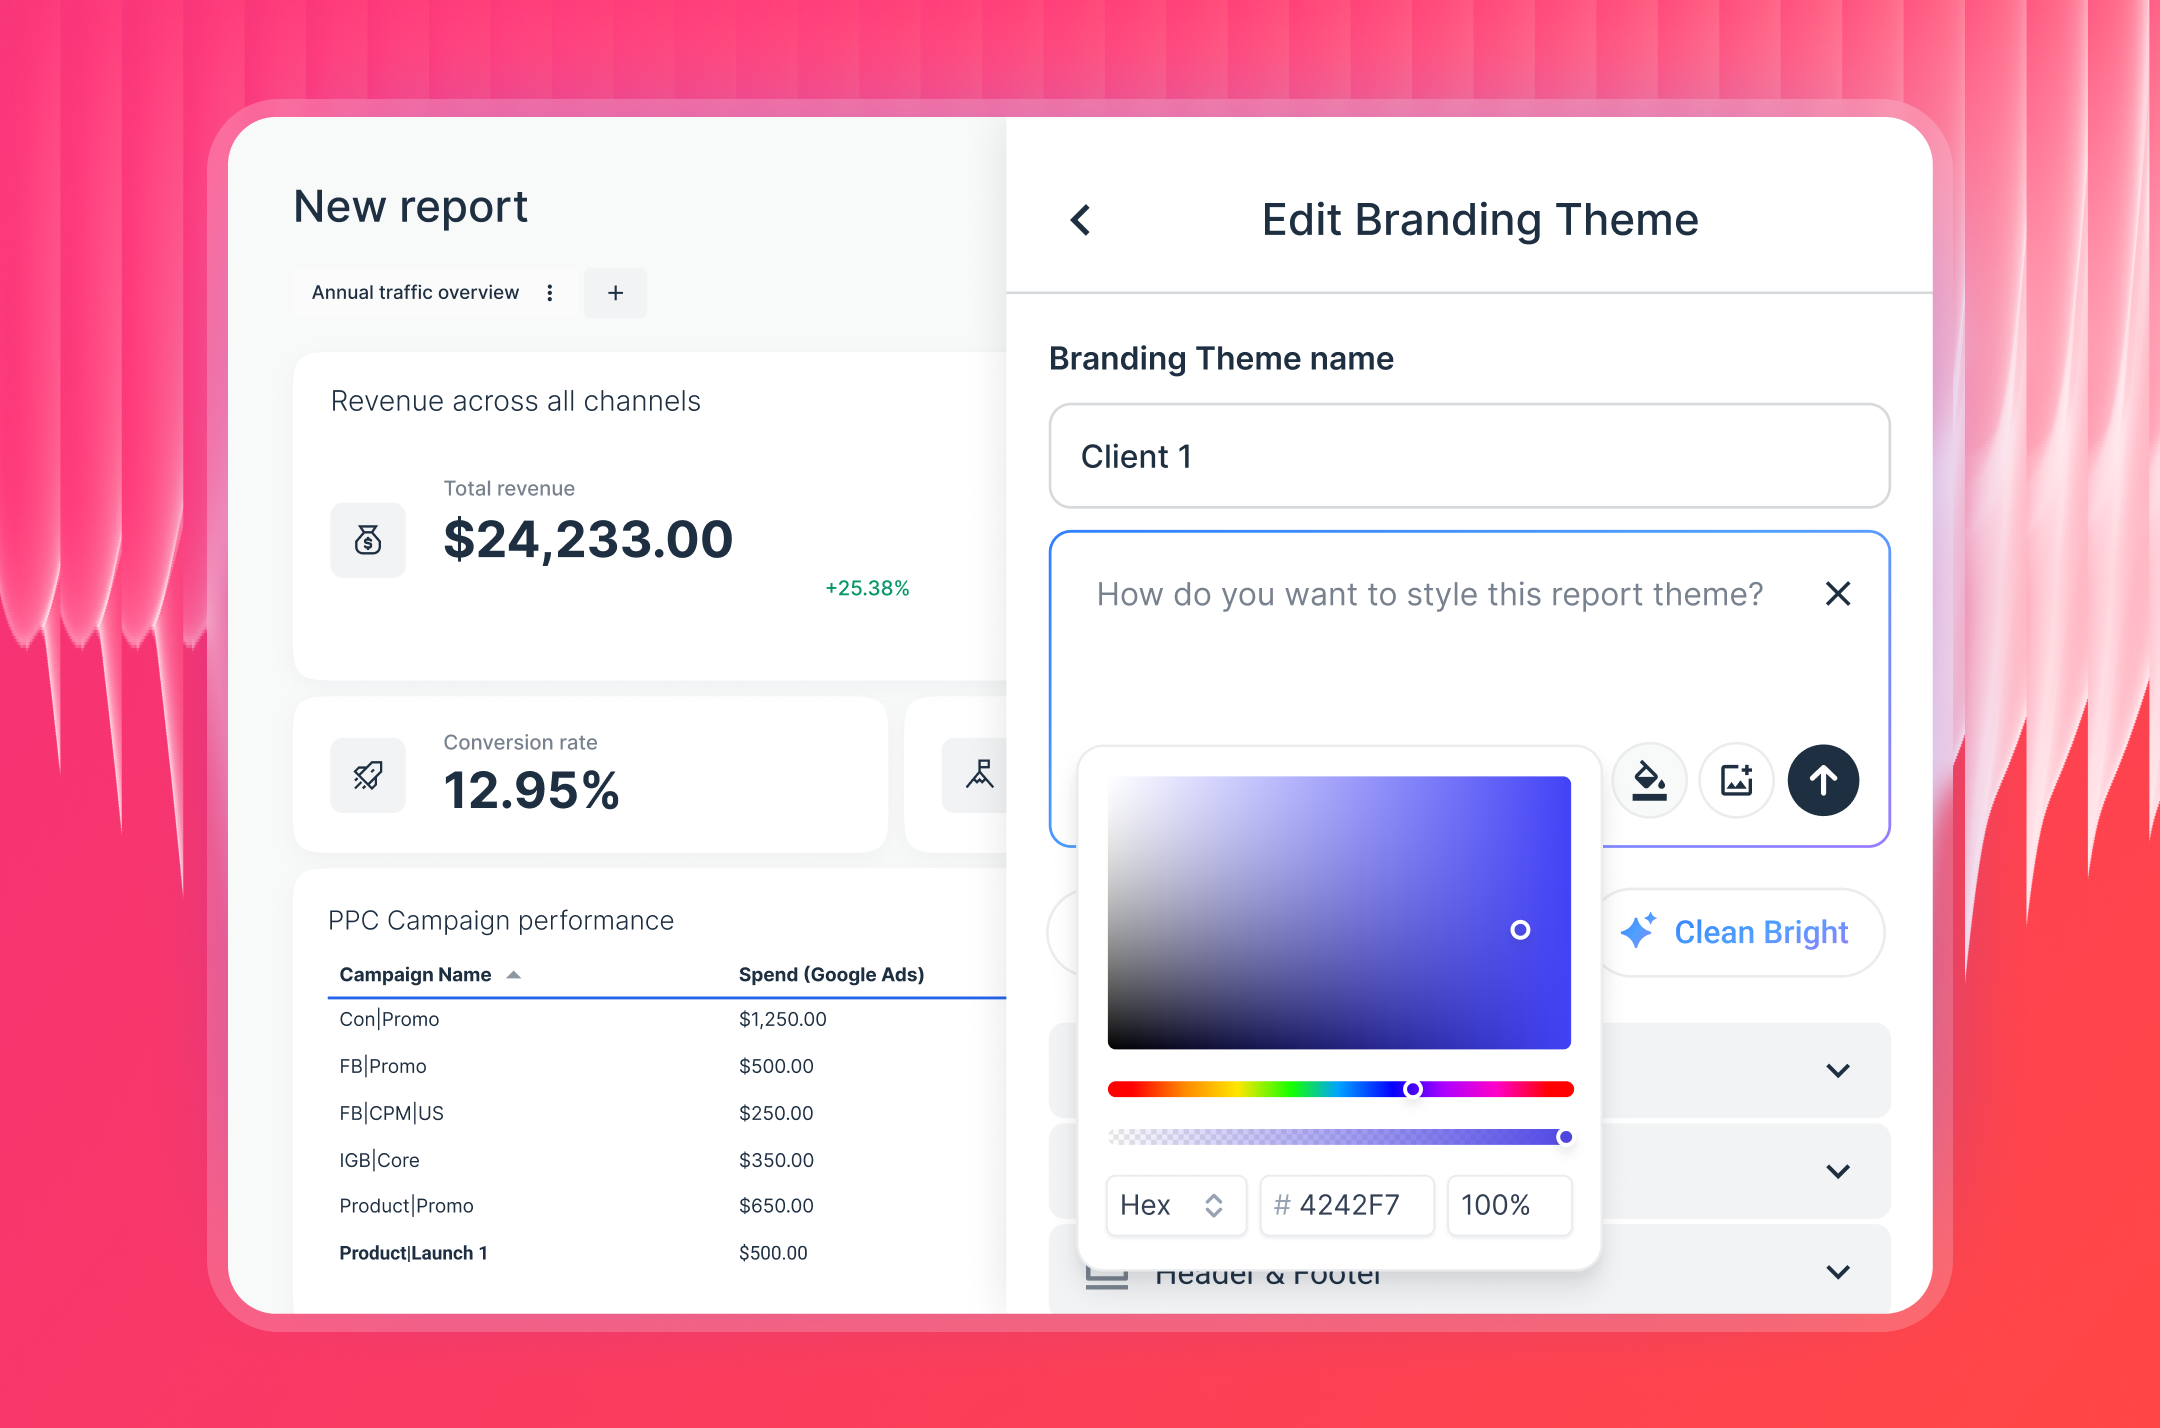
Need it to match your client's brand? Upload their logo or a screenshot of their visual guidelines, and IQ Themes generates the complete branded look - colors, fonts, HEX codes, and icons - applied across the entire report automatically.
Want to build from scratch instead? Start with a blank canvas and customize every element:
- Adjust widget labels, sizes, icons, and chart types
- Apply custom formulas to any metric
- Set reporting periods, currencies, and display options per widget
- Add, remove, or rearrange sections without rebuilding the whole report
Pro tip: Save your LinkedIn Ads report as a team template and reuse it across every client running LinkedIn campaigns. Use linked templates to make it even faster - update the master template once, and every connected client report updates automatically.
4. Set up an internal LinkedIn Ads dashboard
Client reports and internal monitoring are two different things.
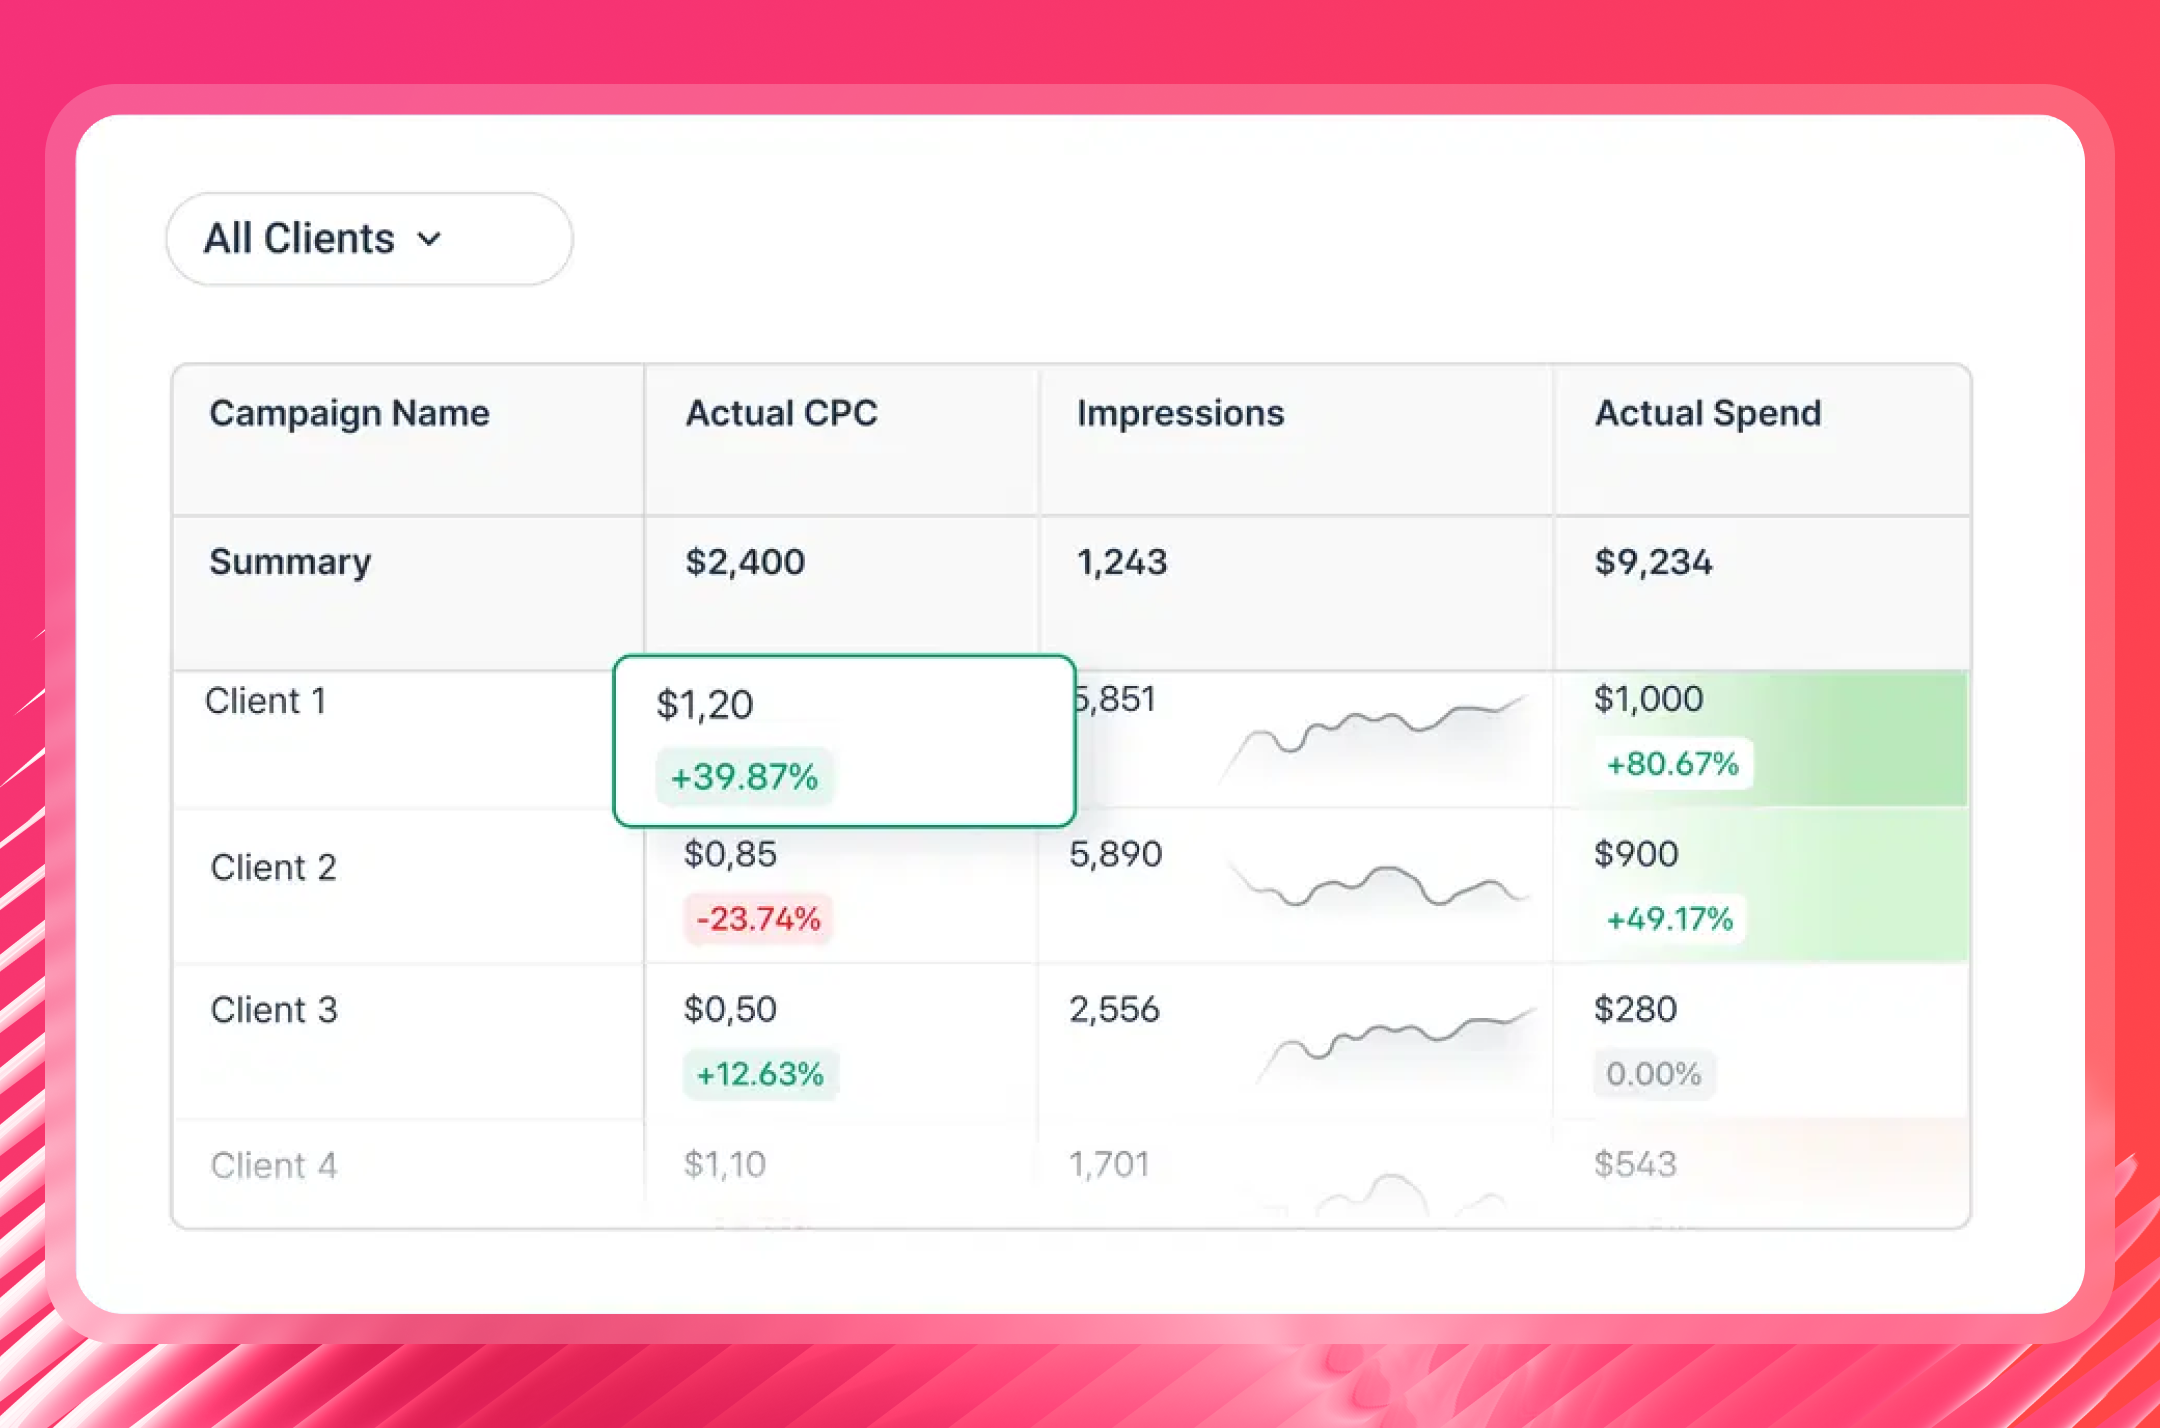
For your team's day-to-day view, set up an Overview in Whatagraph - an internal LinkedIn ads KPI dashboard that tracks performance across all your clients at once.
Use Whatagraph Overviews to:
- Monitor LinkedIn Ads performance across every client account from one screen
- Flag campaigns that are overspending or underperforming against targets
- Track cost per lead and ROAS trends without opening individual reports
- Set spend caps and lead volume goals with visual progress indicators
- Slice performance by client, campaign type, account manager, or region
This is how your team stays on top of LinkedIn ads analytics without logging into Campaign Manager for every single account.
5. Add AI-written performance summaries
Your clients don't want to interpret a page of charts on their own. They want to know what happened, why it matters, and what you're doing about it.
As Martin Sandgaard, Co-Founder of AdsToGo, puts it:
Reporting with human input is 1000x more valuable than an auto-scheduled report. Context and action plans matter more than the numbers, and most clients don't open or understand reports without that context.
He's right - but writing that context from scratch for every client, every month, isn't realistic either.
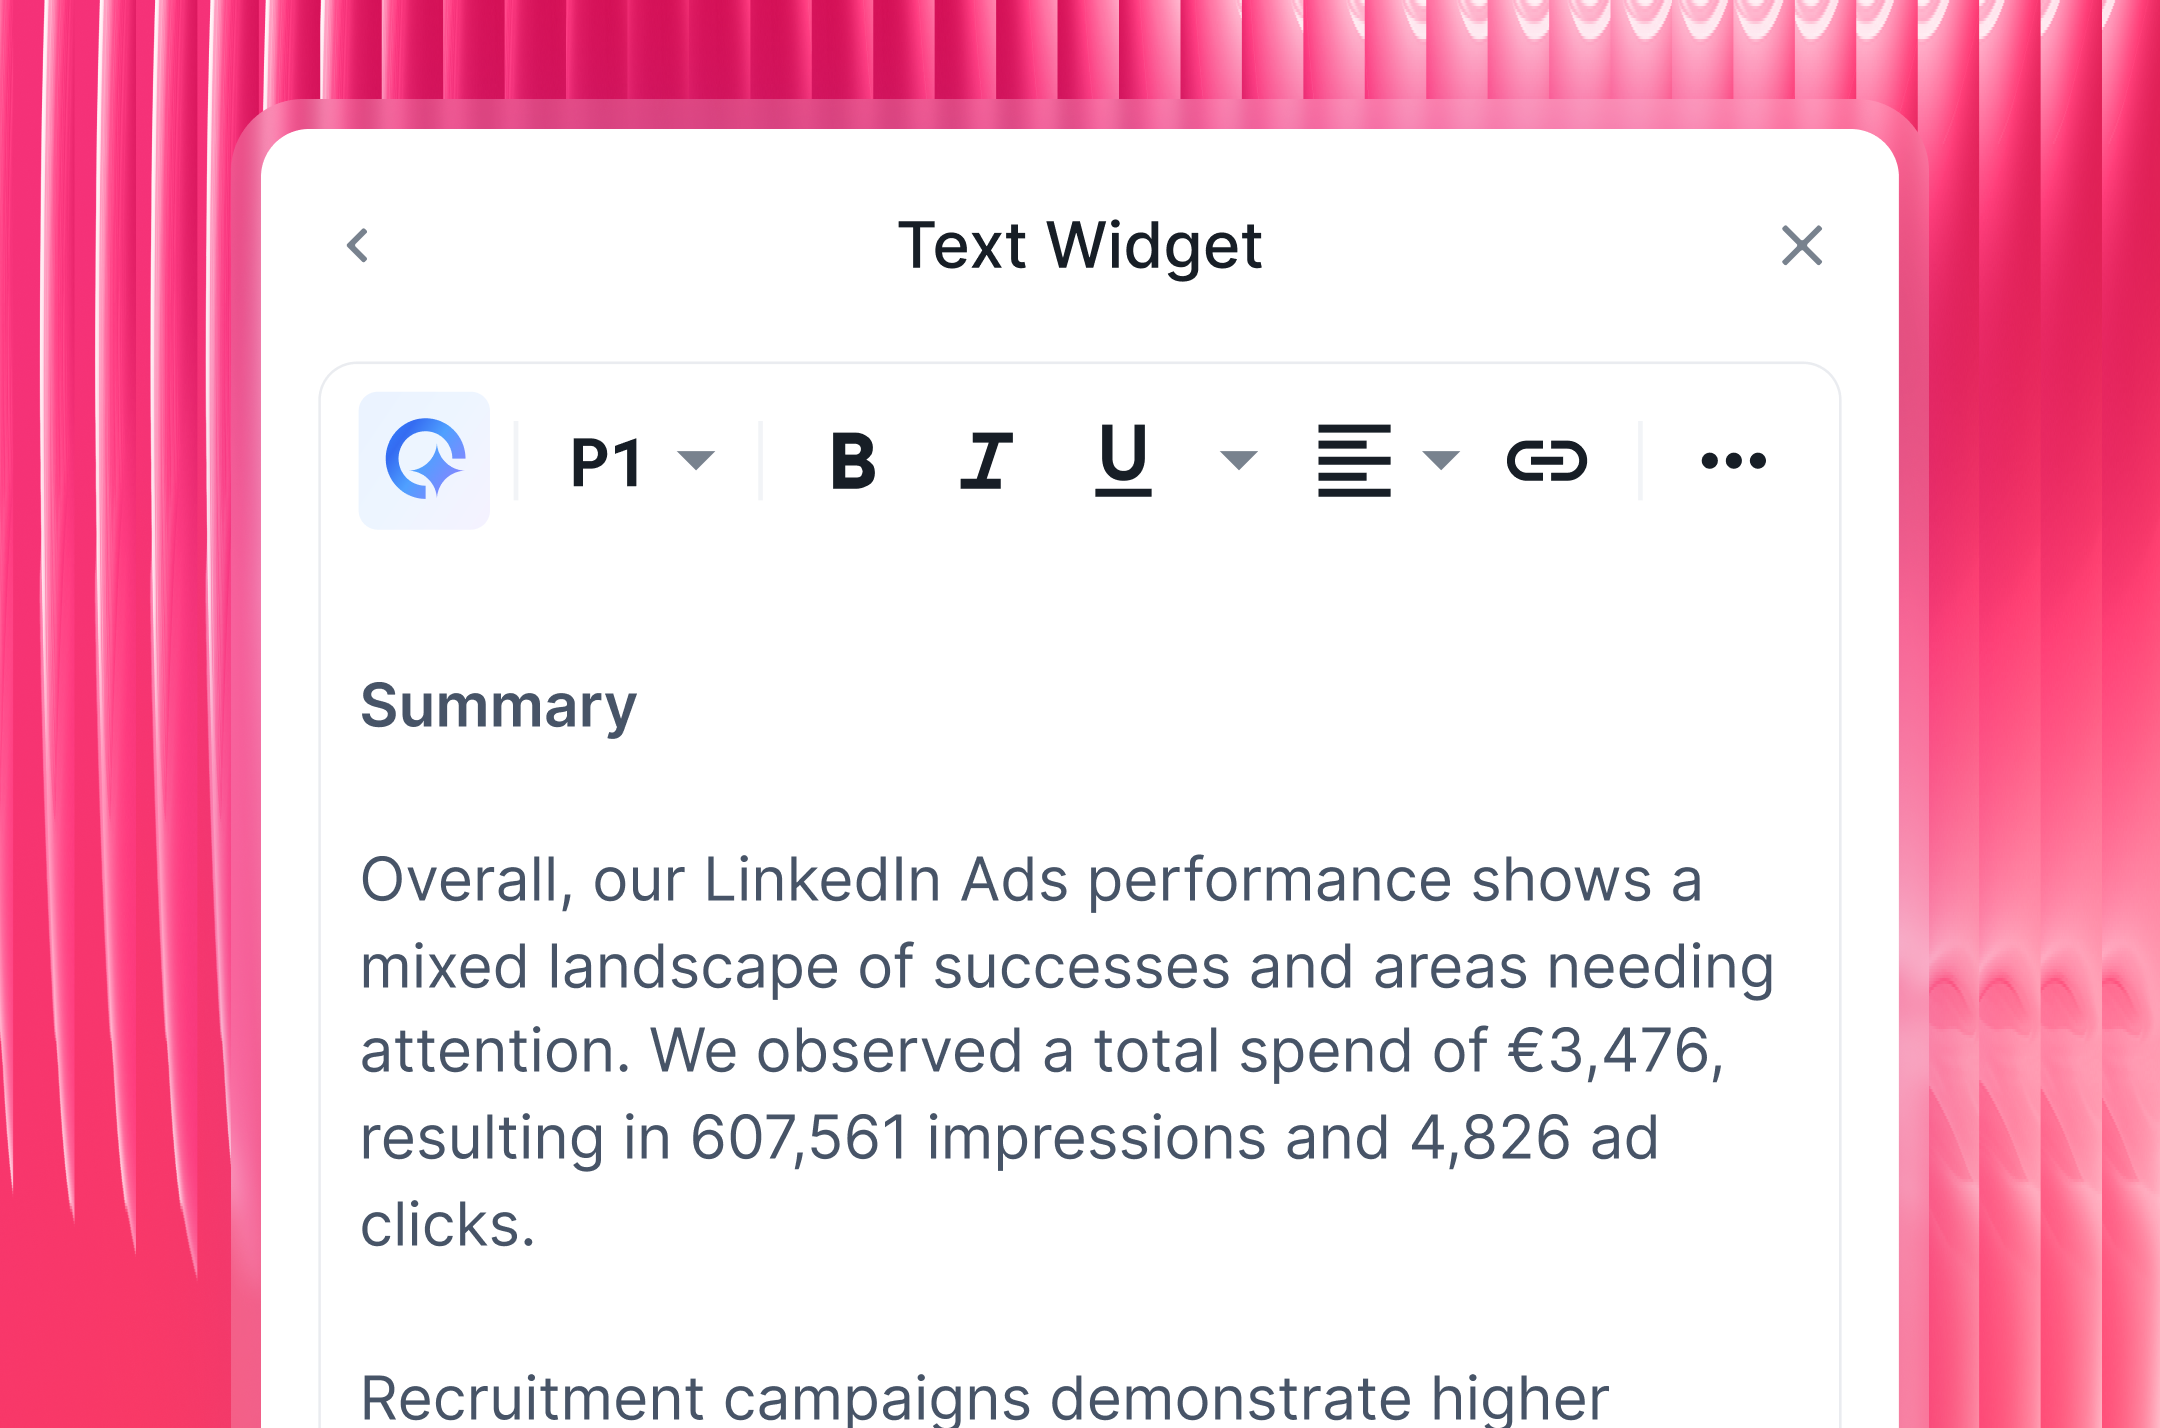
That's where Whatagraph IQ Summaries come in. IQ reads the actual data in your report and writes a plain-language performance recap you can drop straight into the client deliverable. Choose the length and tone, then edit however much - or little - you want for that human touch.
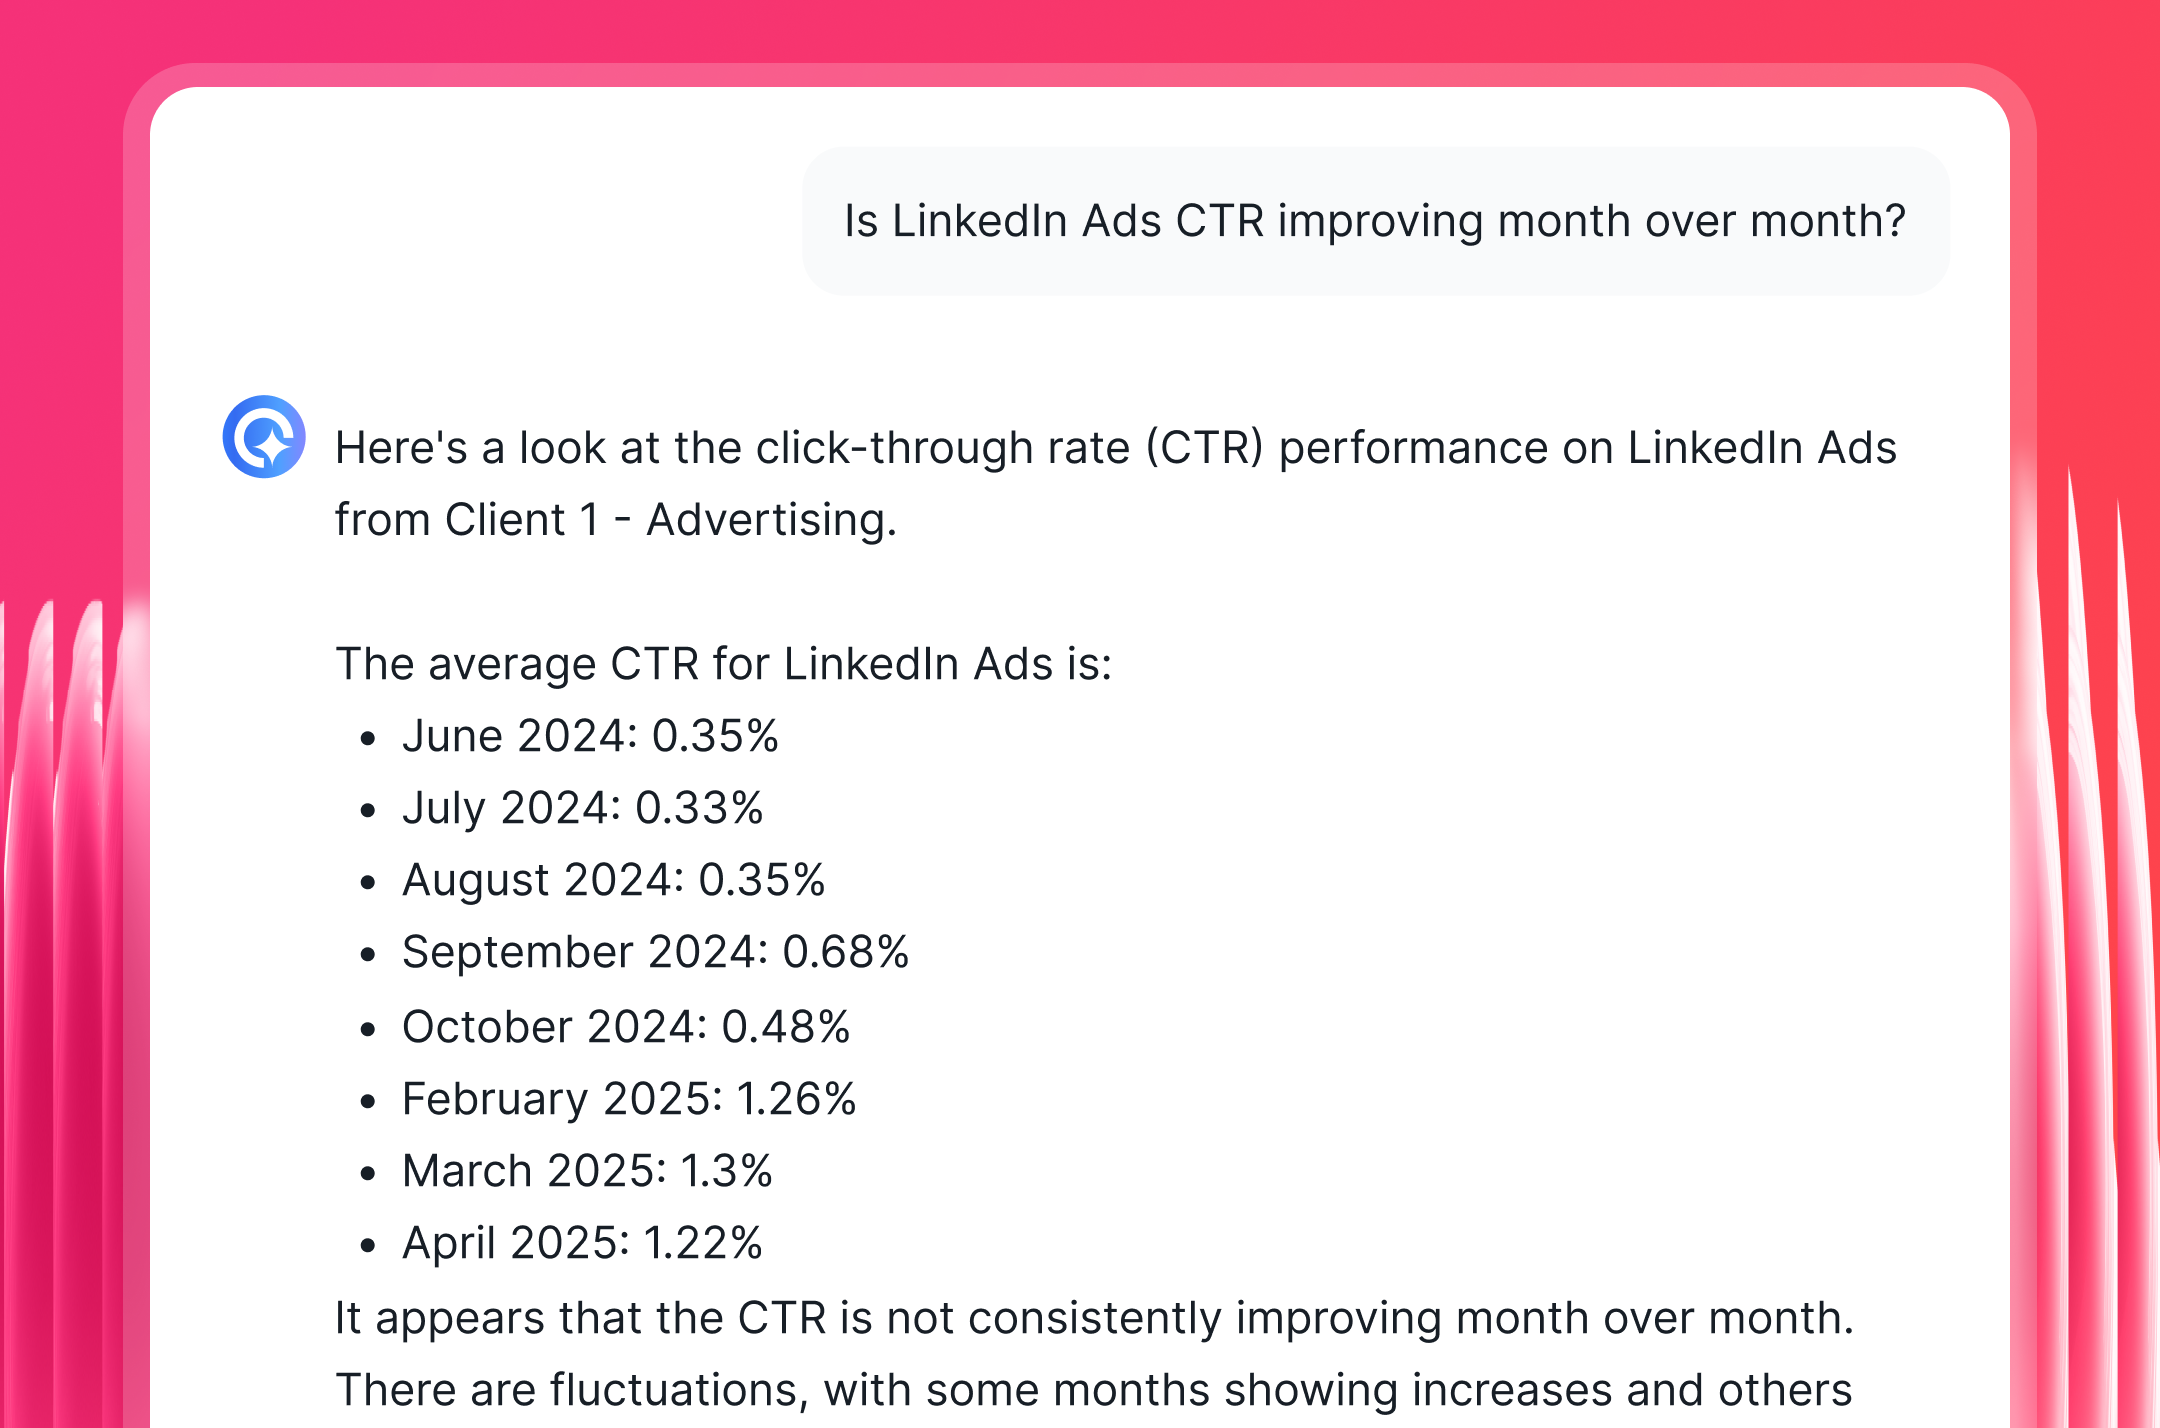
For your internal team, IQ Chat works like a data analyst sitting next to you. Ask it anything about your LinkedIn campaign data:
- "Which LinkedIn campaign had the lowest cost per lead this month?"
- "How did our lead gen form completion rate change compared to last quarter?"
- "Where should we shift the budget based on ROAS trends?"
You get a direct answer in plain English - no filters to configure, no pivot tables to build. It runs on your actual campaign data, so there are no hallucinations and no guesswork.
6. Automate report delivery to clients
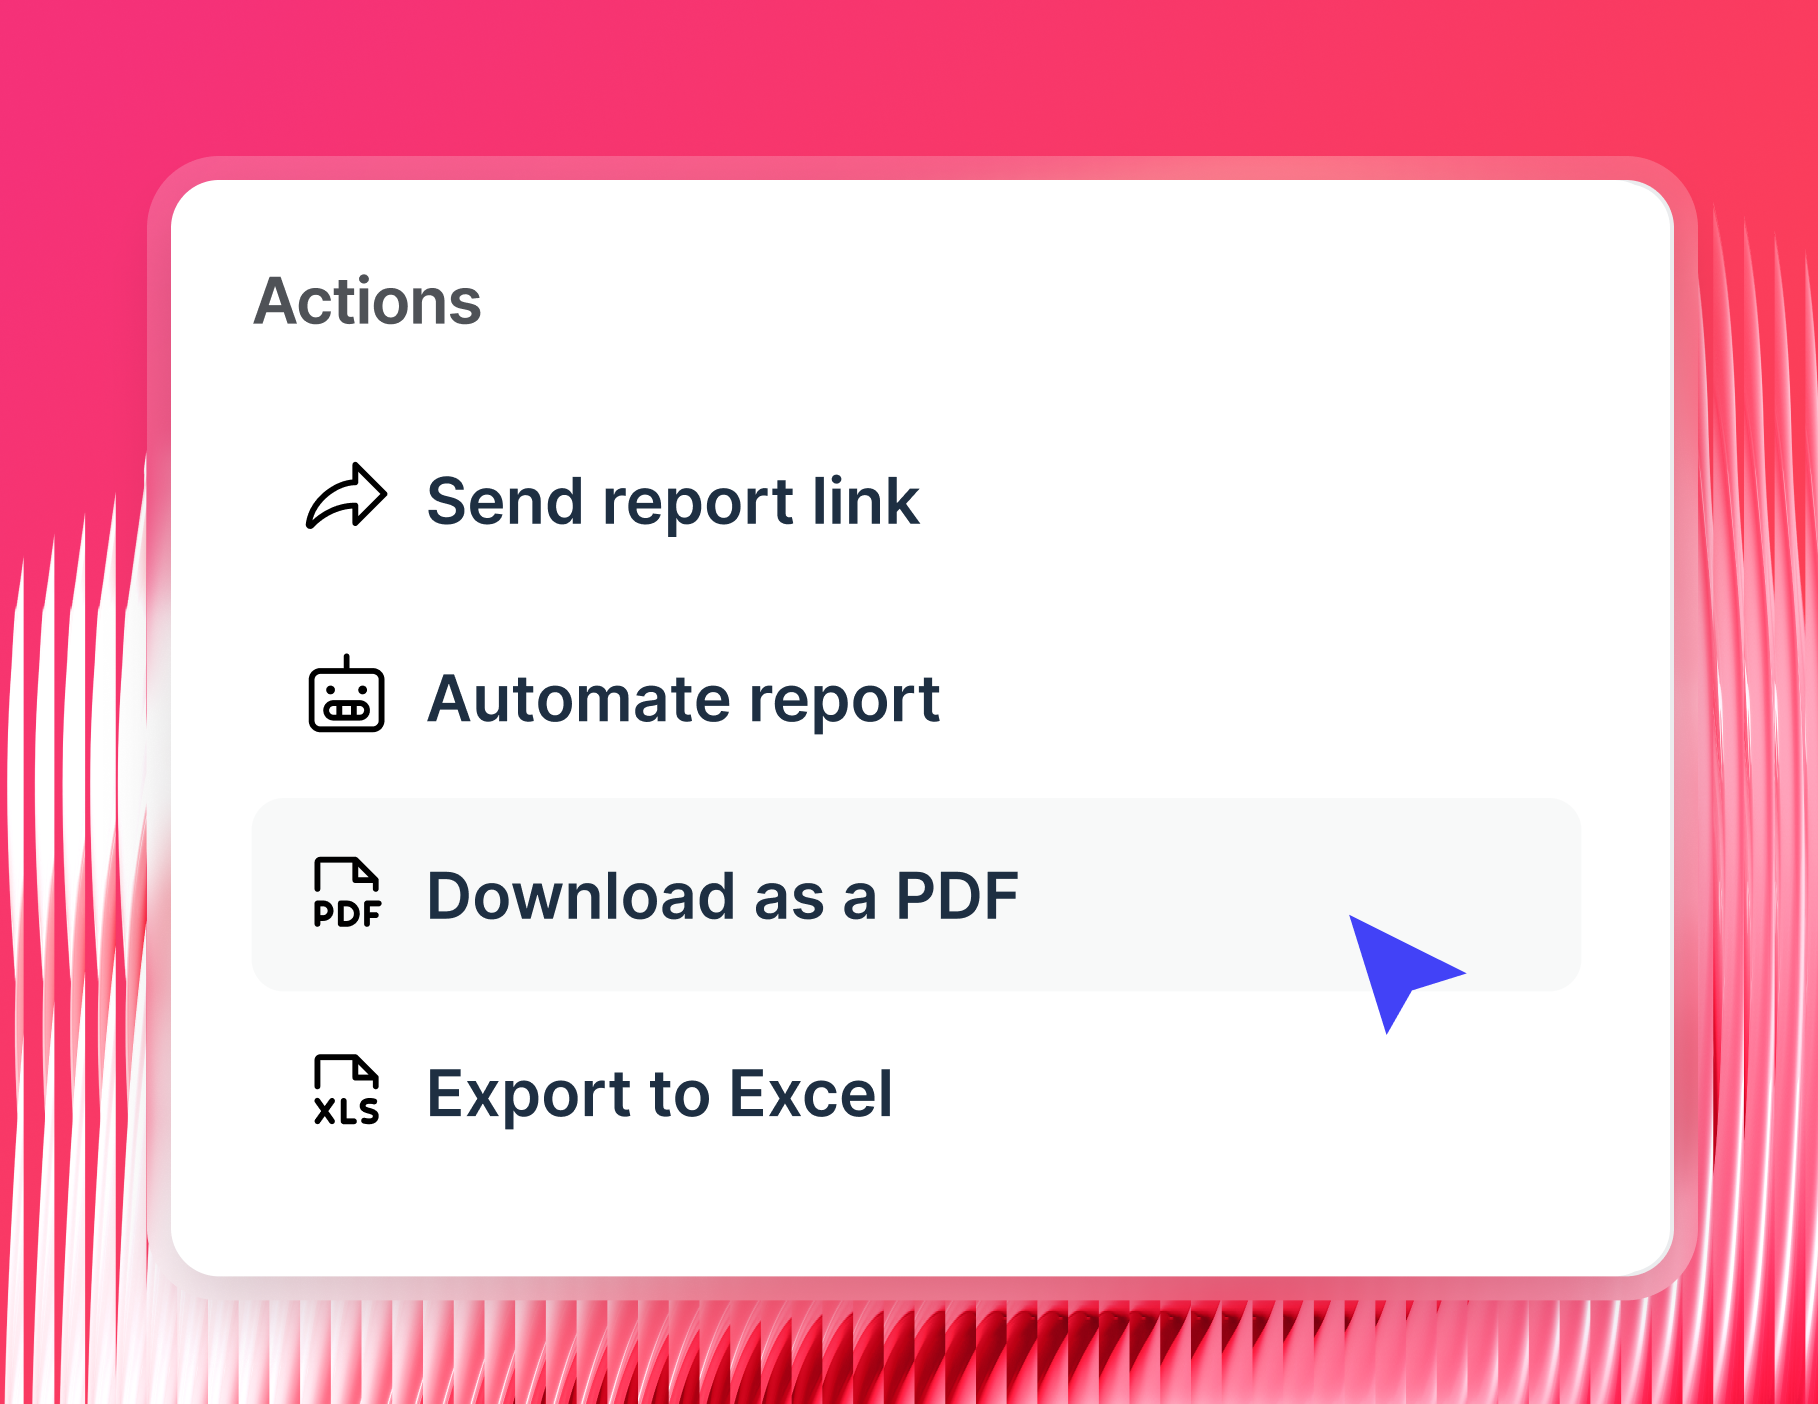
Once your report is built, set it and forget it. Whatagraph gives you full control over how and when your LinkedIn Ads reports reach clients:
- Scheduled email delivery: Send automated LinkedIn Ads reports on a fixed date, time, and cadence - weekly, monthly, or quarterly. Clients get them without you lifting a finger
- Slack notifications: Send report updates directly to a client's Slack channel on whatever schedule works for them
- Live links: Share a real-time view of the report any time - no login required for the client
- PDF or CSV exports: Download for presentations, internal archives, or offline reviews
- White-label delivery: Send from your own domain with your agency's branding on every email
You can also enable IQ Chat directly on the client-facing report, so stakeholders and clients can ask their own questions about the data - and get instant answers - without sending you a message every time.
Whatagraph’s AI cuts down the time our customers have to analyze reports. Say I send a report to a customer, but they don’t really understand it, they can just ask a question, and Whatagraph spits out answers to them right away. - Danielle Roberts, Director of Support at Rentable
What LinkedIn Ads metrics should I include in a client report?
Most LinkedIn Ads reports show too much data and explain too little. Clients end up staring at a wall of numbers with no clear story to follow.
Marc Woodland, CEO of Winbox, has a cleaner way to think about it:
LinkedIn influences buying journeys in ways traditional attribution models can't see, meaning marketers often under-credit the channel, even when it's driving real demand. To solve this, we measure LinkedIn Ads' impact this way: Reach x Relevance x Engagement = Pipeline Influence.
That framework - reach, relevance, engagement, pipeline - is exactly how the LinkedIn Ads report template co-created with Marc is structured.
Here's what Marc recommends to include in each section, and why it matters.
1. Performance summary
Before you get into the numbers, give your client the full picture at a glance.
A strong performance summary section includes:
- A goal widget showing progress against targets for the reporting period - qualified leads, total conversions, and reach against the agreed benchmark
- A performance summary list with the primary KPIs for the period: qualified leads, total conversions, conversion rate, cost per conversion, frequency, audience penetration, and reach
- A RAR report section covering self-reported attribution and manual attribution data - because LinkedIn influences pipeline in ways last-click models miss entirely
With Whatagraph IQ Summaries, you don't write this section manually.
Point IQ at the data in your report, give it a prompt like "summarize key performance wins," and it generates a plain-language recap in seconds.
Edit as much or as little as you like for tone, and add your own recommendations. Everything runs on your actual campaign data, so there are no inaccuracies.
If your report doesn't include 'what we're doing next', it's incomplete. - Alexander Mitrofanov, Senior Paid Media Specialist at Tag Worldwide
2. Reach breakdown
Reach tells you how much of the right audience actually saw your client's ads - and at what cost.
Include in this section:
- Impressions - total number of times ads were displayed
- Cost per 1,000 impressions (CPM) - the efficiency of your reach spend
- Audience penetration trend - how deeply you're reaching into the target demographic over time
- Frequency trend - how often the same person is seeing your ads, and whether you're approaching ad fatigue
Marc recommends using trend charts here to show how reach evolves over the full campaign window - not just a single period snapshot.
A 365-day bar graph of audience penetration gives clients a far more honest picture of LinkedIn's long-term brand impact than a monthly number alone.
3. Relevance breakdown
Reach gets your ad in front of people. Relevance tells you whether they actually stopped to pay attention.
This section should include:
- Average dwell time - how long people spent with the ad before scrolling past
- Video view rate - the percentage of impressions that resulted in a video view
- Average dwell time trend and video view rate trend - both visualized over time to show whether creative resonance is improving or declining
Marc uses engagement signals like dwell time and video views as leading indicators of intent - they show purchase interest before anyone has clicked or converted.
If dwell time is climbing, the audience is paying attention. If it's dropping, the creative needs a rethink.
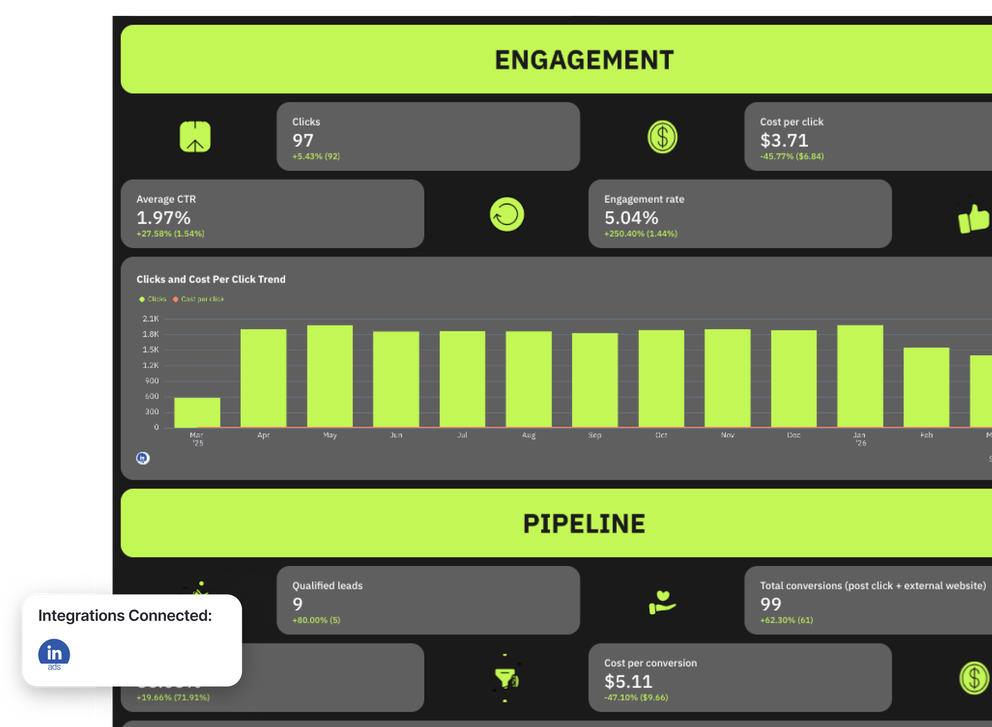
4. Engagement breakdown
Engagement metrics are where you connect attention to action.
Include:
- Clicks - total link clicks from the campaign
- Cost per click (CPC) - the cost efficiency of driving traffic
- Average CTR - click-through rate as a measure of ad relevance to the target audience
- Engagement rate - likes, comments, shares, and follows combined, relative to impressions
- Clicks and CPC trend - a combined chart showing how both metrics move together over time
For B2B clients especially, Marc recommends pairing CTR with dwell time rather than looking at either in isolation.
A low CTR combined with high dwell time often means the content is resonating but the CTA needs work. That nuance is exactly the kind of audience insight that turns a reporting call into a strategy conversation.
5. Pipeline breakdown
This is the section your client actually cares about most - and the hardest one to get right without the right tools.
Include:
- Qualified leads - lead gen form completions and other high-intent conversion events
- Total conversions - including both post-click and post-view conversions from external website actions
- Conversion rate - the percentage of clicks or impressions that resulted in a conversion
- Cost per conversion - the efficiency metric your client uses to evaluate ROI
- Qualified leads trend - a bar graph showing lead volume over the past 365 days
- Post-click and external website conversions trend - to show the full funnel impact beyond LinkedIn's own attribution
Marc's best practice here is to use a dedicated reporting tool (e.g., Whatagraph) alongside an attribution tool. LinkedIn's native attribution is last-click and misses a significant portion of the pipeline it actually influences.
6. Campaign details
Wrap up the report with a granular breakdown that your team can act on.
This section includes two key elements:
1. Campaign performance table: A row-by-row breakdown of every active campaign, showing:
- Impressions
- Qualified leads
- Average dwell time
- Engagement rate
- Cost per 1,000 impressions
- Post-click conversions
- Audience penetration
- Conversion rate
This is where you identify which targeting combinations, formats, and offers are actually driving results - and which are burning budget.
2. Top performing LinkedIn ad creatives carousel: A visual grid of your best-performing ads with thumbnail images and the key metrics for each:
- Impressions
- Qualified leads
- Post-click conversions
- Average CTR
- Cost per 1,000 impressions.
Marc recommends using a carousel chart here specifically - it makes it easy to show clients what creative is working and build a case for scaling the winning formats.